objectives introduction report sheet evaluation criteria...oxalic acid-potassium permanganate...
TRANSCRIPT


ObjectivesIntroductionExperimental Procedure & Result VideosReport SheetEvaluation Criteria
OBJECTIVES
• To study the various factors that affect the rates of chemical reactions

INTRODUCTION

EXPERIMENTAL PROCEDURE & RESULT VIDEOS
Overview
A series of qualitative experiments are conducted todetermine how various factors affect the rate of a chemicalreaction.Caution: A number of strong acids are used in the experiment. Handle withcare; do not allow them to touch the skin or clothing.
Perform the experiment with a partner. At each circlessuperscript [1-19] in the procedure, stop and record yourobservation on the Report Sheet. Discuss your observationwith your lab partner and your TA.

Part A. Nature of the Reactants
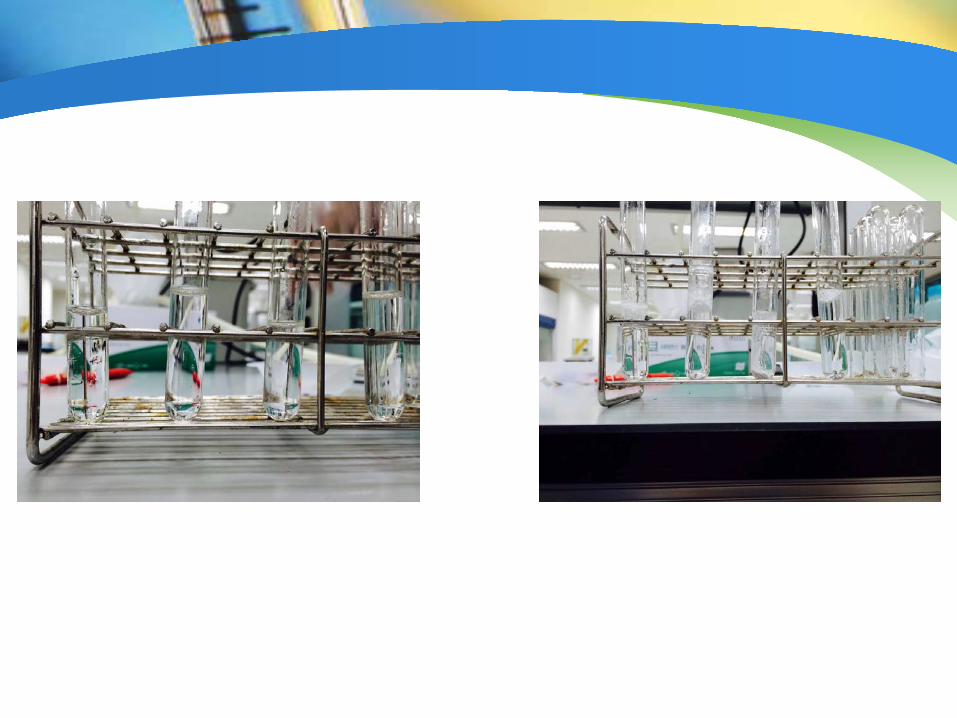
1. Different acids affect reaction rates1) Half-fill a set four labeled small test tubes (Figure 23.3) with 3 M
H2SO4, 6 M HCl, 6 M CH3COOH, and 6 M H3PO4, respectively.(Caution:Avoid skin contact with the acids)
2) Submerge a 1-cm strip of magnesium ribbon into each test tube.Compare the reaction rates and record your observations.[1]
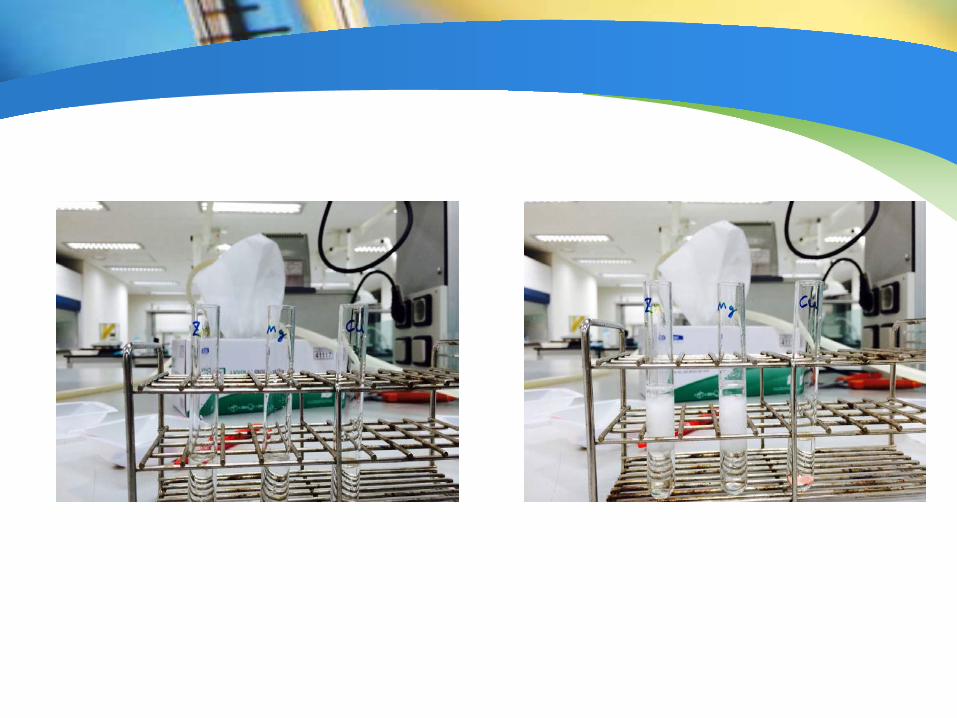
2. Different metals affect reaction rates1) Half-fill a set of three labeled small test tubes (Figure 23.4) with 6
M HCl.2) Submerge 1-cm strips of zinc, magnesium, and copper separately
into the test tubes.3) Compare the reaction rates of each metal in HCl and record your
observations.[2] Match the relative reactivity of the metals withthe photos in Figure 23.5.[3]
Part B. Temperature of the reaction: Hydrochloric Acid-Sodium Thiosulfate
Reaction System.
Ask your TA to determine if both Part B and C are to be completed. Youshould perform the experiment with a partner; as one student combines thetest solutions, the other notes the time.
The oxdidation-reduction reaction that occurs between hydrochloric acid andsodium thiosulfate, Na2S2O3, produces insoluble sulfur as a product.
2 HCl(aq) + Na2S2O3(aq) → S(s) + SO2(g) + 2 NaCl(aq) + H2O(l) (23.1)
The time required for the cloudiness of sulfur to appear is a measure of hereaction rate. Measure each volume of reactant with separate graduatedpipets.
1. Prepare the solutions.
1) Pipet 2 mL of 0.1 M Na2S2O3 into each of a set of three 150-mm,clean test tubes.
2) Into a second set of three 150-mm test tubes, pipet 2 mL of 0.1 MHCl. Label each set of test tubes.
3) Label each set of test tubes.
2. Record the time for reaction at the lower temperature
1) Place a Na2S2O3-HCl pair of test tubes in an ice water untilthermal equilibrium is established (~5 minutes).
2) Pour the HCl solution into the Na2S2O3 solution, START TIME:Agitate the mixture for several seconds, and return the reactionmixture to the ice bath.
3) STOPTIME when the cloudiness of the sulfur appears.4) Record the time lapse for the reaction and the temperature of the
bath, using all certain digits plus one uncertain digit.[4]
3. Record the time for reaction at the higher temperature
1) Place a Na2S2O3-HCl pair of test tubes in a warm water (<60oC)bath until thermal equilibrium is established (~5 minutes).
2) Pour the HCl solution into the Na2S2O3 solution, START TIME:Agitate the mixture for several seconds, and return the reactionmixture to warm water bath.
3) STOPTIME when the cloudiness of the sulfur appears.4) Record the temperature of the bath.[5]
4. Record the time for reaction at room temperature
1) Combine the remaining set of Na2S2O3-HCl test solutions at roomtemperature and proceed as in Parts B.2 and B.3.
2) Record the appropriate data.[6]
3) Repeat any of the above reactions as deemed necessary.

5. Plot the data
1) Plot temperature (y-axis) versus time (x-axis) on one-half of a sheetof linear graph paper or by using appropriate software for thethree data points.
2) Have theTA approve your graph.[7]
3) Further interpret your data as suggested on the Report Sheet.
Part C. Temperature of the reaction: Oxalic Acid-Potassium Permanganate
Reaction System.
The reaction rate for the oxidation-reduction reaction that occurs betweenoxalic acid, H2C2O4 and potassium permanganate, KMnO4, is measured byrecording the time elapsed for the (purple) color of the permanganate ion,MnO4
-, to disappear in the reaction:
5 H2C2O4(aq) + 2 KMnO4(aq) + 2 H2SO4(aq) → 10 CO2(g) + 2MnSO4(aq) + K2SO4(aq) + 8 H2O(l) (23.2)
Measure the volume of each solution with separate clean graduated pipets.As one student pours the test solutions together, the other notes the time.
1. Prepare the solutions.
1) Into a set of three, clean 150-mm test tubes, pipet 1 mL of 0.01 MKMnO4 (in 3 M H2SO4) and 4 mL of 3 M H2SO4. (Caution:KMnO4 is a strong oxidant and causes brown skin strains; H2SO4 isa sever skin irritant and is corrosive. Do not allow either chemical tomake skin contact.)
2) Into a second test set of three clean 150-mm test tubes pipet 5 mLof 0.33 M H2C2O4.
2. Record the time for reaction at room temperature
1) Select a KMnO4-H2C2O4 pair of test tubes. Pour the H2C2O4solution into the KMnO4 solution.
2) START TIME: Agitate the mixture. Record the time for the purplecolor of the permanganate ion to disappear.
3) Record room temperature using all certain digits plus one uncertaindigit.[8]
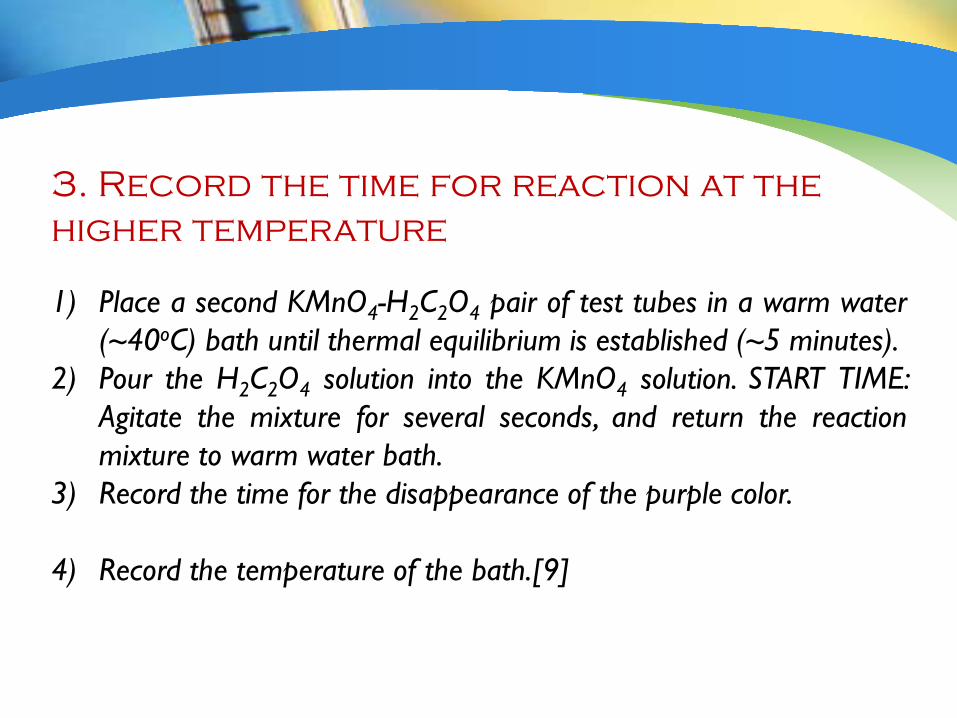
3. Record the time for reaction at the higher temperature
1) Place a second KMnO4-H2C2O4 pair of test tubes in a warm water(~40oC) bath until thermal equilibrium is established (~5 minutes).
2) Pour the H2C2O4 solution into the KMnO4 solution. START TIME:Agitate the mixture for several seconds, and return the reactionmixture to warm water bath.
3) Record the time for the disappearance of the purple color.
4) Record the temperature of the bath.[9]
4. Record the time for reaction at the highest temperature
1) Repeat Part C.3 but increase the temperature of the bath to~60oC.
2) Record the appropriate data.[10]
3) Repeat any of the preceding reactions as necessary.

5. Plot the data
1) Plot temperature (y-axis) versus time (x-axis) on one-half of a sheetof linear graph paper or by using appropriate software for thethree data points.
2) Have theTA approve your graph.[7]

PART D. Presence of a Catalyst
Hydrogen peroxide is relatively stable, but it readily decomposes in the presence of acatalyst.
1. Add a catalyst.
1) Place approximately 2 mL of a 3% H2O2 solution in a clean, small testtube.
2) Add 1 or 2 crystals of MnO2 to the solution and observe. Note itsinstability.[12]

PART E. Concentration of Reactants: Magnesium-Hydrochloric acid System
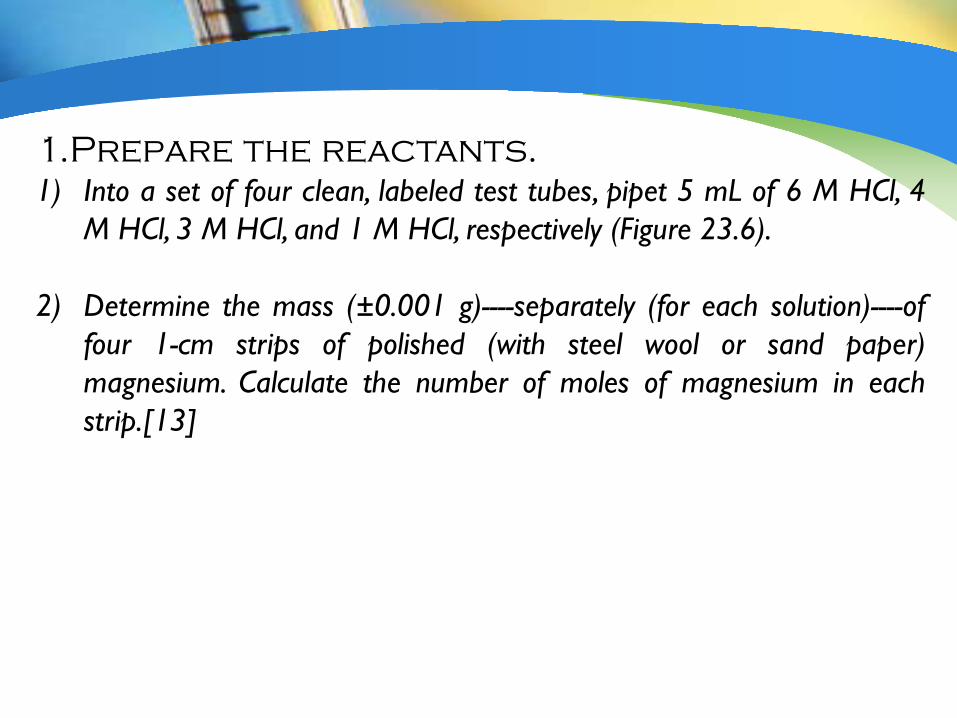
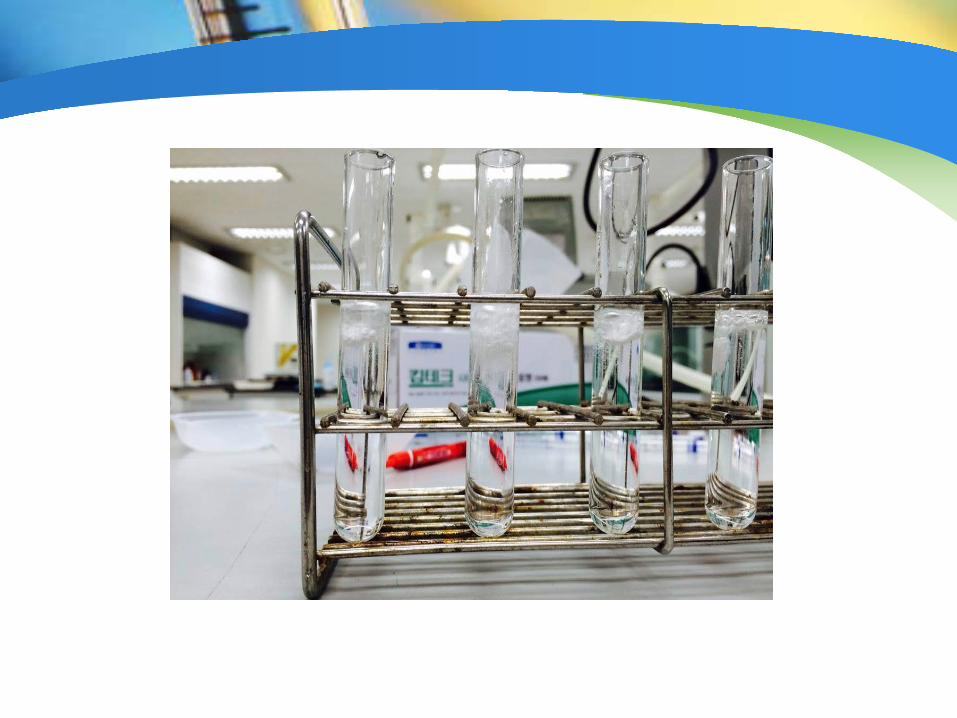
1.Prepare the reactants.1) Into a set of four clean, labeled test tubes, pipet 5 mL of 6 M HCl, 4
M HCl, 3 M HCl, and 1 M HCl, respectively (Figure 23.6).
2) Determine the mass (±0.001 g)----separately (for each solution)----offour 1-cm strips of polished (with steel wool or sand paper)magnesium. Calculate the number of moles of magnesium in eachstrip.[13]
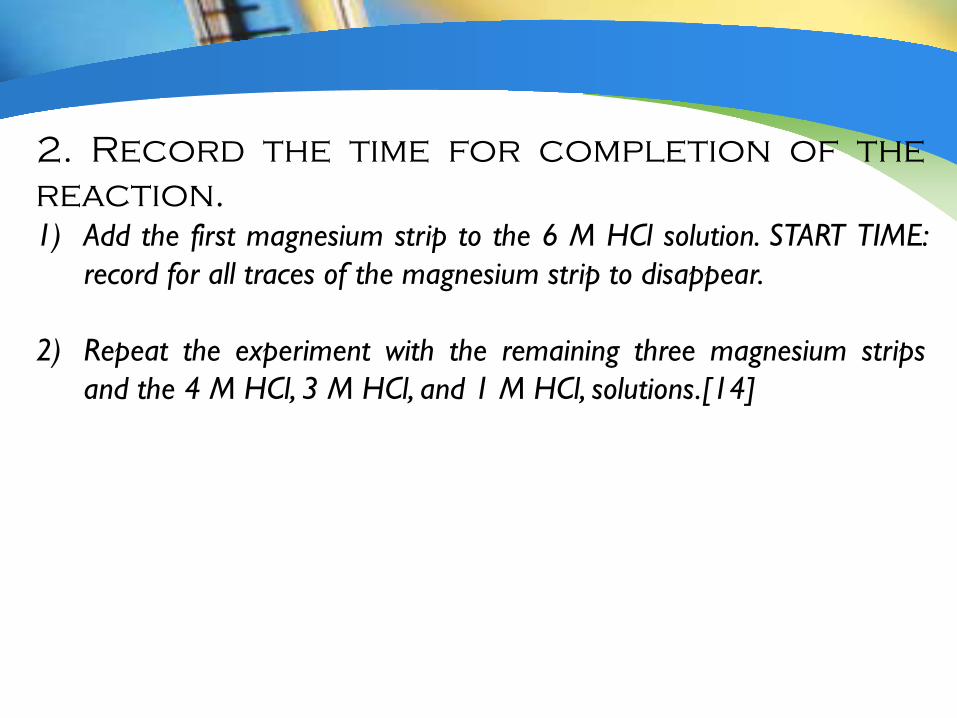
2. Record the time for completion of thereaction.1) Add the first magnesium strip to the 6 M HCl solution. START TIME:
record for all traces of the magnesium strip to disappear.
2) Repeat the experiment with the remaining three magnesium stripsand the 4 M HCl, 3 M HCl, and 1 M HCl, solutions.[14]

3. Plot the data.1) Plot (mol HCl ÷ mol Mg) (y-axis) versus time in seconds (x-axis) for
the four tests on one-half of a sheet of linear graph paper or by usingappropriate software.
2) Have theTA approve your graph.[15]

PART F. Concentration of Reactants: Iodic Acid-Sulfurous Acid System
1.Prepare the reactants.
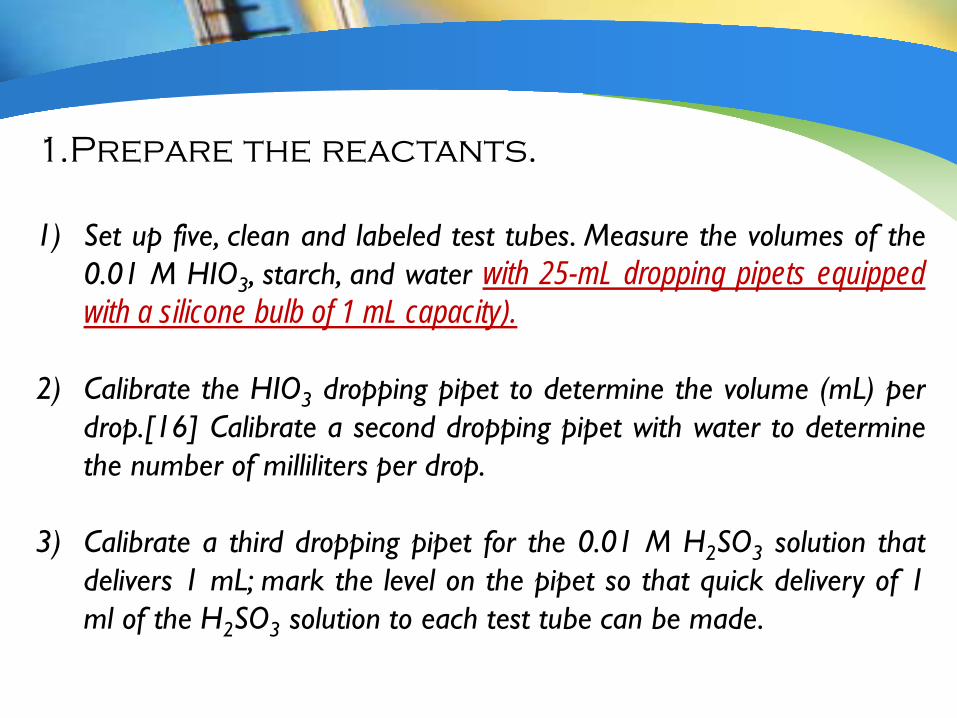
1) Set up five, clean and labeled test tubes. Measure the volumes of the0.01 M HIO3, starch, and water with 25-mL dropping pipets equippedwith a silicone bulb of 1 mL capacity).
2) Calibrate the HIO3 dropping pipet to determine the volume (mL) perdrop.[16] Calibrate a second dropping pipet with water to determinethe number of milliliters per drop.
3) Calibrate a third dropping pipet for the 0.01 M H2SO3 solution thatdelivers 1 mL; mark the level on the pipet so that quick delivery of 1ml of the H2SO3 solution to each test tube can be made.
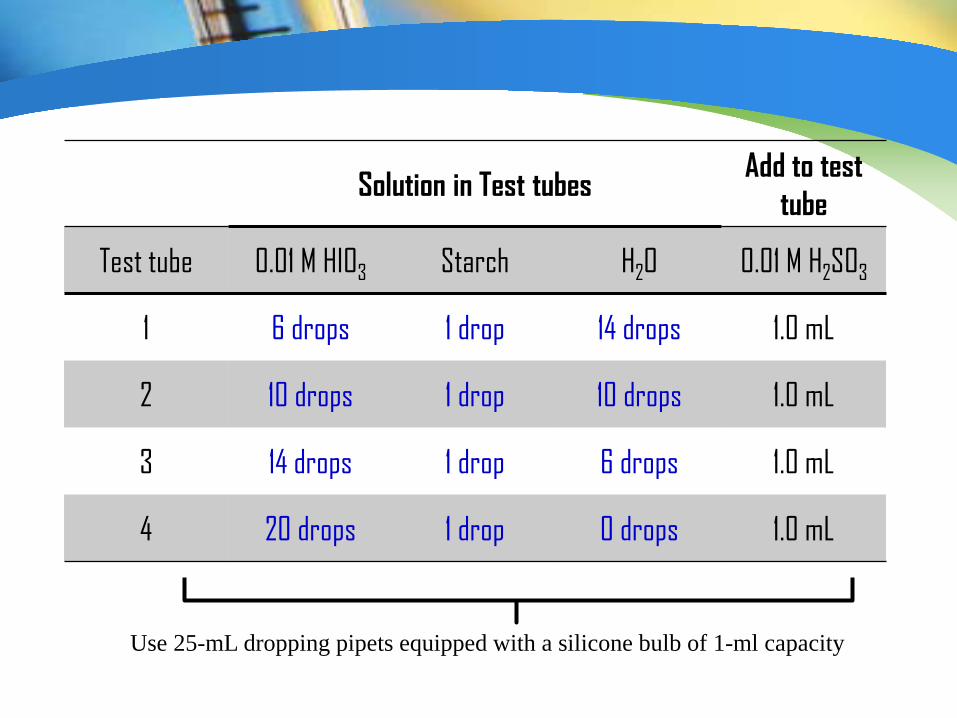
Solution in Test tubesAdd to test
tube
Test tube 0.01 M HIO3 Starch H2O 0.01 M H2SO3
1 6 drops 1 drop 14 drops 1.0 mL
2 10 drops 1 drop 10 drops 1.0 mL
3 14 drops 1 drop 6 drops 1.0 mL
4 20 drops 1 drop 0 drops 1.0 mL
Use 25-mL dropping pipets equipped with a silicone bulb of 1-ml capacity
2. Record the time for the reaction
1) Place a sheet of white paper beside the test tube. As one studentquickly transfers 1.0 mL of the 0.01 M H2SO3 to the respective testtube, the other notes the time.
2) Immediately agitate the test tube; record the time lapse (seconds) forthe deep-blue I3-•starch complex to appear. * Be ready! The appearance fthe deep-blue solution is sudden.
3. Complete remaining reactions
1) Repeat PART F.2. for the remaining reaction mixtures in Table 23.1.Repeat any of the trials as necessary.[18]
4. Plot the data.
1) One one-half of a sheet of linear graph paper or by using appropriatesoftware, plot for each solution the initial concentration of iodic acid,[HIO3]0 (y-axis), versus the time in seconds (x-axis) for thereaction.[19] * Remember that in calculating [HIO3]0, the total volume of the solution is thesum of the volumes of the two solutions expressed in liters.

CleanupRinse the test tubes twice with tap water anddiscard each into the Waste Inorganic TestSolutions container. Two final rinses withdistilled water can be discarded in the sink.
Disposal: Dispose of all test solutions in theWaste Inorganic Test Solutions container.

REPORT SHEET
EVALUATION CRITERIA Pre-lab assignment (40 points)
- Summary: Theory (10 pts) and Procedure (10 pts)- Pre-laboratory question (20 pts) Lab Report (40 pts) Post-lab assignment: Laboratory Questions (20 pts)