obscure objects of media studies: echo, hotbird and … · obscure objects of media studies: echo,...
TRANSCRIPT

1
Obscure Objects of Media Studies: Echo, Hotbird and Ikonos By: Lisa Parks
To be obscure is to be faintly perceptible so as to lack clear definition, to be hidden, out
of sight, not readily noticed or seen, inconspicuous, far from centers of the human
population. The satellite has been a relatively obscure object of media studies, but it is
not alone. As Amelie Hastie points out, many objects—from the ticket stub to the powder
puff, from the videocassette case to the antenna tree—that are overlooked in media
studies could be used to expand the field in productive ways. As Hastie explains, “…An
emphasis on objects and material forms in relation to representational and time-based
media might enable a delineation of the social and economic circuits of exchange in
which we — and visual culture, in its various forms — participate.”i Here, rather than
adopt an object-oriented disciplinary approach and insist that there should be a field of
satellite studies just as we have cinema, radio, television, and cyber-studies, I’ll follow
the suggestion of Siegfried Zielinski–that media not only have complex relational
histories, but can be understood as entr’acts or in-between phases in a much deeper
history of audio-visions. Like film and television, the satellite could be treated as part of
an integrated history of media, as a dispositif –an arrangement of audio-visions
interwoven with other media, architecture, transportation, science and technology, the
organization of work and time, philosophical propositions and so on.ii
While a long-term goal may be to treat the satellite as a dispositif, the simple goal
of this essay is to attempt to make the satellite less obscure in media studies by offering
descriptive sketches of three satellites—Echo, Hotbird, Ikonos—and discussing possible
modes of critical engagement with each of them. In the process I hope to make three
2
points. First, I want to suggest that since the field of media studies is so integrally bound
up with, even contingent upon, processes of audiovisual perception, it might be useful to
explore the opaque and imperceptible so that our historical and critical projects are not
totally circumscribed by that which is visible and audible. Is it possible in media studies
to develop a critical sensitivity to the obscure as we have to the spectacular? Second, I
hope to suggest that by thinking about the processes and exchanges that occur in the
space between earth and orbit that we might begin to imagine media morphologies that
exceed the screen, the network, and the nation, terms that seem to have settled as implicit
figurations (and unquestioned foundations) in the field of media studies. What terms can
we use to describe the signal transactions that occur beyond the ionosphere and yet that
are fundamental to media cultures on earth? Finally, I hope to suggest that there is a need
for materialist histories of satellite technologies and that conducting such work involves
taking distribution seriously as a site of media history and criticism. Why is it that we
know the names of broadcast networks, major web portals, syndication companies, but

3
we don’t know the names of satellites?
[INSERT Fig1] Echo
Echo was an experimental satellite launched on August 12, 1960. Developed by
Bell Telephone labs in association with NASA, it was a passive, mirror or reflector
satellite as opposed to an active/repeater. This means that it had the capacity to relay
signals but not to store them. When Echo reached orbit, 1000 miles about the earth, the
4
satellite inflated into a balloon 100 feet in diameter and encircled the earth every two
hours. Its reflective mylar surface made it appear brighter in the sky than the north star.
On August 14, 1960, during the 21st pass of the satellite, Bell Lab scientists transmitted a
recording of the song “America the Beautiful” to the Goldstone facility in California. The
story of the so-called “transcontinental melody” made front-page headlines and was
documented in a Bell Labs film called The Big Bounce (1960).iii During the 22nd pass, a
“double bounce” experiment relayed a recorded message from Stump Neck, Maryland to
Holmdel, New Jersey and then on to Goldstone, CA. On August 18, 1960, Bell Labs sent
a message to the Centre National d’Etudes de Telecommunication station at Issy les
Maulineaux, France using Echo. And on Aug 19, 1960, technicians working for Collins
Radio in Iowa used Echo to transmit an Associated Press picture of President Eisenhower
from Cedar Rapids, Iowa to Richardson, Texas.iv These early signal exchanges marked
the beginning of regularized satellite transmissions.
In addition to being used for inter and trans-continental audiovisual relays, Echo
itself became an international spectacle. Donald Elder reports in his technical history of
Echo that during an international trade fair in Damascus, Syria, fair guides stopped their
lectures and led audiences to watch Echo in the sky when it passed overhead. In Kabul,
Afghanistan, King Mohammed Zahir brought an entourage of seven hundred people with
him to view an exhibition about Echo.v The USIA supplied over two hundred of its
overseas posts with a program called “Echo in Space,” narrated in over thirty languages.
The show appeared in theaters and on television, and the USIA deployed mobile field
units to distribute the film into villages and remote areas. The USIA also worked out an
arrangement to record the messages of foreign diplomats relayed on Echo and then
5
distribute them for broadcast on Voice of America. Radio listeners in fifteen nations
heard the messages.
Echo not only relayed audiovisual signals, but activated a field of relations
between earth and orbit. The very installation of Echo in outer space altered practices
taking place on the surface of the earth as people tried to spot it, up and downlink with it,
and generate discourse about it. These circuits of exchange, however, are largely
imperceptible. Moreover, it is difficult to access recordings of early satellite
transmissions since only some have been preserved. In this sense, early satellite relays
share more in common with theatrical performance or turn of the century wireless
experiments in that they are ephemeral forms of culture that move through and vanish in
the air, as opposed to being part of a culture of mechanical reproduction.vi What we can
attempt to reconstruct, however, are the vectors of signal distribution—the lines, paths
and directions of satellite use.
What I am proposing is an approach to the study of satellites that would embed
the obscure processes of signal distribution within cartographic fields of representation as
a way of beginning to provide a sense of the material histories of satellites. What places
did signals originate from? Which satellites did those signals traverse? Where did those
signals end up? It might seem like an impossible task to recover and represent such signal
histories, but attempting to do so on even a limited scale may provide a more concrete
sense of the dynamic field between earth and orbit.
6
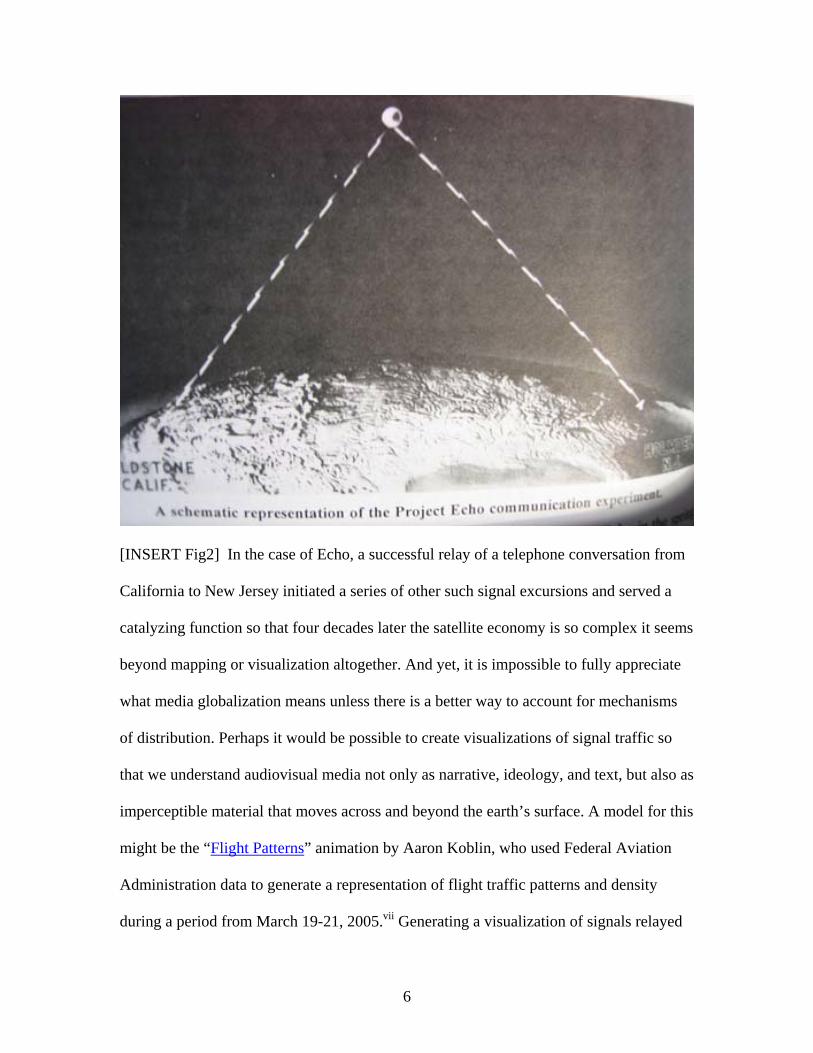
[INSERT Fig2] In the case of Echo, a successful relay of a telephone conversation from
California to New Jersey initiated a series of other such signal excursions and served a
catalyzing function so that four decades later the satellite economy is so complex it seems
beyond mapping or visualization altogether. And yet, it is impossible to fully appreciate
what media globalization means unless there is a better way to account for mechanisms
of distribution. Perhaps it would be possible to create visualizations of signal traffic so
that we understand audiovisual media not only as narrative, ideology, and text, but also as
imperceptible material that moves across and beyond the earth’s surface. A model for this
might be the “Flight Patterns” animation by Aaron Koblin, who used Federal Aviation
Administration data to generate a representation of flight traffic patterns and density
during a period from March 19-21, 2005.vii Generating a visualization of signals relayed

7
via Echo might be a good place to start. Since it was one of the first experimental
satellites it had relatively limited use and would thus be simple to map.
[INSERT Fig3] Hotbird While Echo was an early experimental satellite that reflected signals from one point to
another, Hotbird is a fleet of commercial communications satellites owned by the French
company, Eutelsat. In 2006, Eutelsat transmitted more than 1500 television channels to
120 million homes.viii The company uses twenty-three satellites to serve more than 150
countries, and specializes in coverage over Europe, North Africa, and the Middle East.
The satellites in the Hotbird fleet are lined up at thirteen degrees east which the company
claims is “Europe’s most sought after orbital position.”ix By lining satellites up in the
same orbital location, Eutelsat is able to capitalize upon this position and maximize its

8
capacity by assembling a neighborhood or cluster of satellites and assert long-term
ownership over this address. Though the satellites occupy the same orbital position, they
have different launch histories and manufacturers. For instance, Hotbird 1 was launched
on March 28, 1995 by the Ariane IV rocket from a launching base in French Guiana and
was manufactured by Alcatel Space Industries. Hotbird 2 was launched on November 21,
1996 and was manufactured by Matra Marconi. Hotbird 3, manufactured by a UK
company called Matra Marconi, was launched on September 2, 1997 by the Ariane V99
rocket. Hotbird 8, the most powerful broadcast satellite serving Europe, was launched on
May 8, 2006 and was manufactured by EADS Astrium. The Hotbird footprints cover
Europe and North Africa and extend as far east as Moscow and Dubai.
In addition to mapping signal distribution, it is possible to examine footprints to
determine the geographic boundary in which a signal from a given satellite can be
received.
[INSERT Fig4] These footprint maps serve as starting points for understanding how
9
satellite broadcasting turns continents into signal territories. In other words, the satellite
footprint is not just an inert technical boundary; it is a transnational trade route, a
technological zone, a site of cultural atmospherics, and a corporate claim to orbital,
spectral, and geophysical property. While these maps hint at broader power relations,
they are ultimately insufficient in that they tell us little about material conditions within
the footprint boundary. They do not, for instance, provide information about the signals
circulated within them. To understand the satellite’s role in the global media economy, it
is important to examine carriage lists, which are available at lyngsat.com. This website
provides listings of communications satellites, the signals they carry, and the companies
that generate them. In 2006 the Hotbird’s carriage chart was thirty pages long and
identified hundreds of radio and television signals located on different transponders,
encrypted with different codes, and beamed into Hotbird footprints using different
frequencies. Signals carried by the Hotbird fleet are either downlinked directly by
satellite television viewers or by cable providers who bundle and distribute them to
subscribers. These carriage lists are important guides for media studies; they provide a
slice of the global media landscape by specifying which radio and television signals are
circulated where in the world. Have you heard of or seen Iranian Cinema Channel, Baby
TV, Viva Polska, Al Hayat, Jolly, Arabesque, Sex Gay TV, Tamil TV Network,
Hallmark Channel Turkey, Croatian Music Channel, Pink Plus, or Public TV of
Armenia?
The prospect of mapping signal distribution via satellite becomes even more
daunting, then, if we consider a contemporary satellite fleet such as Hotbird, which in
January 2006 carried 445 radio and 706 television signals from more than thirty-four
10
countries. What would the map look like? The vectors of signal distribution would be so
complex and unwieldy that they might evoke new morphologies that would shift our
thinking beyond linear distribution models and toward a theory of cultural atmospherics,
media fogs, or as mentioned earlier, signal territories. As Charles Acland suggests in his
book Screen Traffic, “When concentrating on the present phase of globalization, the
conventional definitions of the borders of social phenomena-nations, populations,
ethnicities, countries, and so on—become ever more elusive; new and unforeseen
organizations of social categories appear.”x Given the globalization of signals, it seems
clear that we need new categories for media as well. Studying signals transmitted via
satellite would require shifting some critical attention beyond the screen, the theater, the
home, the studio, or the nation and beginning to invent categories derived from the
patterns of signal distribution. Such a project may share more in common with the flow
studies funded by UNESCO during the 1960s and 1970s, which were conducted in the
interest of understanding the uneven circulation of television programming on a global
scale. As Mimi White explains, “the number and range of programs imported and
exported around the world were counted by nation-state in an effort to quantitatively map
the ways global power and influence are unevenly distributed.”xi Rather than quantify
signals to confirm Western hegemony in the global media marketplace (which is
something we already know), I am interested in finding ways to visualize signal densities
and vanishing points, concentrations and dispersals, and arrivals and departures. What I
am proposing is kind of footprint analysis or a mapping or visualization of distribution
that would help to clarify the satellite’s relationship to world trade, geography and
history.

11
[INSERT Fig5]
In part to explore this possibility, in 2005 I worked with a cartographer to develop
a map of the satellites used by broadcasters from the new states of the former Yugoslavia.
Before the break up of Yugoslavia, only one satellite was used by the Yugoslav
Television to distribute six hours of programming per day to Europe and North America.
After the war ended in 1995, the media sectors of new states were privatized, and by
2005 there were five public and fifteen commercial broadcasters in the region using
fifteen different satellites to send their signals around the world. The fifteen satellites
(Hotbird 2, 3, 4, and 6 among them) are owned by nine different companies, which have
their financial and operational headquarters outside of the region. The map identifies the
names of broadcasters, the satellites they used, the location of their footprints, and the
companies that own the satellites. It was designed to specify the players, ownership, and
cartographies of the regional satellite economy.
Ikonos
Thus far I have discussed an experimental satellite and a fleet of communications
satellites used for television distribution and suggested the need for visualizations of
signal distribution and footprint analysis. In this last section, I discuss a privately-owned,
remote sensing satellite called Ikonos (named after the Greek word for image), launched
on September 24, 1999 by Athena II rocket from Vandenburg Air Force Base in
California. Unlike Hotbird, which occupies a geosynchronous orbital position, this
satellite moves in a low earth orbit. It was manufactured by Lockheed Martin with

12
investments from companies such as Raytheon, Mitsubishi (Japan), Van Der Horst
(Singapore), Hyundai Space and Aircraft (Korea), Europe’s Remote Sensing Affiliates,
Swedish Space Corp., and Loxley Public Company (Thailand). During its first several
years, Ikonos was operated by a corporation called Space Imaging, which, in early 2006,
merged with Orbimage to form Geoeye, which is now the largest commercial satellite
imaging company in the world.xii I don’t have time here to discuss the history of the
remote sensing industry, but I want to suggest that the high resolution satellite image—
now exchanged openly in a global economy— represents the possibility for making the
satellite less obscure both in public culture and media studies.
Since its installation in 1999, Ikonos has been programmed to acquire image data
over many parts of the planet. There now exist blockbuster satellite images, just like there
are blockbuster films and hit television series. The Ikonos image gallery includes annual
top ten lists, and special feature sections on a host of disasters including the 9/11 attacks
on the World Trade Center and the Pentagon, operation Enduring Freedom in
Afghanistan, the tsunami in Southeast Asia, the Pakistan and Kashmir earthquakes, and
Hurricanes Katrina and Rita.xiii The circulation of such satellite images cannot be
separated from a U.S.-dominated global media economy that selects and foregrounds a
handful of events as newsworthy, spectacular and profitable and ignores most events in
the world. Ikonos images have been used to reinforce already existing psychic and capital
investments in particular world events and as such have a way of focalizing the mediated
production of world history.
If there is any doubt about the intersection of satellite imaging and film and media
studies, we could consider some more literal intersections. For instance a 2001 animation

13
featured in the NASA Scientific Visualization Studio made out of “mosaic-ed” Ikonos,
Terra and Landsat images take us directly from an orbital position to one hovering over
the Hollywood sign.xiv The sequence implies that the remote sensing satellite 423 miles
above the earth offers a meta-perspective that exceeds the visualizing potential of even
Hollywood’s.

14
[INSERT Fig6 and Fig7] Or consider the use of Ikonos images to expose the location of
CBS facilities during the production of Survivor: Africa in Kenya’s Shaba National
Reserve in August 2001.xv Dan Bollinger, a fan from Layfayette, Indiana, sent a request
to Space Imaging to acquire the image data over Kenya, and after spotting the CBS
facilities, Space Imaging executives waived their “special mission” fee of $3500 because
they felt this would be good publicity for Ikonos.xvi Rather that simply reveal a
Hollywood production site, satellite images could be used to examine the environmental
and economic effects of Hollywood’s on-location productions around the world, whether
with The Beach in Thailand, Titanic in Mexico or Survivor in Kenya. Maybe the meta, or
15
panoptic perspective of Ikonos isn’t as daunting when it exposes what Hollywood studios
have been up to in other countries’ coastlines or national parks.
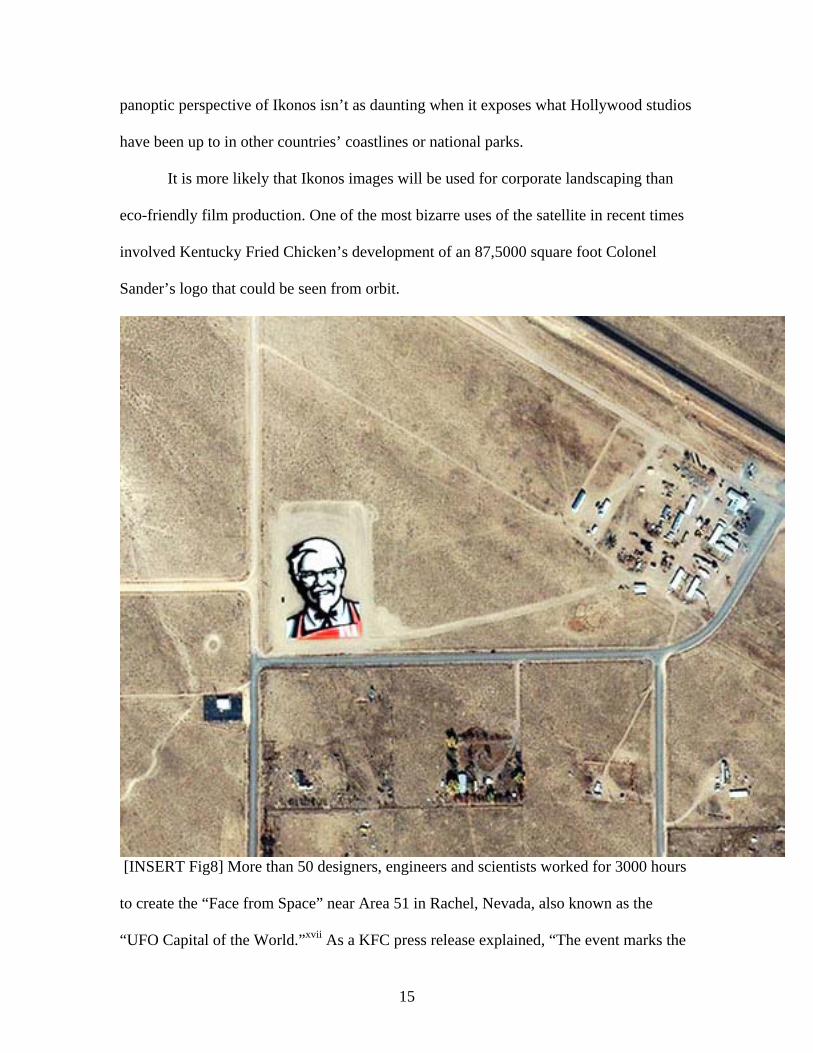
It is more likely that Ikonos images will be used for corporate landscaping than
eco-friendly film production. One of the most bizarre uses of the satellite in recent times
involved Kentucky Fried Chicken’s development of an 87,5000 square foot Colonel
Sander’s logo that could be seen from orbit.
[INSERT Fig8] More than 50 designers, engineers and scientists worked for 3000 hours
to create the “Face from Space” near Area 51 in Rachel, Nevada, also known as the
“UFO Capital of the World.”xvii As a KFC press release explained, “The event marks the

16
official debut of a global re-image campaign that will contemporize 14,000-plus KFC
restaurants in over 80 countries over the next few years.”xviii KFC purchased an Ikonos
image of the site and distributed it through global media circuits to address its 4.5 billion
customers worldwide including those in emerging markets of India, Russia and Brazil.xix
While satellites have historically passed over the earth to observe “naturally unfolding”
phenomena, now events are staged precisely so they can be viewed from an orbital
perspective. Whether we call this corporate landscaping or orbital marketing, remote
sensing satellites are now being used to pitch products and address global consumers just
as other media such as commercial television or the world wide web.
If there is any recent development, however, that makes us reflect upon the
obscurity or presence of satellites in our media culture, it may be Google Earth.
[INSERT Fig9] This web application, which builds upon past initiatives such as Al
Gore’s Digital Earth Projectxx of the 1990s, emerged in 2005 and has since generated a
vibrant community of users from geographers to businesspeople to artists. Scholars

17
across fields are also using and writing about this application from an array of
perspectives. What I want to address here, however, is the fact that Google Earth tends to
efface information about satellites at its interface. In the basic version of Google Earth,
there is no information about the satellites that acquire the image data used to construct
the world as a navigable digital domain. Google Earth announces on its website that the
information comes from a variety of sources and is “mosaic’ed” together and “a single
city may have imagery taken from different months.”xxi On another page in response to
the question “When were these pictures taken?” the company explains, “Our photographs
are taken by satellites or aircraft sometime in the last three years.”xxii With such vague
responses, unfortunately a web application with great potential to inform large numbers
of users about satellites such as Ikonos ends up keeping them in the dark.
We can get a better sense of the difference it makes to have satellite image details
by examining the layer of Digital Globe, the only company that provides date information
for satellite images that are part of Google Earth.

18
[INSERT Fig10] When the user activates the Digital Globe layer, color-coded squares
and “I” icons appear in the visual field. Clicking on an “I” opens a frame with data about
the image including the acquisition date, cloud cover, and an environmental quality
rating. The satellite name is not provided, but it was likely acquired by Digital Globe’s
Quickbird satellite.
19
[INSERT Figure 11] If the user clicks on “preview,” she enters a meta-browser featuring
the single satellite image captioned with information about how to purchase it or others
from Digital Globe.
Clearly, Digital Globe is providing date information (when other companies are
not) as part of a marketing strategy. When the user activates the layer, Digital Globe and
its product stand out in bold relief amongst a sea of unidentified and undifferentiated
satellite image data. In a sense, there is scant difference between this strategy and the
KFC ad in that both corporations use satellites to turn plots of earth into giant billboards.
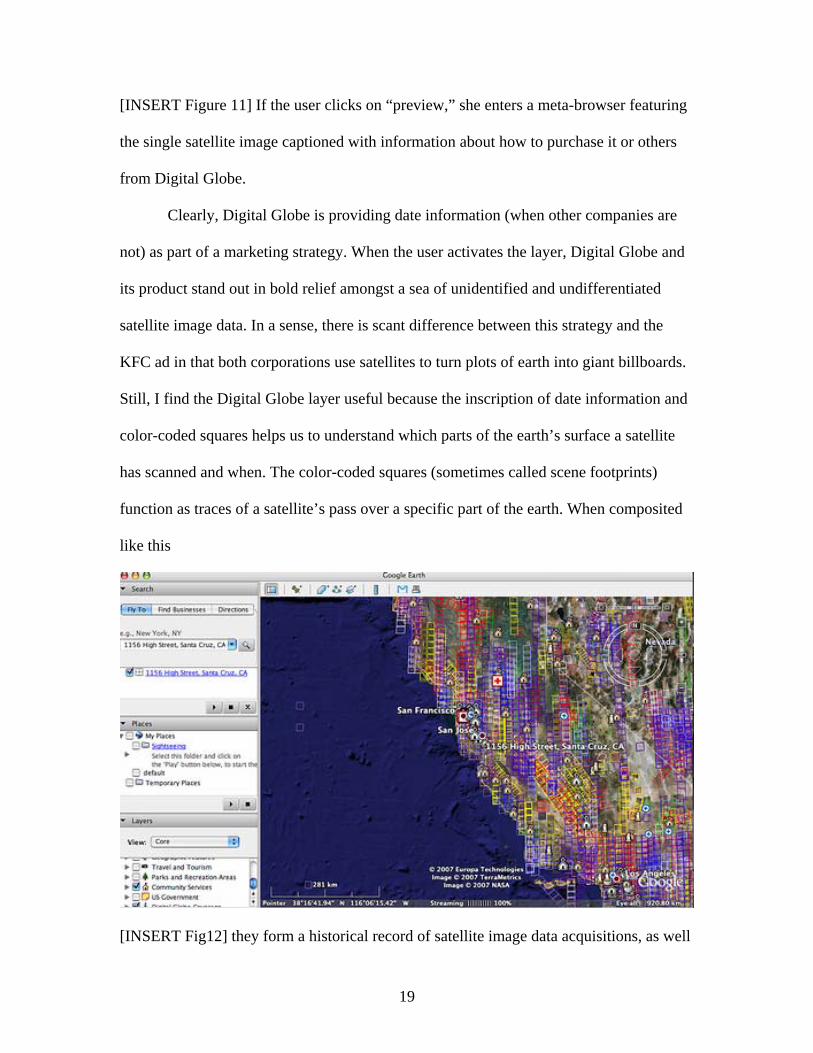
Still, I find the Digital Globe layer useful because the inscription of date information and
color-coded squares helps us to understand which parts of the earth’s surface a satellite
has scanned and when. The color-coded squares (sometimes called scene footprints)
function as traces of a satellite’s pass over a specific part of the earth. When composited
like this
[INSERT Fig12] they form a historical record of satellite image data acquisitions, as well

20
as a slice of Digital Globe’s inventory. Just as visualizations of signal distribution and
footprints can help to emphasize the different morphologies and materialities of satellite
media, this view provides a series of tracks or traces of the obscured technology in use.
Conclusion
If we accept that experimental satellite relays, the distribution of hundreds of
radio and television channels, and constantly snapped satellite images of earth are
relevant to the field of media studies, then we either need a theory of obscure media or
we need ways of making the satellite less obscure. In this essay I have suggested that the
uses of Echo, Hotbird and Ikonos have generated a set of interplays between earth and
orbit that demand different media morphologies and mappings. This call for maps of
signal distribution should not be understood as a positivist gesture to see, know and
master, but rather an attempt to generate critical spaces for exploring other obscure
objects of media studies. I have only discussed three satellites, and there are about 3500
functioning satellites in orbit. Each satellite is a symptom of a complex institutional
history and imperceptible signal traffic. While imagining and specifying the contours and
vectors of this traffic, it is also important to explore in greater detail the financial,
temporal, regulatory, and intermedial dimensions of the satellite economy and to
recognize that this part of the culture industry synthesizes and alternates between
scientific, military, entertainment, and educational modalities.
I’d like to close by making three points. First, studying the signal territories and
cultures that form in relation to satellites can help make them less obscure in media

21
studies. In his provocative essay, “Popular Secrecy and Occultural Studies,” Jack Bratich
makes a case for a tactical secrecy, suggesting that publicity is a “a truth-telling strategy”
often aligned with the Enlightenment project and is swept up in the fickle dynamics of
concealment and revelation that shape our public culture. He asks, “In an age where
secrecy is virtually everywhere as a strategy of domination, can we begin to experiment
with an insurgent secrecy, a minor secrecy or a popular secrecy?”xxiii While Bratich offers
a sharp analysis of the nuances of power and knowledge in the current political moment, I
find it difficult to apply this logic to satellites since their secrecy (or, as I have termed it
in this essay, obscurity) is so bound up with institutions that require more public
oversight and scrutiny, whether NASA, the U.S. military, or the telecommunications and
media conglomerates. In short, the stakes are too high for keeping the satellite secret, in
both media studies and public culture.
Second, studying satellites may enable media scholars to develop new ways of
conceptualizing and visualizing the dynamic field of signal distribution that has taken
shape across continents and between earth and orbit for nearly fifty years. The year 2007
marks the fifty year anniversary of the first earth satellite, Sputnik, and while there are
plenty of images and models of satellites, we still do not have adequate visualizations of
signal territories and traffic. Generating visualizations, then, can help us imagine signals
as material phenomena and allow us to invent new conceptual categories and metaphors
for media theory and history. The vectors of signals moving through the world may share
more in common with patterns of weather systems or other creatures of flight, whether
birds, hurricanes, or airplanes. Developing ways of conveying the imperceptible or
22
obscure aspects of satellite media may also allow us to recognize our field’s overlap with
environmental studies.
Finally, although one could conceive of an object-oriented field of satellite
studies, such a project, it seems to me, ultimately privileges institutional legitimation over
passionate investigation. Put in the historical perspective of what Zielinski calls the “deep
history of the media,” the satellite is but a passing interlude of audiovisions.xxiv Thus
rather than fetishize the object and call for another field of study, I am more interested in
using satellites and signal exchanges as objects to think with in a way that may expand
possibilities for historical and critical research in media studies. At the very least, Echo,
Hotbird, and Ikonos spark questions about the definition of signal territories, paths of
signal distribution, and new economies of global imaging. Perhaps the best we can hope
for in an object is for it to spin us into the orbit of new curiosities.
Author’s Note: I would like to thank Jim Schwoch, Charles Acland, Amelie Hastie, Anna McCarthy, and members of the UC Santa Cruz Department of Film and Digital Media Studies for their encouraging comments and helpful feedback as I was writing this essay. Ethan Tussey is completing his Master's degree in Cinema and Media Studies at UCLA. His work examines the collisions and negotiations developing between old and new media. He will continue his PhD studies in the fall at USCB. Notes i Amelie Hastie, Curator’s Statement for “The Object of Media Studies,” Vectors: Journal of Culture and Technology in a Dynamic Vernacular, Spring 2006, available at http://vectors.iml.annenberg.edu/index.php?page=7&projectId=65, accessed Jan. 3, 2007. ii Siegfried Zielinski, Audio-Visions: Cinema and Television as Entr’actes in History (Amsterdam: Amsterdam University Press, 1999), 18. iii The film is available at the Internet Movie Archive, available at http://www.archive.org/details/BigBounc1960, accessed Jan. 10, 2007. iv Donald C. Elder, Out from Behind the Eight-Ball: A History of Project Echo (American Astronautical Society, 1995), 116-121. v Ibid., p. 122.

23
vi For a discussion of satellite-based art that values impermanence and theatricality, see my essay, “Art in the Age of Ionospheric Exchange: Orbital Performers and Satellite Translators,” Quarterly Review of Film and Video (forthcoming 2007). vii Aaron Koblin, “Flight Patterns,” Nov. 4, 2006, available at http://www.youtube.com/watch?v=dPv8psZsvIU, accessed Nov. 10, 2006. High resolution version available at http://www.aaronkoblin.com/work/faa/, accessed Jan. 10, 2007. viii “Hotbird” publicity brochure, Eutelsat website, available at www.eutelsat.com/news/media_library/brochures/hotbirds.pdf, p. 2, accessed Jan. 30, 2006. ix Ibid., p. 3. x Charles Acland, Screen Traffic (Durham: Duke University Press),15. xi Mimi White, “Flow and Other Close Encounters with Television,” in Planet TV, Lisa Parks and Shanti Kumar, eds. (New York: New York University Press, 2003), 103. xii See Geoeye website at http://www.geoeye.com/, accessed Jan 10, 2007. xiii Ikonos Image Gallery http://www.spaceimaging.com/gallery/, accessed March 1, 2006. xiv The sequence is available at http://svs.gsfc.nasa.gov/vis/a000000/a002100/a002108/, accessed Jan. 30, 2006. xv These images are included in the Space Imaging online gallery, available at http://www.spaceimaging.com/gallery/survivor/default.htm, accessed Jan. 30, 2006. xvi Dan Vergano, “Scouting the new ‘Survivor’ Location,” USA Today, Aug. 29, 2001, available at http://www.usatoday.com/life/television/2001-08-29-survivor-location.htm, accessed Mar. 1, 2006. xvii As one KFC spokesperson quipped, “If there are extraterrestrials in outer space, KFC wants to become their restaurant of choice.” Kentucky Fried Chicken Press Release, Nov. 14, 2006, available at http://www.kfc.com/about/pressreleases/111406.asp, accessed Jan 7, 2007. xviii Ibid. xix Ibid. xx For a critical analysis of this project, see my essay, “Satellite and Cyber Visualities: Analyzing ‘Digital Earth,’” in The Visual Culture Reader 2.0, ed. Nicholas Mirzoeff (New York and London: Routledge, 2003), 279-294. xxi Google Earth, “Images and Dates,” available at http://earth.google.com/images_dates.html, accessed Jan. 11, 2007. xxii Google Earth, “Common Questions about Google Earth,” available at http://earth.google.com/faq.html#1, accessed Jan. 11, 2007. xxiii Jack Bratich, “Popular Secrecy and Occultural Studies,” Cultural Studies 1:1 (January 2007), 48. xxiv Siegfried Zielinski, Deep Time of the Media: Toward an Archaeology of Hearing and Seeing by Technical Means (Cambridge: MIT Press, 2006).