observation on isothermal reactive diffusion … on isothermal reactive diffusion between solid fe...
TRANSCRIPT
Observation on Isothermal Reactive Diffusion between Solid Fe and Liquid Sn
Masahiro Hida+1 and Masanori Kajihara+2
Department of Materials Science and Engineering, Tokyo Institute of Technology, Yokohama 226-8502, Japan
The kinetics of the reactive diffusion between solid Fe and liquid Sn was experimentally examined using Fe/Sn diffusion couples. Thediffusion couples were prepared by an isothermal bonding technique and then immediately annealed in the temperature range of T = 703773Kfor various times up to t = 90 ks (25 h). During annealing, a compound layer of FeSn2 is formed at the initial Fe/Sn interface in the diffusioncouple and grows mainly into the liquid Sn specimen. At T = 703K, the compound layer indicates a needle-like microstructure in the earlystages but a columnar microstructure in the late stages. On the other hand, at T = 723773K, only the columnar microstructure is realized in thecompound layer within the experimental annealing times. The mean thickness of the compound layer is proportional to a power function of theannealing time. The exponent n of the power function is mostly close to 0.6. In the early stages at T = 703K, however, n is equal to unity withinexperimental uncertainty. If growth of a compound layer with a uniform thickness is controlled by volume diffusion, n is equivalent to 0.5. Incontrast, n is equal to unity for longitudinal growth of a needle-like grain, even though volume diffusion is the rate-controlling process. This isthe case for the layer growth in the early stages at T = 703K. Since independent longitudinal growth of each columnar grain contributes to thelayer growth governed by volume diffusion, n is slightly greater than 0.5 for the compound layer with the columnar microstructure.Consequently, the discontinuous variation of n corresponds to the transition from the needle-like microstructure to the columnar microstructure.[doi:10.2320/matertrans.M2012060]
(Received February 17, 2012; Accepted April 26, 2012; Published June 6, 2012)
Keywords: reactive diffusion, intermetallic compounds, soldering, bulk diffusion, irontin system
1. Introduction
The reactive diffusion between solid Cu and liquid Al wasexperimentally observed in a previous study.1) In thisexperiment, Cu/Al diffusion couples were prepared by anisothermal bonding (IB) technique and then annealed attemperatures of T = 9731073K. In the IB technique,1) thesolid Cu and liquid Al specimens are separately preheatedat the same temperature as the annealing temperature in avacuum. After sufficient preheating, the Cu and the Al arebonded with each other and then annealed immediately.Hence, in the IB technique, the temperatures of the Cu andthe Al are equivalent and remain constant during preheating,bonding and annealing. In the Cu/Al diffusion couple, layersof the ¢, £1 and ¾2 phases are formed at the initial Cu/Alinterface owing to annealing. According to a recent phasediagram in the binary CuAl system,2) the ¢, £1 and ¾2 phasesare the only stable compounds at T = 9731073K. The meanthickness of each compound layer is proportional to a powerfunction of the annealing time. For the ¢ layer, the exponentof the power function is close to 0.5 at T = 10231073K butnearly equal to 0.25 at T = 973K. On the other hand, for the£1 layer, the exponent takes values between 0.25 and 0.5 atT = 10231073K but that smaller than 0.25 at T = 973K.The exponent smaller than 0.5 indicates that boundarydiffusion contributes to the growth of the compound layer.3)
Thus, the rate-controlling process of the layer growth variesdepending on the annealing temperature in a different mannerfor each compound.1)
The IB technique was also used to observe experimentallythe reactive diffusion between solid Fe and liquid Al inprevious studies.4,5) In these experiments, Fe/Al diffusioncouples were isothermally annealed at T = 9731073K4) andT = 10531093K.5) A phase diagram in the binary FeAl
system6) shows that FeAl3, Fe2Al5 and FeAl2 are the stablecompounds at T = 9731093K. After annealing, however,Fe2Al5 and FeAl3 were observed, but FeAl2 was notrecognized clearly. Similar experiments were conducted byBouché et al.7) and Bouayad et al.8) In their experiments,Fe/Al diffusion couples were prepared by a melt bath (MB)technique and then isothermally annealed at T = 9731173K. According to their observations,7,8) only Fe2Al5and FeAl3 are produced as visible layers during annealing.The thickness is much smaller for FeAl3 than for Fe2Al5, andirregular tongue-like morphology is realized for Fe2Al5.Owing to the irregular morphology, the growth rate of Fe2Al5could not be reliably determined in their experiments.7,8) Alsoin a previous study,4) the Fe2Al5 layer indicates the irregulartongue-like morphology at T = 9731023K. At T = 10531093K,4,5) however, Fe2Al5 is formed as a rather uniformlayer. Thus, the morphology of Fe2Al5 varies depending onthe annealing temperature. Such temperature dependence ofthe morphology could be detected by the IB technique butnot by the MB technique.
As previously mentioned, all the stable compounds areformed in the reactive diffusion between solid Cu and liquidAl.1) On the other hand, all the stable compounds are notnecessarily produced as visible layers in the reactive diffusionbetween solid Fe and liquid Al.4,5,7,8) Hence, the growthbehavior of compounds during reactive diffusion variesdepending on the combination of solid and liquid metals. Toobtain information for the dependence of the growth behavioron the combination, the reactive diffusion between solid Feand liquid Sn was experimentally examined in the presentstudy. Diffusion couples consisting of pure Fe and Sn wereprepared by the IB technique and then isothermally annealedin the temperature range of T = 703773K. The micro-structure of the annealed diffusion couple was observedin a metallographical manner. The rate-controlling processfor compound growth was discussed on the basis of theobservation.
+1Graduate Student, Tokyo Institute of Technology+2Corresponding author, E-mail: [email protected]
Materials Transactions, Vol. 53, No. 7 (2012) pp. 1240 to 1246©2012 The Japan Institute of Metals

2. Experimental
Polycrystalline columnar specimens with a length of 5mmwere cut from a commercial rod of pure Fe with a diameter of8mm and a purity of 99.7% in a manner similar to a previousstudy.4) The Fe rod contains a trace of C, 0.01mass% of Si,0.25mass% of Mn, 0.004mass% of P, 0.004mass% of S,0.01mass% of Cu, 0.01mass% of Ni and 0.01mass% ofCr as impurities. The columnar specimens were separatelyannealed in evacuated silica capsules at a temperature of1173K for a time of 2 h, followed by air cooling withoutbreaking the capsules. The top and bottom flat-surfacesof each annealed columnar specimen were mechanicallypolished on # 8004000 emery papers.
A commercial rod of pure Sn with a diameter of 6mm anda purity of 99.9% was cut into columnar specimens with alength of 30mm. Each polished Fe specimen was encapsu-lated together with a columnar Sn specimen in an evacuatedsilica capsule with an inner diameter of 8.5mm. The silicacapsule was isothermally preheated for a time of 1.8 ks(0.5 h) in the temperature range between 703 and 773K.During preheating, the solid Fe specimen was separated fromthe Sn melt in the silica capsule. After preheating, a flatsurface of the solid Fe specimen was immediately contactedwith that of the Sn melt with a diameter of 8.5mm anda length of 15mm to prepare a columnar Fe/Sn diffusioncouple. The diffusion couple was isothermally annealed forvarious times up to 90 ks (25 h) at the same temperature aspreheating, followed by water quenching with breaking thecapsule. The annealing temperature and time are denoted byT and t, respectively.
Cross-sections of the annealed diffusion couple weremechanically polished on # 8004000 emery papers andthen finished using diamond with a diameter of 1 µm. Themicrostructure of the cross-section was observed with a dif-ferential interference contrast optical microscope (DICOM)and with a back-scattered electron image (BEI) by scanningelectron microscopy (SEM). Concentrations of Fe and Sn ineach phase on the cross-section were measured by electronprobe microanalysis (EPMA) using pure Fe and Sn with apurity of 99.99% as standard specimens under the followingconditions: the accelerating voltage was 20 kV; the probecurrent was 5 nA; the analyzing crystals for Fe-K¡ and Sn-L¡
were lithium fluoride (LiF) and polyethylene terephthalate(PET), respectively; and the chemical composition wasevaluated by a standard ZAF correction technique.
3. Results and Discussion
3.1 MicrostructureA typical DICOM photograph of the cross-section for a
diffusion couple annealed at T = 773K for t = 14.4 ks (4 h)is shown in Fig. 1. In this figure, the lower and upper regionsare the Fe and Sn specimens, respectively. As can be seen, acompound layer with a columnar microstructure is observedbetween the Fe and the Sn, and the longitudinal direction ofeach columnar grain is almost normal to the initial Fe/Sninterface in the diffusion couple. Concentration profiles of Feand Sn across the compound layer along the direction normalto the Fe/Sn interface were measured by EPMA. A result for
the diffusion couple in Fig. 1 is indicated in Fig. 2. In thisfigure, the ordinate and the abscissa show the mol fraction yiof component i and the distance x, respectively, and opencircles and squares indicate the mol fractions yFe and ySn,respectively. In Fig. 2, the origin x = 0 of the distance islocated in the Sn. For the EPMA measurement, however,attention was focused on phase identification of thecompound layer. Consequently, the location of the originis merely arbitrarily chosen to represent conveniently theconcentration profiles. As can be seen, the compound layeris FeSn2. According to a recent phase diagram in the binaryFeSn system,9) FeSn and FeSn2 are the stable compoundsat T = 703773K. Nevertheless, only FeSn2 was observedin all the annealed diffusion couples. Here, FeSn2 is anintermetallic compound with the tetragonal CuAl2 typecrystal structure.9) The FeSn2 layer grows mainly towardsthe Sn in the diffusion couple.
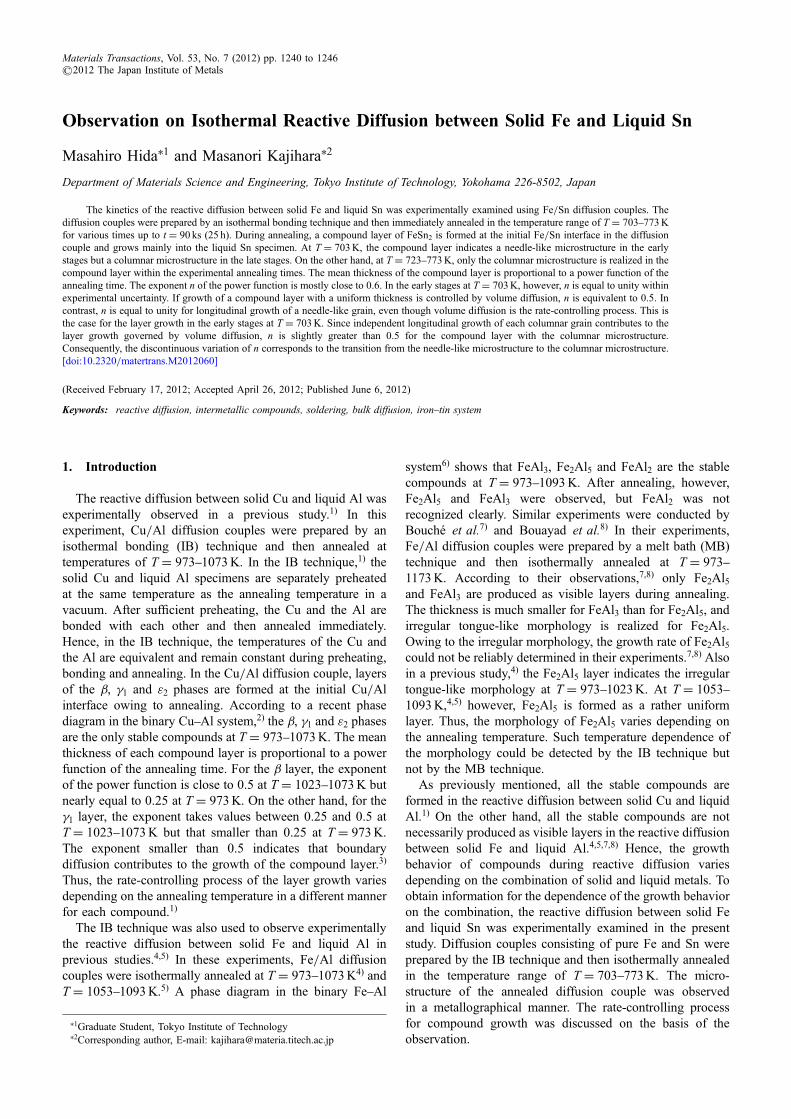
Various BEI photographs of the cross-section for differentdiffusion couples are shown in Fig. 3. The annealingtemperature is T = 703K in Fig. 3(a)3(b) and T = 773Kin Fig. 3(c), and the annealing time is t = 3.6 ks (1 h) inFig. 3(a) and 3(c) and t = 60 ks (16.7 h) in Fig. 3(b). In thisfigure, the brightest region on the upper side is the Sn,
Fig. 1 DICOM photograph of cross-section for the diffusion coupleannealed at T = 773K for t = 14.4 ks (4 h).
Fig. 2 Concentration profiles of Fe and Sn across the intermetallic layeralong the direction normal to the initial Fe/Sn interface for the diffusioncouple in Fig. 1.
Observation on Isothermal Reactive Diffusion between Solid Fe and Liquid Sn 1241
the darkest region on the lower side is the Fe, and theintermediate region between the Fe and the Sn is the FeSn2layer. At T = 703K, the FeSn2 layer consists of fine needle-like grains for t = 3.6 ks (1 h) but coarse columnar grainsfor t = 60 ks (16.7 h). However, at T = 773K, the FeSn2layer is composed of coarse columnar grains even fort = 3.6 ks (1 h). Although the longitudinal direction of thecolumnar grain is almost normal to the Fe/Sn interface inFig. 3(b) and 3(c), that of the needle-like grain is randomlydistributed in Fig. 3(a). The needle-like morphology as wellas the columnar morphology indicates the anisotropy ofgrowth behavior for FeSn2 due to the tetragonal crystalstructure.
The reactive diffusion between solid Fe and liquid Sn wasexperimentally observed also by van Beek et al.10) In this
experiment, diffusion couples consisting of pure Fe and theSn-rich liquid solution phase saturated with Fe were preparedby heating at T = 543K for t = 30 s and then isothermallyannealed at T = 573753K for various times. Thus, theinitial and boundary conditions are dissimilar between thediffusion couple in the present study and that by van Beeket al. Nevertheless, the FeSn2 layer with a columnar micro-structure was observed in the diffusion couple also by vanBeek et al.10) Furthermore, they reported that the longitudinaldirection of the columnar grain was parallel to the c axis ofFeSn2. This means that the growth of FeSn2 occurs fasteralong the c axis than along the a axis. For reactive diffusionin binary alloy systems, the growth rate of a compound layeris predominantly determined by the interdiffusion coefficientof the growing compound.1118) Consequently, the interdiffu-sion coefficient of FeSn2 should be much greater along the caxis than along the a axis. At T = 703K, fine needle-likegrains of FeSn2 are randomly distributed in the early stages asshown in Fig. 3(a). Among these, the grains with the c axisalmost normal to the Fe/Sn interface predominantly contrib-ute to faster growth of the FeSn2 layer. As a result, thecolumnar microstructure composed of such predominantFeSn2 grains is realized in the late stages as indicated inFig. 3(b). Thus, the transition from the needle-like micro-structure to the columnar microstructure occurs at a certaincritical annealing time. The higher the annealing temperatureis, the shorter the critical annealing time becomes. Hence,at T = 773K, the columnar microstructure is actualized evenfor t = 3.6 ks (1 h) as shown in Fig. 3(c).
3.2 Growth behavior of intermetallic layerIn OM photographs of the cross-section like Fig. 1, the
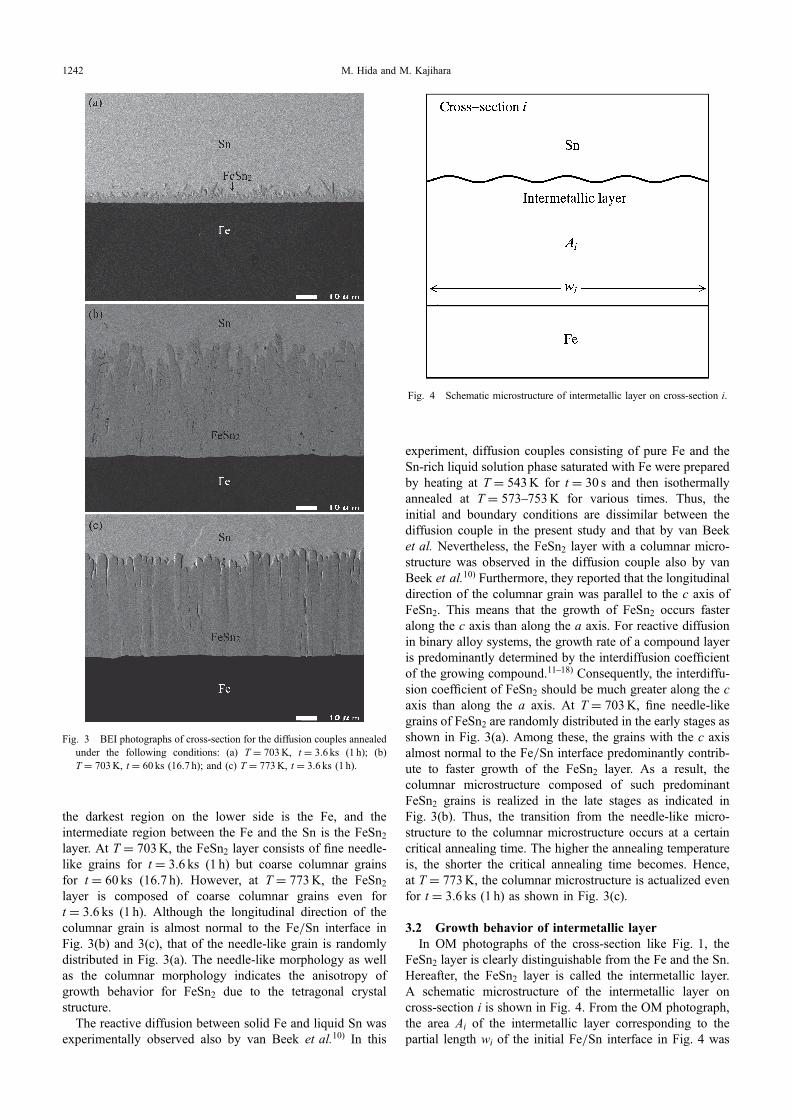
FeSn2 layer is clearly distinguishable from the Fe and the Sn.Hereafter, the FeSn2 layer is called the intermetallic layer.A schematic microstructure of the intermetallic layer oncross-section i is shown in Fig. 4. From the OM photograph,the area Ai of the intermetallic layer corresponding to thepartial length wi of the initial Fe/Sn interface in Fig. 4 was
Fig. 3 BEI photographs of cross-section for the diffusion couples annealedunder the following conditions: (a) T = 703K, t = 3.6 ks (1 h); (b)T = 703K, t = 60 ks (16.7 h); and (c) T = 773K, t = 3.6 ks (1 h).
Fig. 4 Schematic microstructure of intermetallic layer on cross-section i.
M. Hida and M. Kajihara1242

measured on each cross-section, and then the sums A and wwere obtained as4)
A ¼Xmi¼1
Ai (1a)
and
w ¼Xmi¼1
wi (1b)
from Ai and wi, respectively, where m ² 5. Using the valuesof A and w, the mean thickness l of the intermetallic layer wasevaluated at each annealing time t by the followingequation:4)
l ¼ A
w: ð2Þ
The results for T = 723, 743, 763 and 773K are plottedas open rhombuses, squares, inverse-triangles and circles,respectively, in Fig. 5. On the other hand, for T = 703K, theresults at shorter and longer annealing times are indicated asopen double-circles and triangles, respectively. In Fig. 5, theordinate and the abscissa show the logarithms of l and t,respectively. For T = 723773K, the plotted points arelocated well on a straight line at each annealing temperature.This means that l is expressed as a power function of t by thefollowing equation.
l ¼ kt
t0
� �n
ð3Þ
Here, t0 is unit time, 1 s. It is adopted to make the argumentt/t0 of the power function dimensionless. The proportionalitycoefficient k has the same dimension as the thickness l,but the exponent n is dimensionless. The dimensionlessargument of the power function is essentially important;otherwise the dimension of k varies depending on the valueof n. From the points plotted for T = 723773K in Fig. 5,
k and n were estimated by the least-squares method asshown with various straight lines. The estimated values areindicated in Fig. 5. On the other hand, for T = 703K, theopen double-circles and triangles lie well on straight lineswith larger and smaller gradients at the shorter and longerannealing times, respectively. Hereafter, the stages at theshorter and longer annealing times are called stages I and II,respectively. In each stage, l is expressed as a power functionof t by eq. (3). Thus, k and n were estimated by the least-squares method in each stage at T = 703K. The estimationgives k = 1.73 © 10¹7m and n = 0.516 for stage II. On theother hand, for stage I, n is evaluated to be 0.993 « 0.068and thus equal to unity within experimental uncertainty.As a consequence, considering exactly n = 1, we obtaink = 1.82 © 10¹9m for stage I. The values of k and n instages I and II yield the two solid lines intersected att = tc = 12.2 ks (3.38 h) in Fig. 5. Here, tc is the criticalannealing time for the transition from stage I to stage II. Theexponent n is equal to unity at t < tc but rather close to 0.5 att > tc. For the growth of the intermetallic layer duringreactive diffusion, n varies depending on the rate-controllingprocess.3,19) Hence, we may anticipate that the discontinuousvariation of n at t = tc corresponds to the transition of therate-controlling process.
3.3 Rate-controlling processThe exponent n is plotted against the annealing temper-
ature T as open circles with error bars in Fig. 6. AtT = 703K, however, n is shown only for stage II. As canbe seen, n is typically greater than 0.5, though the plottedpoints are slightly scattered. When the layer growth iscontrolled by the interface reaction at the migrating interface,n is equal to unity. On the other hand, n is equivalent to 0.5, ifthe volume diffusion in the constituent phases of the diffusioncouple is the rate-controlling process. Hereafter, the relation-ships with n = 0.5 and 1 are called the parabolic and linearrelationships, respectively. Therefore, we expect that the
Fig. 5 The thickness l of the intermetallic layer versus the annealing time t.Open rhombuses, squares, inverse-triangles and circles show the resultsfor T = 723, 743, 763 and 773K, respectively, and open double-circlesand triangles indicate those for T = 703K in stages I and II, respectively.Various lines represent the calculations from eq. (3).
Fig. 6 The exponent n versus the annealing temperature T shown as opencircles with error bars. The corresponding result obtained from the plottedpoints in Fig. 7 is indicated as open squares with error bars.
Observation on Isothermal Reactive Diffusion between Solid Fe and Liquid Sn 1243
interface reaction is the rate-controlling process for stage Ibut the volume diffusion is that for stage II. Such adiscontinuous transition of the rate-controlling process wasactually observed in a previous study.19) For precipitation of asecond phase into an untransformed matrix in binary alloysystems, the growth of the second phase controlled byvolume diffusion usually obeys the parabolic relationship. Ifthe shape of the second phase is a paraboloid of revolution ora parabolic cylinder, however, the longitudinal growth of thesecond phase occurs according to the linear relationship evenfor the diffusion rate-controlling process.2023) As previouslymentioned, the intermetallic layer grows mainly towards theSn. Thus, the growth rate of the intermetallic layer ispredominantly determined by the migration rate of theFeSn2/Sn interface. According to the BEI photographs forT = 703K like Fig. 3(a) and 3(b), the intermetallic layerpossesses the needle-like microstructure at t < tc but thecolumnar microstructure at t > tc. At t < tc, each needle-likegrain grows predominantly along the longitudinal direction.If the morphology of the growing cusp of the grain isconsidered to be a paraboloid of revolution or a paraboliccylinder, the longitudinal growth obeys the linear relation-ship. On the other hand, at t > tc, the parabolic relationshipmay hold for the layer growth with the columnar micro-structure. As shown in Fig. 3(b), however, the FeSn2/Sninterface is slightly gathered due to independent longitudinalgrowth of each columnar grain. As a result, the linearrelationship partially contributes to the layer growth, andhence n becomes slightly greater than 0.5. Consequently, thetransition from stage I to stage II in Fig. 5 corresponds tothat from the needle-like microstructure to the columnarmicrostructure. This transition should appear also at T =723773K. In this temperature range, however, only thecolumnar microstructure was observed for all the diffusioncouples. Thus, tc is much shorter than the experimentalannealing times at T = 723773K.
As mentioned earlier, the reactive diffusion between pureFe and the Sn-rich liquid solution phase saturated with Fewas experimentally studied at T = 573753K by van Beeket al.10) Thus, the initial and boundary conditions in theirstudy are different from those in the present study. Only aFeSn2 layer was observed in the annealed diffusion couple inthe present study, but a very thin FeSn layer as well as aFeSn2 layer was recognized in that by van Beek et al.10)
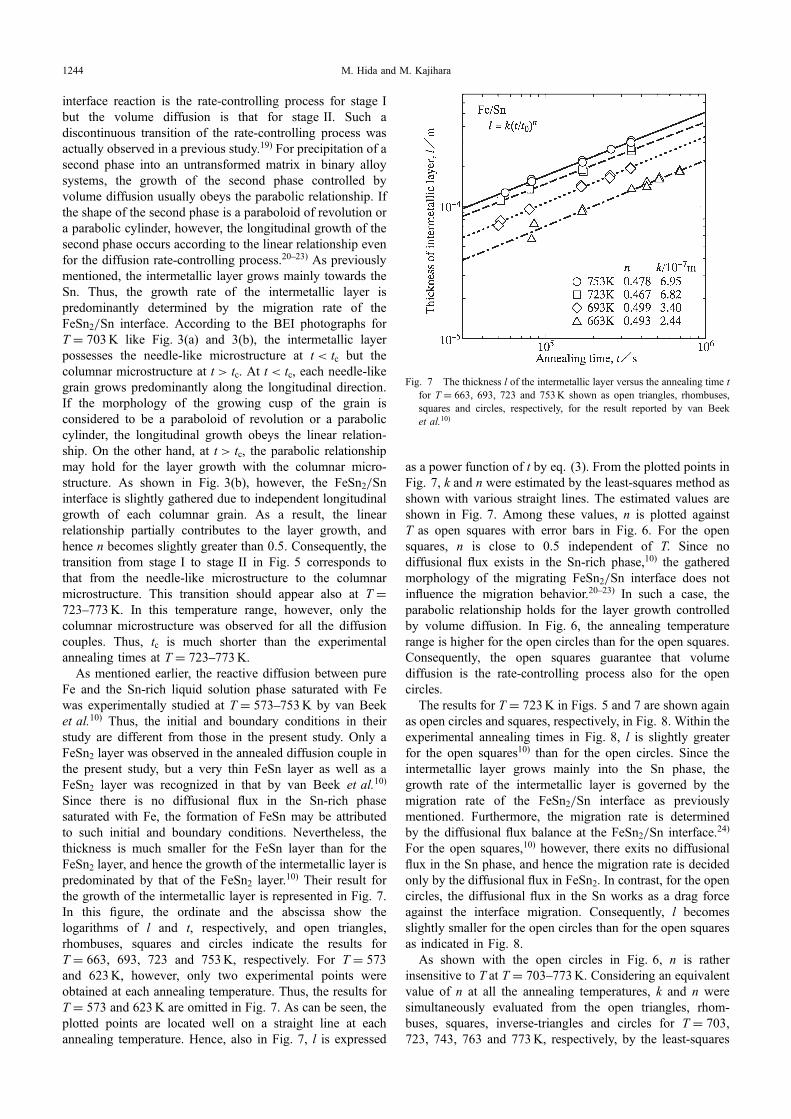
Since there is no diffusional flux in the Sn-rich phasesaturated with Fe, the formation of FeSn may be attributedto such initial and boundary conditions. Nevertheless, thethickness is much smaller for the FeSn layer than for theFeSn2 layer, and hence the growth of the intermetallic layer ispredominated by that of the FeSn2 layer.10) Their result forthe growth of the intermetallic layer is represented in Fig. 7.In this figure, the ordinate and the abscissa show thelogarithms of l and t, respectively, and open triangles,rhombuses, squares and circles indicate the results forT = 663, 693, 723 and 753K, respectively. For T = 573and 623K, however, only two experimental points wereobtained at each annealing temperature. Thus, the results forT = 573 and 623K are omitted in Fig. 7. As can be seen, theplotted points are located well on a straight line at eachannealing temperature. Hence, also in Fig. 7, l is expressed
as a power function of t by eq. (3). From the plotted points inFig. 7, k and n were estimated by the least-squares method asshown with various straight lines. The estimated values areshown in Fig. 7. Among these values, n is plotted againstT as open squares with error bars in Fig. 6. For the opensquares, n is close to 0.5 independent of T. Since nodiffusional flux exists in the Sn-rich phase,10) the gatheredmorphology of the migrating FeSn2/Sn interface does notinfluence the migration behavior.2023) In such a case, theparabolic relationship holds for the layer growth controlledby volume diffusion. In Fig. 6, the annealing temperaturerange is higher for the open circles than for the open squares.Consequently, the open squares guarantee that volumediffusion is the rate-controlling process also for the opencircles.
The results for T = 723K in Figs. 5 and 7 are shown againas open circles and squares, respectively, in Fig. 8. Within theexperimental annealing times in Fig. 8, l is slightly greaterfor the open squares10) than for the open circles. Since theintermetallic layer grows mainly into the Sn phase, thegrowth rate of the intermetallic layer is governed by themigration rate of the FeSn2/Sn interface as previouslymentioned. Furthermore, the migration rate is determinedby the diffusional flux balance at the FeSn2/Sn interface.24)
For the open squares,10) however, there exits no diffusionalflux in the Sn phase, and hence the migration rate is decidedonly by the diffusional flux in FeSn2. In contrast, for the opencircles, the diffusional flux in the Sn works as a drag forceagainst the interface migration. Consequently, l becomesslightly smaller for the open circles than for the open squaresas indicated in Fig. 8.
As shown with the open circles in Fig. 6, n is ratherinsensitive to T at T = 703773K. Considering an equivalentvalue of n at all the annealing temperatures, k and n weresimultaneously evaluated from the open triangles, rhom-buses, squares, inverse-triangles and circles for T = 703,723, 743, 763 and 773K, respectively, by the least-squares
Fig. 7 The thickness l of the intermetallic layer versus the annealing time tfor T = 663, 693, 723 and 753K shown as open triangles, rhombuses,squares and circles, respectively, for the result reported by van Beeket al.10)
M. Hida and M. Kajihara1244

method. The evaluated value of n is shown in Fig. 6, andthose of k are plotted against T as open circles with error barsin Fig. 9. In Fig. 9, the ordinate indicates the logarithm of k,and the abscissa shows the reciprocal of T. As can be seen,the open circles lie well on a straight line within experimentaluncertainty. Therefore, the dependence of k on T is expressedby the following equation.
k ¼ k0 exp � Qk
RT
� �ð4Þ
The pre-exponential factor k0 and the activation enthalpyQk in eq. (4) were evaluated from the open circles by theleast-squares method as shown with a solid line in Fig. 9.The evaluation provides Qk = 100 kJ/mol. If the parabolic
relationship holds for the growth of the intermetallic layer,the dependence of k on T is estimated from the interdiffusioncoefficients and the solubility ranges of the constituentphases in the diffusion couple by an appropriate analyticaltechnique.1118) As a result, Qk is compared with theactivation enthalpy of the interdiffusion coefficient foreach phase. Unfortunately, however, n = 0.596 for the opencircles in Fig. 9, and hence the analytical technique1118)
cannot be used to estimate the value of Qk in a straightfor-ward manner.
On the other hand, as shown in Figs. 6 and 7, the parabolicrelationship almost holds for the result by van Beek et al.10)
Instead of eq. (3) with n = 0.5, they used the followingequation to describe the parabolic relationship.10)
l2 ¼ Kt ð5ÞHere, K is the parabolic coefficient with a dimension of m2/s.Inserting n = 0.5 into eq. (3) and combining eq. (5) witheq. (3), we obtain the relationship K = k2/t0 between K andk. Although merely two values of l were measured at eachtemperature of T = 573 and 623K as mentioned earlier, Kwas evaluated by the least-squares method at T = 573753Kand then expressed as a function of T by the followingequation of the same formula as eq. (4).10)
K ¼ K0 exp �QK
RT
� �ð6Þ
The pre-exponential factor K0 and the activation enthalpy QK
in eq. (6) were estimated by van Beek et al.10) as follows:K0 = 2.00 © 10¹7m2/s and QK = 83 kJ/mol. A dashed linein Fig. 10 shows their estimation. As previously mentioned,however, the parabolic relationship does not hold in thepresent study. Nevertheless, for semi-quantitative comparisonof QK, the values of K for T = 703, 723, 743, 763 and 773Kwere estimated from the open triangles, rhombuses, squares,inverse-triangles and circles, respectively, in Fig. 5 by theleast-squares method. The estimated values of K are plotted
Fig. 9 The proportionality coefficient k versus the reciprocal of thetemperature T for n = 0.596 shown as open circles with error bars. A solidline indicates the calculation from eq. (4).
Fig. 10 The parabolic coefficient K versus the reciprocal of the temperatureT shown as open circles with error bars. A solid line indicates thecalculation from eq. (6), and a dashed line represents the correspondingresult reported by van Beek et al.10)
Fig. 8 The results for T = 723K in Figs. 5 and 7 shown as open circlesand squares, respectively. Solid and dashed lines indicate the calculationsfrom eq. (3) for the open circles and squares, respectively.
Observation on Isothermal Reactive Diffusion between Solid Fe and Liquid Sn 1245
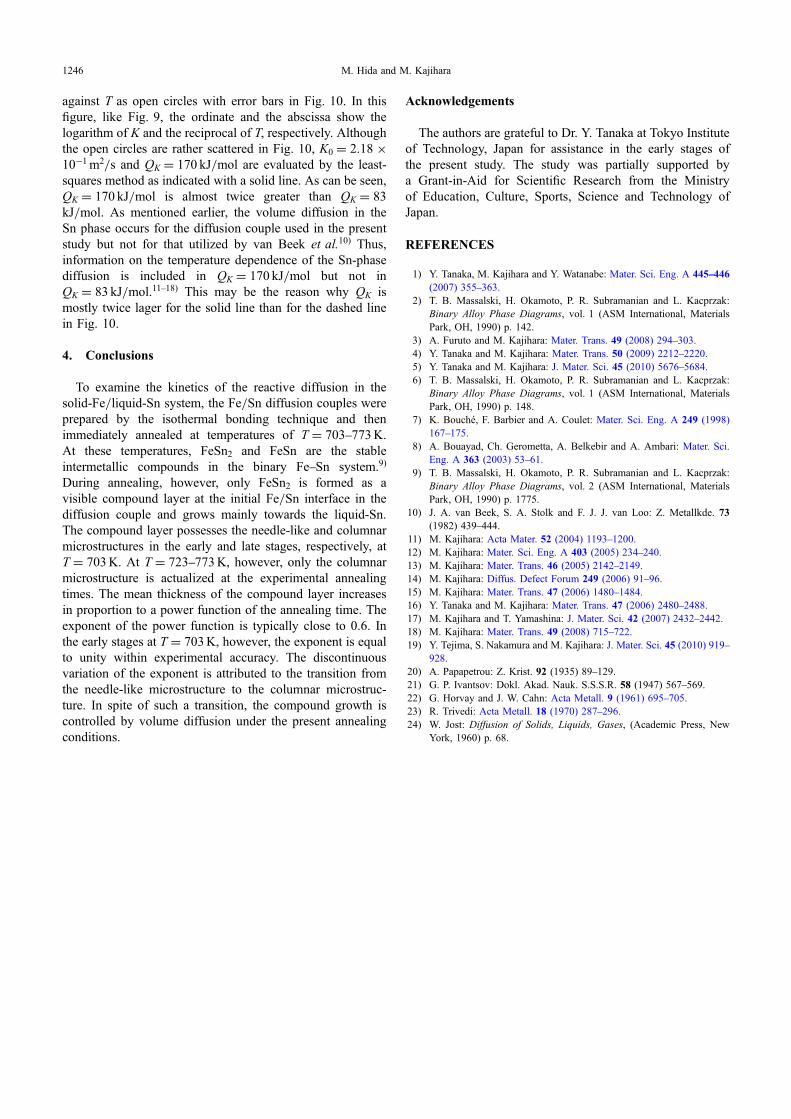
against T as open circles with error bars in Fig. 10. In thisfigure, like Fig. 9, the ordinate and the abscissa show thelogarithm of K and the reciprocal of T, respectively. Althoughthe open circles are rather scattered in Fig. 10, K0 = 2.18 ©10¹1m2/s and QK = 170 kJ/mol are evaluated by the least-squares method as indicated with a solid line. As can be seen,QK = 170 kJ/mol is almost twice greater than QK = 83kJ/mol. As mentioned earlier, the volume diffusion in theSn phase occurs for the diffusion couple used in the presentstudy but not for that utilized by van Beek et al.10) Thus,information on the temperature dependence of the Sn-phasediffusion is included in QK = 170 kJ/mol but not inQK = 83 kJ/mol.1118) This may be the reason why QK ismostly twice lager for the solid line than for the dashed linein Fig. 10.
4. Conclusions
To examine the kinetics of the reactive diffusion in thesolid-Fe/liquid-Sn system, the Fe/Sn diffusion couples wereprepared by the isothermal bonding technique and thenimmediately annealed at temperatures of T = 703773K.At these temperatures, FeSn2 and FeSn are the stableintermetallic compounds in the binary FeSn system.9)
During annealing, however, only FeSn2 is formed as avisible compound layer at the initial Fe/Sn interface in thediffusion couple and grows mainly towards the liquid-Sn.The compound layer possesses the needle-like and columnarmicrostructures in the early and late stages, respectively, atT = 703K. At T = 723773K, however, only the columnarmicrostructure is actualized at the experimental annealingtimes. The mean thickness of the compound layer increasesin proportion to a power function of the annealing time. Theexponent of the power function is typically close to 0.6. Inthe early stages at T = 703K, however, the exponent is equalto unity within experimental accuracy. The discontinuousvariation of the exponent is attributed to the transition fromthe needle-like microstructure to the columnar microstruc-ture. In spite of such a transition, the compound growth iscontrolled by volume diffusion under the present annealingconditions.
Acknowledgements
The authors are grateful to Dr. Y. Tanaka at Tokyo Instituteof Technology, Japan for assistance in the early stages ofthe present study. The study was partially supported bya Grant-in-Aid for Scientific Research from the Ministryof Education, Culture, Sports, Science and Technology ofJapan.
REFERENCES
1) Y. Tanaka, M. Kajihara and Y. Watanabe: Mater. Sci. Eng. A 445446(2007) 355363.
2) T. B. Massalski, H. Okamoto, P. R. Subramanian and L. Kacprzak:Binary Alloy Phase Diagrams, vol. 1 (ASM International, MaterialsPark, OH, 1990) p. 142.
3) A. Furuto and M. Kajihara: Mater. Trans. 49 (2008) 294303.4) Y. Tanaka and M. Kajihara: Mater. Trans. 50 (2009) 22122220.5) Y. Tanaka and M. Kajihara: J. Mater. Sci. 45 (2010) 56765684.6) T. B. Massalski, H. Okamoto, P. R. Subramanian and L. Kacprzak:
Binary Alloy Phase Diagrams, vol. 1 (ASM International, MaterialsPark, OH, 1990) p. 148.
7) K. Bouché, F. Barbier and A. Coulet: Mater. Sci. Eng. A 249 (1998)167175.
8) A. Bouayad, Ch. Gerometta, A. Belkebir and A. Ambari: Mater. Sci.Eng. A 363 (2003) 5361.
9) T. B. Massalski, H. Okamoto, P. R. Subramanian and L. Kacprzak:Binary Alloy Phase Diagrams, vol. 2 (ASM International, MaterialsPark, OH, 1990) p. 1775.
10) J. A. van Beek, S. A. Stolk and F. J. J. van Loo: Z. Metallkde. 73(1982) 439444.
11) M. Kajihara: Acta Mater. 52 (2004) 11931200.12) M. Kajihara: Mater. Sci. Eng. A 403 (2005) 234240.13) M. Kajihara: Mater. Trans. 46 (2005) 21422149.14) M. Kajihara: Diffus. Defect Forum 249 (2006) 9196.15) M. Kajihara: Mater. Trans. 47 (2006) 14801484.16) Y. Tanaka and M. Kajihara: Mater. Trans. 47 (2006) 24802488.17) M. Kajihara and T. Yamashina: J. Mater. Sci. 42 (2007) 24322442.18) M. Kajihara: Mater. Trans. 49 (2008) 715722.19) Y. Tejima, S. Nakamura and M. Kajihara: J. Mater. Sci. 45 (2010) 919
928.20) A. Papapetrou: Z. Krist. 92 (1935) 89129.21) G. P. Ivantsov: Dokl. Akad. Nauk. S.S.S.R. 58 (1947) 567569.22) G. Horvay and J. W. Cahn: Acta Metall. 9 (1961) 695705.23) R. Trivedi: Acta Metall. 18 (1970) 287296.24) W. Jost: Diffusion of Solids, Liquids, Gases, (Academic Press, New
York, 1960) p. 68.
M. Hida and M. Kajihara1246