observatory of automated metros -...
TRANSCRIPT
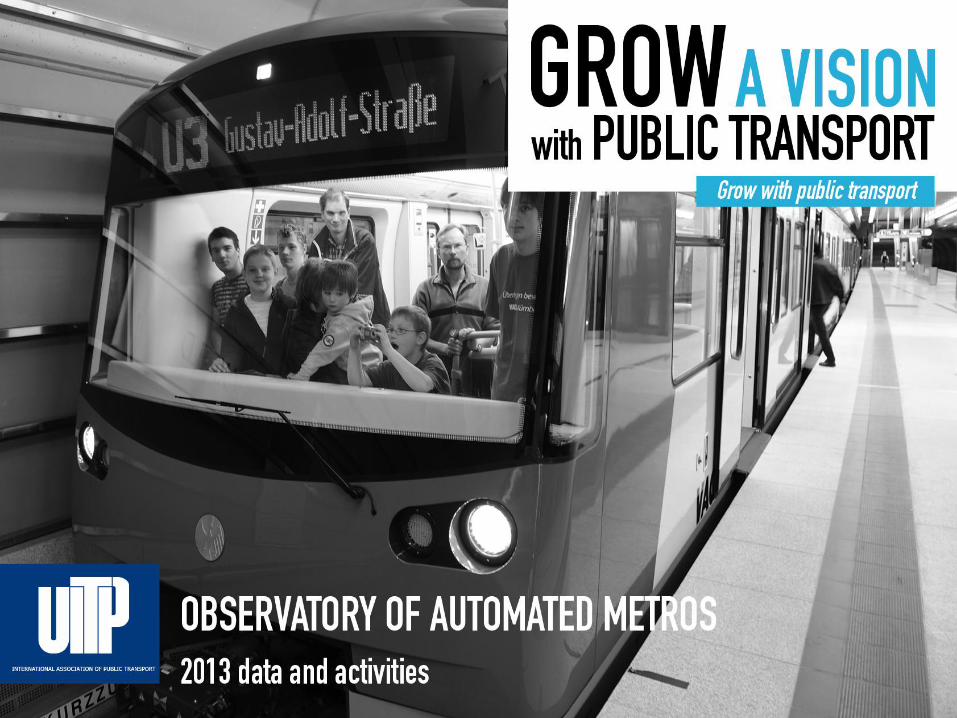
OBSERVATORY OF AUTOMATED METROS2013 data and activities
Observatory of Automated Metros
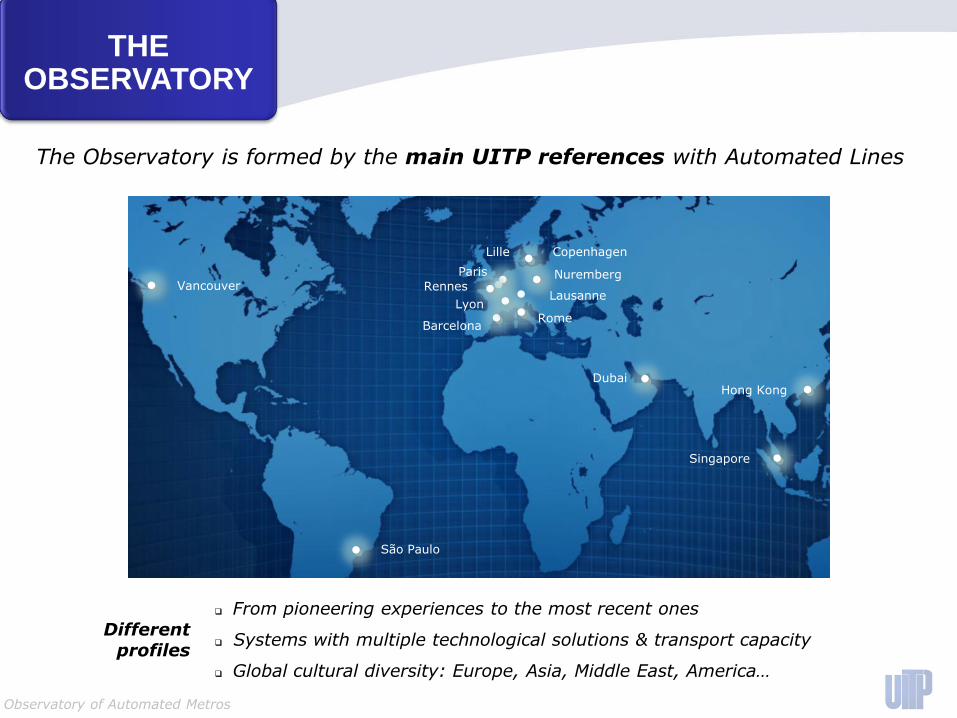
The Observatory is formed by the main UITP references with Automated Lines
From pioneering experiences to the most recent ones
Systems with multiple technological solutions & transport capacity
Global cultural diversity: Europe, Asia, Middle East, America…
Different profiles
Vancouver
Hong KongDubai
Barcelona
Singapore
Lille
Paris
Rennes
LyonLausanne
Copenhagen
Nuremberg
São Paulo
Rome
THE OBSERVATORY
Observatory of Automated Metros
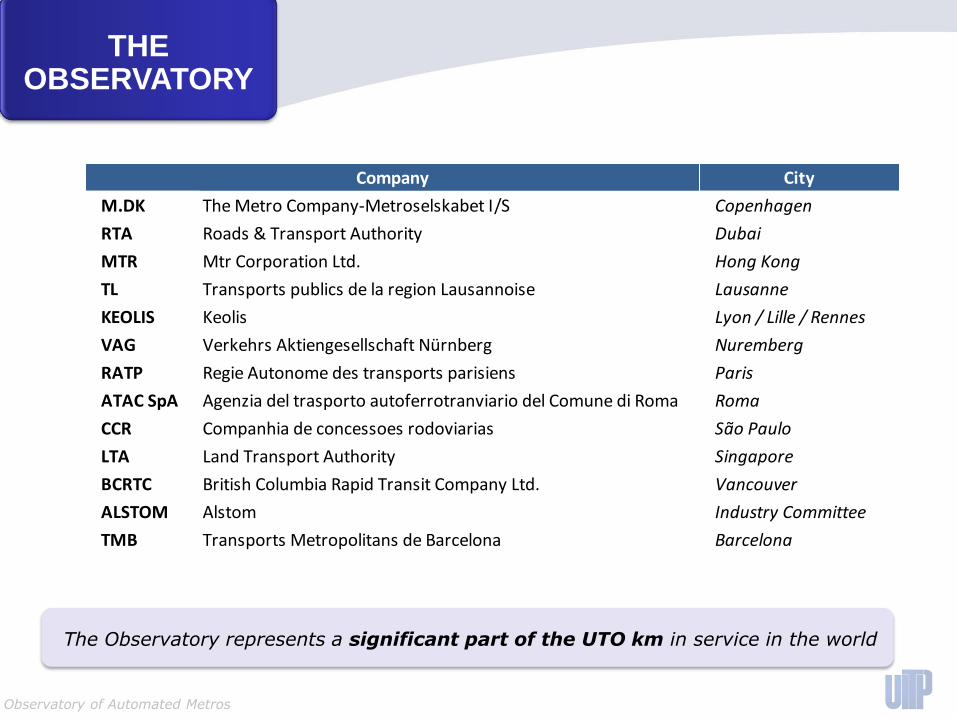
City
M.DK The Metro Company-Metroselskabet I/S Copenhagen
RTA Roads & Transport Authority Dubai
MTR Mtr Corporation Ltd. Hong Kong
TL Transports publics de la region Lausannoise Lausanne
KEOLIS Keolis Lyon / Lille / Rennes
VAG Verkehrs Aktiengesellschaft Nürnberg Nuremberg
RATP Regie Autonome des transports parisiens Paris
ATAC SpA Agenzia del trasporto autoferrotranviario del Comune di Roma Roma
CCR Companhia de concessoes rodoviarias São Paulo
LTA Land Transport Authority Singapore
BCRTC British Columbia Rapid Transit Company Ltd. Vancouver
ALSTOM Alstom Industry Committee
TMB Transports Metropolitans de Barcelona Barcelona
Company
The Observatory represents a significant part of the UTO km in service in the world
THE OBSERVATORY
Observatory of Automated Metros
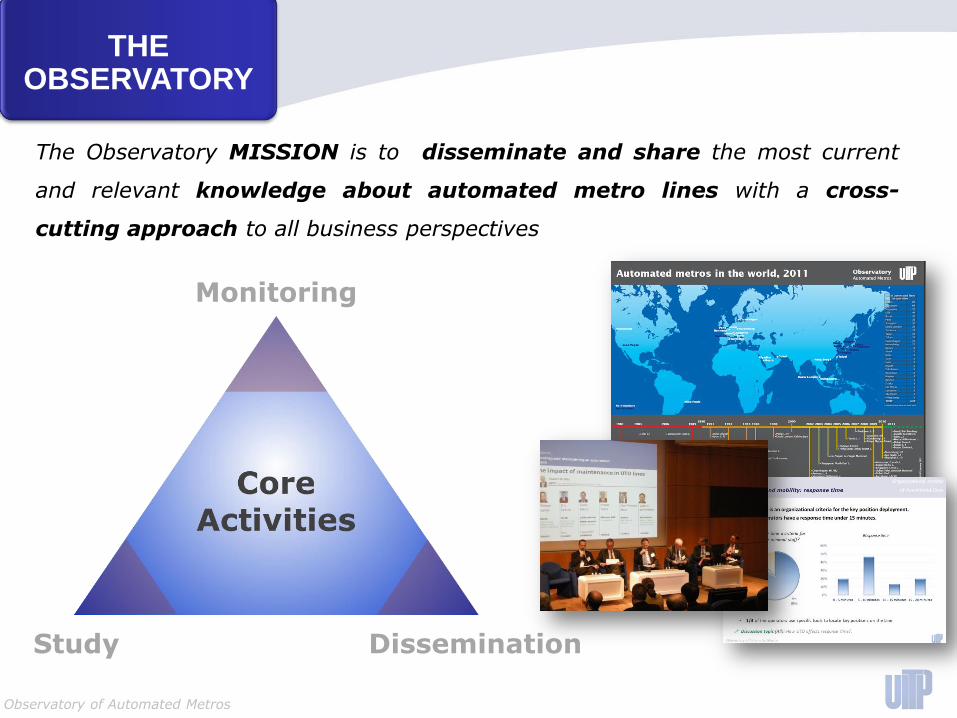
The Observatory MISSION is to disseminate and share the most current
and relevant knowledge about automated metro lines with a cross-
cutting approach to all business perspectives
Monitoring
DisseminationStudy
THE OBSERVATORY
Observatory of Automated Metros
Type of train operation
Setting train in motion
Stopping train Door closureOperation in
event of disruption
Grade of Automation
GoA 1ATP with
driver
ATP / ATO with driver
Driver
Automatic
Driver
Automatic
Driver Driver
Driver DriverGoA 2
GoA 3 Driverless Automatic AutomaticTrain
attendantTrain
attendant
Driverless, unattended
Automatic Automatic Automatic AutomaticGoA 4
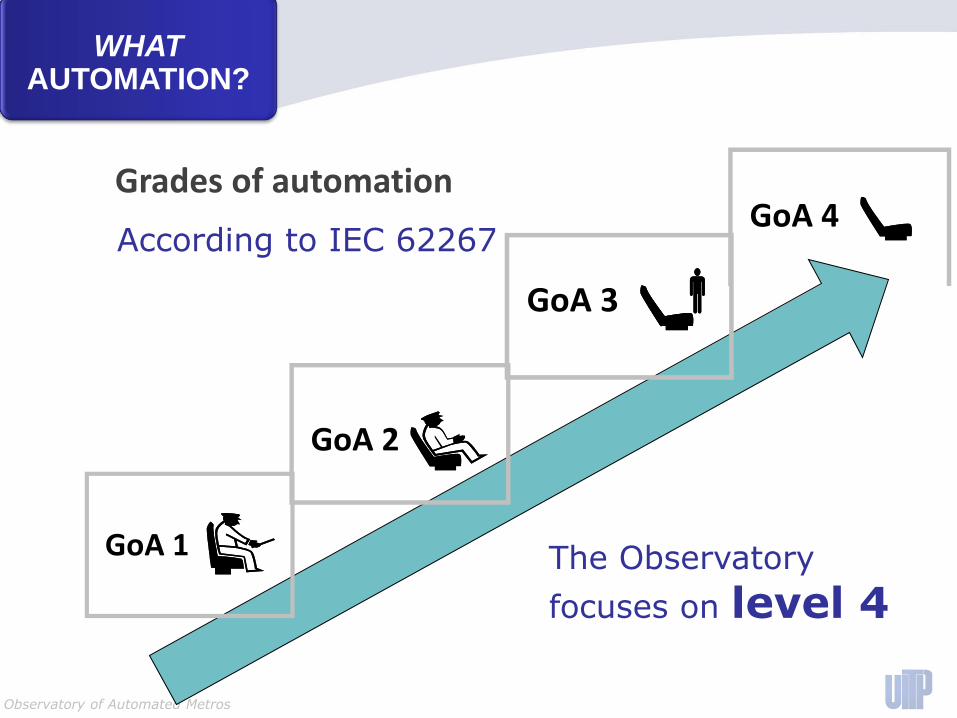
Grades of automation
According to IEC 62267
WHATAUTOMATION?
The Observatory
focuses on level 4
Observatory of Automated Metros
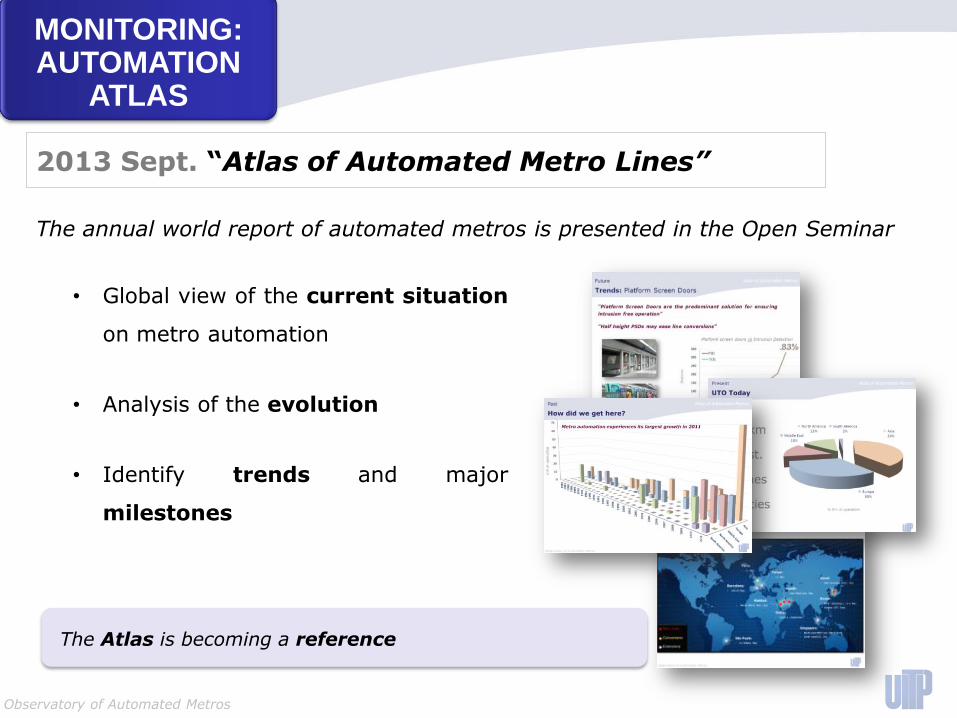
• Global view of the current situation
on metro automation
• Analysis of the evolution
• Identify trends and major
milestones
The annual world report of automated metros is presented in the Open Seminar
2013 Sept. “Atlas of Automated Metro Lines”
The Atlas is becoming a reference
MONITORING: AUTOMATION
ATLAS
Observatory of Automated Metros
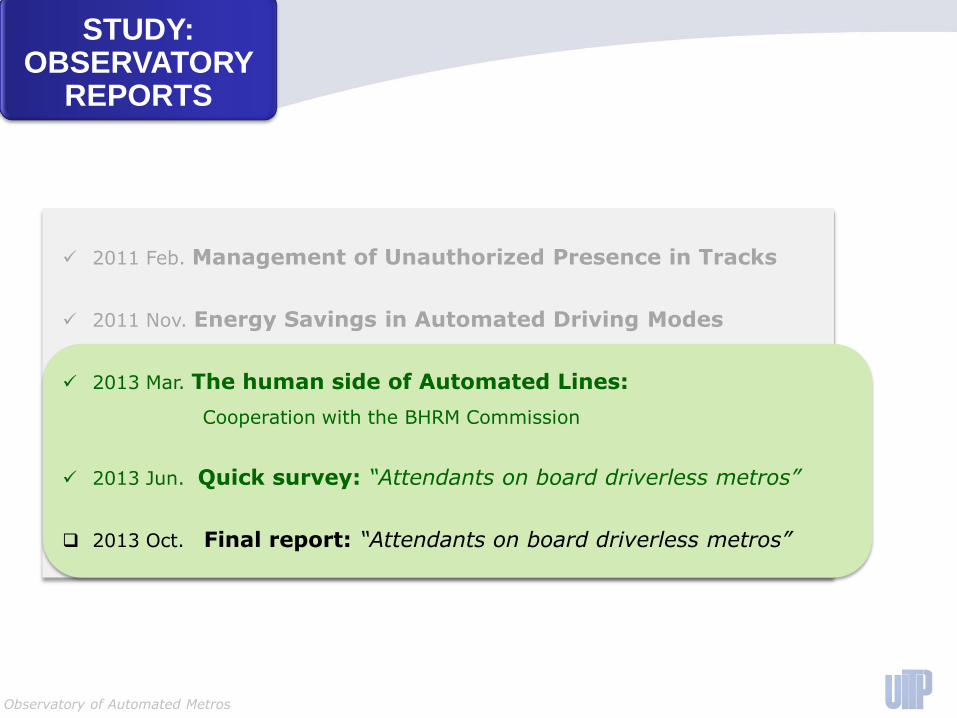
2011 Feb. Management of Unauthorized Presence in Tracks
2011 Nov. Energy Savings in Automated Driving Modes
2013 Mar. The human side of Automated Lines:
Cooperation with the BHRM Commission
2013 Jun. Quick survey: “Attendants on board driverless metros”
2013 Oct. Final report: “Attendants on board driverless metros”
STUDY: OBSERVATORY
REPORTS
Observatory of Automated Metros
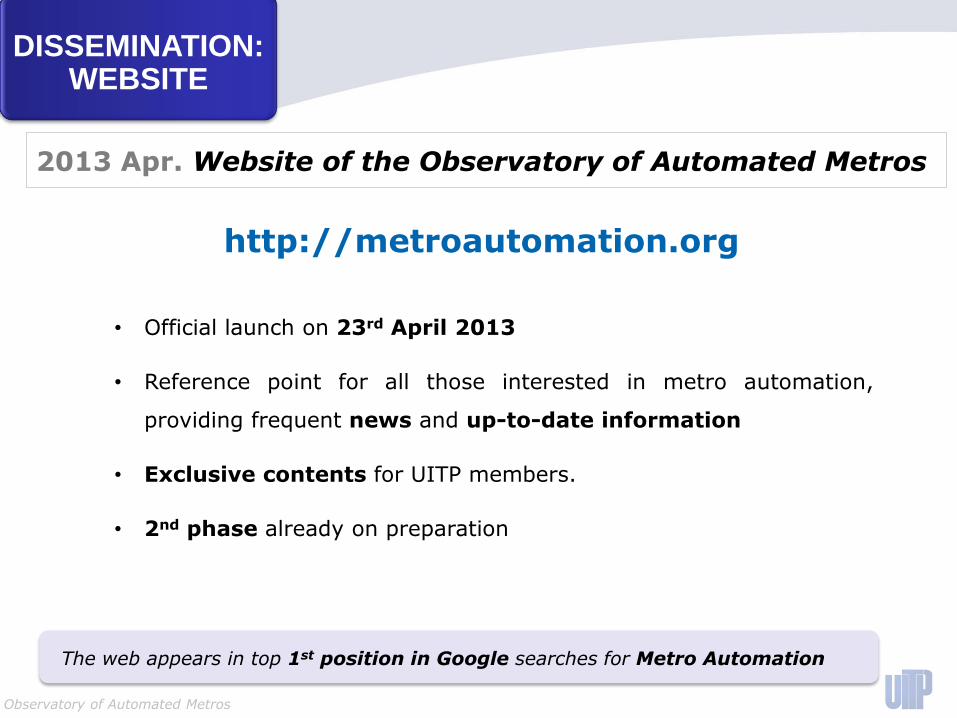
• Official launch on 23rd April 2013
• Reference point for all those interested in metro automation,
providing frequent news and up-to-date information
• Exclusive contents for UITP members.
• 2nd phase already on preparation
http://metroautomation.org
2013 Apr. Website of the Observatory of Automated Metros
DISSEMINATION: WEBSITE
The web appears in top 1st position in Google searches for Metro Automation
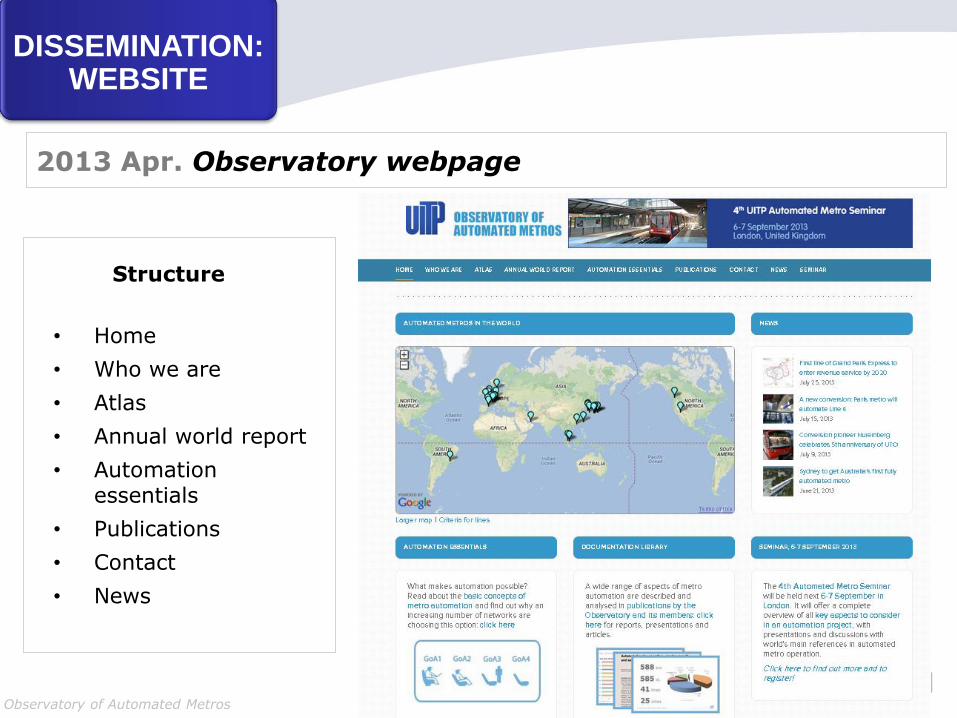
Observatory of Automated Metros
• Home
• Who we are
• Atlas
• Annual world report
• Automationessentials
• Publications
• Contact
• News
2013 Apr. Observatory webpage
Structure
DISSEMINATION: WEBSITE
Observatory of Automated Metros
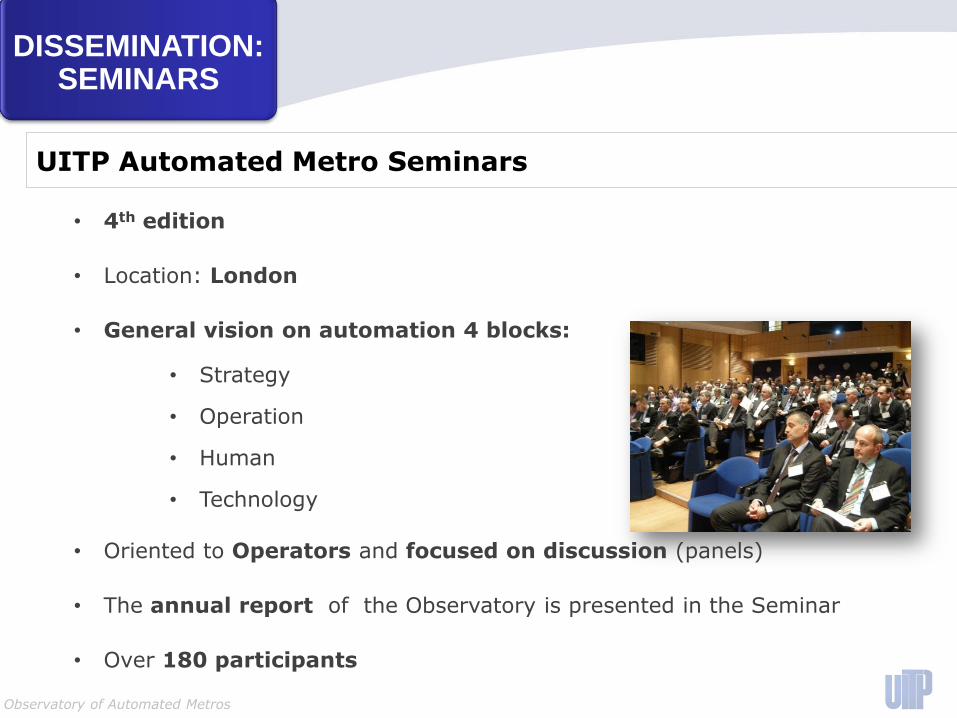
• 4th edition
• Location: London
• General vision on automation 4 blocks:
• Strategy
• Operation
• Human
• Technology
• Oriented to Operators and focused on discussion (panels)
• The annual report of the Observatory is presented in the Seminar
• Over 180 participants
UITP Automated Metro Seminars
DISSEMINATION: SEMINARS
Observatory of Automated Metros
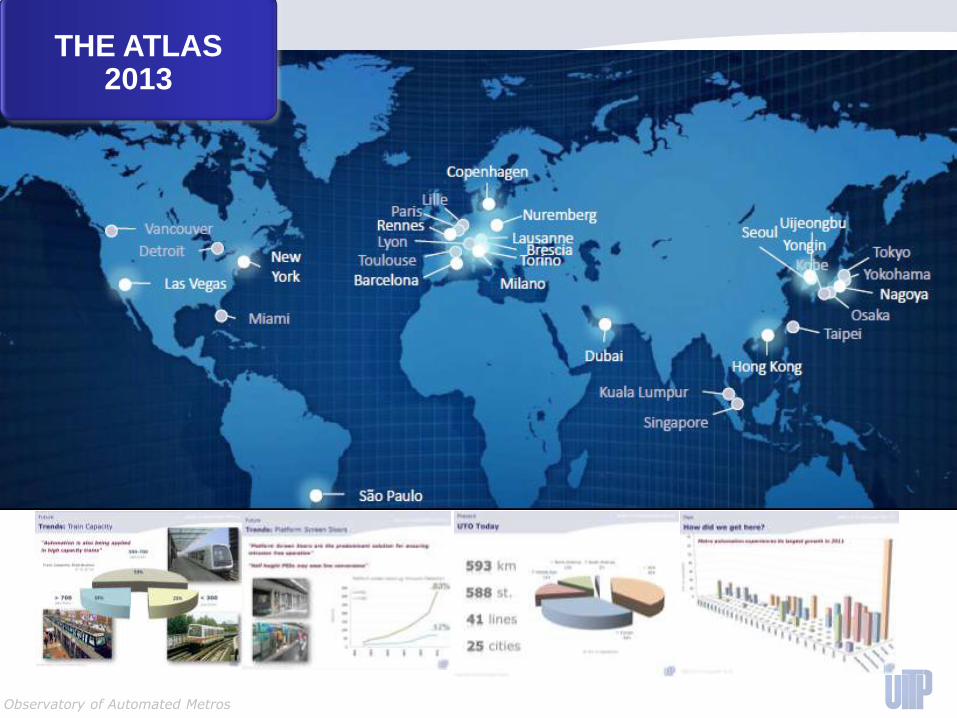
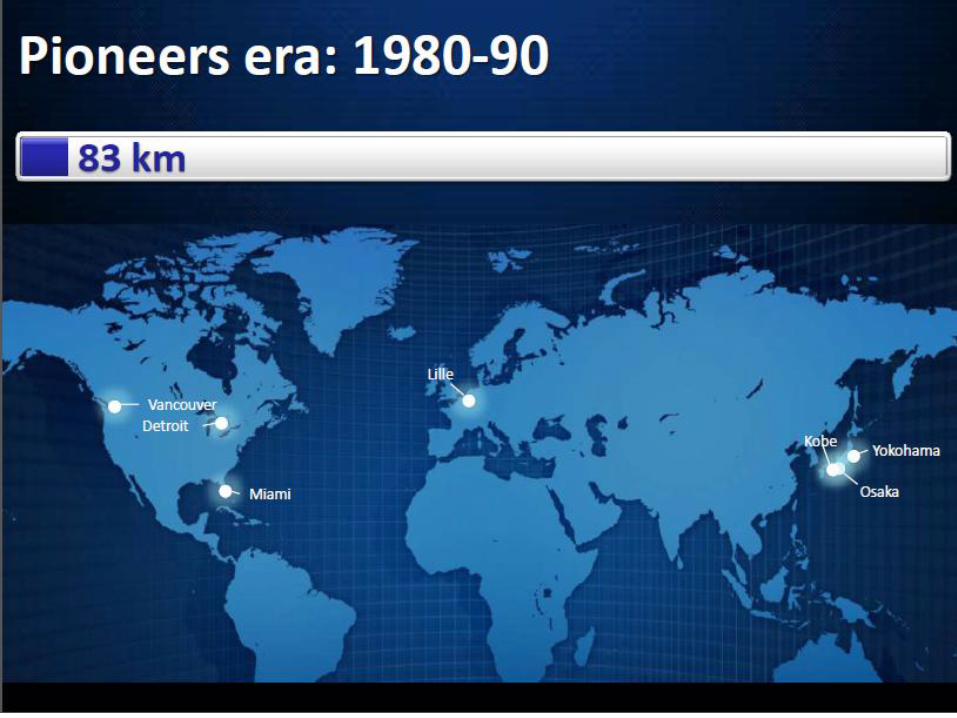
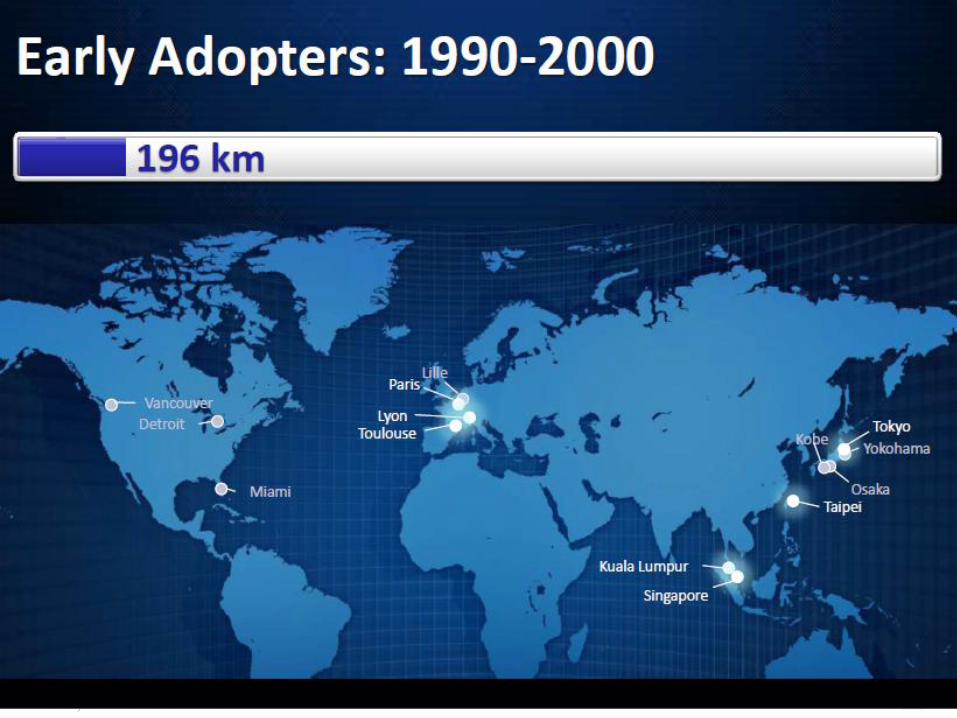
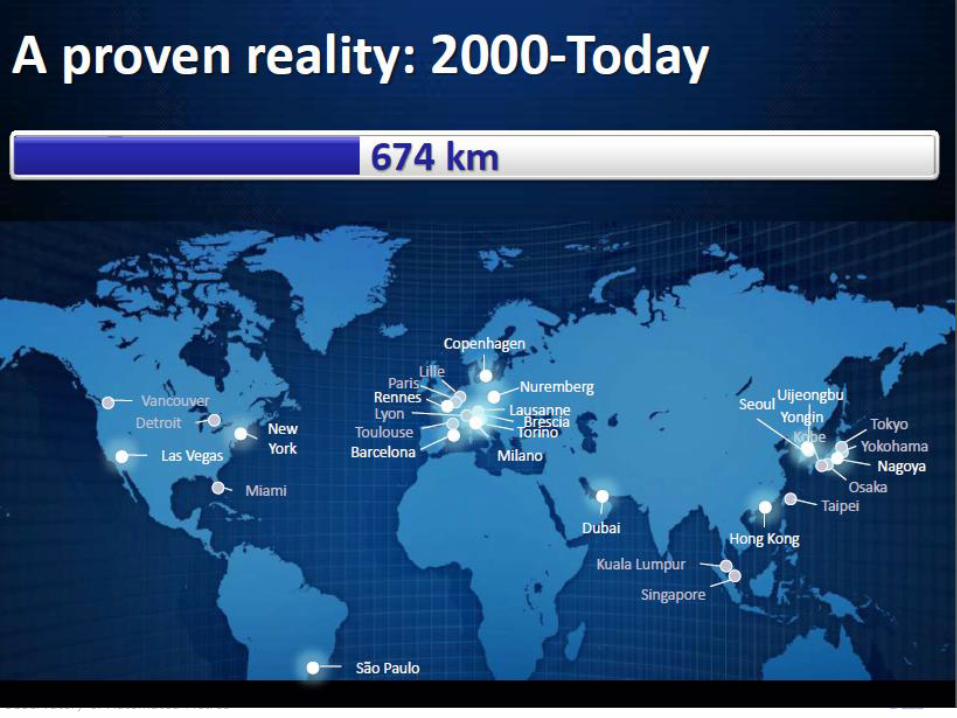
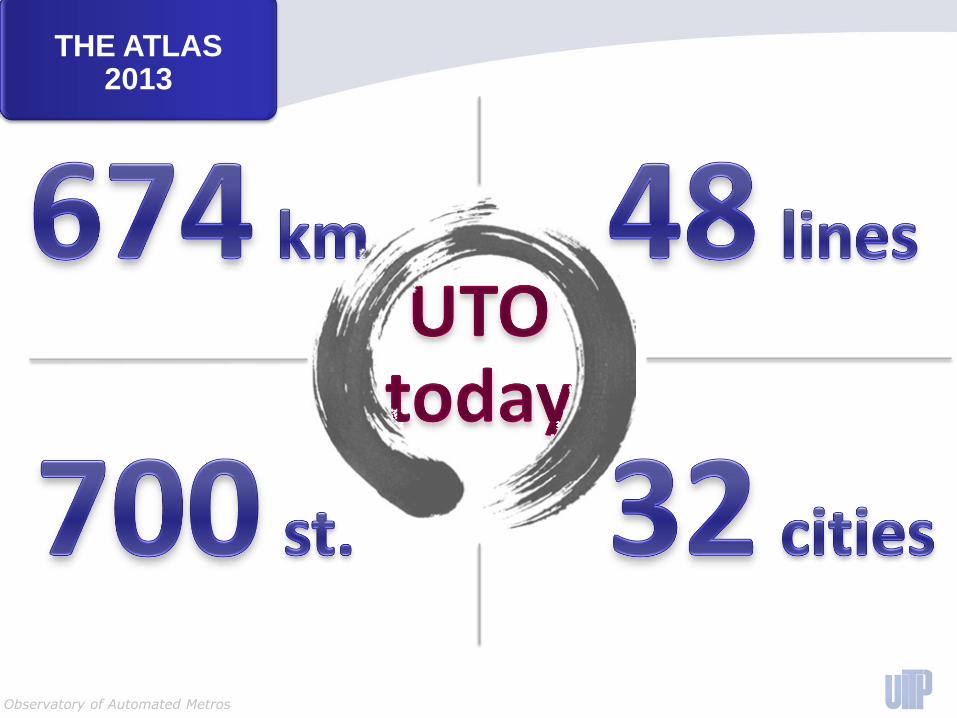
THE ATLAS2013
Observatory of Automated Metros
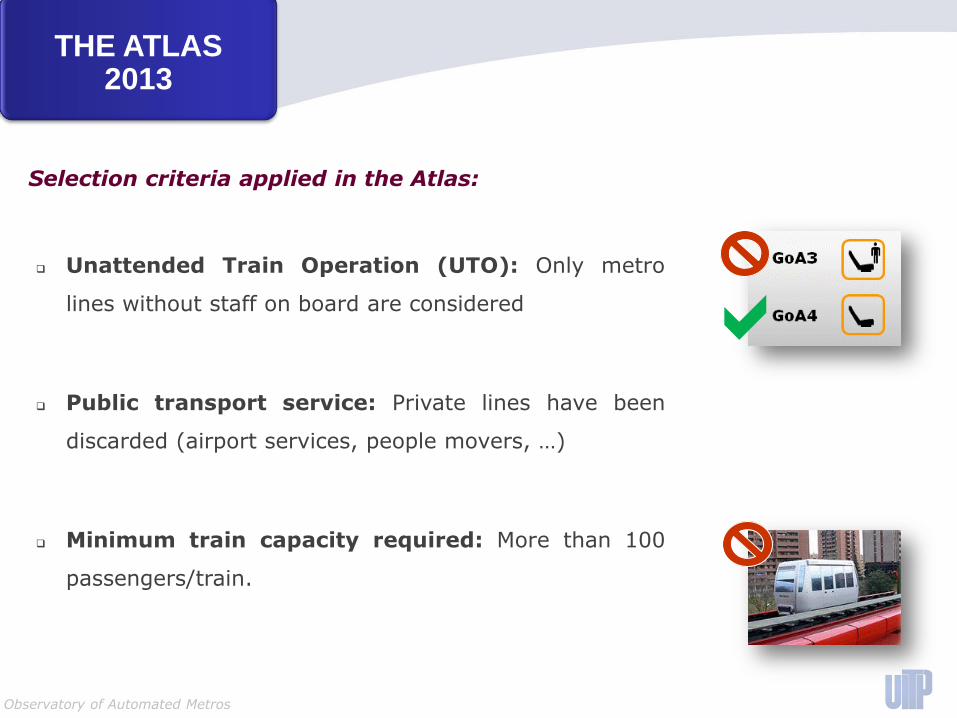
Unattended Train Operation (UTO): Only metro
lines without staff on board are considered
Public transport service: Private lines have been
discarded (airport services, people movers, …)
Minimum train capacity required: More than 100
passengers/train.
a
Selection criteria applied in the Atlas:
THE ATLAS2013
Observatory of Automated Metros
Observatory of Automated Metros
Observatory of Automated Metros
Observatory of Automated Metros
THE ATLAS2013
Observatory of Automated Metros
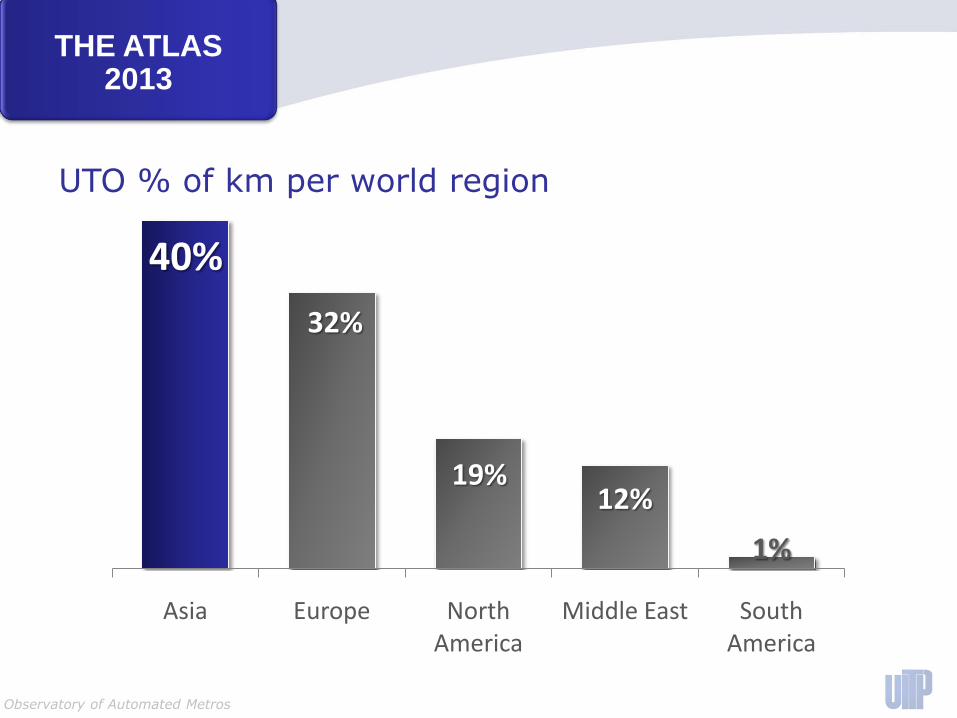
Asia Europe North America
Middle East South America
40%
32%
19%12%
1%
THE ATLAS2013
UTO % of km per world region
Observatory of Automated Metros
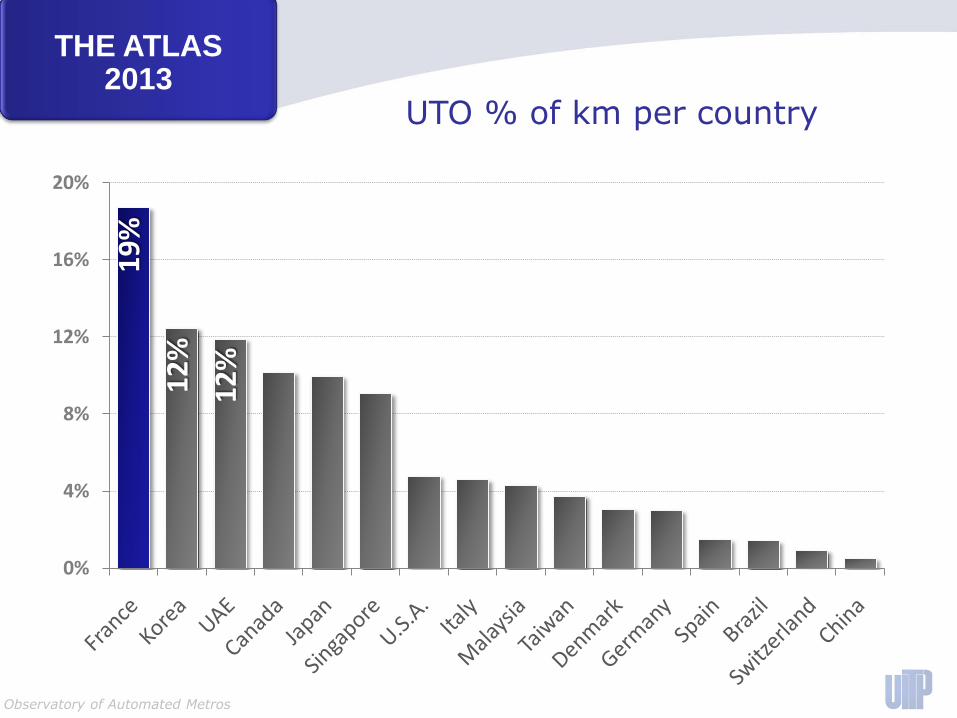
0%
4%
8%
12%
16%
20%
19
%
12
%
12
%
THE ATLAS2013
UTO % of km per country
Observatory of Automated Metros
0
10
20
30
40
50
60
70
80
90
Du
bai
Van
cou
ver
Sin
gap
ore
Lille
Bu
san
Pari
s
Ku
ala
Lum
pu
r
Tou
lou
se
Taip
ei
Toky
o
Co
pen
hag
en
Nu
rem
ber
g
Seo
ul
Yon
gin
Ko
be
Bre
scia
Tori
no
New
Yo
rk
Lyo
n
Uije
on
gbu
Yoko
ham
a
Bar
celo
na
São
Pau
lo
Nag
oya
(A
ich
i)
Ren
nes
Osa
ka
Las
Veg
as
Mia
mi
Lau
san
ne
Det
roit
Mila
no
Ho
ng
Ko
ng
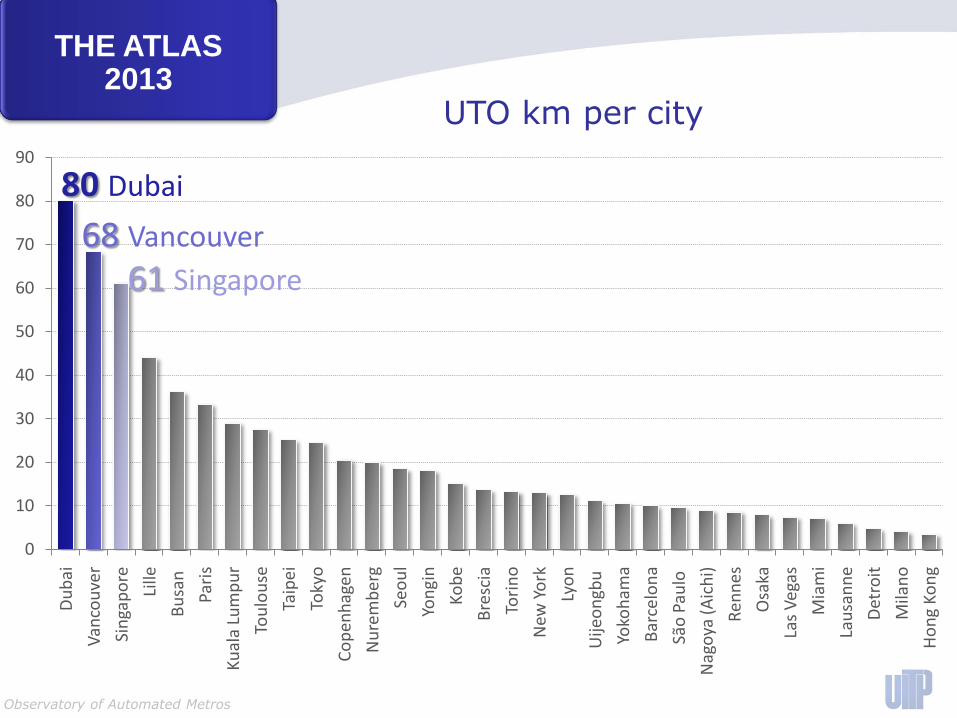
80 Dubai
68 Vancouver
61 Singapore
THE ATLAS2013
UTO km per city
Observatory of Automated Metros
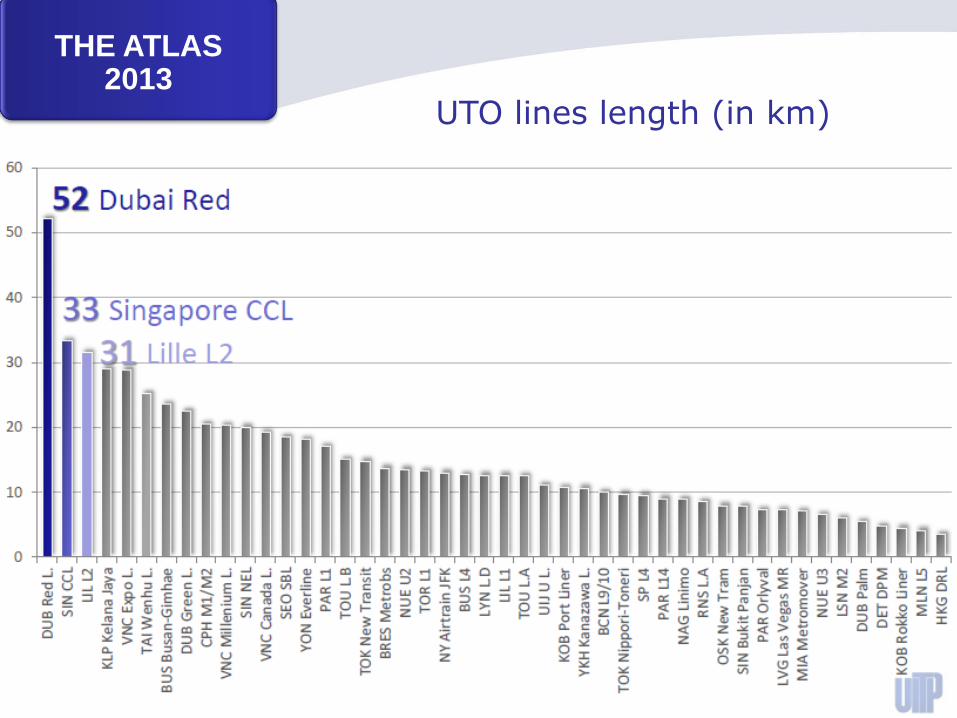
THE ATLAS2013
UTO lines length (in km)
Observatory of Automated Metros
-40
-30
-20
-10
0
10
20
LIL
L2SI
N C
CL
PAR
L1
TOR
L1
TOU
L.B
TOU
L.A
NU
E U
2SI
N N
ELLY
N L
.DLS
N M
2LI
L L1
BR
ES M
etro
bs
RN
S L.
AB
CN
L9
/10
CP
H M
1/M
2B
US
L4N
UE
U3
VN
C C
anad
a L.
PAR
L1
4M
LN L
5D
UB
Gre
en
L.
SEO
SB
LSP
L4
KLP
Kel
ana
Jaya
DU
B R
ed L
.V
NC
Exp
o L
.V
NC
Mill
eniu
m L
.TA
I Wen
hu
L.
BU
S B
usa
n-G
imh
aeM
IA M
etro
mo
ver
TOK
New
Tra
nsi
tU
IJ U
L.
YON
Eve
rlin
eSI
N B
uki
t Pa
nja
nYK
H K
anaz
awa
L.D
ET D
PM
TOK
Nip
po
ri-T
on
eri
KOB
Po
rt L
iner
NY
Air
trai
n J
FKO
SK N
ew T
ram
NA
G L
inim
oLV
G L
as V
egas
MR
KOB
Ro
kko
Lin
erD
UB
Pal
mPA
R O
rlyv
alH
KG D
RL
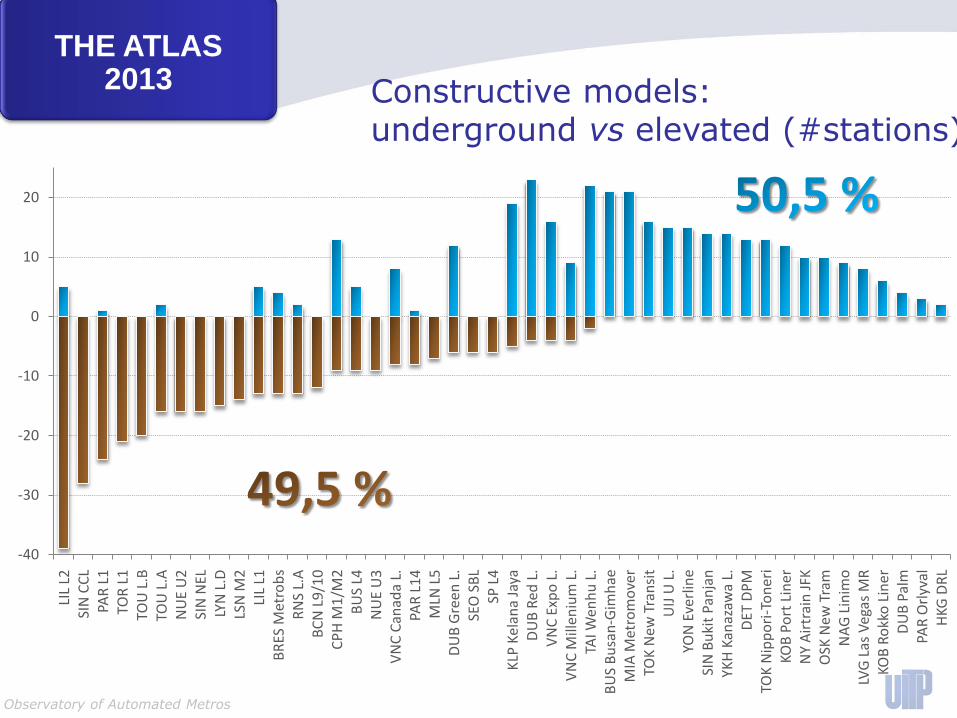
THE ATLAS2013 Constructive models:
underground vs elevated (#stations)
Observatory of Automated Metros
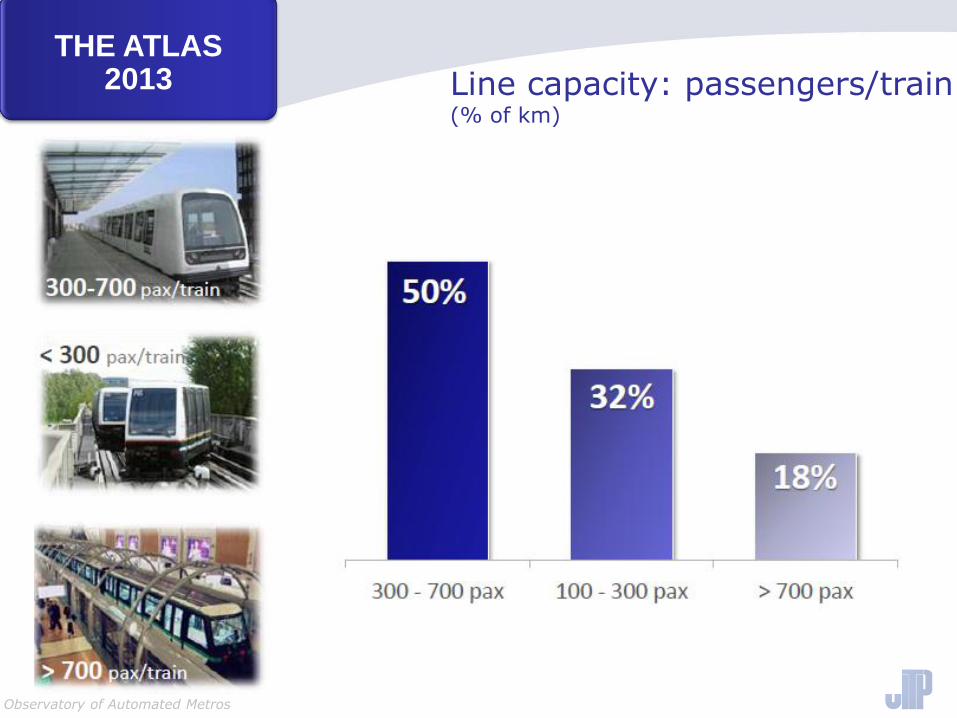
THE ATLAS2013 Line capacity: passengers/train
(% of km)
Observatory of Automated Metros
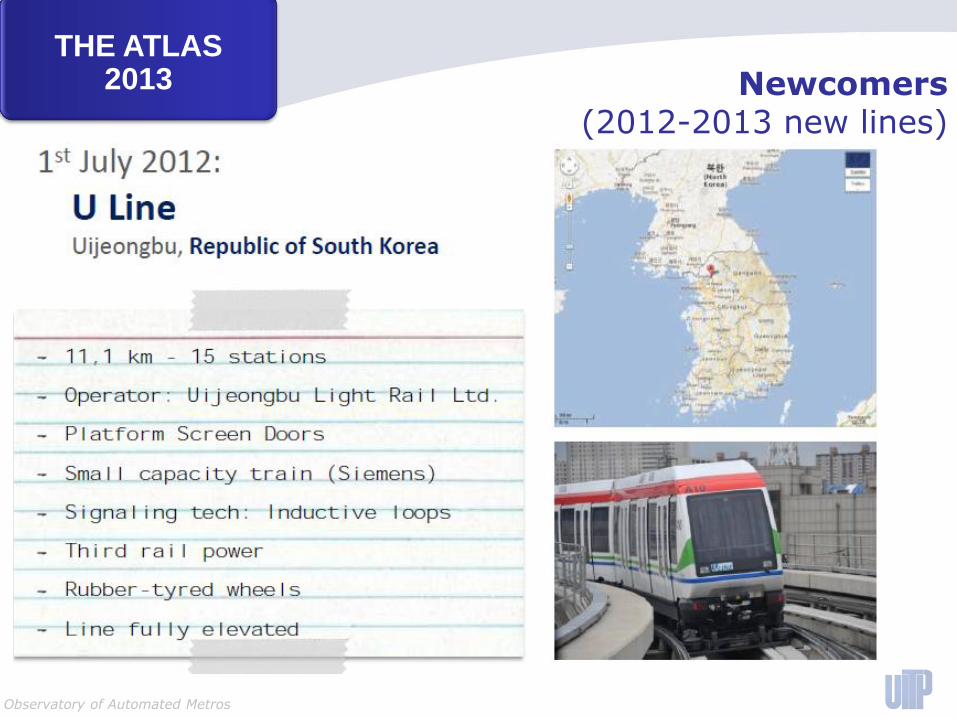
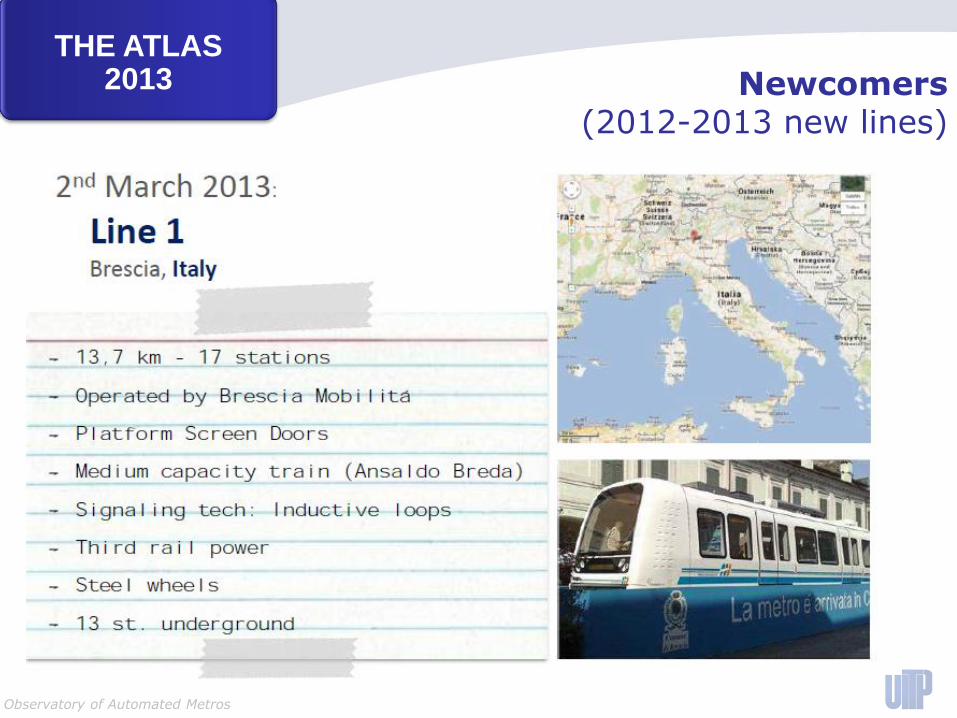
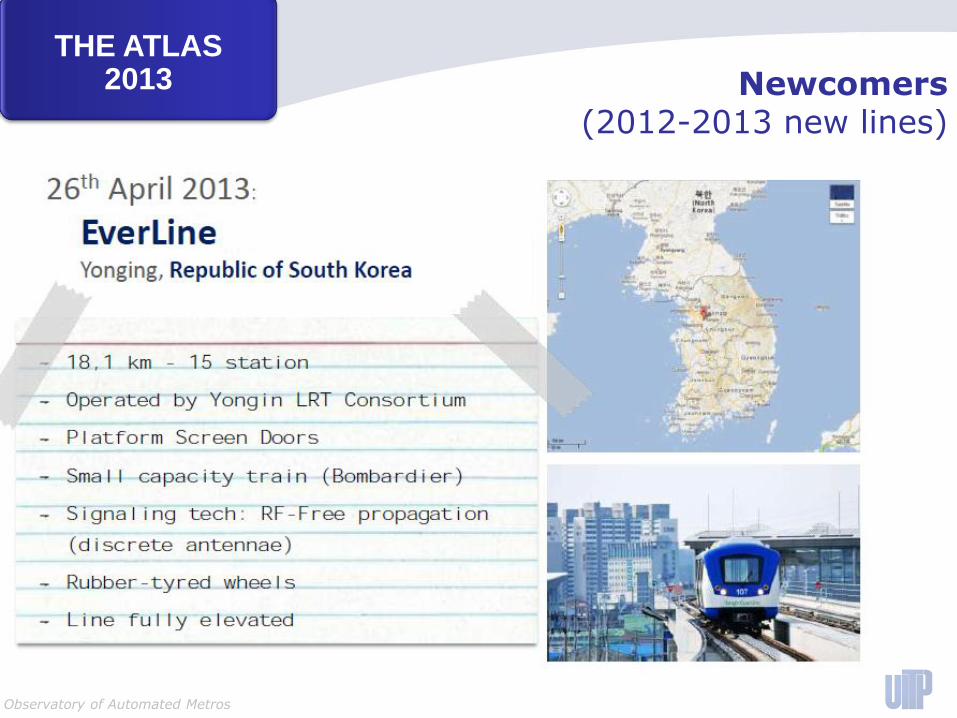
THE ATLAS2013 Newcomers
(2012-2013 new lines)
Observatory of Automated Metros
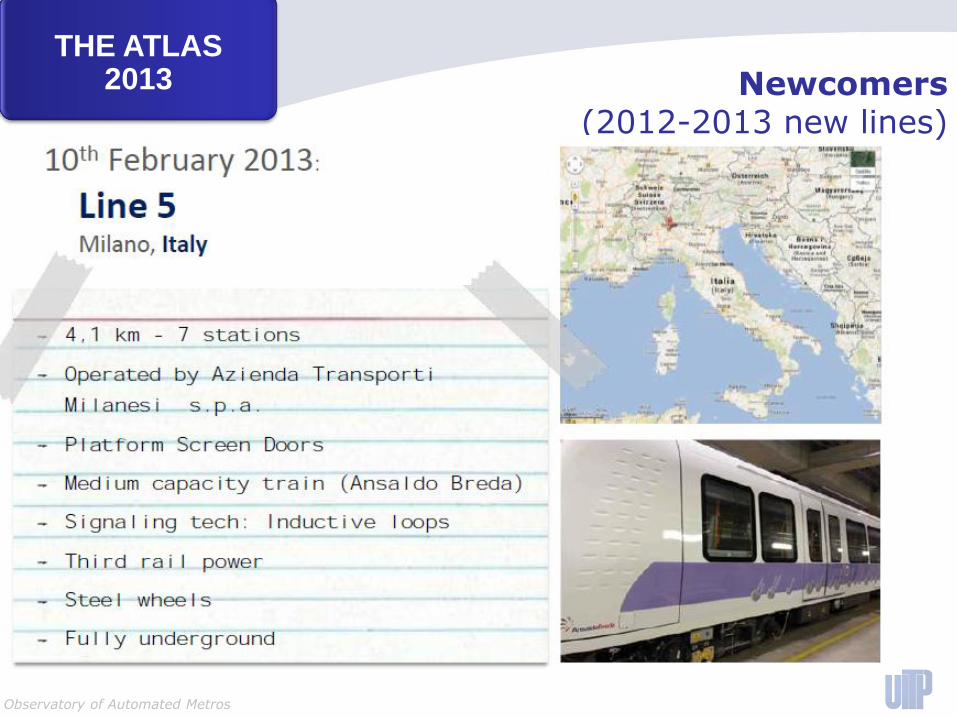
THE ATLAS2013 Newcomers
(2012-2013 new lines)
Observatory of Automated Metros
THE ATLAS2013 Newcomers
(2012-2013 new lines)
Observatory of Automated Metros
THE ATLAS2013 Newcomers
(2012-2013 new lines)
Observatory of Automated Metros
0
50
100
150
200
250
20
02
20
03
20
04
20
05
20
06
20
07
20
08
20
09
20
10
20
11
20
12
20
13
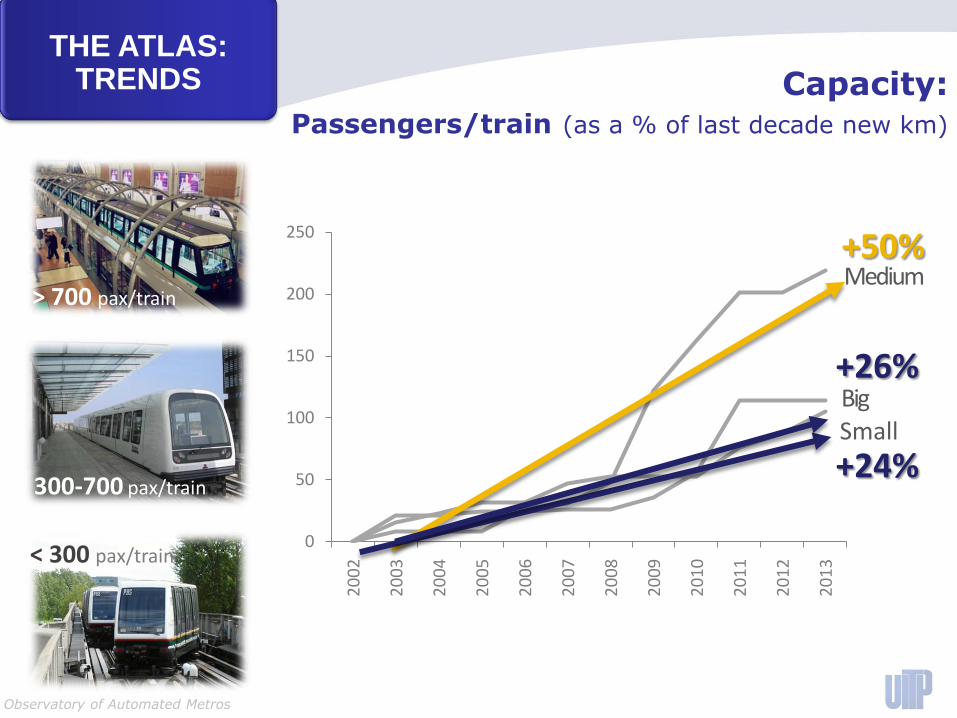
+50%
+26%
+24%
Medium
SmallBig
< 300 pax/train
300-700 pax/train
> 700 pax/train
THE ATLAS:TRENDS Capacity:
Passengers/train (as a % of last decade new km)
Observatory of Automated Metros
0
50
100
150
200
20
02
20
03
20
04
20
05
20
06
20
07
20
08
20
09
20
10
20
11
20
12
20
13
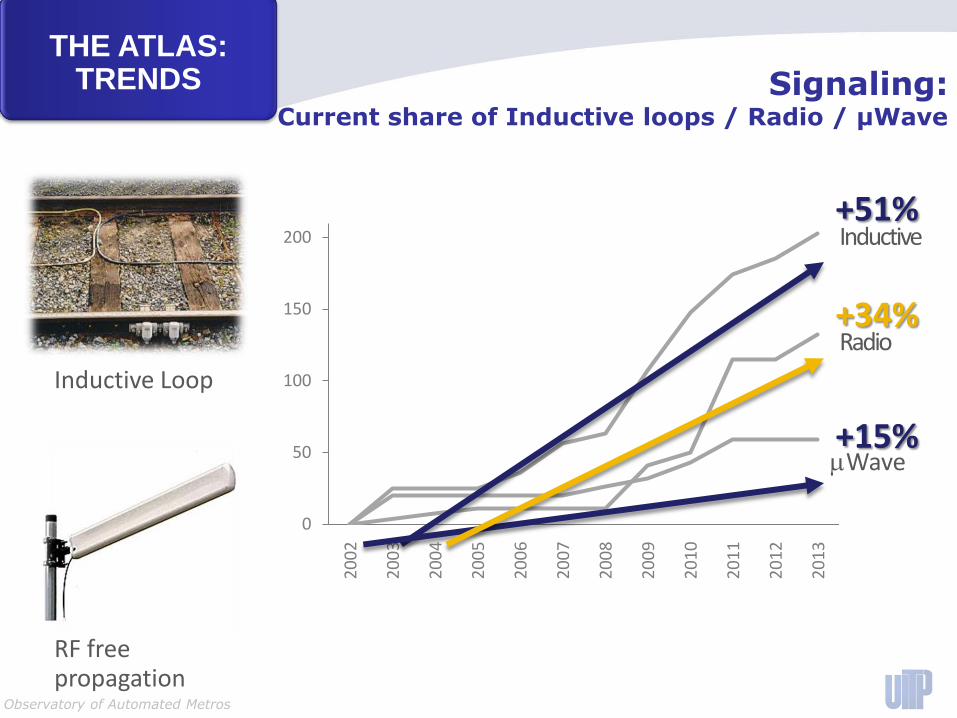
+51%
+34%
+15%
Inductive Loop
RF free propagation
Inductive
Wave
Radio
Signaling:Current share of Inductive loops / Radio / µWave
THE ATLAS:TRENDS
Observatory of Automated Metros
0
50
100
150
200
250
300
350
400
20
02
20
03
20
04
20
05
20
06
20
07
20
08
20
09
20
10
20
11
20
12
20
13
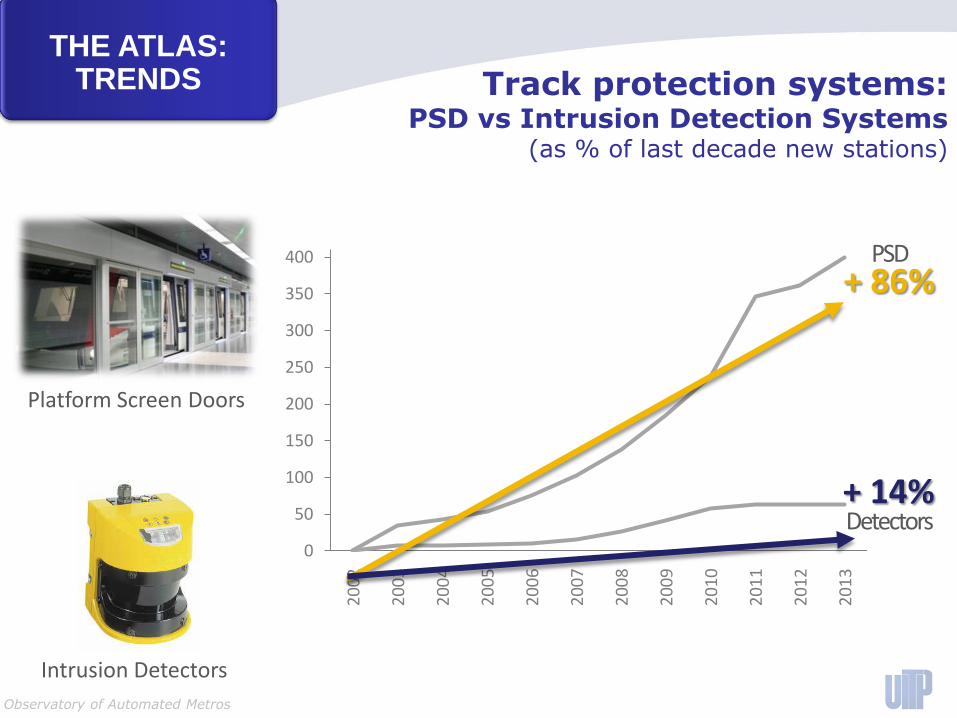
+ 86%
+ 14%
PSD
Detectors
Platform Screen Doors
Intrusion Detectors
THE ATLAS:TRENDS Track protection systems:
PSD vs Intrusion Detection Systems (as % of last decade new stations)
Observatory of Automated Metros
0
50
100
150
200
250
300
20
02
20
03
20
04
20
05
20
06
20
07
20
08
20
09
20
10
20
11
20
12
20
13
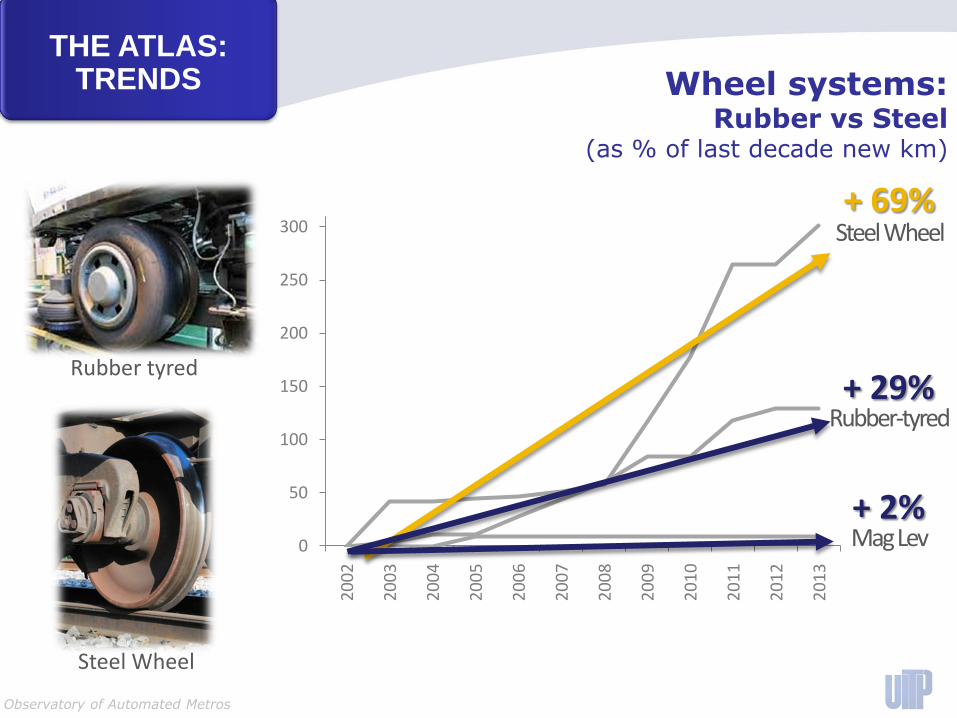
+ 69%
+ 2%
Steel Wheel
Mag Lev
Steel Wheel
Rubber tyred
Rubber-tyred+ 29%
THE ATLAS:TRENDS Wheel systems:
Rubber vs Steel(as % of last decade new km)
Observatory of Automated Metros
0
50
100
150
200
250
20
02
20
03
20
04
20
05
20
06
20
07
20
08
20
09
20
10
20
11
20
12
20
13
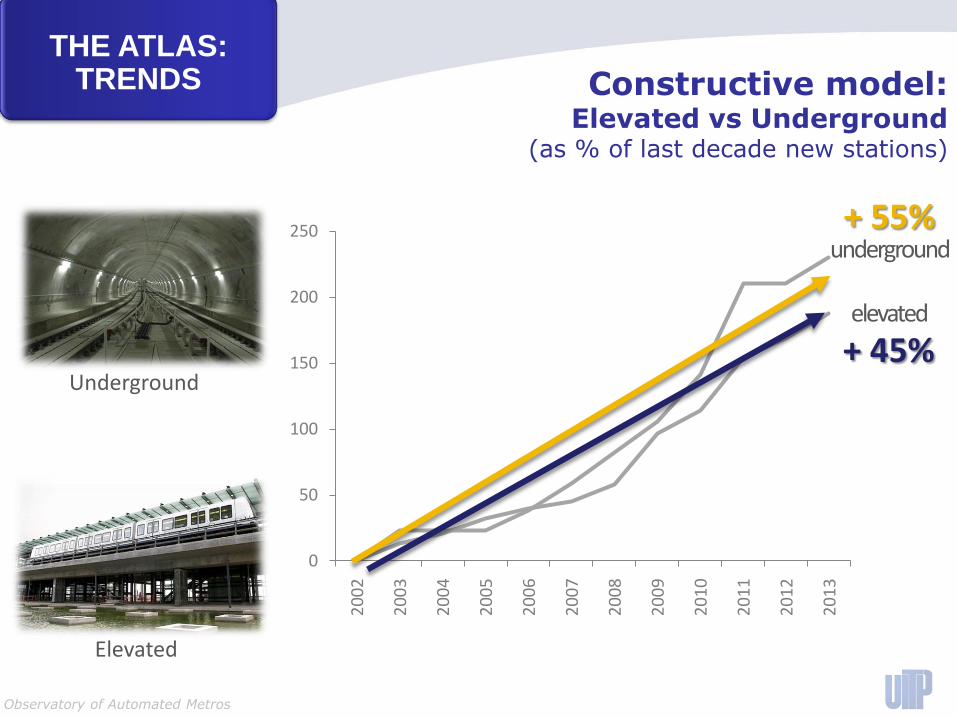
+ 55%
+ 45%
underground
elevated
Underground
Elevated
THE ATLAS:TRENDS Constructive model:
Elevated vs Underground(as % of last decade new stations)
Observatory of Automated Metros
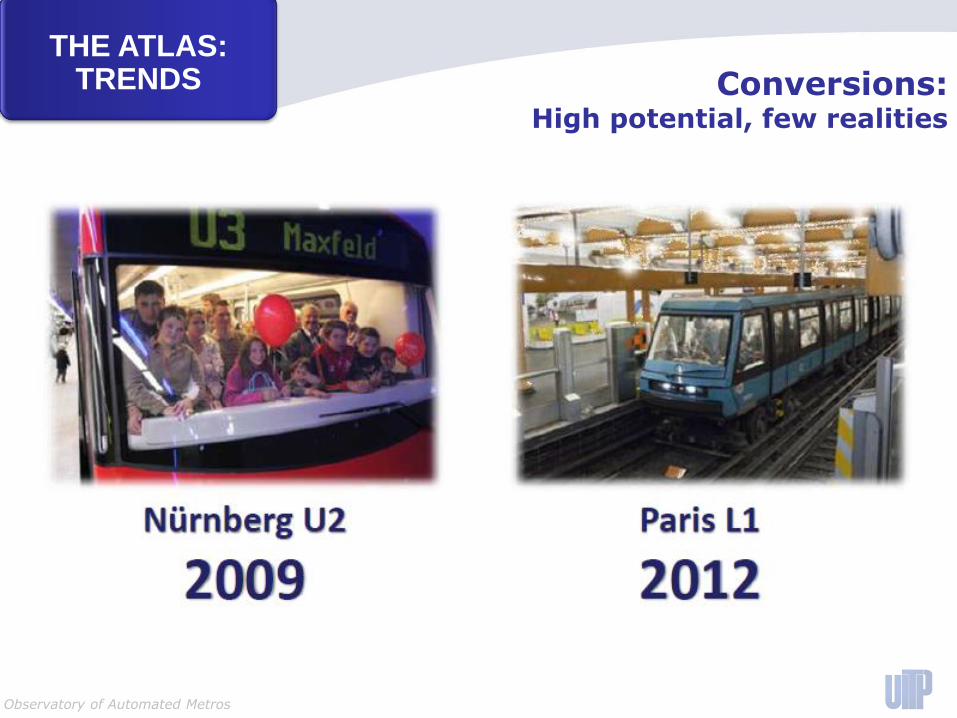
THE ATLAS:TRENDS Conversions:
High potential, few realities
Observatory of Automated Metros
0
200
400
600
800
1000
1200
1400
1600
1800
2000
19
81
19
83
19
85
19
87
19
89
19
91
19
93
19
95
19
97
19
99
20
01
20
03
20
05
20
07
20
09
20
11
20
13
20
15
20
17
20
19
20
21
20
23
20
25
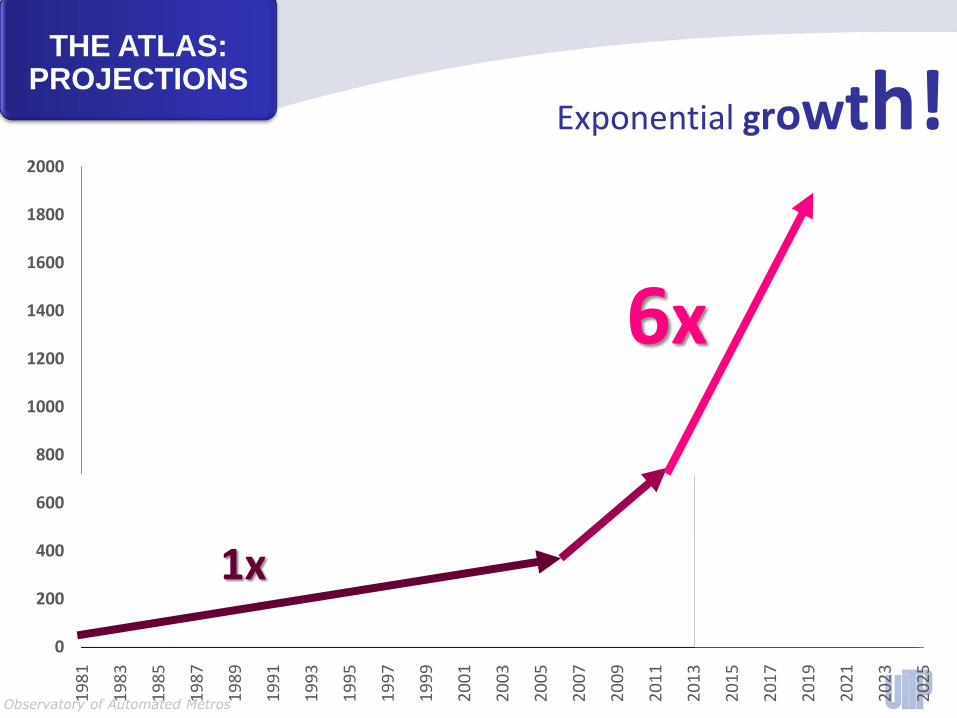
Exponential growth!
1x
6x
THE ATLAS:PROJECTIONS
Observatory of Automated Metros
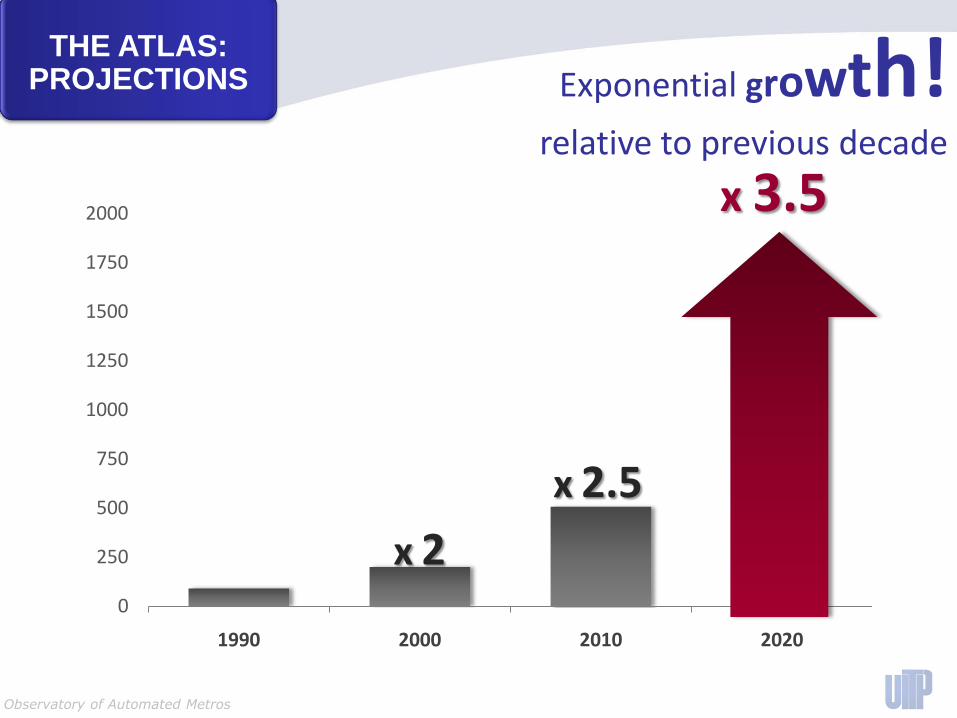
Exponential growth! relative to previous decade
0
250
500
750
1000
1250
1500
1750
2000
1990 2000 2010 2020
x 2
x 2.5
x 3.5
THE ATLAS:PROJECTIONS
Observatory of Automated Metros
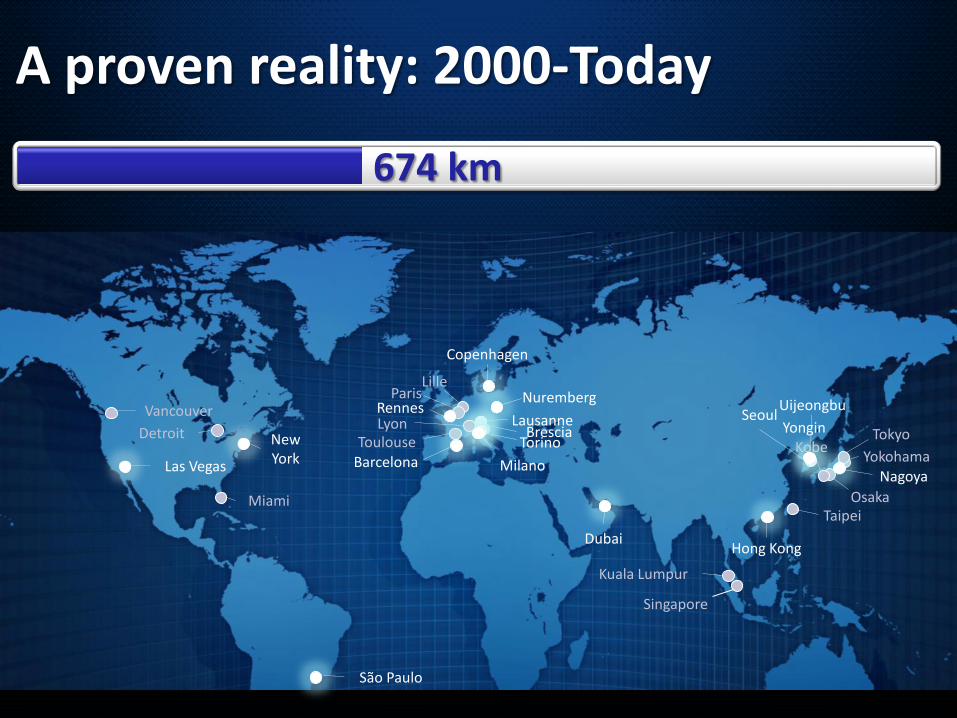
Busan
Lausanne
TorinoBrescia
674 km
A proven reality: 2000-Today
Lille
Vancouver
Osaka
Yokohama
Lyon
Paris
Tokyo
Taipei
Kuala Lumpur
Singapore
ToulouseBarcelona
Copenhagen
NurembergRennes
Nagoya
Hong Kong
Las Vegas Kobe
Dubai
São Paulo
Seoul
New York
Detroit
Miami
Milano
Uijeongbu
Yongin
Observatory of Automated Metros
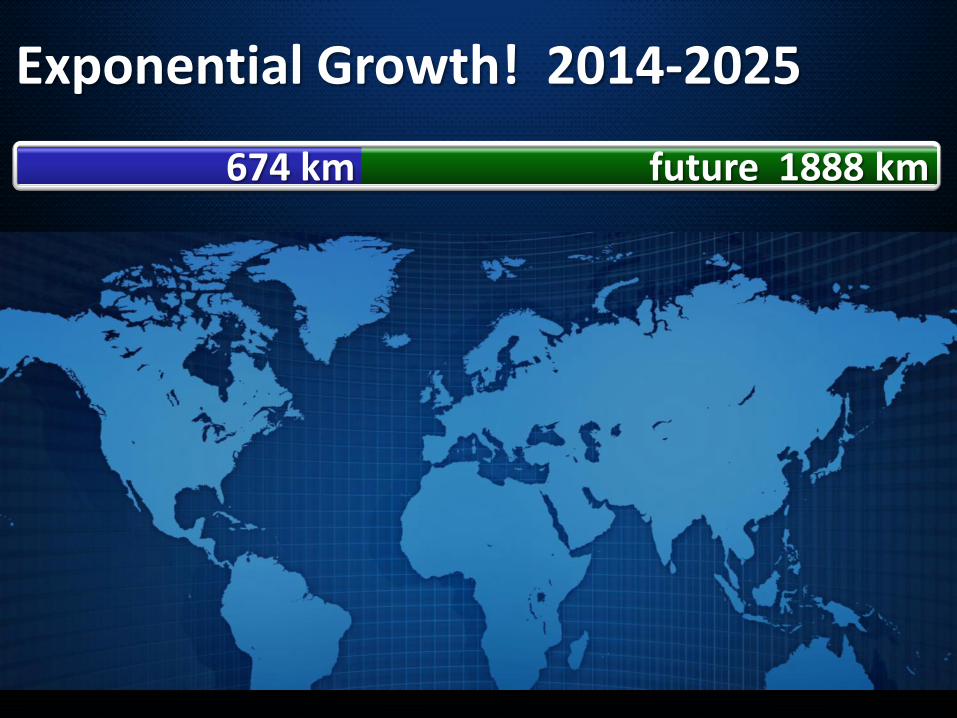
674 km
Exponential Growth! 2014-2025
future 1888 km
Observatory of Automated Metros
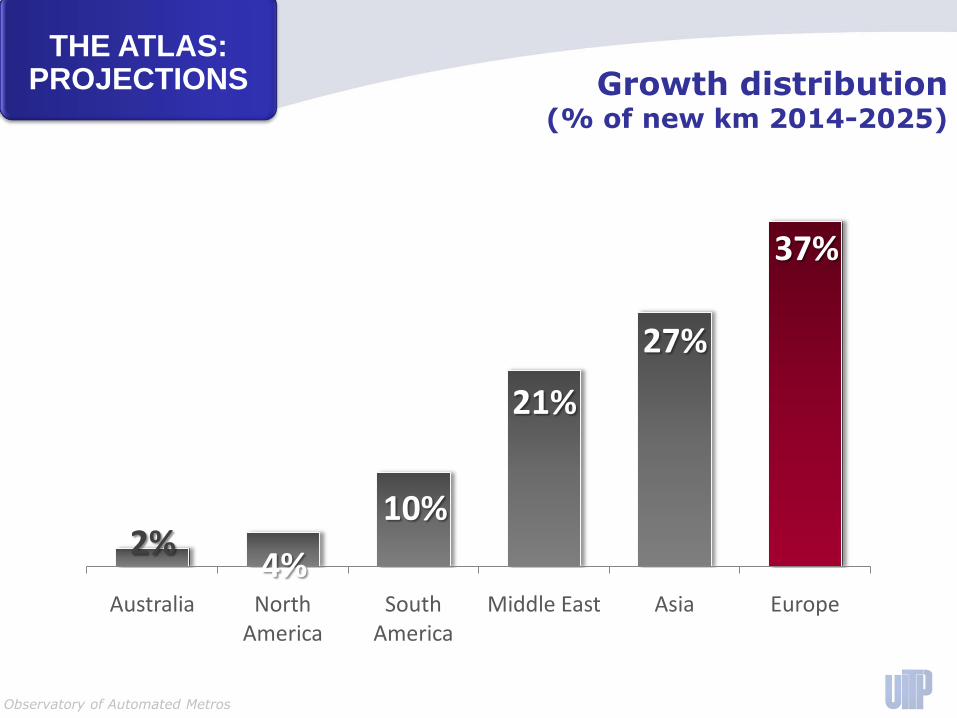
Australia North America
South America
Middle East Asia Europe
37%
27%
21%
4%
10%2%
THE ATLAS:PROJECTIONS Growth distribution
(% of new km 2014-2025)
Observatory of Automated Metros
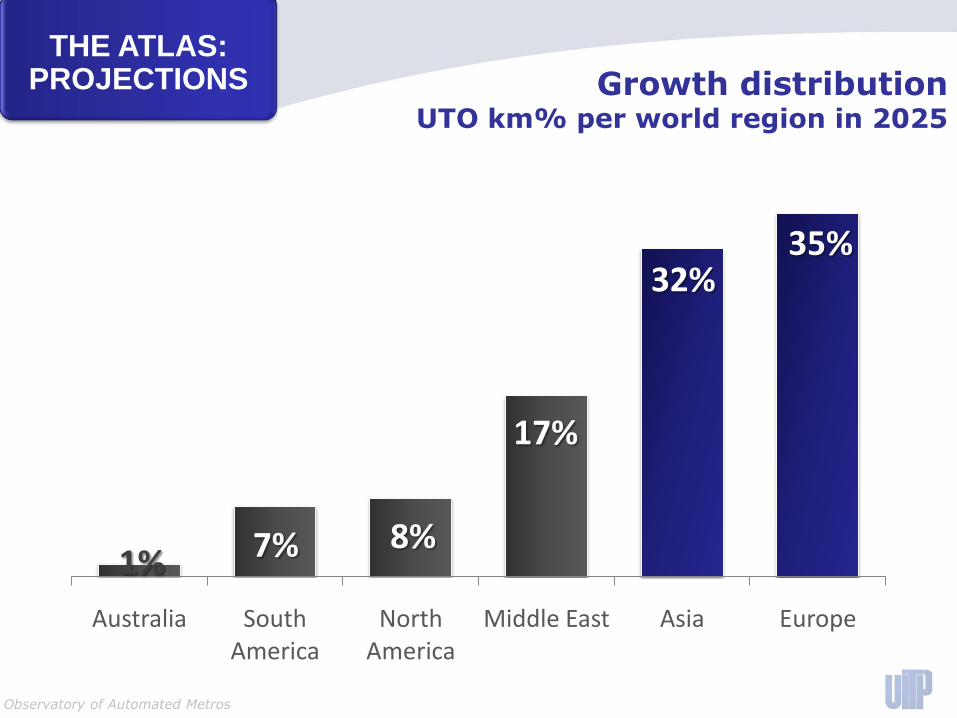
Australia South America
North America
Middle East Asia Europe
35%32%
17%
8%7%1%
THE ATLAS:PROJECTIONS Growth distribution
UTO km% per world region in 2025
Observatory of Automated Metros
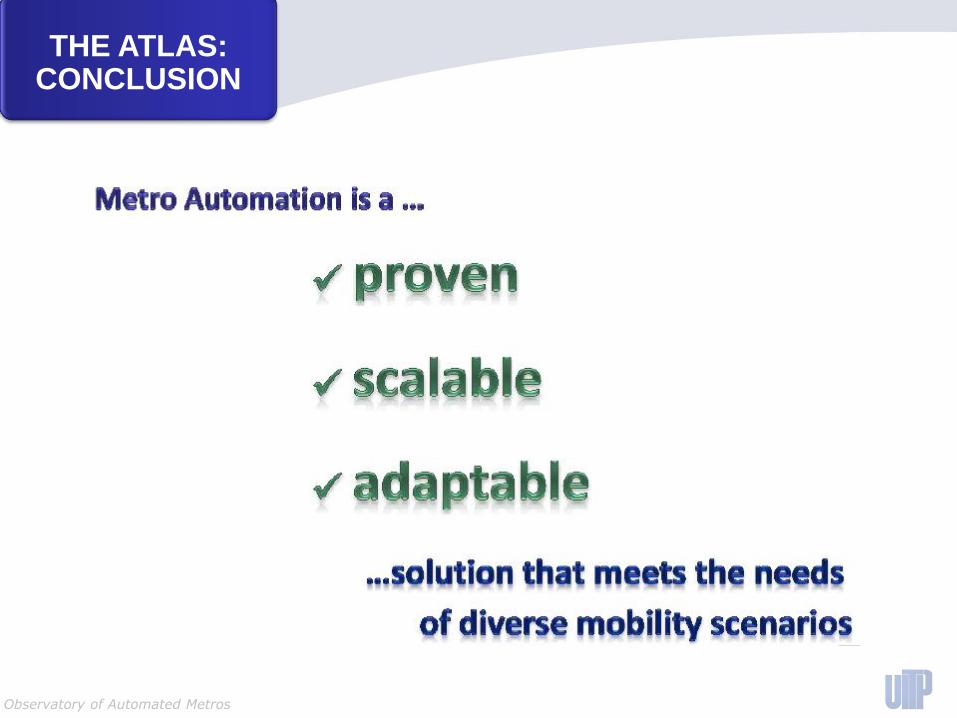
THE ATLAS:CONCLUSION
Observatory of Automated Metros
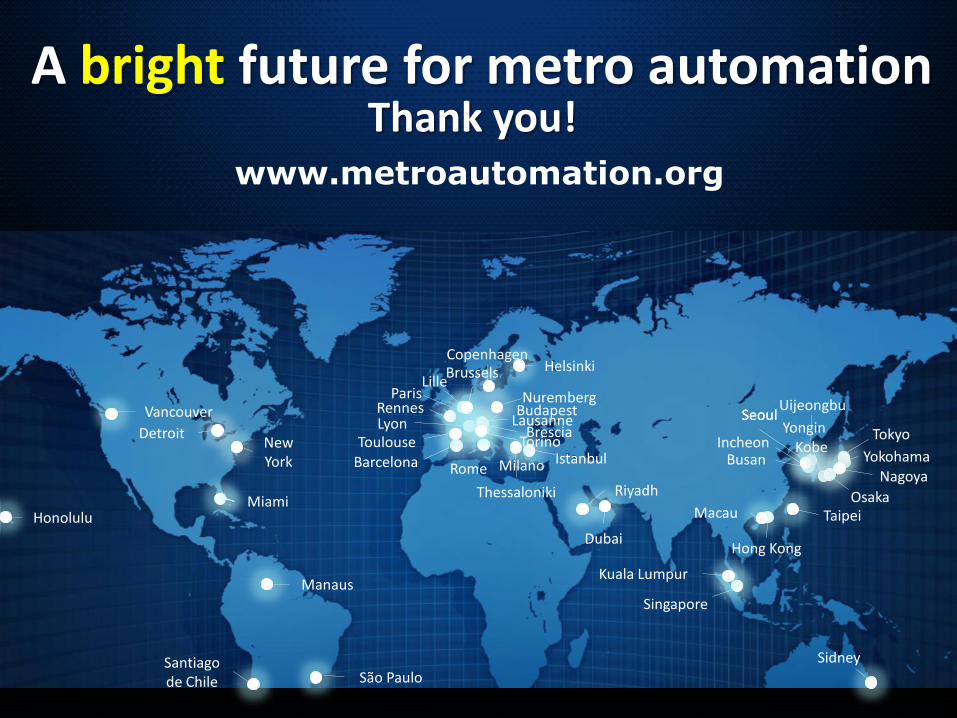
A bright future for metro automationThank you!
LausanneBrescia
Milano
Lyon
Paris
Singapore
Taipei
Kuala Lumpur
Barcelona
Rennes
Copenhagen
Toulouse
Dubai
São Paulo
Seoul
Brussels Helsinki
Honolulu
IncheonIstanbul
Macau
Manaus
Budapest
Riyadh
Rome
Santiago de Chile
Sidney
Thessaloniki
Vancouver
New York
Miami
Detroit
Lille
Hong Kong
KobeBusan
SeoulUijeongbu
Yongin
Osaka
Yokohama
Tokyo
Nagoya
Nuremberg
Torino
www.metroautomation.org