obsidian energy investor day from the quarter •generally a soft quarter: short on volumes, active...
TRANSCRIPT
Obsidian Energy
Investor DayNovember 15, 2018
Important Notice to the Readers
2
This presentation should be read in conjunction with the Company’s unaudited consolidated financial statements, Management's Discussion and Analysis ("MD&A") for the three and nine months ended September 30, 2018. All dollar amounts contained in this presentation are expressed in millions of Canadian dollars unless otherwise indicated.
Certain financial measures included in this presentation do not have a standardized meaning prescribed by International Financial Reporting Standards (“IFRS”) and therefore are considered non-generally accepted accounting practice ("non-GAAP") measures; accordingly, they may not be comparable to similar measures provided by other issuers. This presentation also contains oil and gas disclosures, various industry terms, and forward-looking statements, including various assumptions on which such forward-looking statements are based and related risk factors. Please see the Company's disclosures located in the Appendix & Endnotes at the end of this presentation for further details regarding these matters.
Agenda
3
1. Q3 2018 Discussion
2. 2019 Outlook
3. Strategic Priorities
4. Cardium Overview
5. Other Assets
6. Achieving Our Priorities
Break for Q&A
Break for Q&A
Q&A & Wrap-up

Mark Hodgson
Vice President,
Operations and E&P Services
Andrew Sweerts
Vice President, Business
Development & Commercial
Aaron Smith
Vice President,
Development
Executive Team
David French
President and
Chief Executive Officer
David Hendry
Chief Financial Officer
4
Q3 2018 Discussion
Highlights from the Quarter
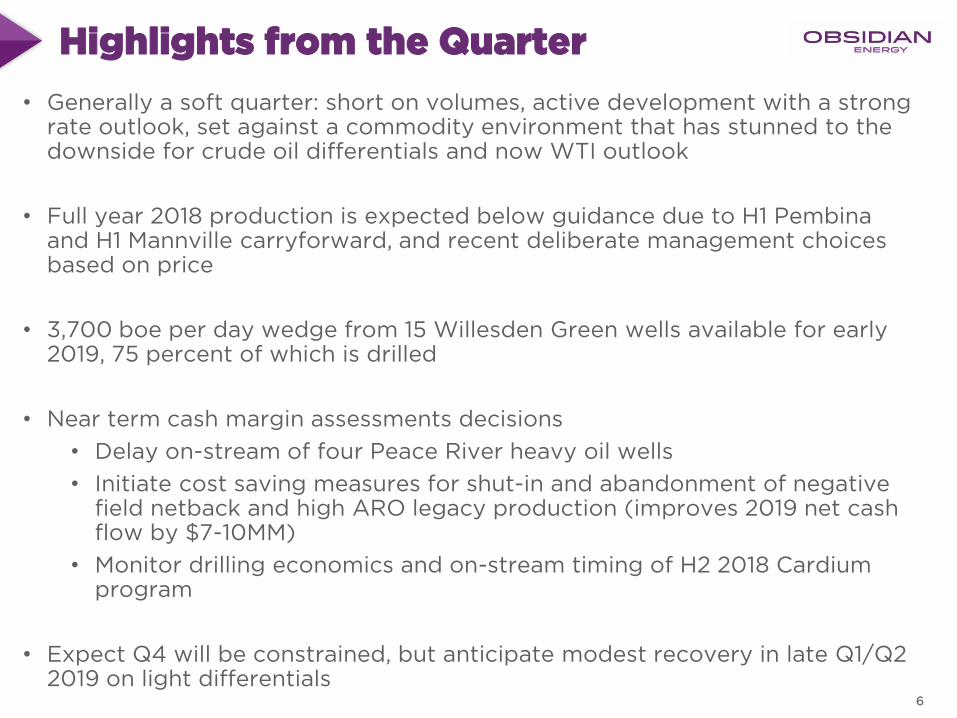
• Generally a soft quarter: short on volumes, active development with a strong rate outlook, set against a commodity environment that has stunned to the downside for crude oil differentials and now WTI outlook
• Full year 2018 production is expected below guidance due to H1 Pembina and H1 Mannville carryforward, and recent deliberate management choices based on price
• 3,700 boe per day wedge from 15 Willesden Green wells available for early 2019, 75 percent of which is drilled
• Near term cash margin assessments decisions
• Delay on-stream of four Peace River heavy oil wells
• Initiate cost saving measures for shut-in and abandonment of negative field netback and high ARO legacy production (improves 2019 net cash flow by $7-10MM)
• Monitor drilling economics and on-stream timing of H2 2018 Cardium program
• Expect Q4 will be constrained, but anticipate modest recovery in late Q1/Q2 2019 on light differentials
6
Pricing Assumptions
7
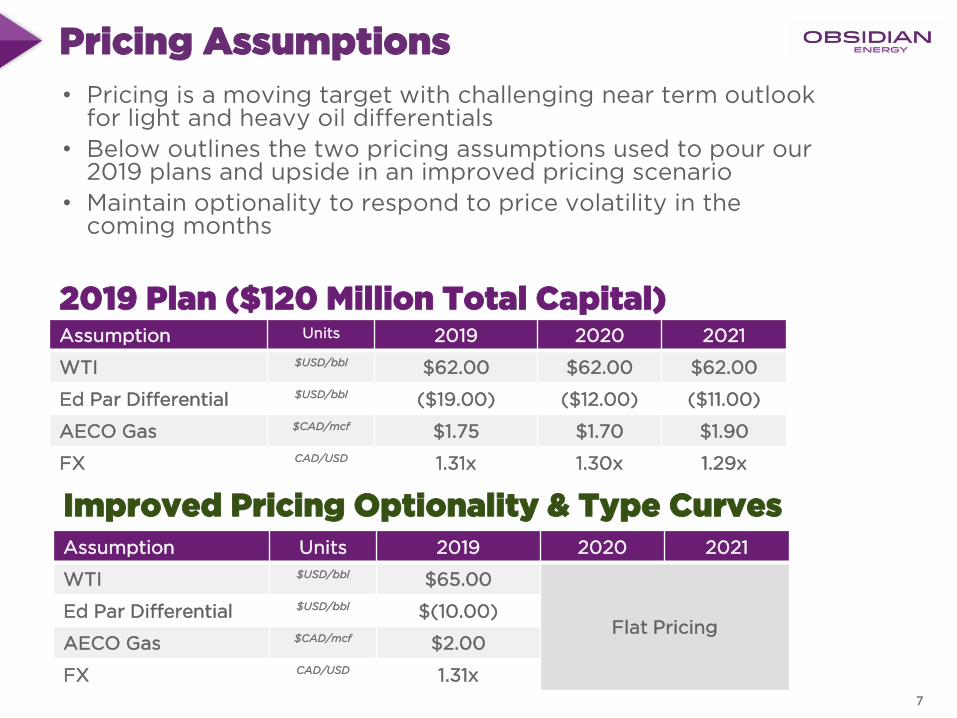
Assumption Units 2019 2020 2021
WTI $USD/bbl $65.00
Flat PricingEd Par Differential $USD/bbl $(10.00)
AECO Gas $CAD/mcf $2.00
FX CAD/USD 1.31x
Improved Pricing Optionality & Type Curves
2019 Plan ($120 Million Total Capital)
• Pricing is a moving target with challenging near term outlook for light and heavy oil differentials
• Below outlines the two pricing assumptions used to pour our 2019 plans and upside in an improved pricing scenario
• Maintain optionality to respond to price volatility in the coming months
Assumption Units 2019 2020 2021
WTI $USD/bbl $62.00 $62.00 $62.00
Ed Par Differential $USD/bbl ($19.00) ($12.00) ($11.00)
AECO Gas $CAD/mcf $1.75 $1.70 $1.90
FX CAD/USD 1.31x 1.30x 1.29x
Topics of Interest Post Q3 Release
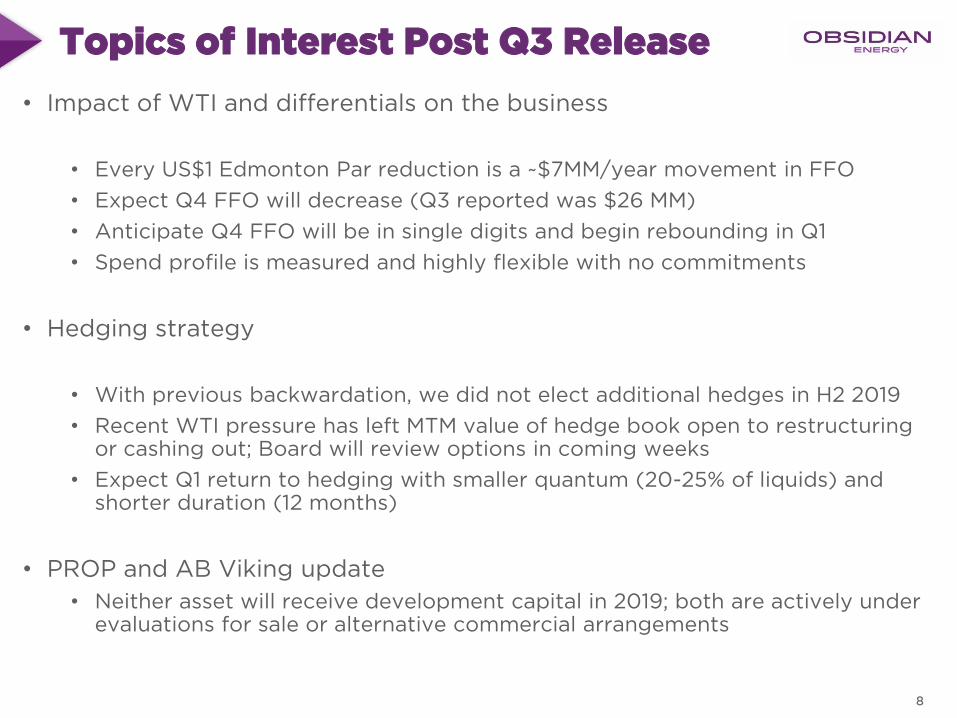
• Impact of WTI and differentials on the business
• Every US$1 Edmonton Par reduction is a ~$7MM/year movement in FFO
• Expect Q4 FFO will decrease (Q3 reported was $26 MM)
• Anticipate Q4 FFO will be in single digits and begin rebounding in Q1
• Spend profile is measured and highly flexible with no commitments
• Hedging strategy
• With previous backwardation, we did not elect additional hedges in H2 2019
• Recent WTI pressure has left MTM value of hedge book open to restructuring or cashing out; Board will review options in coming weeks
• Expect Q1 return to hedging with smaller quantum (20-25% of liquids) and shorter duration (12 months)
• PROP and AB Viking update
• Neither asset will receive development capital in 2019; both are actively under evaluations for sale or alternative commercial arrangements
8
0
500
1,000
1,500
2,000
2,500
3,000
3,500
4,000
Sep-18 Dec-18 Mar-19 Jun-19 Sep-19
bo
e/d
Willesden Green H2 2018 ProgramSummary
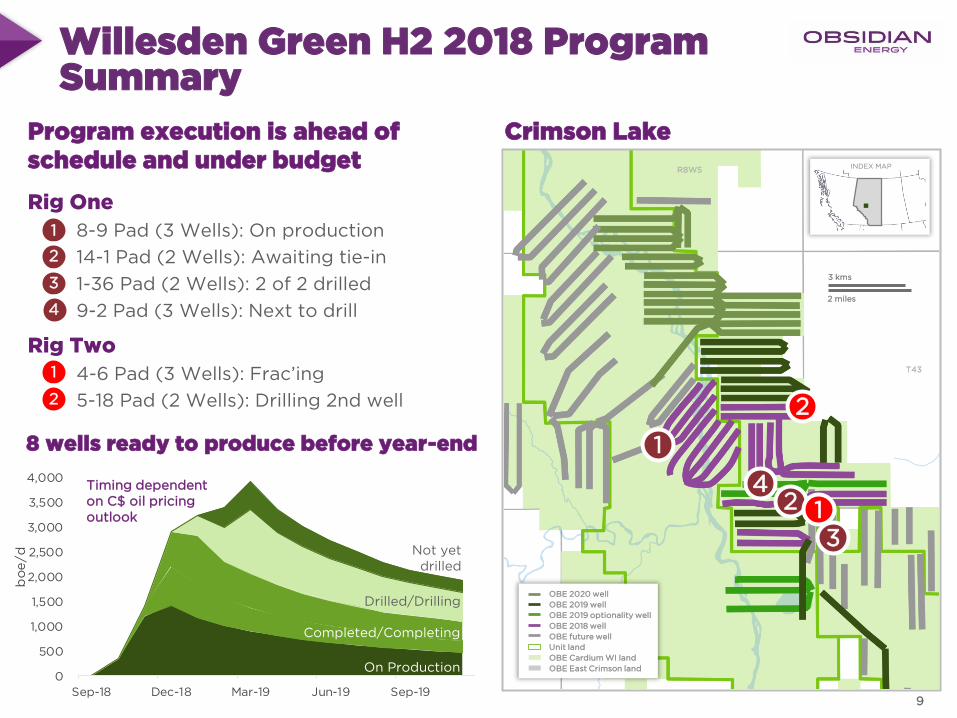
Rig One
8-9 Pad (3 Wells): On production
14-1 Pad (2 Wells): Awaiting tie-in
1-36 Pad (2 Wells): 2 of 2 drilled
9-2 Pad (3 Wells): Next to drill
Rig Two
4-6 Pad (3 Wells): Frac’ing
5-18 Pad (2 Wells): Drilling 2nd well
Program execution is ahead of schedule and under budget
Crimson Lake
1
1
2
2
3
4
8 wells ready to produce before year-end
Timing dependent on C$ oil pricing outlook
On Production
Completed/Completing
Drilled/Drilling
Not yet drilled
2 miles
3 kms
INDEX MAPR8W5
T43
OBE 2020 well
OBE 2019 well
OBE 2019 optionality well
OBE 2018 well
OBE future well
Unit land
OBE Cardium WI land
OBE East Crimson land
4
1
2
31
2
9
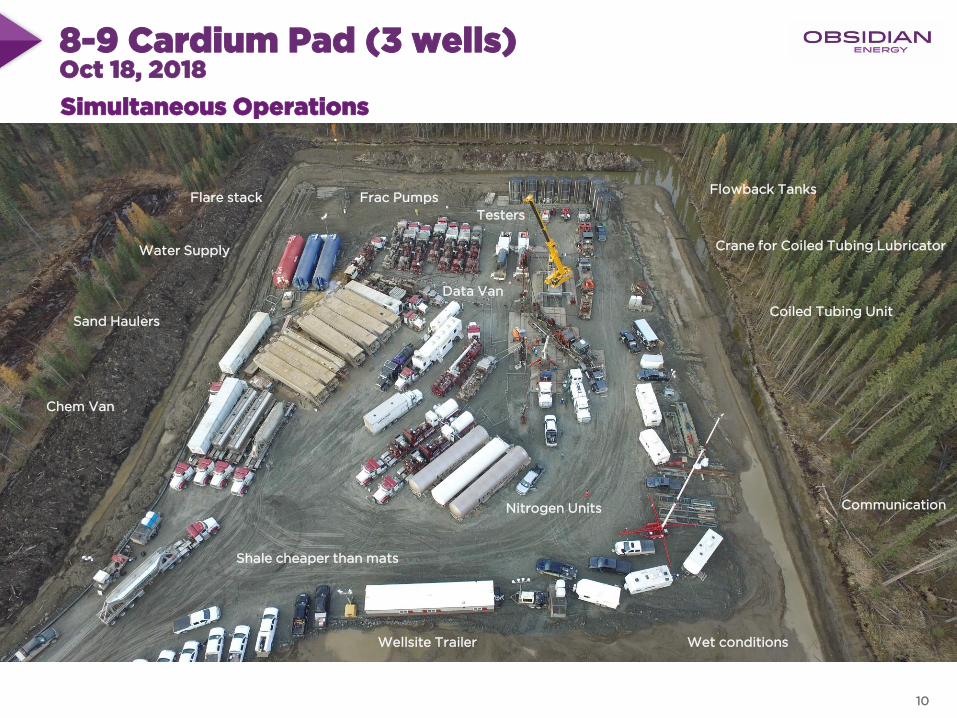
8-9 Cardium Pad (3 wells)Oct 18, 2018
Wet conditions
Frac PumpsFlowback Tanks
Sand Haulers
Crane for Coiled Tubing Lubricator
Coiled Tubing Unit
Water Supply
Shale cheaper than mats
Flare stack
Nitrogen Units
Chem Van
Communication
Data Van
Wellsite Trailer
Testers
Simultaneous Operations
10
0
100
200
300
400
500
600
700
800
0 10 20 30 40 50 60 70 80
Cum
ula
tive O
il (
m3)
Flow Time (hours)
'17/'18 OBE Offsets
H2 2018 wells
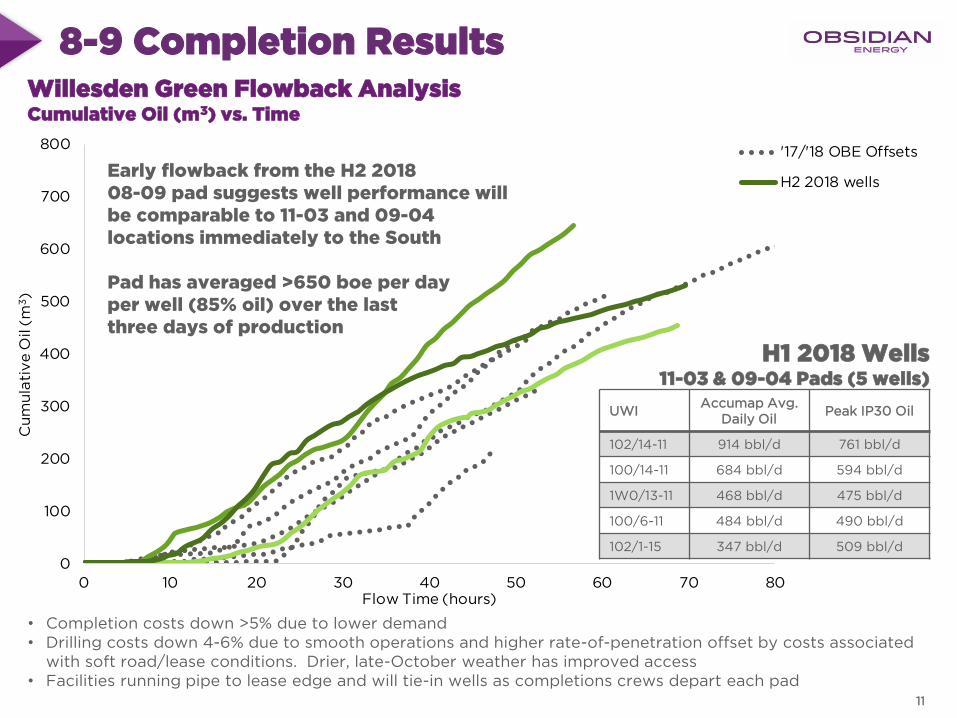
8-9 Completion Results
11
Willesden Green Flowback AnalysisCumulative Oil (m3) vs. Time
H1 2018 Wells11-03 & 09-04 Pads (5 wells)
• Completion costs down >5% due to lower demand • Drilling costs down 4-6% due to smooth operations and higher rate-of-penetration offset by costs associated
with soft road/lease conditions. Drier, late-October weather has improved access• Facilities running pipe to lease edge and will tie-in wells as completions crews depart each pad
UWIAccumap Avg.
Daily OilPeak IP30 Oil
102/14-11 914 bbl/d 761 bbl/d
100/14-11 684 bbl/d 594 bbl/d
1W0/13-11 468 bbl/d 475 bbl/d
100/6-11 484 bbl/d 490 bbl/d
102/1-15 347 bbl/d 509 bbl/d
Early flowback from the H2 2018 08-09 pad suggests well performance will be comparable to 11-03 and 09-04 locations immediately to the South
Pad has averaged >650 boe per day per well (85% oil) over the last three days of production
0
50
100
150
200
250
300
0 10 20 30 40 50 60 70 80
Cu
mu
lati
ve
Oil (
m3)
Flow Time (hours)
'17/'18 OBE Offsets
H2 2018 wells
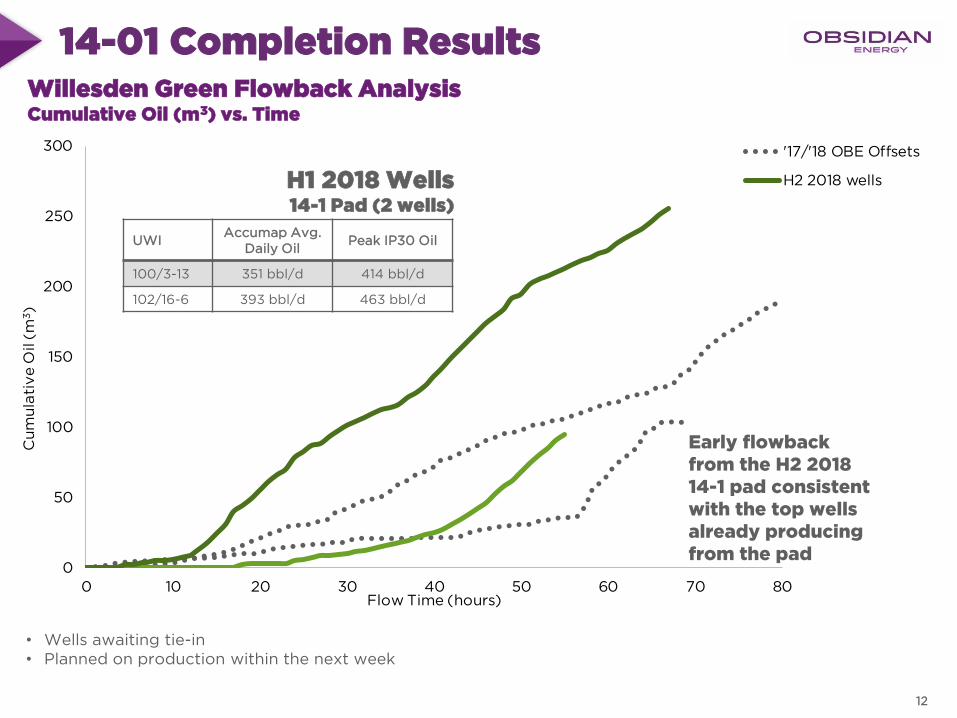
14-01 Completion Results
12
Willesden Green Flowback AnalysisCumulative Oil (m3) vs. Time
H1 2018 Wells14-1 Pad (2 wells)
• Wells awaiting tie-in• Planned on production within the next week
UWIAccumap Avg.
Daily OilPeak IP30 Oil
100/3-13 351 bbl/d 414 bbl/d
102/16-6 393 bbl/d 463 bbl/d
Early flowback from the H2 2018 14-1 pad consistent with the top wells already producing from the pad
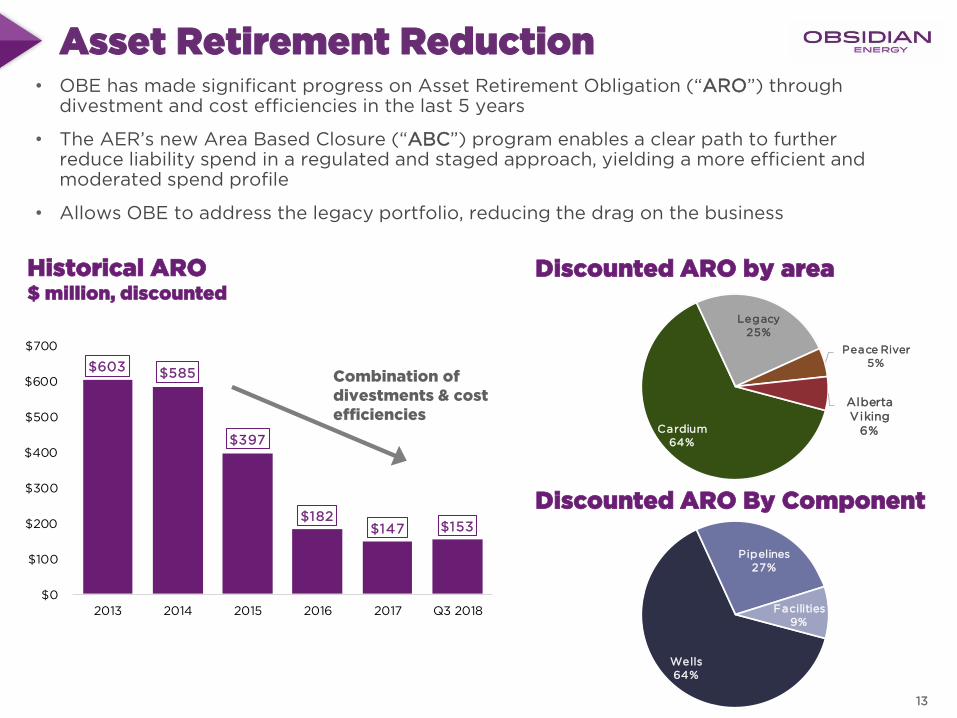
Asset Retirement Reduction• OBE has made significant progress on Asset Retirement Obligation (“ARO”) through
divestment and cost efficiencies in the last 5 years
• The AER’s new Area Based Closure (“ABC”) program enables a clear path to further reduce liability spend in a regulated and staged approach, yielding a more efficient and moderated spend profile
• Allows OBE to address the legacy portfolio, reducing the drag on the business
Historical ARO$ million, discounted
$603 $585
$397
$182 $147 $153
$0
$100
$200
$300
$400
$500
$600
$700
2013 2014 2015 2016 2017 Q3 2018
Combination of divestments & cost efficiencies
Discounted ARO by area
Discounted ARO By Component
Wells64%
Pipelines27%
Facilities9%
Cardium64%
Legacy25%
Peace River5%
Alberta Viking
6%
13
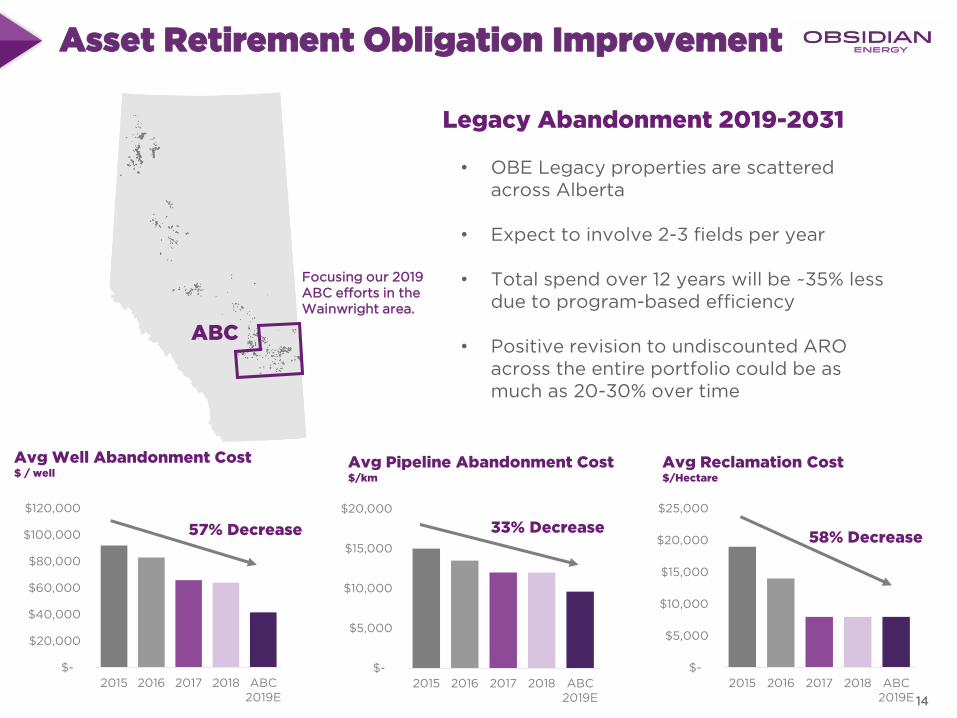
Asset Retirement Obligation Improvement
Legacy Abandonment 2019-2031
• OBE Legacy properties are scattered across Alberta
• Expect to involve 2-3 fields per year
• Total spend over 12 years will be ~35% less due to program-based efficiency
• Positive revision to undiscounted ARO across the entire portfolio could be as much as 20-30% over time
ABC
Focusing our 2019 ABC efforts in the Wainwright area.
$-
$20,000
$40,000
$60,000
$80,000
$100,000
$120,000
2015 2016 2017 2018 ABC2019E
$-
$5,000
$10,000
$15,000
$20,000
2015 2016 2017 2018 ABC2019E
$-
$5,000
$10,000
$15,000
$20,000
$25,000
2015 2016 2017 2018 ABC2019E
57% Decrease 33% Decrease58% Decrease
Avg Pipeline Abandonment Cost$/km
Avg Well Abandonment Cost$ / well
14
Avg Reclamation Cost$/Hectare
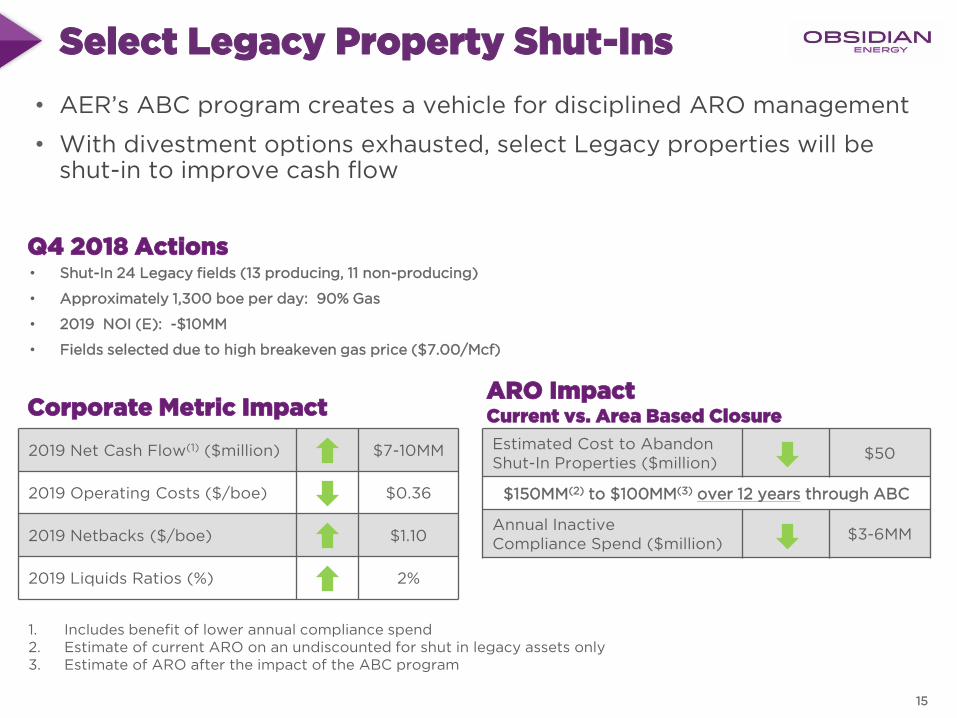
Select Legacy Property Shut-Ins
• AER’s ABC program creates a vehicle for disciplined ARO management
• With divestment options exhausted, select Legacy properties will be shut-in to improve cash flow
Q4 2018 Actions
Corporate Metric ImpactARO ImpactCurrent vs. Area Based Closure
2019 Net Cash Flow(1) ($million) $7-10MM
2019 Operating Costs ($/boe) $0.36
2019 Netbacks ($/boe) $1.10
2019 Liquids Ratios (%) 2%
Estimated Cost to Abandon Shut-In Properties ($million)
$50
$150MM(2) to $100MM(3) over 12 years through ABC
Annual Inactive Compliance Spend ($million)
$3-6MM
1. Includes benefit of lower annual compliance spend2. Estimate of current ARO on an undiscounted for shut in legacy assets only3. Estimate of ARO after the impact of the ABC program
• Shut-In 24 Legacy fields (13 producing, 11 non-producing)
• Approximately 1,300 boe per day: 90% Gas
• 2019 NOI (E): -$10MM
• Fields selected due to high breakeven gas price ($7.00/Mcf)
15
$0
$10
$20
$30
$40
$50
$60
$70
$30 $35 $40 $45 $50 Type CurveUS$55 Ed
Par
$60 $65 $70
12 M
on
th A
vg
Ne
tba
ck
($
/b
oe
)
US$ Edmonton Par
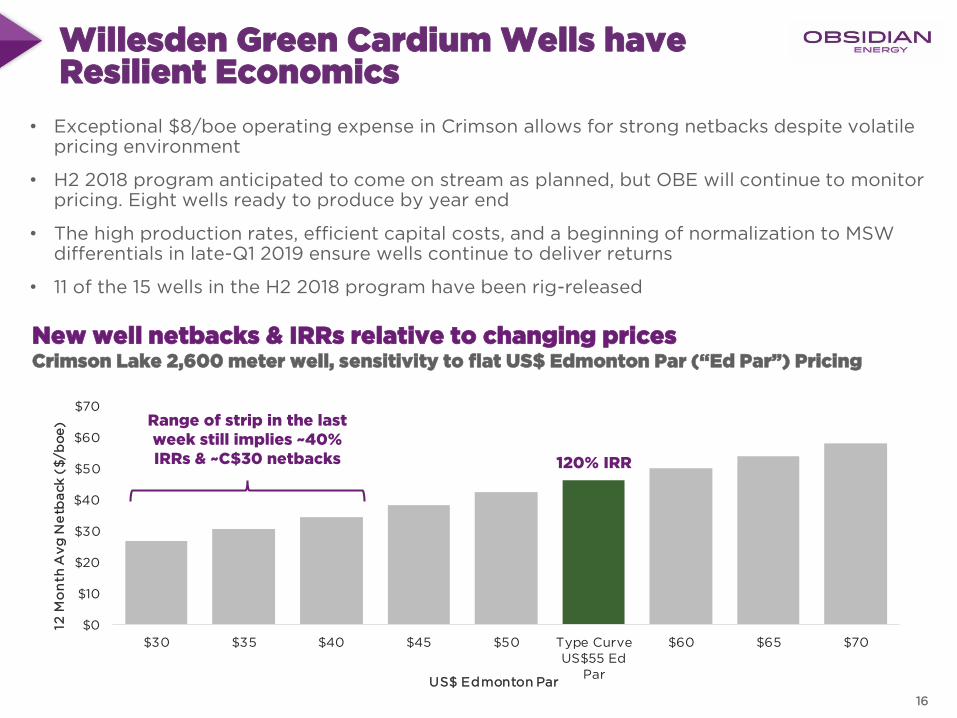
Willesden Green Cardium Wells have Resilient Economics
• Exceptional $8/boe operating expense in Crimson allows for strong netbacks despite volatile pricing environment
• H2 2018 program anticipated to come on stream as planned, but OBE will continue to monitor pricing. Eight wells ready to produce by year end
• The high production rates, efficient capital costs, and a beginning of normalization to MSW differentials in late-Q1 2019 ensure wells continue to deliver returns
• 11 of the 15 wells in the H2 2018 program have been rig-released
New well netbacks & IRRs relative to changing pricesCrimson Lake 2,600 meter well, sensitivity to flat US$ Edmonton Par (“Ed Par”) Pricing
120% IRR
Range of strip in the last week still implies ~40% IRRs & ~C$30 netbacks
16

2019 Outlook
Key Tenets of our 2019 Plan
• Conservative, balance sheet oriented development program with optionality to follow the oil market
• In light of Q1 differential outlook, we are planning a base spending platform of $65MM in H1 2019 and the ability to toggle between $55 and $95MM for H2 2019
• Anticipate delivering self-funded Cardium light oil growth of 10 percent or more; 3-6 percent for the full portfolio in the base case
• Willesden Green Cardium will be the cornerstone, following up on 2018 results
• Leverage the largest drill ready inventory the Company has held in the Cardium
18
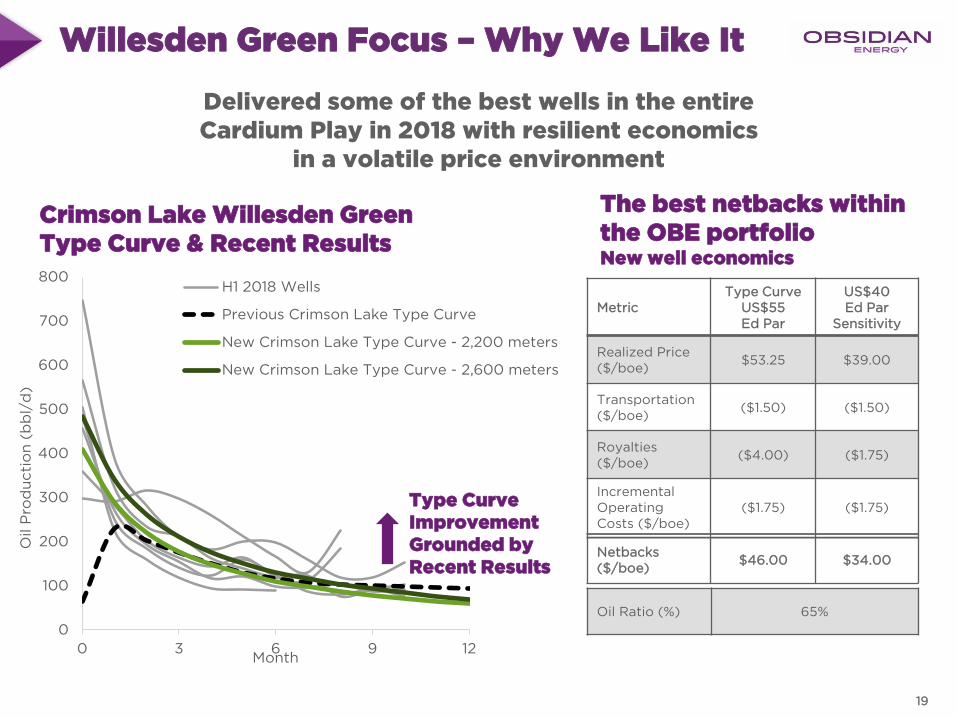
0
100
200
300
400
500
600
700
800
0 3 6 9 12
Oil P
rod
ucti
on
(b
bl/
d)
Month
H1 2018 Wells
Previous Crimson Lake Type Curve
New Crimson Lake Type Curve - 2,200 meters
New Crimson Lake Type Curve - 2,600 meters
Willesden Green Focus – Why We Like It
Type Curve Improvement Grounded by Recent Results
Crimson Lake Willesden Green Type Curve & Recent Results
The best netbacks within the OBE portfolioNew well economics
MetricType Curve
US$55 Ed Par
US$40 Ed Par
Sensitivity
Realized Price ($/boe)
$53.25 $39.00
Transportation ($/boe)
($1.50) ($1.50)
Royalties ($/boe)
($4.00) ($1.75)
Incremental Operating Costs ($/boe)
($1.75) ($1.75)
Netbacks ($/boe)
$46.00 $34.00
Oil Ratio (%) 65%
Delivered some of the best wells in the entire Cardium Play in 2018 with resilient economics
in a volatile price environment
19
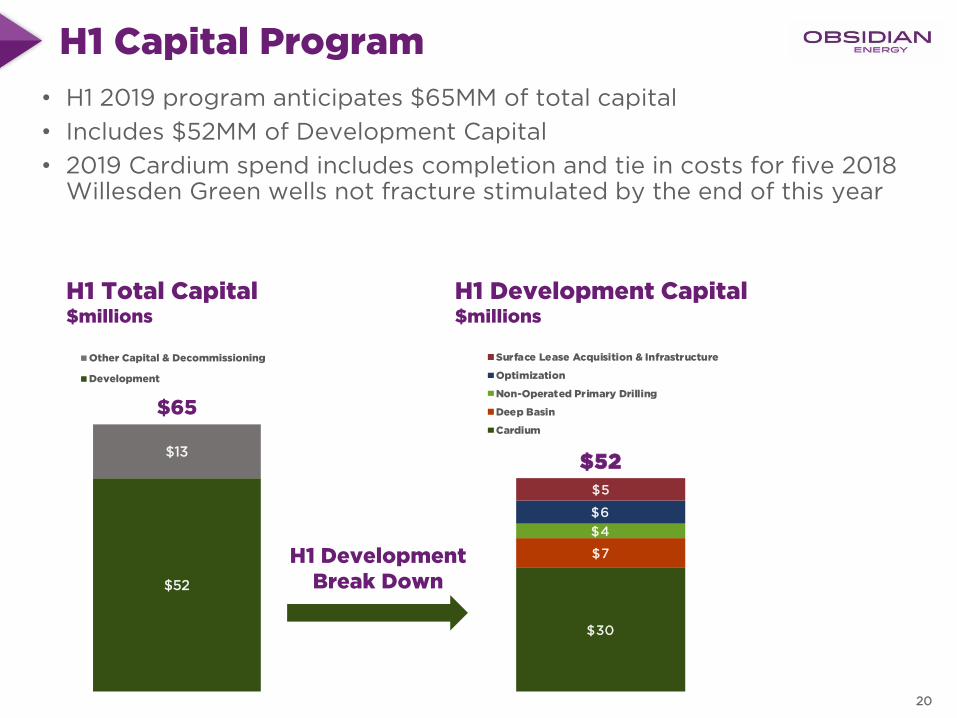
$52
$13
$65
Other Capital & Decommissioning
Development
H1 Capital Program
H1 Total Capital$millions
• H1 2019 program anticipates $65MM of total capital
• Includes $52MM of Development Capital
• 2019 Cardium spend includes completion and tie in costs for five 2018 Willesden Green wells not fracture stimulated by the end of this year
H1 Development Capital$millions
H1 Development Break Down
20
$30
$7
$4
$6
$5
$52
Surface Lease Acquisition & Infrastructure
Optimization
Non-Operated Primary Drilling
Deep Basin
Cardium
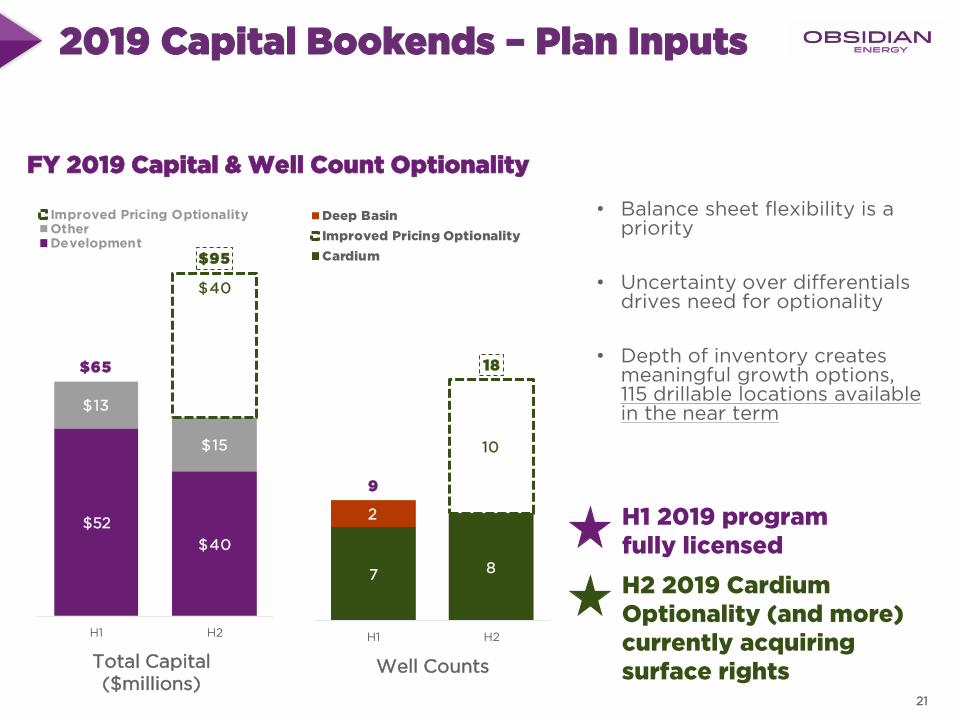
2019 Capital Bookends – Plan Inputs
FY 2019 Capital & Well Count Optionality
Total Capital($millions)
Well Counts
• Balance sheet flexibility is a priority
• Uncertainty over differentials drives need for optionality
• Depth of inventory creates meaningful growth options, 115 drillable locations available in the near term
21
H1 2019 program fully licensed
H2 2019 Cardium Optionality (and more) currently acquiring surface rights
$52
$40
$13
$15
$40
$65
$95
H1 H2
Improved Pricing OptionalityOtherDevelopment
7 8
10
2
9
18
H1 H2
Deep Basin
Improved Pricing Optionality
Cardium
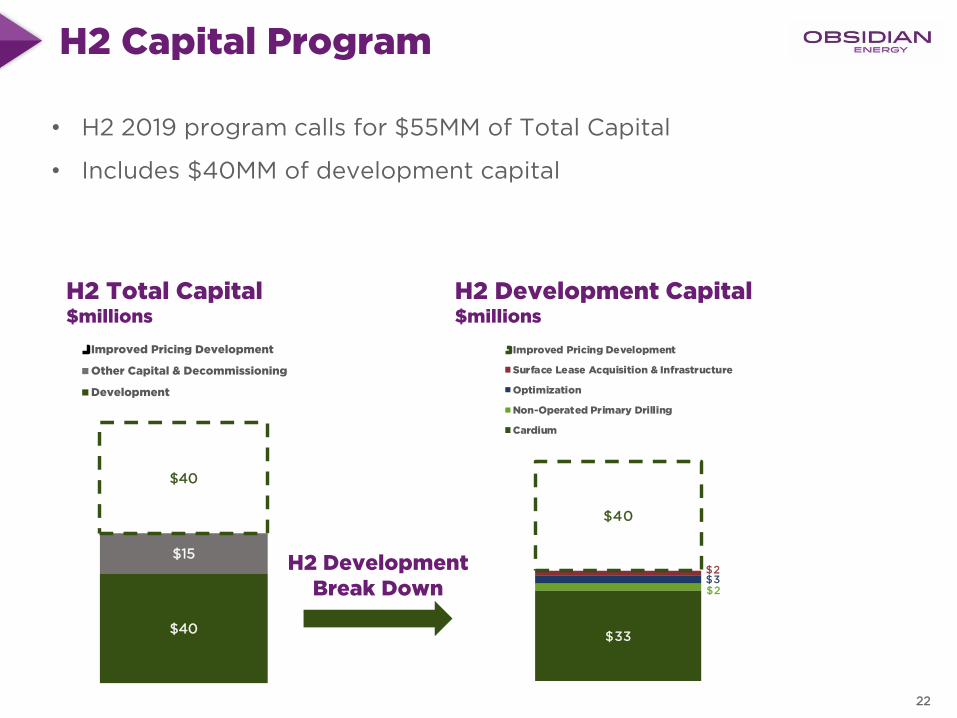
$40
$15
$40
Improved Pricing Development
Other Capital & Decommissioning
Development
H2 Capital Program
• H2 2019 program calls for $55MM of Total Capital
• Includes $40MM of development capital
H2 Development Break Down
H2 Total Capital$millions
H2 Development Capital$millions
22
$33
$2$3$2
$40
Improved Pricing Development
Surface Lease Acquisition & Infrastructure
Optimization
Non-Operated Primary Drilling
Cardium
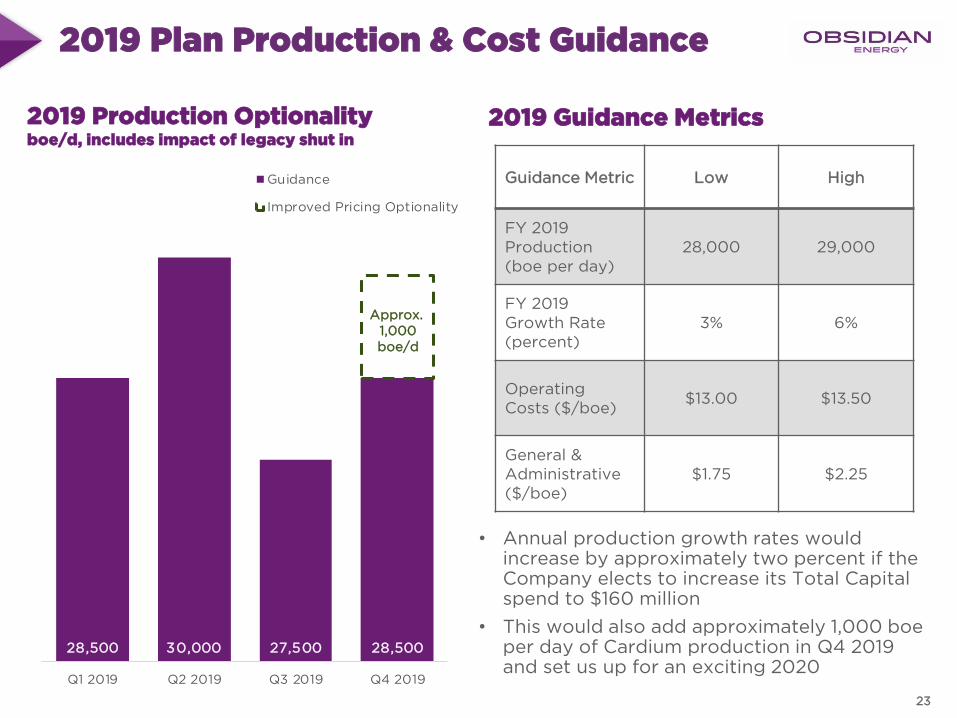
28,500 30,000 27,500 28,500
Q1 2019 Q2 2019 Q3 2019 Q4 2019
Guidance
Improved Pricing Optionality
2019 Plan Production & Cost Guidance
23
2019 Production Optionalityboe/d, includes impact of legacy shut in
Guidance Metric Low High
FY 2019 Production (boe per day)
28,000 29,000
FY 2019 Growth Rate (percent)
3% 6%
Operating Costs ($/boe)
$13.00 $13.50
General & Administrative($/boe)
$1.75 $2.25
2019 Guidance Metrics
• Annual production growth rates would increase by approximately two percent if the Company elects to increase its Total Capital spend to $160 million
• This would also add approximately 1,000 boe per day of Cardium production in Q4 2019 and set us up for an exciting 2020
Approx. 1,000boe/d

Q & A
Strategic Priorities
25

Our Strategic Priorities
1. Generate meaningful YoY Cash Flow Growth
• Target annual cash flow per share growth 10-15%
• Driven by high-graded investment metrics (IRR’s >50%, Capital Efficiency $20,000 /boe/d)
2. Improve balance sheet strength
• Maintain capital discipline to improve debt picture through spending within Funds Flow from Operations
• Target Debt/EBITDA to 1.5X over coming 2-3 years
3. Simplify and grow the light oil business
• Through targeted investment, grow Cardium light oil platform 30% over 3 years
• Continue to rationalize the portfolio to reduce drag on cash flow
• Maintain 33 operated secondary recovery projects to support top tier corporate decline (25-35%)
Disciplined
Relentless
Accountable
26
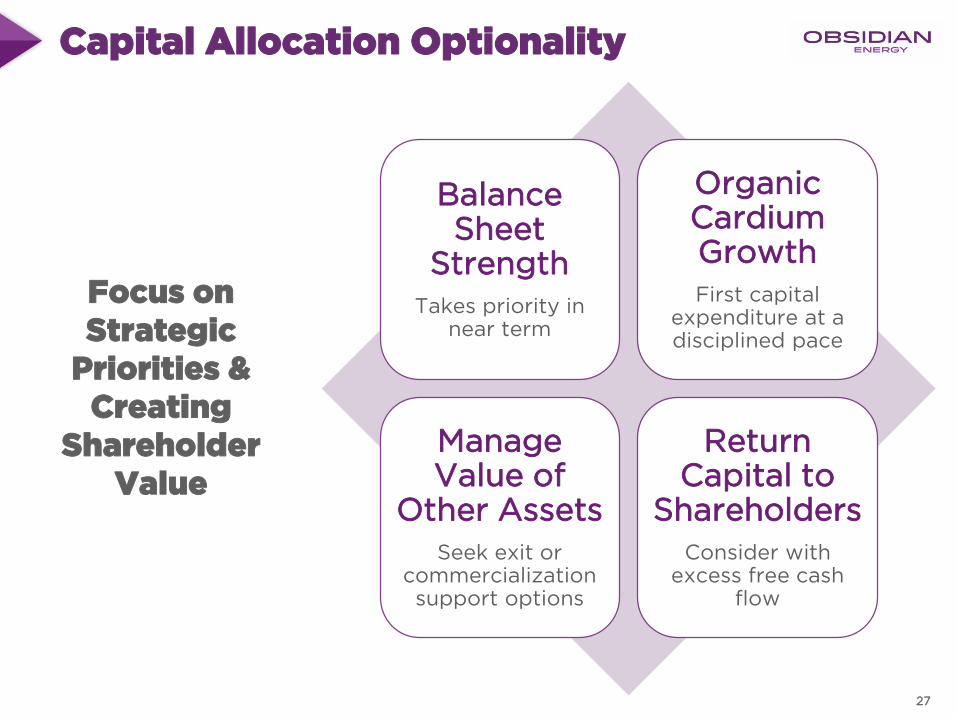
Capital Allocation Optionality
Balance Sheet
StrengthTakes priority in
near term
Organic Cardium GrowthFirst capital
expenditure at a disciplined pace
Manage Value of
Other AssetsSeek exit or
commercialization support options
Return Capital to
ShareholdersConsider with
excess free cash flow
Focus on Strategic
Priorities & Creating
Shareholder Value
27
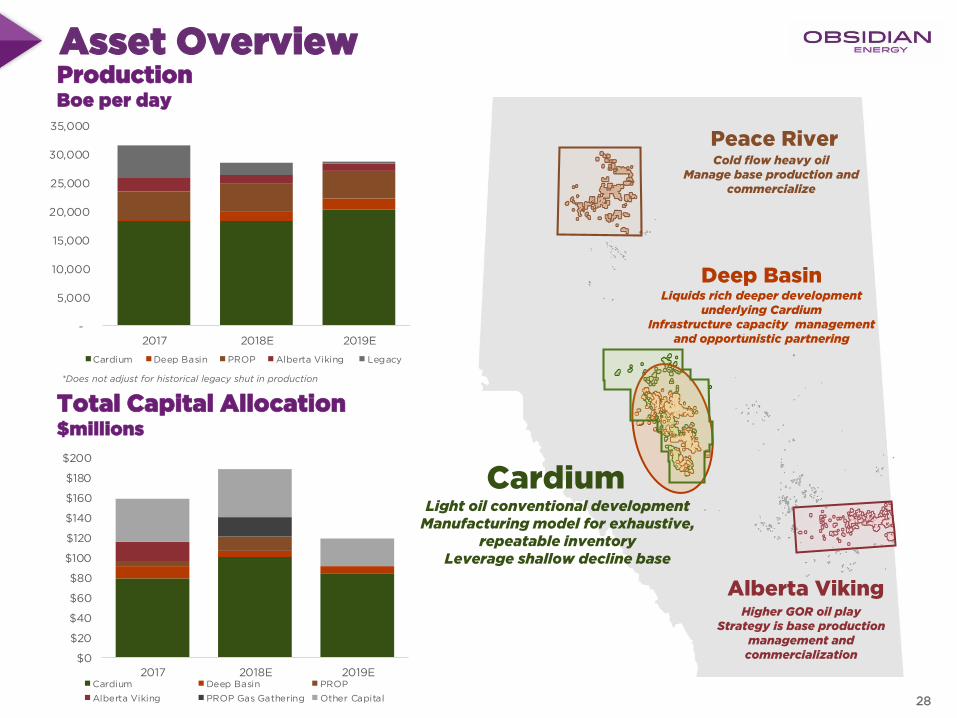
$0
$20
$40
$60
$80
$100
$120
$140
$160
$180
$200
2017 2018E 2019ECardium Deep Basin PROP
Alberta Viking PROP Gas Gathering Other Capital
-
5,000
10,000
15,000
20,000
25,000
30,000
35,000
2017 2018E 2019E
Cardium Deep Basin PROP Alberta Viking Legacy
Asset Overview
28
Production Boe per day
Total Capital Allocation$millions
Deep Basin
Peace River
Alberta Viking
Cold flow heavy oilManage base production and
commercialize
Liquids rich deeper development underlying Cardium
Infrastructure capacity management and opportunistic partnering
Higher GOR oil playStrategy is base production
management and commercialization
CardiumLight oil conventional development
Manufacturing model for exhaustive, repeatable inventory
Leverage shallow decline base
*Does not adjust for historical legacy shut in production

Cardium is our Business
29
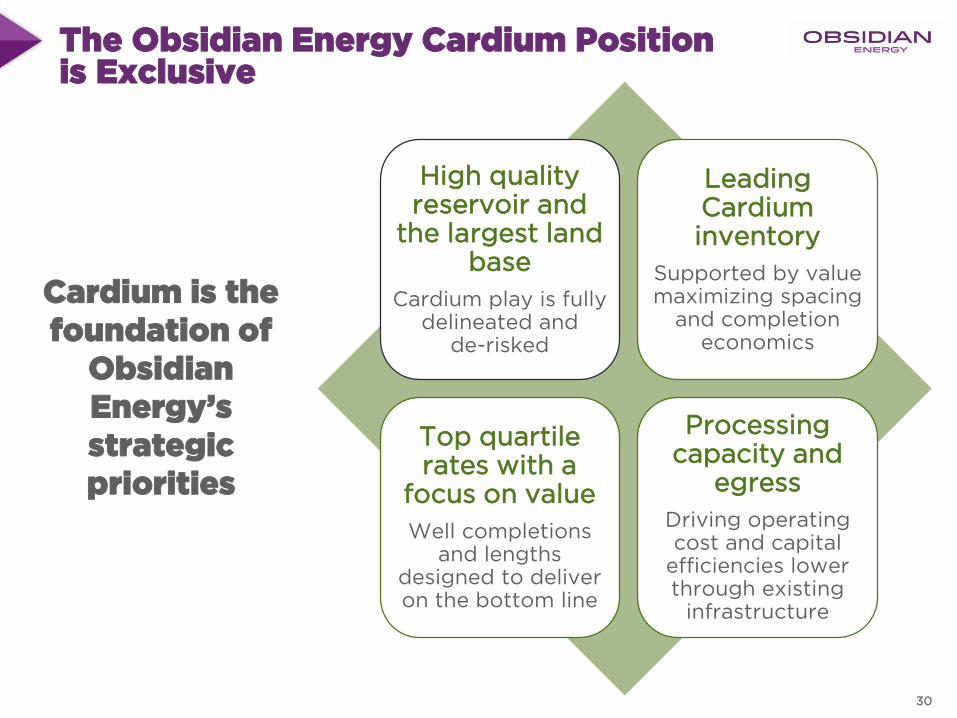
The Obsidian Energy Cardium Position is Exclusive
30
High quality reservoir and
the largest land base
Cardium play is fully delineated and
de-risked
Leading Cardium inventory
Supported by value maximizing spacing
and completion economics
Top quartile rates with a
focus on value
Well completions and lengths
designed to deliver on the bottom line
Processing capacity and
egress
Driving operating cost and capital
efficiencies lower through existing
infrastructure
Cardium is the foundation of
Obsidian Energy’s strategic priorities
0
10
20
30
40
50
60
70
0 20 40 60
Av
era
ge
Cu
mu
lati
ve
Oil
Pro
du
cti
on
/ W
ell
(M
bb
l)
Months
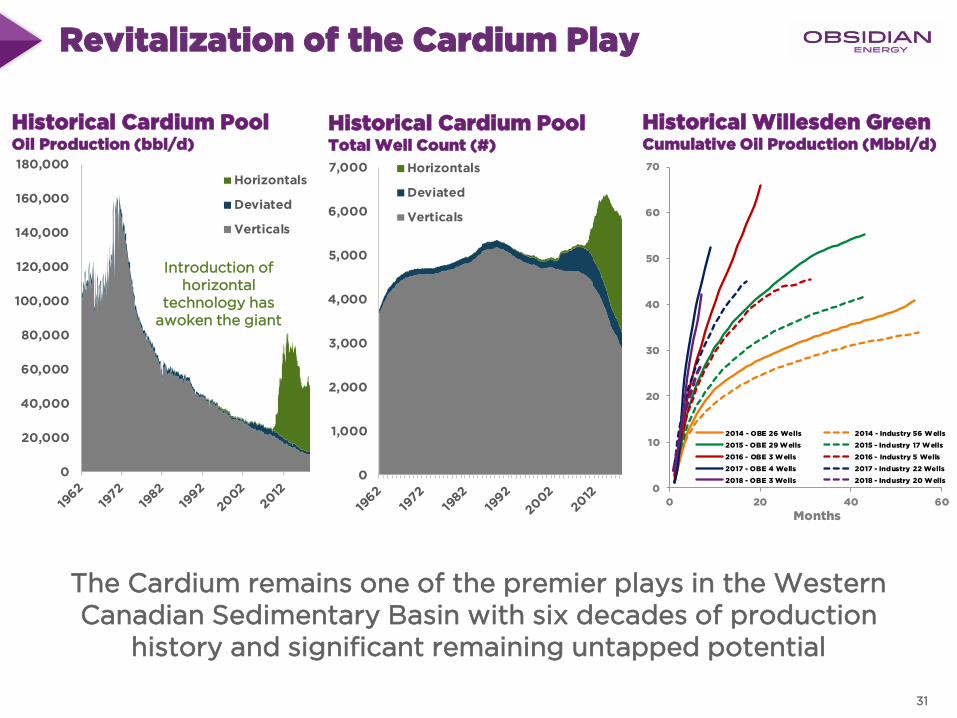
2014 - OBE 26 Wells 2014 - Industry 56 Wells
2015 - OBE 29 Wells 2015 - Industry 17 Wells
2016 - OBE 3 Wells 2016 - Industry 5 Wells
2017 - OBE 4 Wells 2017 - Industry 22 Wells
2018 - OBE 3 Wells 2018 - Industry 20 Wells
Revitalization of the Cardium Play
Historical Cardium PoolOil Production (bbl/d)
Historical Cardium PoolTotal Well Count (#)
The Cardium remains one of the premier plays in the Western Canadian Sedimentary Basin with six decades of production
history and significant remaining untapped potential
Historical Willesden GreenCumulative Oil Production (Mbbl/d)
0
20,000
40,000
60,000
80,000
100,000
120,000
140,000
160,000
180,000
Horizontals
Deviated
Verticals
Introduction of horizontal
technology has awoken the giant
0
1,000
2,000
3,000
4,000
5,000
6,000
7,000 Horizontals
Deviated
Verticals
31
0
100
200
300
400
500
600
700
800
OBE Peer 1 Peer 2 Peer 3 Peer 4 Peer 5 Peer 6 Peer 7
Gro
ss L
an
d P
osi
tio
n (S
ecti
on
s)
Developed Sections
Undeveloped Sections
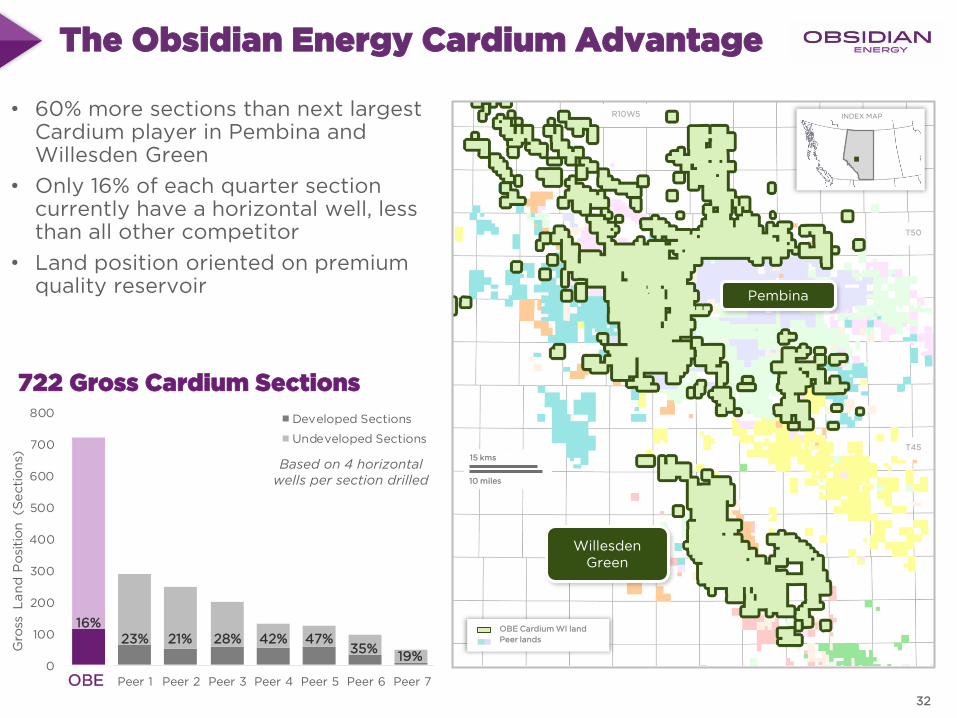
The Obsidian Energy Cardium Advantage
Pembina
Willesden Green
10 miles
15 kms
INDEX MAPR10W5
T50
OBE Cardium WI land
Peer lands
T45
• 60% more sections than next largest Cardium player in Pembina and Willesden Green
• Only 16% of each quarter section currently have a horizontal well, less than all other competitor
• Land position oriented on premium quality reservoir
722 Gross Cardium Sections
Based on 4 horizontal wells per section drilled
OBE
16%23% 21% 28% 42% 47%
35%19%
32
0
20
40
60
80
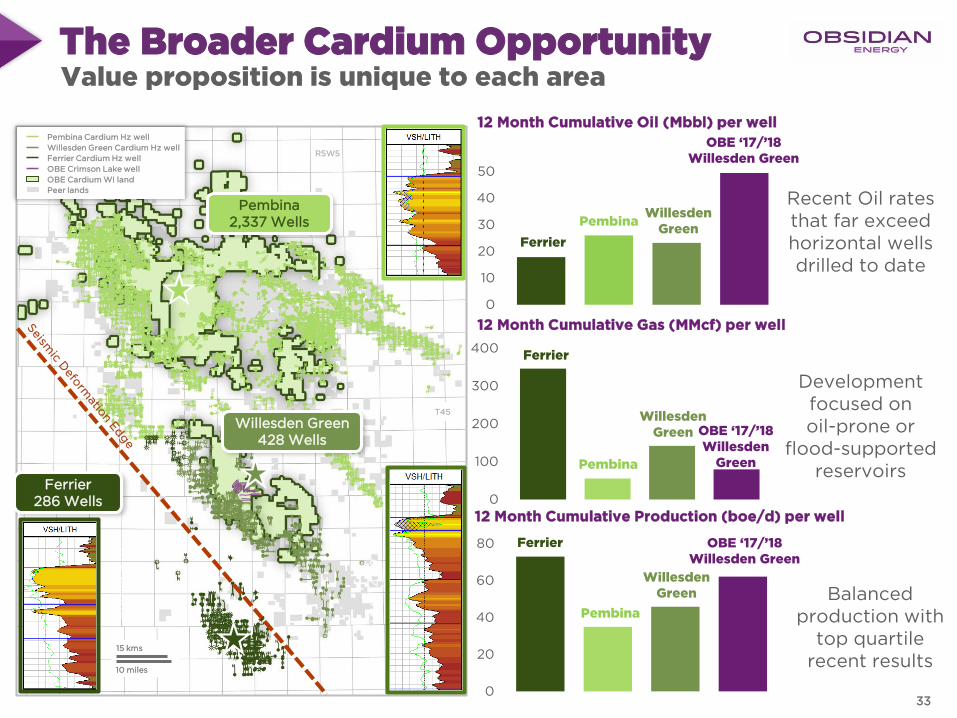
12 Month Cumulative Production (boe/d) per well
The Broader Cardium Opportunity
0
10
20
30
40
50
0
100
200
300
400
Development focused on oil-prone or
flood-supported reservoirs
Recent Oil rates that far exceed horizontal wells drilled to date
Value proposition is unique to each area
12 Month Cumulative Oil (Mbbl) per well
12 Month Cumulative Gas (MMcf) per well
Ferrier
Pembina
WillesdenGreen
OBE ‘17/’18 Willesden Green
Ferrier
PembinaWillesden
Green
OBE ‘17/’18 Willesden Green
Balanced production with
top quartile recent results
Ferrier
Pembina
WillesdenGreen OBE ‘17/’18
Willesden Green
Ferrier286 Wells
Pembina2,337 Wells
WG
14
-12
Ferr
ier
6-1
1
10 miles
15 kms
Willesden Green428 Wells
T45
Pembina Cardium Hz well
Willesden Green Cardium Hz well
Ferrier Cardium Hz well
OBE Crimson Lake well
OBE Cardium WI land
Peer lands
R5W5
33
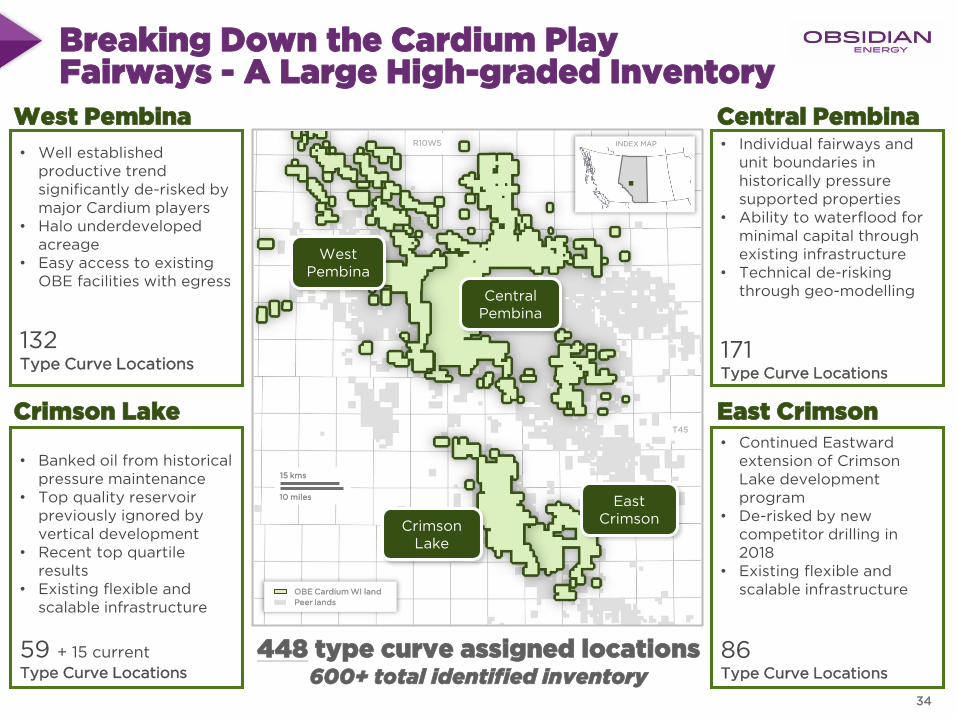
Breaking Down the Cardium Play Fairways - A Large High-graded Inventory
• Continued Eastward extension of Crimson Lake development program
• De-risked by new competitor drilling in 2018
• Existing flexible and scalable infrastructure
86Type Curve Locations
• Individual fairways and unit boundaries in historically pressure supported properties
• Ability to waterflood for minimal capital through existing infrastructure
• Technical de-risking through geo-modelling
171Type Curve Locations
• Banked oil from historical pressure maintenance
• Top quality reservoir previously ignored by vertical development
• Recent top quartile results
• Existing flexible and scalable infrastructure
59 + 15 current
Type Curve Locations
• Well established productive trend significantly de-risked by major Cardium players
• Halo underdeveloped acreage
• Easy access to existing OBE facilities with egress
132Type Curve Locations
West Pembina
Crimson Lake
Central Pembina
East Crimson
448 type curve assigned locations600+ total identified inventory
CrimsonLake
Central Pembina
West Pembina
East Crimson
10 miles
15 kms
INDEX MAP
OBE Cardium WI land
Peer lands
R10W5
T45
34
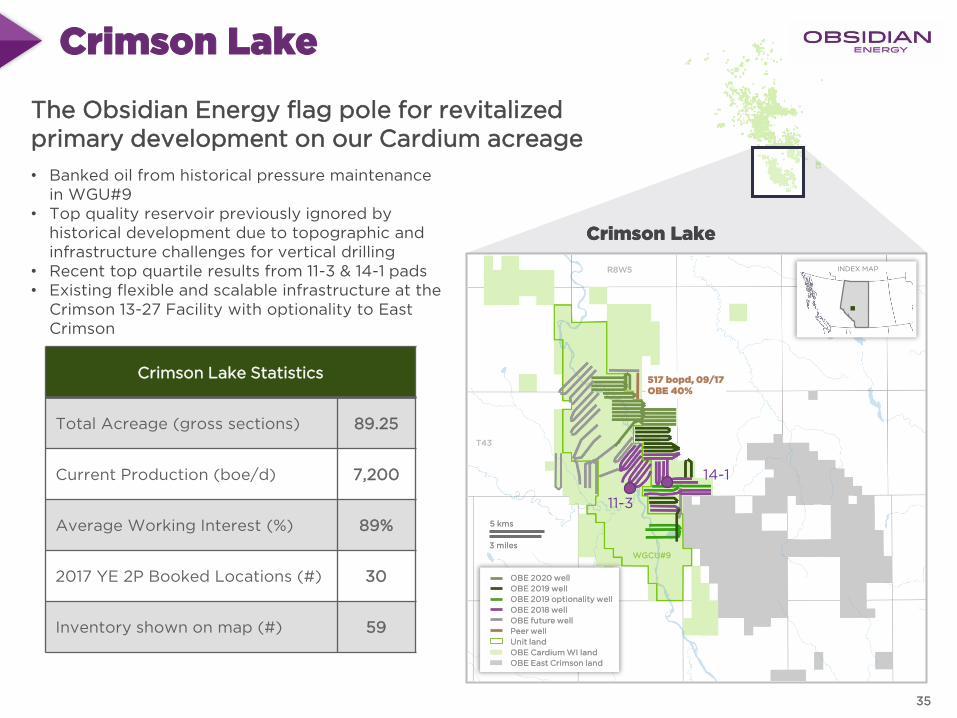
Crimson Lake
• Banked oil from historical pressure maintenance in WGU#9
• Top quality reservoir previously ignored by historical development due to topographic and infrastructure challenges for vertical drilling
• Recent top quartile results from 11-3 & 14-1 pads• Existing flexible and scalable infrastructure at the
Crimson 13-27 Facility with optionality to East Crimson
Potential inventory build up with tiers?
The Obsidian Energy flag pole for revitalized primary development on our Cardium acreage
Crimson Lake Statistics
Total Acreage (gross sections) 89.25
Current Production (boe/d) 7,200
Average Working Interest (%) 89%
2017 YE 2P Booked Locations (#) 30
Inventory shown on map (#) 59
Crimson LakeCrimson Lake
3 miles
5 kms
INDEX MAPR8W5
T43
WGCU#9
11-3
14-1
OBE 2020 well
OBE 2019 well
OBE 2019 optionality well
OBE 2018 well
OBE future well
Peer well
Unit land
OBE Cardium WI land
OBE East Crimson land
517 bopd, 09/17OBE 40%
35
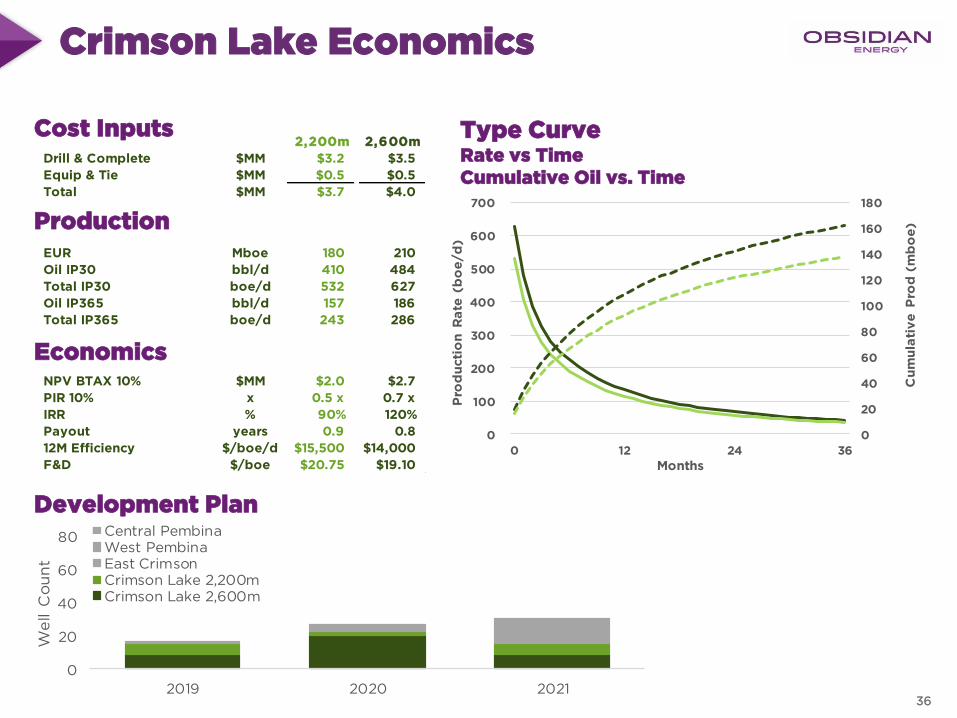
2,200m 2,600m
Drill & Complete $MM $3.2 $3.5
Equip & Tie $MM $0.5 $0.5
Total $MM $3.7 $4.0
EUR Mboe 180 210
Oil IP30 bbl/d 410 484
Total IP30 boe/d 532 627
Oil IP365 bbl/d 157 186
Total IP365 boe/d 243 286
NPV BTAX 10% $MM $2.0 $2.7
PIR 10% x 0.5 x 0.7 x
IRR % 90% 120%
Payout years 0.9 0.8
12M Efficiency $/boe/d $15,500 $14,000
F&D $/boe $20.75 $19.10
0
20
40
60
80
2019 2020 2021
We
ll C
ou
nt
Central PembinaWest PembinaEast CrimsonCrimson Lake 2,200mCrimson Lake 2,600m
0
20
40
60
80
100
120
140
160
180
0
100
200
300
400
500
600
700
0 12 24 36
Cu
mu
lati
ve
Pro
d (
mb
oe
)
Pro
du
cti
on
Ra
te (
bo
e/d
)Months
Crimson Lake Economics
Production
Economics
Type CurveRate vs TimeCumulative Oil vs. Time
Development Plan
Cost Inputs
36
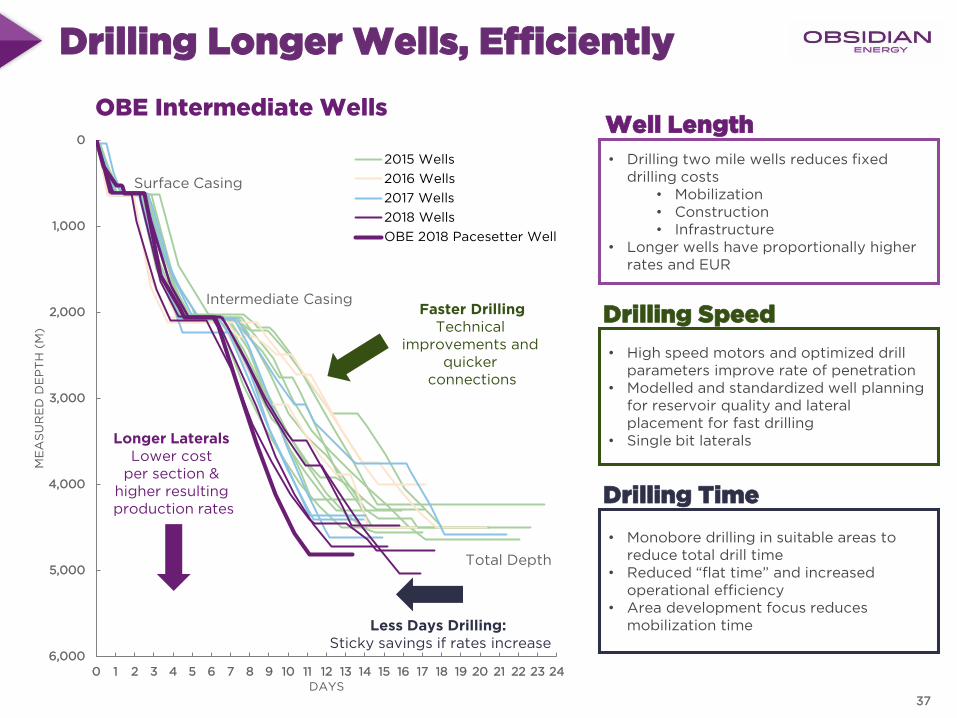
Drilling Longer Wells, Efficiently
0 1 2 3 4 5 6 7 8 9 10 11 12 13 14 15 16 17 18 19 20 21 22 23 24
0
1,000
2,000
3,000
4,000
5,000
6,000
DAYS
ME
AS
UR
ED
DE
PT
H (
M)
2015 Wells
2016 Wells
2017 Wells
2018 Wells
OBE 2018 Pacesetter Well
Longer Laterals Lower cost
per section & higher resultingproduction rates
Faster DrillingTechnical
improvements and quicker
connections
Less Days Drilling: Sticky savings if rates increase
Surface Casing
Intermediate Casing
Total Depth
• Drilling two mile wells reduces fixed drilling costs
• Mobilization• Construction• Infrastructure
• Longer wells have proportionally higher rates and EUR
• High speed motors and optimized drill parameters improve rate of penetration
• Modelled and standardized well planning for reservoir quality and lateral placement for fast drilling
• Single bit laterals
• Monobore drilling in suitable areas to reduce total drill time
• Reduced “flat time” and increased operational efficiency
• Area development focus reduces mobilization time
Well Length
Drilling Speed
Drilling Time
OBE Intermediate Wells
37
0 50 100 150 200 250
Inter-frac Spacing (meters)
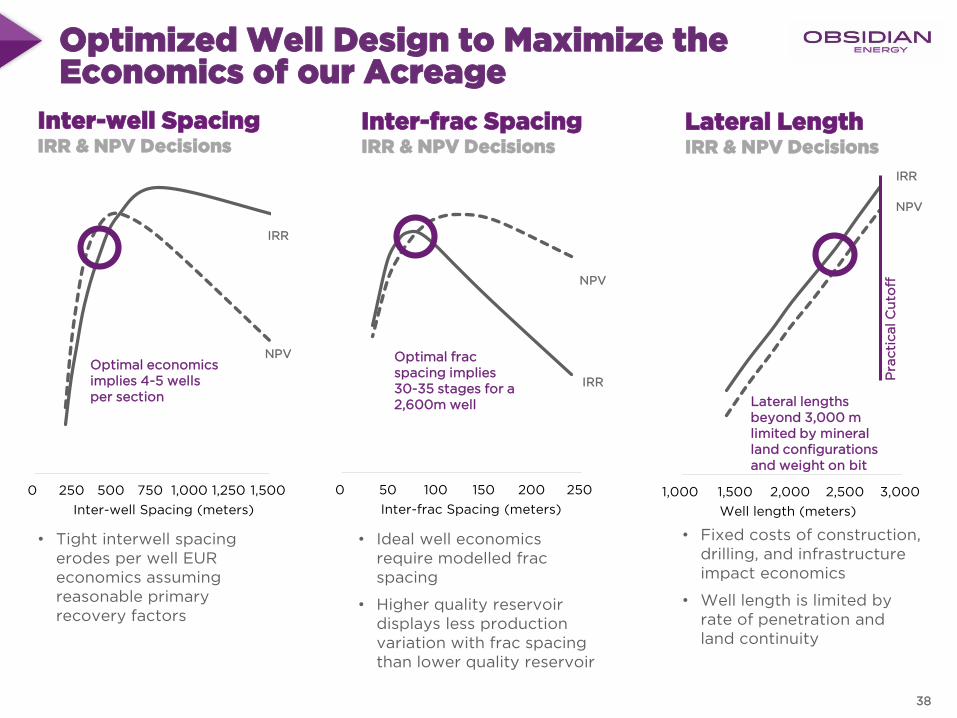
Optimized Well Design to Maximize the Economics of our Acreage
Inter-well SpacingIRR & NPV Decisions
Inter-frac SpacingIRR & NPV Decisions
Lateral LengthIRR & NPV Decisions
• Tight interwell spacing erodes per well EUR economics assuming reasonable primary recovery factors
• Ideal well economics require modelled frac spacing
• Higher quality reservoir displays less production variation with frac spacing than lower quality reservoir
• Fixed costs of construction, drilling, and infrastructure impact economics
• Well length is limited by rate of penetration and land continuity
0 250 500 750 1,000 1,250 1,500
Inter-well Spacing (meters)
NPV
IRR
Optimal economics implies 4-5 wells per section
Optimal frac spacing implies 30-35 stages for a 2,600m well
1,000 1,500 2,000 2,500 3,000
Well length (meters)
Lateral lengths beyond 3,000 m limited by mineral land configurations and weight on bit
NPV
IRR
NPV
IRR
Pra
cti
cal C
uto
ff
38
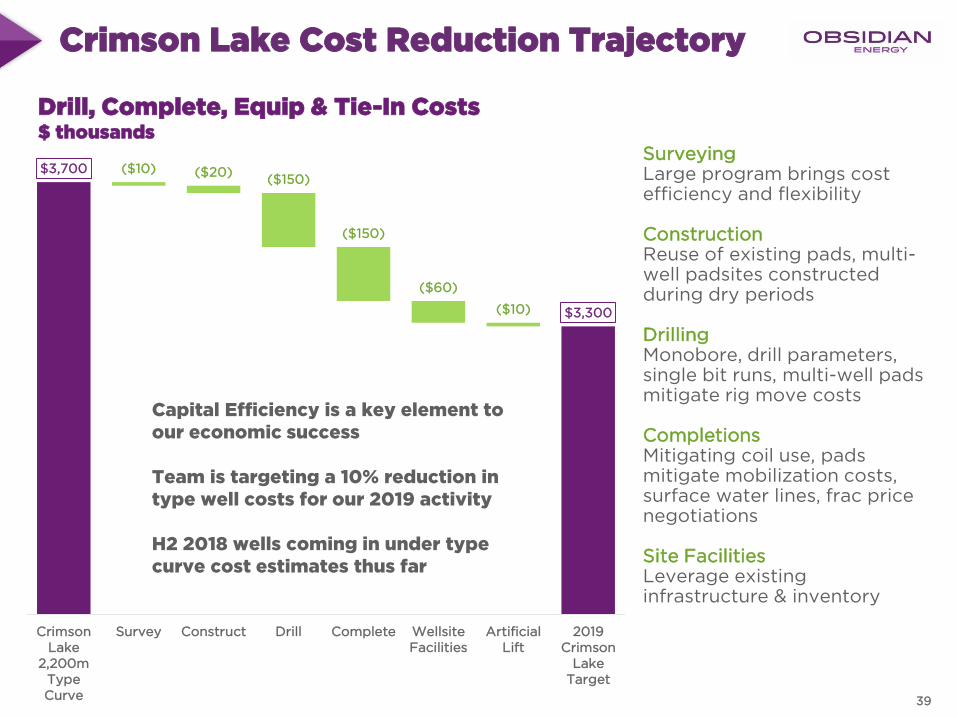
$3,700
$3,300
($10) ($20)($150)
($150)
($60)
($10)
CrimsonLake
2,200mTypeCurve
Survey Construct Drill Complete WellsiteFacilities
ArtificialLift
2019Crimson
LakeTarget
Crimson Lake Cost Reduction Trajectory
Surveying Large program brings cost efficiency and flexibility
ConstructionReuse of existing pads, multi-well padsites constructed during dry periods
DrillingMonobore, drill parameters, single bit runs, multi-well pads mitigate rig move costs
CompletionsMitigating coil use, pads mitigate mobilization costs, surface water lines, frac price negotiations
Site FacilitiesLeverage existing infrastructure & inventory
Drill, Complete, Equip & Tie-In Costs$ thousands
Capital Efficiency is a key element to our economic success
Team is targeting a 10% reduction in type well costs for our 2019 activity
H2 2018 wells coming in under type curve cost estimates thus far
39
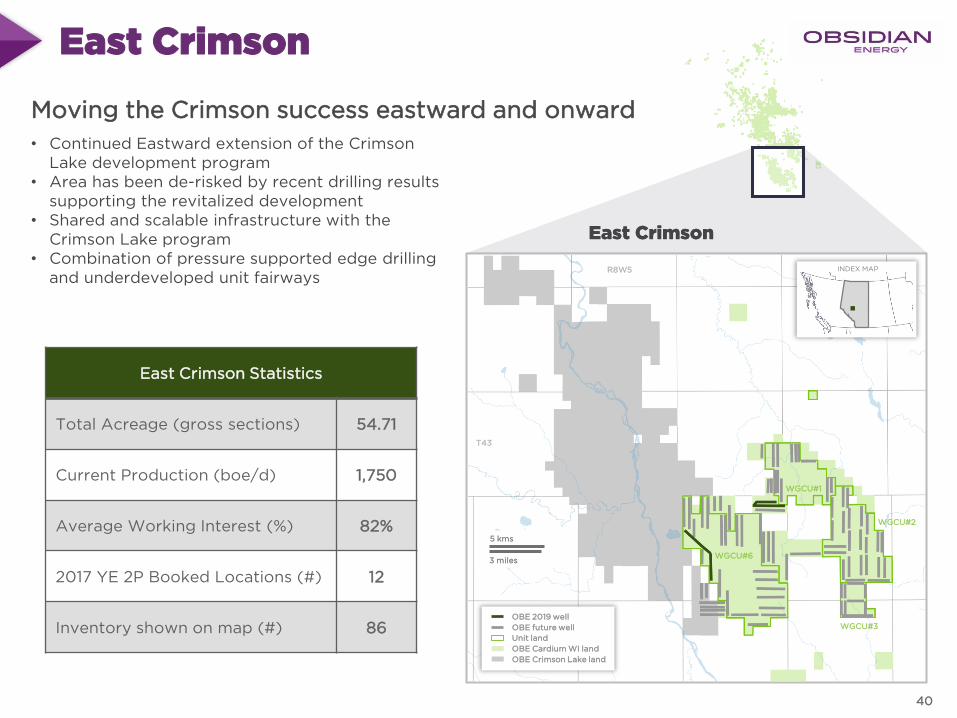
East Crimson
• Continued Eastward extension of the Crimson Lake development program
• Area has been de-risked by recent drilling results supporting the revitalized development
• Shared and scalable infrastructure with the Crimson Lake program
• Combination of pressure supported edge drilling and underdeveloped unit fairways
Moving the Crimson success eastward and onward
East Crimson Statistics
Total Acreage (gross sections) 54.71
Current Production (boe/d) 1,750
Average Working Interest (%) 82%
2017 YE 2P Booked Locations (#) 12
Inventory shown on map (#) 86
East CrimsonEast Crimson
3 miles
5 kms
INDEX MAPR8W5
T43
WGCU#6
WGCU#1
WGCU#3
WGCU#2
OBE 2019 well
OBE future well
Unit land
OBE Cardium WI land
OBE Crimson Lake land
40
0
20
40
60
80
2019 2020 2021
We
ll C
ou
nt
Central PembinaWest PembinaEast CrimsonCrimson Lake 2,200mCrimson Lake 2,600m
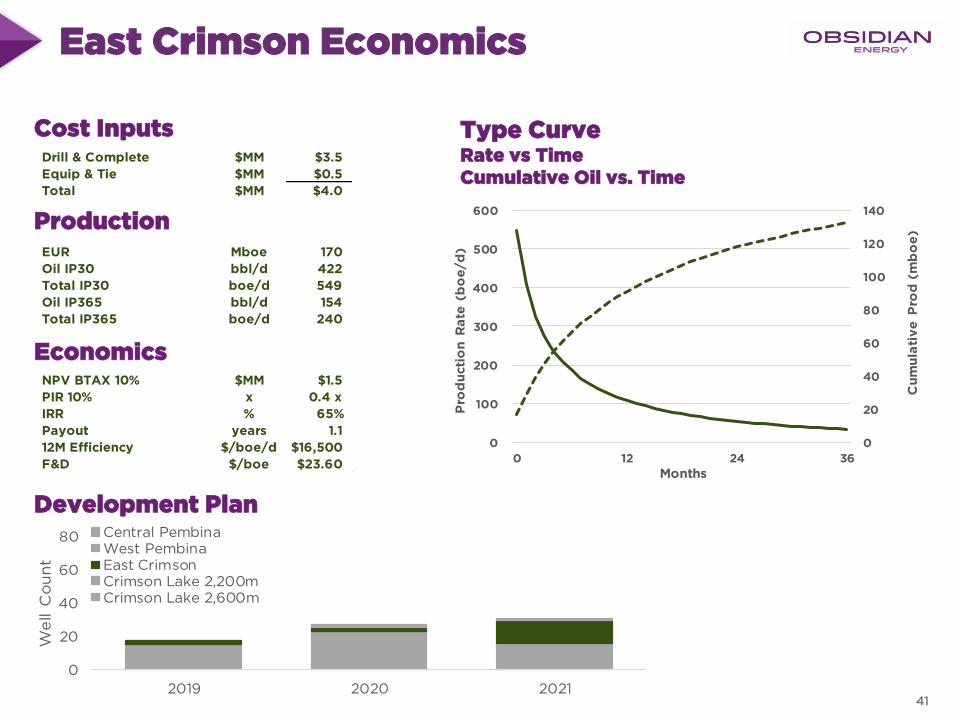
Drill & Complete $MM $3.5
Equip & Tie $MM $0.5
Total $MM $4.0
EUR Mboe 170
Oil IP30 bbl/d 422
Total IP30 boe/d 549
Oil IP365 bbl/d 154
Total IP365 boe/d 240
NPV BTAX 10% $MM $1.5
PIR 10% x 0.4 x
IRR % 65%
Payout years 1.1
12M Efficiency $/boe/d $16,500
F&D $/boe $23.60
0
20
40
60
80
100
120
140
0
100
200
300
400
500
600
0 12 24 36
Cu
mu
lati
ve
Pro
d (
mb
oe
)
Pro
du
cti
on
Ra
te (
bo
e/d
)Months
East Crimson Economics
Cost Inputs
Production
Economics
Type CurveRate vs TimeCumulative Oil vs. Time
Development Plan
41
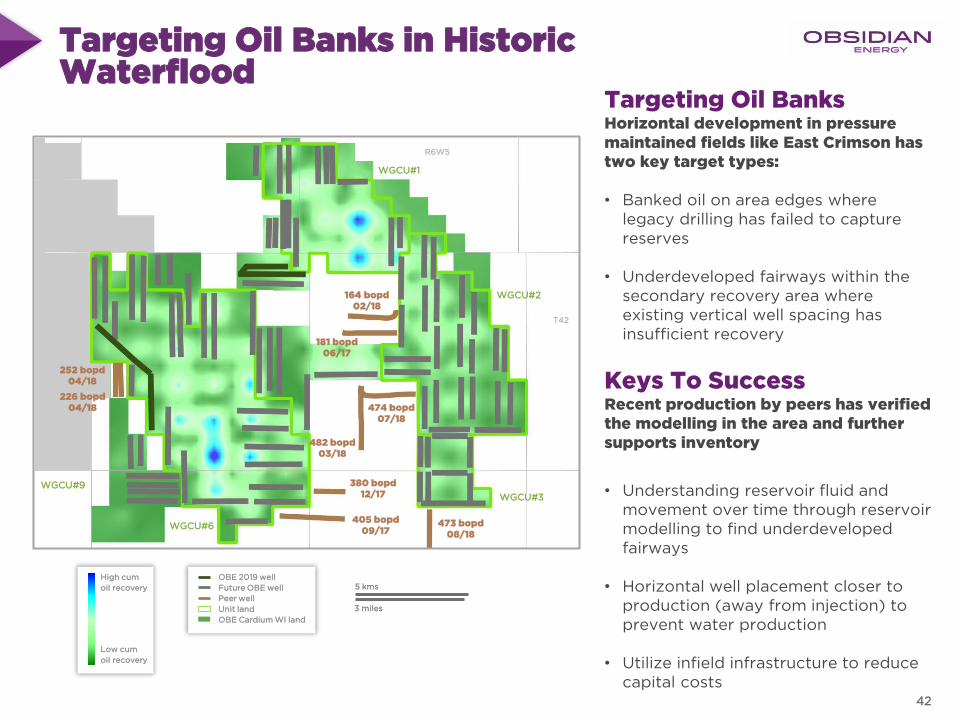
Targeting Oil Banks in Historic Waterflood
Targeting Oil Banks Horizontal development in pressure maintained fields like East Crimson has two key target types:
• Banked oil on area edges where legacy drilling has failed to capture reserves
• Underdeveloped fairways within the secondary recovery area where existing vertical well spacing has insufficient recovery
Keys To SuccessRecent production by peers has verified the modelling in the area and further supports inventory
• Understanding reservoir fluid and movement over time through reservoir modelling to find underdeveloped fairways
• Horizontal well placement closer to production (away from injection) to prevent water production
• Utilize infield infrastructure to reduce capital costs
3 miles
5 kms
WGCU#9
R6W5
WGCU#6
WGCU#1
WGCU#2
T42
474 bopd07/18
482 bopd03/18
181 bopd06/17
164 bopd02/18
High cum
oil recovery
Low cum
oil recovery
WGCU#3
OBE 2019 well
Future OBE well
Peer well
Unit land
OBE Cardium WI land
473 bopd08/18
380 bopd12/17
405 bopd09/17
252 bopd04/18
226 bopd04/18
42
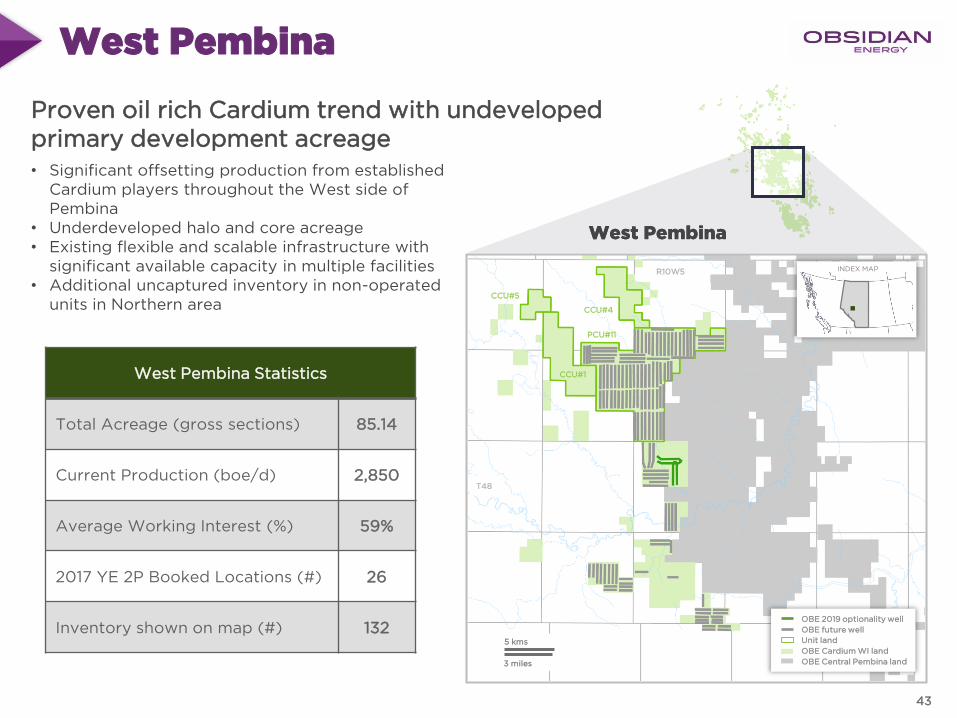
West Pembina
• Significant offsetting production from established Cardium players throughout the West side of Pembina
• Underdeveloped halo and core acreage• Existing flexible and scalable infrastructure with
significant available capacity in multiple facilities• Additional uncaptured inventory in non-operated
units in Northern area
Proven oil rich Cardium trend with undeveloped primary development acreage
West Pembina Statistics
Total Acreage (gross sections) 85.14
Current Production (boe/d) 2,850
Average Working Interest (%) 59%
2017 YE 2P Booked Locations (#) 26
Inventory shown on map (#) 132
West PembinaWest Pembina
3 miles
5 kms
INDEX MAPR10W5
T48
CCU#4
CCU#5
CCU#1
PCU#11
OBE 2019 optionality well
OBE future well
Unit land
OBE Cardium WI land
OBE Central Pembina land
43
0
20
40
60
80
2019 2020 2021
We
ll C
ou
nt
Central PembinaWest PembinaEast CrimsonCrimson Lake 2,200mCrimson Lake 2,600m
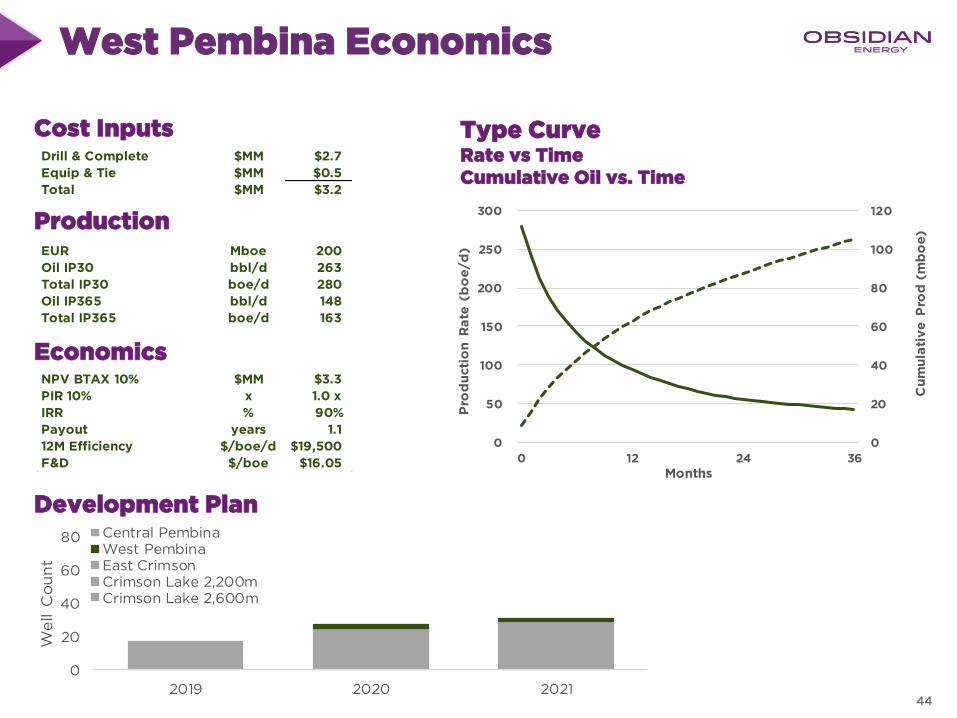
Drill & Complete $MM $2.7
Equip & Tie $MM $0.5
Total $MM $3.2
EUR Mboe 200
Oil IP30 bbl/d 263
Total IP30 boe/d 280
Oil IP365 bbl/d 148
Total IP365 boe/d 163
NPV BTAX 10% $MM $3.3
PIR 10% x 1.0 x
IRR % 90%
Payout years 1.1
12M Efficiency $/boe/d $19,500
F&D $/boe $16.05
0
20
40
60
80
100
120
0
50
100
150
200
250
300
0 12 24 36
Cu
mu
lati
ve
Pro
d (
mb
oe
)
Pro
du
cti
on
Ra
te (
bo
e/d
)Months
West Pembina Economics
Cost Inputs
Production
Economics
Type CurveRate vs TimeCumulative Oil vs. Time
Development Plan
44
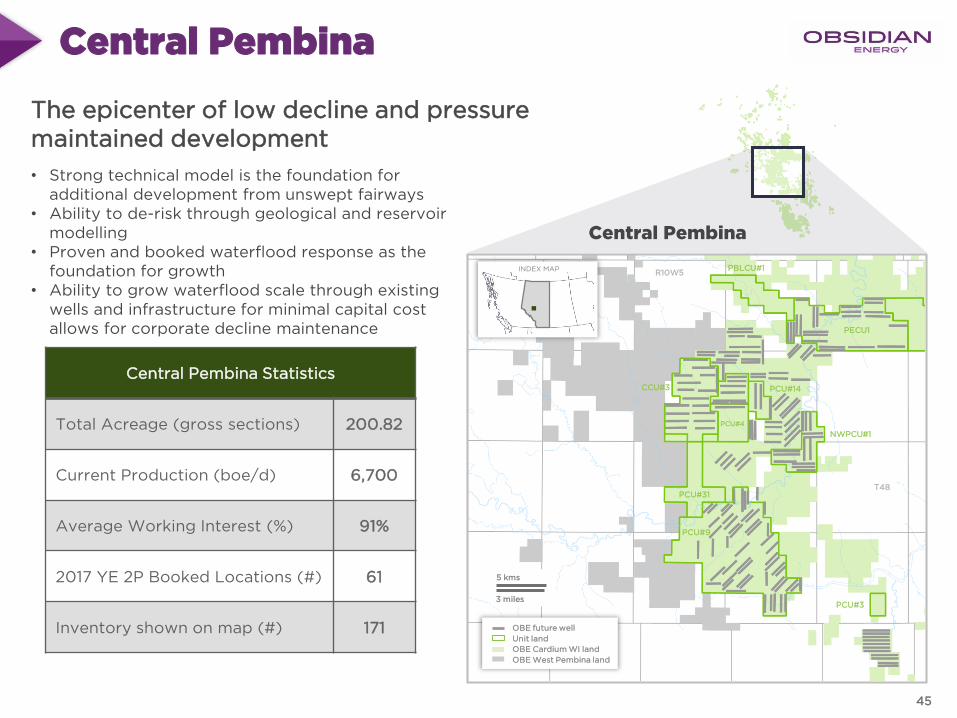
Central Pembina
• Strong technical model is the foundation for additional development from unswept fairways
• Ability to de-risk through geological and reservoir modelling
• Proven and booked waterflood response as the foundation for growth
• Ability to grow waterflood scale through existing wells and infrastructure for minimal capital cost allows for corporate decline maintenance
The epicenter of low decline and pressure maintained development
Central Pembina Statistics
Total Acreage (gross sections) 200.82
Current Production (boe/d) 6,700
Average Working Interest (%) 91%
2017 YE 2P Booked Locations (#) 61
Inventory shown on map (#) 171
Central Pembina
3 miles
5 kms
INDEX MAPR10W5
T48
OBE future well
Unit land
OBE Cardium WI land
OBE West Pembina land
PBLCU#1
PCU#3
PCU#9
PCU#31
NWPCU#1
PECU1
PCU#14CCU#3
PCU#4
45
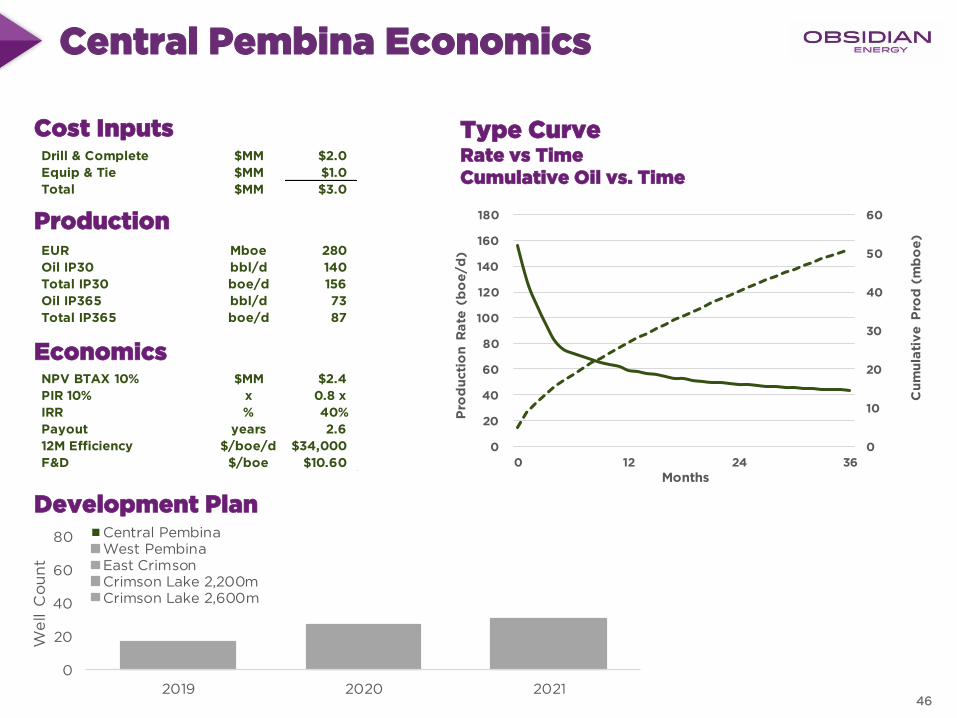
Drill & Complete $MM $2.0
Equip & Tie $MM $1.0
Total $MM $3.0
EUR Mboe 280
Oil IP30 bbl/d 140
Total IP30 boe/d 156
Oil IP365 bbl/d 73
Total IP365 boe/d 87
NPV BTAX 10% $MM $2.4
PIR 10% x 0.8 x
IRR % 40%
Payout years 2.6
12M Efficiency $/boe/d $34,000
F&D $/boe $10.60
0
20
40
60
80
2019 2020 2021
We
ll C
ou
nt
Central PembinaWest PembinaEast CrimsonCrimson Lake 2,200mCrimson Lake 2,600m
0
10
20
30
40
50
60
0
20
40
60
80
100
120
140
160
180
0 12 24 36
Cu
mu
lati
ve
Pro
d (
mb
oe
)
Pro
du
cti
on
Ra
te (
bo
e/d
)
Months
Central Pembina Economics
Cost Inputs
Production
Economics
Type CurveRate vs TimeCumulative Oil vs. Time
Development Plan
46
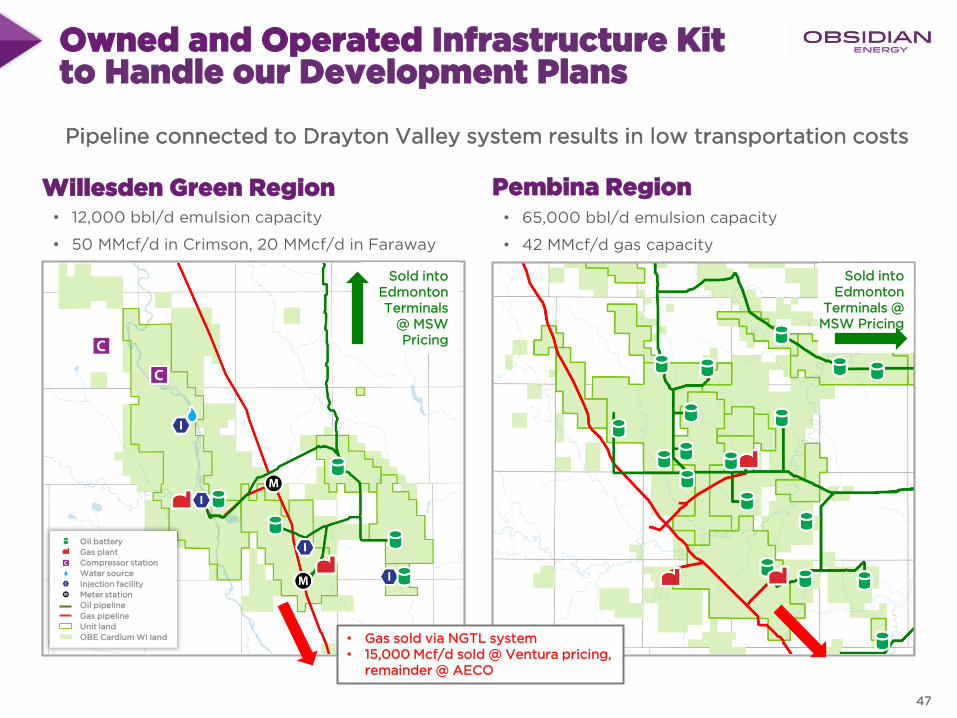
Owned and Operated Infrastructure Kit to Handle our Development Plans
47
• 12,000 bbl/d emulsion capacity
• 50 MMcf/d in Crimson, 20 MMcf/d in Faraway
Willesden Green Region Pembina Region
Sold into Edmonton Terminals
@ MSW Pricing
Sold into Edmonton
Terminals @ MSW Pricing
Oil battery
Gas plant
Compressor station
Water source
Injection facility
Meter station
Oil pipeline
Gas pipeline
Unit land
OBE Cardium WI land • Gas sold via NGTL system• 15,000 Mcf/d sold @ Ventura pricing,
remainder @ AECO
• 65,000 bbl/d emulsion capacity
• 42 MMcf/d gas capacity
Pipeline connected to Drayton Valley system results in low transportation costs
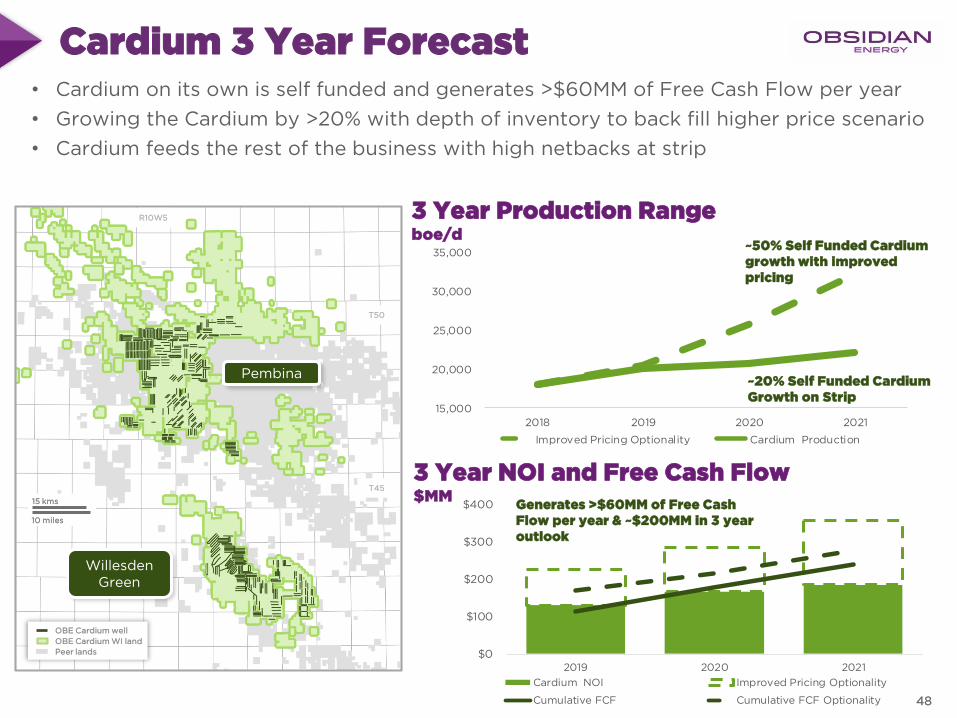
$0
$100
$200
$300
$400
2019 2020 2021
Cardium NOI Improved Pricing Optionality
Cumulative FCF Cumulative FCF Optionality
15,000
20,000
25,000
30,000
35,000
2018 2019 2020 2021
Improved Pricing Optionality Cardium Production
Cardium 3 Year Forecast• Cardium on its own is self funded and generates >$60MM of Free Cash Flow per year
• Growing the Cardium by >20% with depth of inventory to back fill higher price scenario
• Cardium feeds the rest of the business with high netbacks at strip
3 Year Production Rangeboe/d
~20% Self Funded Cardium Growth on Strip
T50
10 miles
15 kms
Pembina
Willesden Green
T45
R10W5
OBE Cardium well
OBE Cardium WI land
Peer lands
3 Year NOI and Free Cash Flow$MM
Generates >$60MM of Free Cash Flow per year & ~$200MM in 3 year outlook
~50% Self Funded Cardium growth with improved pricing
48

Q & A
50
Other AssetsDeep Basin, Peace River & AB Viking
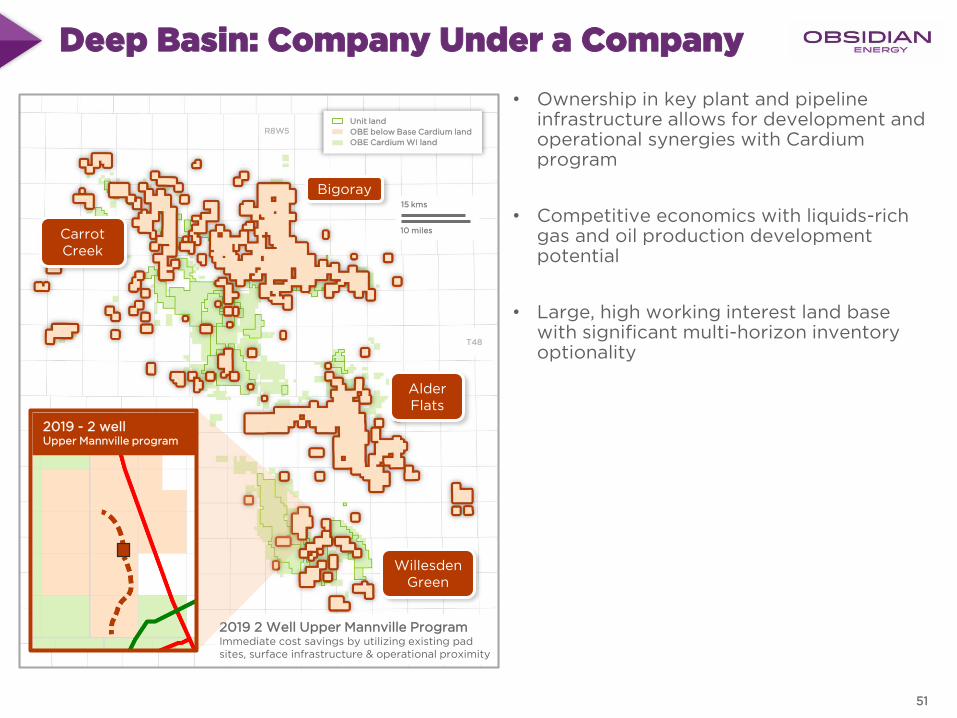
Deep Basin: Company Under a Company
• Ownership in key plant and pipeline infrastructure allows for development and operational synergies with Cardiumprogram
• Competitive economics with liquids-rich gas and oil production development potential
• Large, high working interest land base with significant multi-horizon inventory optionality
Unit land
OBE below Base Cardium land
OBE Cardium WI land
Willesden Green
Bigoray
Carrot Creek
AlderFlats
R8W5
T48
10 miles
15 kms
2019 2 Well Upper Mannville ProgramImmediate cost savings by utilizing existing pad sites, surface infrastructure & operational proximity
2019 - 2 well Upper Mannville program
51
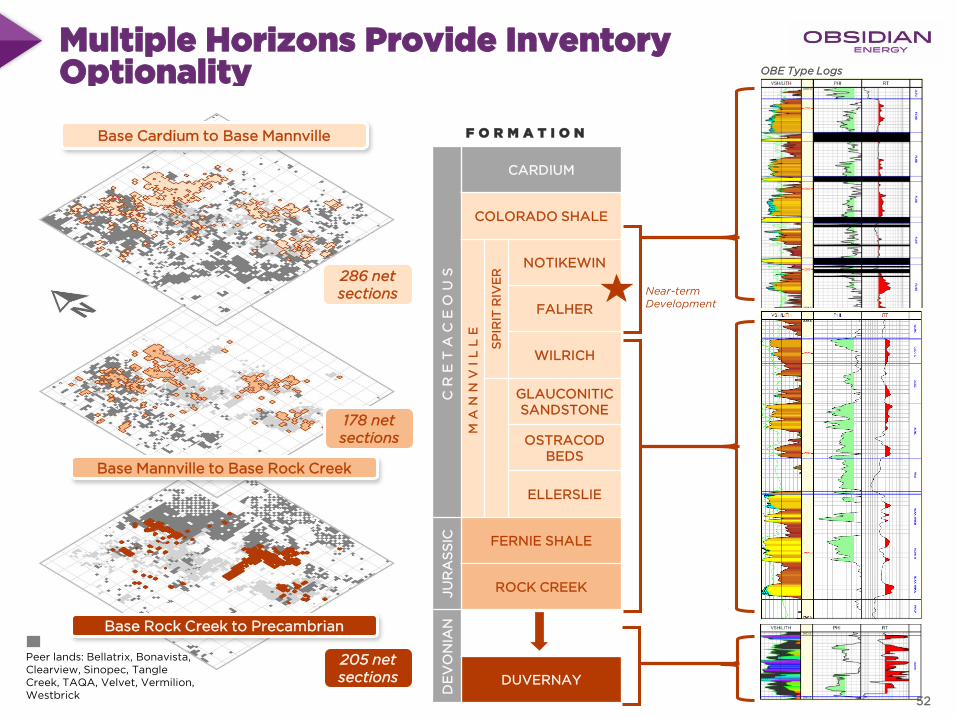
Multiple Horizons Provide Inventory Optionality
Base Cardium to Base Mannville
Base Mannville to Base Rock Creek
Base Rock Creek to Precambrian
Peer lands: Bellatrix, Bonavista, Clearview, Sinopec, Tangle Creek, TAQA, Velvet, Vermilion, Westbrick
F O R M A T I O N
CR
ET
AC
EO
US
CARDIUM
COLORADO SHALE
MA
NN
VI
LL
E
SP
IRIT
RIV
ER
NOTIKEWIN
FALHER
WILRICH
GLAUCONITIC SANDSTONE
OSTRACOD BEDS
ELLERSLIE
JU
RA
SS
IC FERNIE SHALE
ROCK CREEK
DE
VO
NIA
N
DUVERNAY
286 net sections
178 net sections
205 net sections
Near-term Development
OBE Type Logs
52
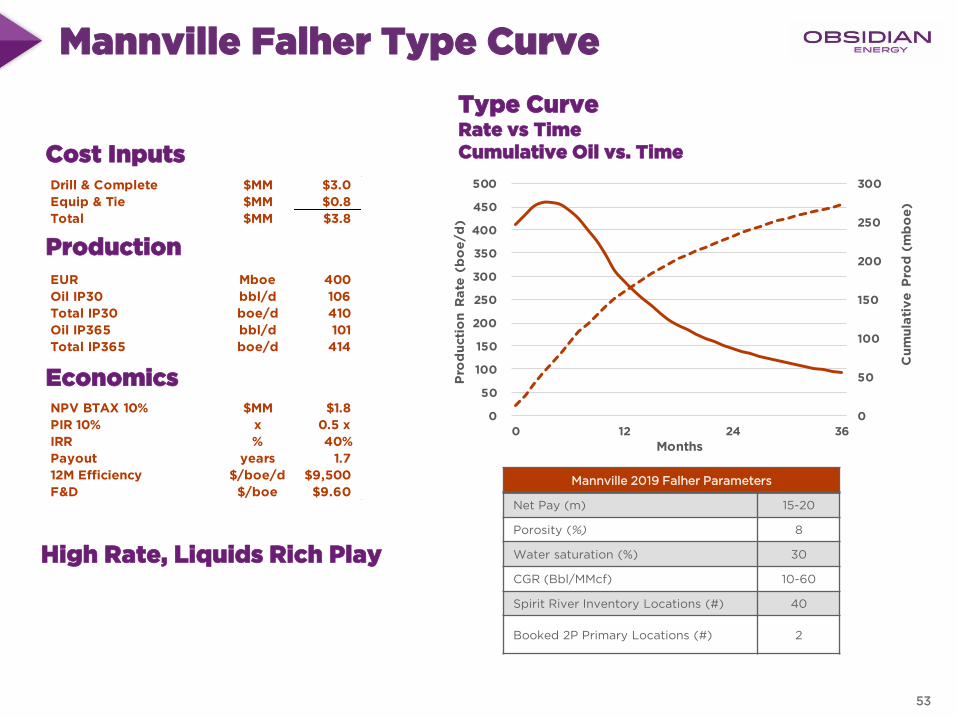
Drill & Complete $MM $3.0
Equip & Tie $MM $0.8
Total $MM $3.8
EUR Mboe 400
Oil IP30 bbl/d 106
Total IP30 boe/d 410
Oil IP365 bbl/d 101
Total IP365 boe/d 414
NPV BTAX 10% $MM $1.8
PIR 10% x 0.5 x
IRR % 40%
Payout years 1.7
12M Efficiency $/boe/d $9,500
F&D $/boe $9.60
Mannville Falher Type Curve
Cost Inputs
Production
Economics
Type CurveRate vs TimeCumulative Oil vs. Time
High Rate, Liquids Rich Play
Mannville 2019 Falher Parameters
Net Pay (m) 15-20
Porosity (%) 8
Water saturation (%) 30
CGR (Bbl/MMcf) 10-60
Spirit River Inventory Locations (#) 40
Booked 2P Primary Locations (#) 2
0
50
100
150
200
250
300
0
50
100
150
200
250
300
350
400
450
500
0 12 24 36
Cu
mu
lati
ve
Pro
d (
mb
oe
)
Pro
du
cti
on
Ra
te (
bo
e/d
)Months
53
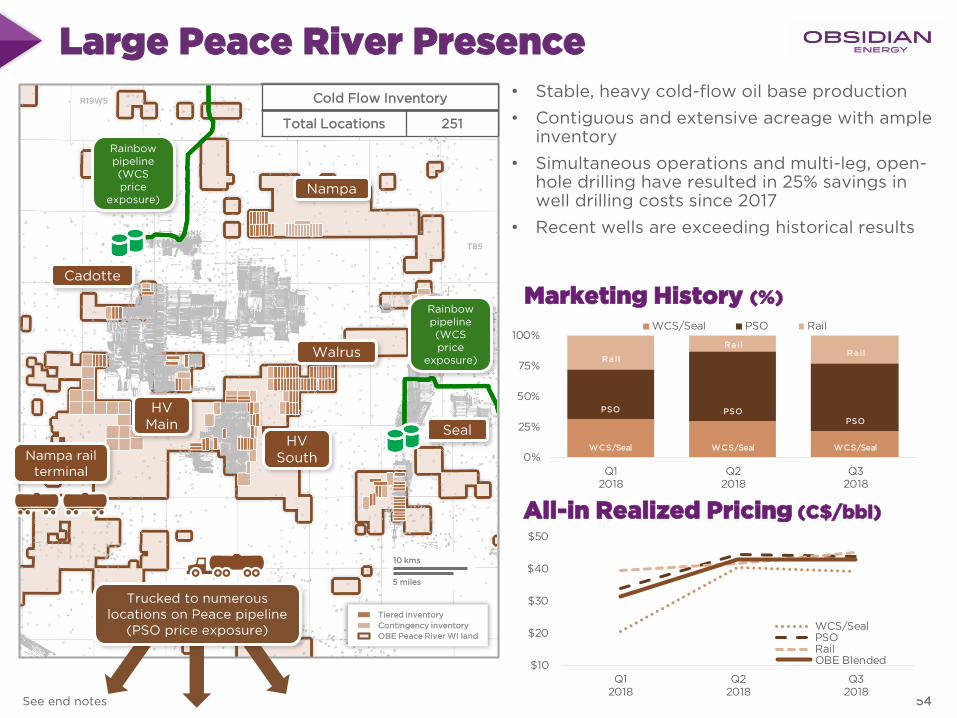
Large Peace River Presence
See end notes
• Stable, heavy cold-flow oil base production
• Contiguous and extensive acreage with ample inventory
• Simultaneous operations and multi-leg, open-hole drilling have resulted in 25% savings in well drilling costs since 2017
• Recent wells are exceeding historical results
Marketing History (%)
All-in Realized Pricing (C$/bbl)
WCS/Seal WCS/Seal WCS/Seal
PSO PSOPSO
Ra i l
Ra ilRa i l
0%
25%
50%
75%
100%
Q12018
Q22018
Q32018
WCS/Seal PSO Rail
Cold Flow Inventory
Total Locations 251
Cold Flow Inventory
Total Locations 251
Tiered inventory
Contingency inventory
OBE Peace River WI land
5 miles
10 kms
T85
Nampa
SealHV
South
Cadotte
Walrus
HVMain
Nampa rail terminal
Trucked to numerous locations on Peace pipeline
(PSO price exposure)
Rainbow pipeline(WCS price
exposure)
Rainbow pipeline(WCS price
exposure)
R19W5 Cold Flow Inventory
Total Locations 251
54
$10
$20
$30
$40
$50
Q12018
Q22018
Q32018
WCS/SealPSORailOBE Blended
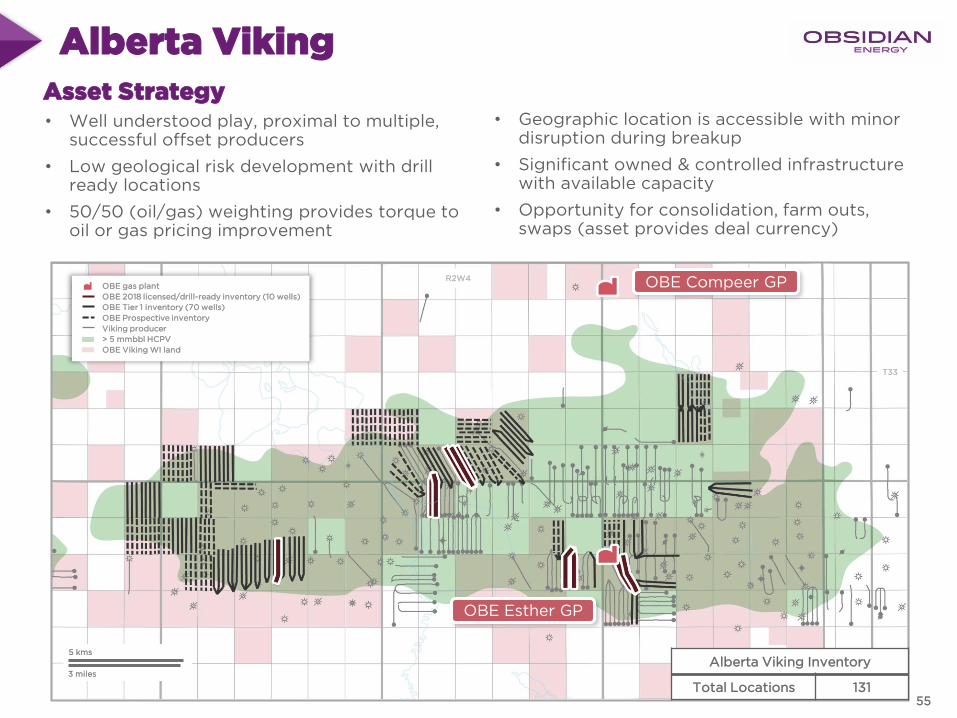
Alberta Viking
3 miles
5 kms
R2W4 OBE Compeer GP
OBE Esther GP
OBE gas plant
OBE 2018 licensed/drill-ready inventory (10 wells)
OBE Tier 1 inventory (70 wells)
OBE Prospective inventory
Viking producer
> 5 mmbbl HCPV
OBE Viking WI land
T33
Asset Strategy• Well understood play, proximal to multiple,
successful offset producers
• Low geological risk development with drill ready locations
• 50/50 (oil/gas) weighting provides torque to oil or gas pricing improvement
• Geographic location is accessible with minor disruption during breakup
• Significant owned & controlled infrastructure with available capacity
• Opportunity for consolidation, farm outs, swaps (asset provides deal currency)
Alberta Viking Inventory
Total Locations 13155
Achieving Our Priorities
56
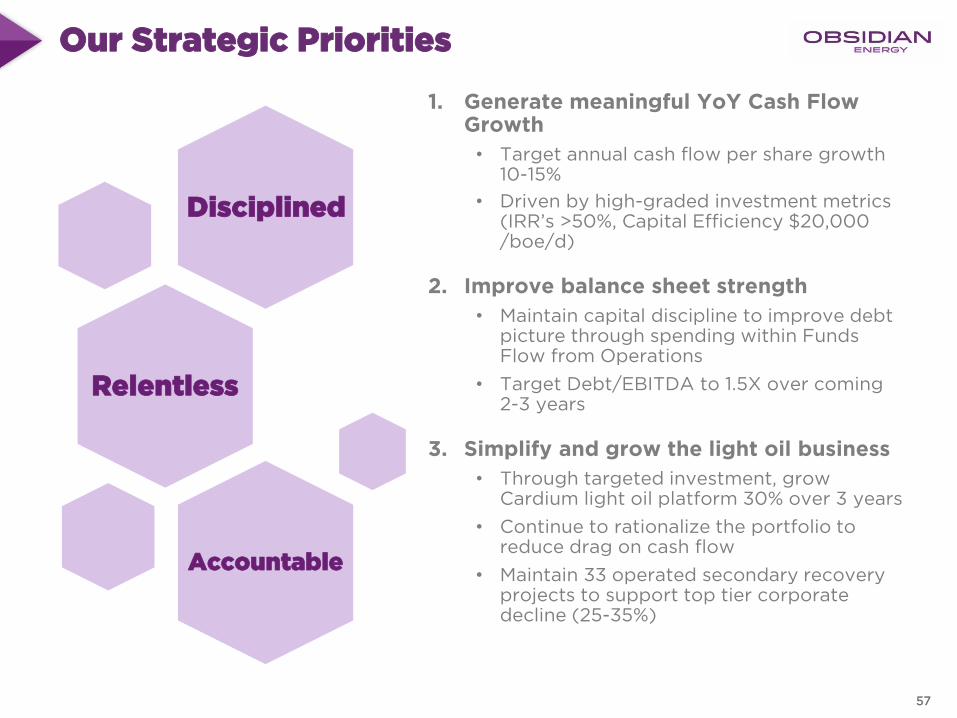
Our Strategic Priorities
1. Generate meaningful YoY Cash Flow Growth
• Target annual cash flow per share growth 10-15%
• Driven by high-graded investment metrics (IRR’s >50%, Capital Efficiency $20,000 /boe/d)
2. Improve balance sheet strength
• Maintain capital discipline to improve debt picture through spending within Funds Flow from Operations
• Target Debt/EBITDA to 1.5X over coming 2-3 years
3. Simplify and grow the light oil business
• Through targeted investment, grow Cardium light oil platform 30% over 3 years
• Continue to rationalize the portfolio to reduce drag on cash flow
• Maintain 33 operated secondary recovery projects to support top tier corporate decline (25-35%)
Disciplined
Relentless
Accountable
57
$0
$100
$200
$300
$400
2019 2020 2021
$0
$100
$200
$300
$400
2019 2020 2021
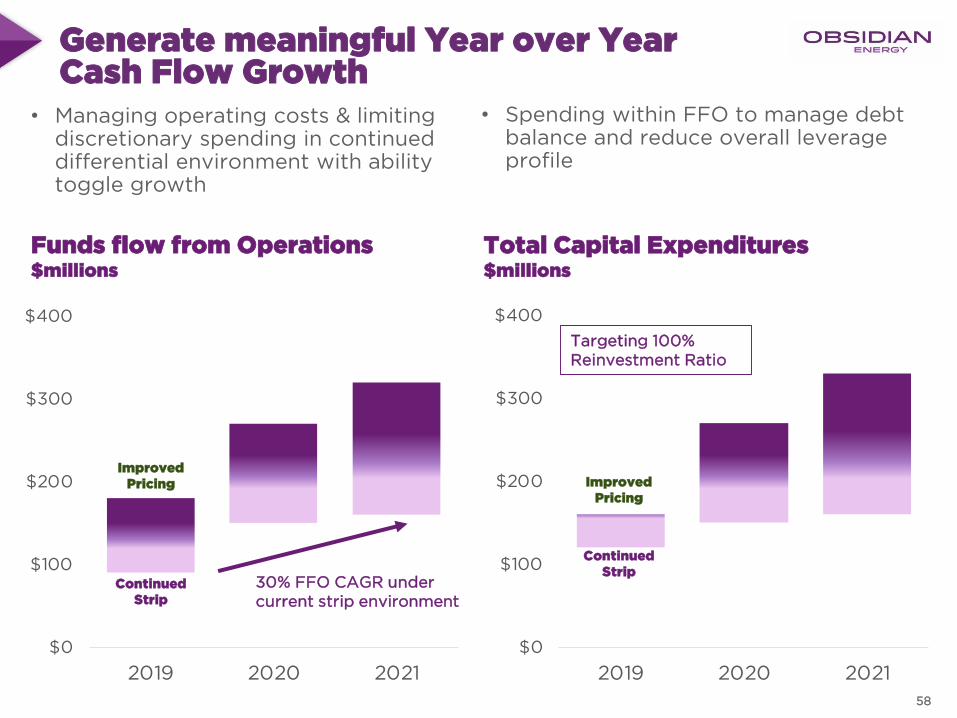
Generate meaningful Year over Year Cash Flow Growth
• Managing operating costs & limiting discretionary spending in continued differential environment with ability toggle growth
• Spending within FFO to manage debt balance and reduce overall leverage profile
30% FFO CAGR under current strip environment
Targeting 100%Reinvestment Ratio
Funds flow from Operations$millions
Total Capital Expenditures$millions
Improved Pricing
Continued Strip
Improved Pricing
Continued Strip
58
$0.00
$5.00
$10.00
$15.00
$20.00
$25.00
$30.00
2018 2019 2020 2021
Plan Pricing Improved Pricing Optionality
$8,500
$9,500
$17,000
$20,000
$0 $5,000 $10,000 $15,000 $20,000
Opti
Deep Basin
Cardium
Corporate
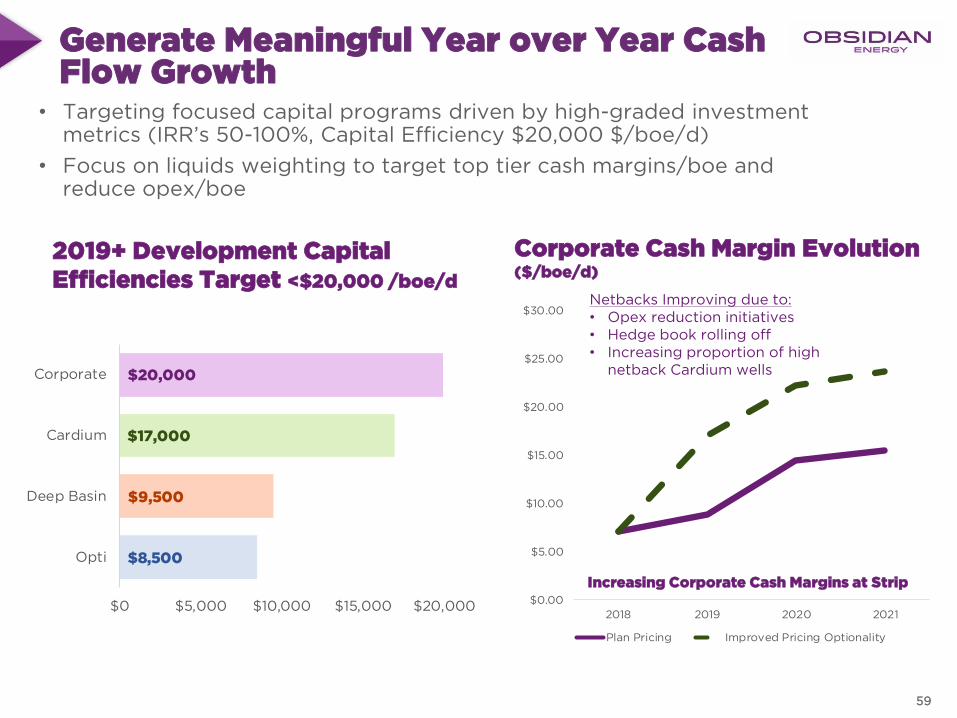
Generate Meaningful Year over Year Cash Flow Growth
2019+ Development Capital Efficiencies Target <$20,000 /boe/d
Corporate
Cardium
PROP
Opti
Deep Basin
• Targeting focused capital programs driven by high-graded investment metrics (IRR’s 50-100%, Capital Efficiency $20,000 $/boe/d)
• Focus on liquids weighting to target top tier cash margins/boe and reduce opex/boe
Corporate Cash Margin Evolution ($/boe/d)
Increasing Corporate Cash Margins at Strip
Netbacks Improving due to:• Opex reduction initiatives • Hedge book rolling off • Increasing proportion of high
netback Cardium wells
59
2.7x
1.5x
0.0x
0.5x
1.0x
1.5x
2.0x
2.5x
3.0x
Q3 2018 2020 Target
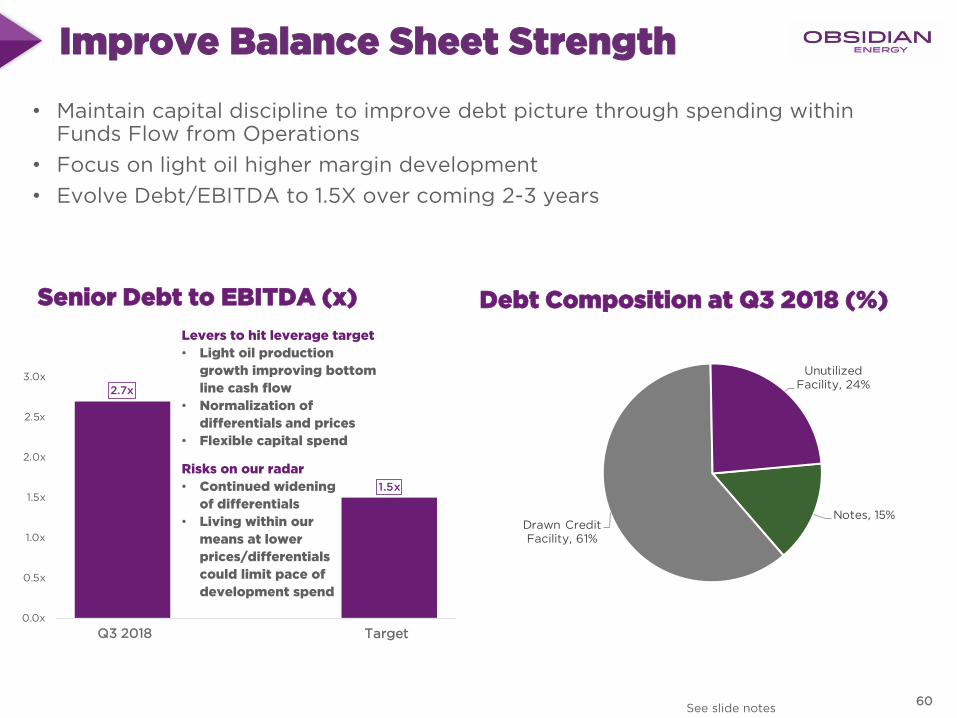
Improve Balance Sheet Strength
See slide notes
Senior Debt to EBITDA (x)
• Maintain capital discipline to improve debt picture through spending within Funds Flow from Operations
• Focus on light oil higher margin development
• Evolve Debt/EBITDA to 1.5X over coming 2-3 years
Debt Composition at Q3 2018 (%)
Levers to hit leverage target
• Light oil production
growth improving bottom
line cash flow
• Normalization of
differentials and prices
• Flexible capital spend
Risks on our radar
• Continued widening
of differentials
• Living within our
means at lower
prices/differentials
could limit pace of
development spend
60
TargetQ3 2018
Notes, 15%Drawn Credit Facility, 61%
Unutilized Facility, 24%
0
5,000
10,000
15,000
20,000
25,000
30,000
35,000
40,000
45,000
Jan-19 Jul-19 Jan-20 Jul-20 Jan-21 Jul-21
Plan Pricing Improved Pricing Optionality
0%
10%
20%
30%
40%
50%
60%
70%
80%
90%
100%
2019 2020 2021
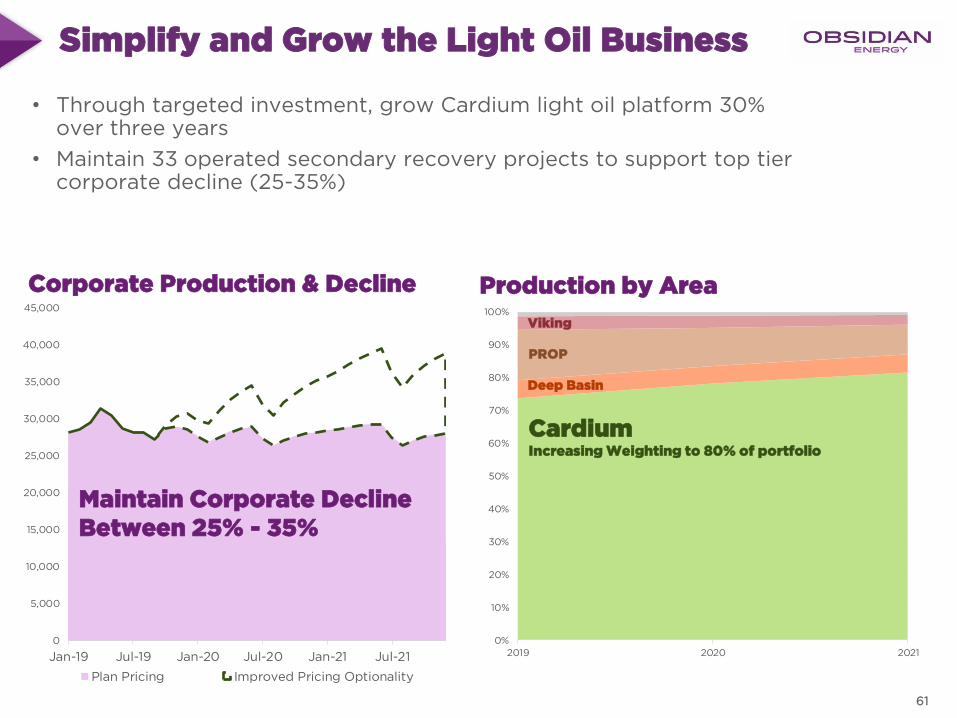
Simplify and Grow the Light Oil Business
Maintain Base Decline <25%
Corporate Production & Decline Production by Area
• Through targeted investment, grow Cardium light oil platform 30% over three years
• Maintain 33 operated secondary recovery projects to support top tier corporate decline (25-35%)
CardiumIncreasing Weighting to 80% of portfolio
Deep Basin
PROP
Viking
Maintain Corporate DeclineBetween 25% - 35%
61
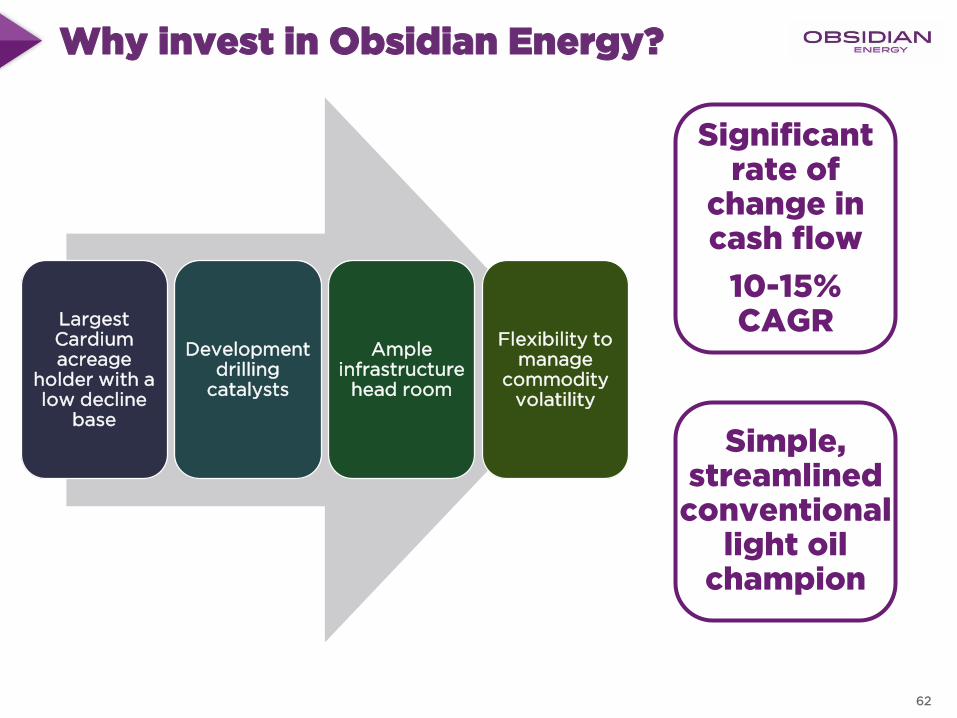
Why invest in Obsidian Energy?
Largest Cardium acreage
holder with a low decline
base
Development drilling
catalysts
Ample infrastructure
head room
Flexibility to manage
commodity volatility
Significant rate of
change in cash flow
10-15% CAGR
Simple, streamlined
conventional light oil
champion
62

Q & A
Appendix & Endnotes
64
End Notes
65
All slides should be read in conjunction with “Definitions and Industry Terms”, “Non-GAAP Measure Advisory”, “Oil and Gas Information Advisory”, “Reserves Disclosure and Definitions Advisory”
and “Forward-Looking Advisory”. Unless noted otherwise, the pricing assumption for slide 7 are applicable for all the of the slides. All locations are considered to be Unbooked locations unless
otherwise noted.
Slide 6: Highlights from the Quarter
Highlights refer to the refer to the Company’s unaudited consolidated financial statements, Management's Discussion
and Analysis ("MD&A") for the three and nine months ended September 30, 2018.
Slide 8: Topics of Interest Post Release
Impact of WTI, differentials and Q4 cash flow based on internal estimates.
Slide 9: Willesden Green H2 2018 Program Summary
Production amounts and timing is based on internal estimates.
Slides 11 and 12: Results Slides
Accumap Avg. Daily oil is Peak Calendar Day Oil Rate sourced from public data sourced from IHS Accumap. Peak IP30
Oil is highest continuous 30 day production from internal production data. Completion flow back is indicative of
performance expectations, but actual well production will vary.
Slide 13 : Asset Retirement Reduction
ARO discounted at 6.5%
Slide 14 : Asset Retirement Obligation Improvement
Cost estimates are based on internal estimates.
Slide 15 : Select Legacy Property Shut-Ins
Corporate metric impact and ARO impact of shut-ins are based on internal estimates.
Slide 19: Willesden Green Focus – why we like it
Netbacks ae based on internal estimates
Slide 20: H1 Capital Program
Other capital includes, decommissioning expenditures, opex reduction initiatives, maintenance & corporate capital.
Production and capital expenditures are based on internal estimates for 2019
Slide 21: 2019 Capital Bookends – Plan Inputs
Other capital includes, decommissioning expenditures, opex reduction initiatives, maintenance & corporate capital.
Production and capital expenditures are based on internal estimates for 2019
Slide 23: 2019 Plan Production & Cost Guidance
Growth rates are relative to projected full year 2018 production (using midpoint of guidance), adjusted for shut in
volumes, of 27,250 boe per day
Slide 28: Asset Overview
Other capital includes, decommissioning expenditures, opex reduction initiatives, maintenance & corporate capital.
Production and capital expenditures are based on internal estimates for 2019
Slide 31: Revitalization of the Cardium Play
Historical production and well count is public data sourced from IHS Accumap, all producing wells from Cardium
formation. Historic cumulative well production is public data sourced from IHS Accumap for horizontal producing wells
within the Willesden Green field rig released 2014 to current.
Slide 32: The Obsidian Energy Cardium Advantage
Peer land ownership is calculated from public data sourced from IHS Accumap. Developed sections are determined
from total horizontal wells drilled by licensee from public data sourced from IHS Accumap assuming four horizontal wells
per section. Total developed section percentage is calculated assuming four horizontal wells per section divided by total
gross land acreage as per the methods above. Where unit ownership is shared between parties, gross acreage is
counted for both parties. Peer Group includes BNE, ARX, TVE, WCP, VET, IPO, YGR
Slide 33: The Broader Cardium Opportunity
Production data (12 month cumulative oil, 12 month cumulative gas, and 12 month cumulative production) are calculated averages
from public data sourced from IHS Accumap as at October 2018. Well populations (as outlined on the slide) are all horizontal wells
producing from the Cardium formation from the defined Willesden Green, Pembina, and Ferrier fields as licensed on the well. Wells
labelled as “OBE ‘17/’18 Willesden Green” utilizes public production data from IHS Accumap as at October 2018 for Obsidian
Energy surface pads 14-1, 11-3, and 9-4 (6 wells). Where a well has not yet produced for 12 months, current cumulative production
is used in the calculation.
Slide 34: Breaking Down the Cardium Play Fairways
Individual play fairways are Obsidian Energy defined trends displaying similar reservoir and geological characteristics. The “448
type curve assigned locations” estimates that full field development based on the inventory locations outlined would achieved an
estimated average production consistent with the defined type curve for that fairway. Type curves are defined by existing productive
wells within the defined trend displaying similar reservoir and geological characteristics and normalized for horizontal length and
completion. Inventory not included within the assigned 448 has not been assigned a production profile and has not been included
in development plan models or forward-looking production estimates
Slide 35 , 40 , 43 and 45: Asset Slides
All reserve locations are as defined by Sproule at YE2017 and do not include 2018 development activity. Booked locations include
both waterflood locations, waterflood development, and primary drilling locations. Total acreage and WI are based on green
highlighted land in the corresponding map. WI is calculated across the entire highlighted region of the map and includes land where
Obsidian Energy is not the operator. No inventory locations have been assigned to land where Obsidian Energy is not the operator.
Slide 36, 41, 44 and 46: Economic Slides
Economic metrics are defined from provided type curves and the previously defined price deck. Type curve production is defined by
existing productive wells within the defined trend displaying similar reservoir and geological characteristics and normalized for
horizontal length and completion. Development plan well counts are indicative and based on internal estimates under our Plan
pricing scenario.
Slide 37: Drilling Longer Wells, Efficiently
Drill days are calculated from spud to rig release date.
Slide 38: Optimized Well Design to Maximize the Economics of our Acreage
Economic models are based modelled well productivity where Inter-well spacing, Inter-frac spacing, and Lateral Length are variable
against fixed standard well performance and design based on Obsidian Energy internal calculations. Economic modelling is
illustrative and will vary with individual well geology, reservoir composition, capital costs, and price assumptions.
Slide 39: Crimson Lake Cost Reduction Trajectory
Capital costs and savings are estimates and based on average well design and costs. Individual well costs will vary based on
depth, well design, surface constraints, road access, and external factors such as market demand and weather.
Slide 42: Targeting Oil Banks in Historic Waterfloods
Peer posted rates from offsetting wells are peak calendar day rate from public data sourced from IHS Accumap with corresponding
date labelled. Cumulative oil recovery is illustrative of total cumulative oil produced to date based on reservoir modelling and are
not reflective of variations in geology, waterflood effectiveness, or fluid composition.
Slide 47: Owned and Operated Infrastructure Kit to Handle our Development Plans
Capacities based on cumulative capabilities of Obsidian Energy operated facilities within the mapped area. Maps are illustrative
and not all infrastructure and facilities are highlighted.
Slide 53 – Mannville Falher Type Curve
Economic metrics are defined from provided type curves and the previously defined price deck. Type curve production is defined by
existing productive wells within the defined trend displaying similar reservoir and geological characteristics and normalized for
horizontal length and completion.
Slide 58 - 61
Plan pricing outlook and increased pricing optionality profiles are based on internal estimates and do not constitute official guidance
for 2020 and 2021.
Definitions and Industry Terms
66
F&D means finding and development costs
Frac means fraccing, short name for Hydraulic fracturing, a method for extracting oil and natural gas
FX means foreign exchange rate, in our case typically refers to C$ to US$ exchange rates
Free Cash Flow, which is Funds Flow from Operations less Total Capital Expenditures
FFO means funds flow from operations, detailed in the Non-GAAP measure advisory
FY means fiscal year
G&A means general and administrative expenses
GOR means gas oil ratio
H1 means first half of the year
H2 means second half of the year
Hz means horizontal well
IP means initial production, which is the average production over a specified time period
IRR means Internal Rate of Return which is the interest rate at which the NPV equals zero
Liquids means crude oil and NGLs
LITH means lithology, and expresses the composition or rock type where regions shaded as yellow are defined as sandstone
M or k means thousands
MMcf means million cubic feet and Mmcf/d means million cubic feet per day
Mboe means thousand barrels oil equivalent
MMboe means million barrels oil equivalent
Mbbl & MMbbl means thousands barrels of oil and million barrels of oil, respectively
N, S, E, W means the North, South, East, West or in any combination
NAV means net asset value
NGL means natural gas liquids which includes hydrocarbon not marketed as natural gas (methane) or various classes of oil
PDP means proved developed producing reserves as per Oil and Gas Disclosures Advisory
1P means proved reserves as per Oil and Gas Disclosures Advisory
2P means proved plus probable reserves as per Oil and Gas Disclosures Advisory
12M Efficiency means 12 month capital efficiency in $/boe/d
ABC means area based closure program initiative from the AER
A&D means oil and natural gas property acquisitions and divestitures
A&D Adj. means oil and natural gas property acquisitions and divestitures
AER means Alberta Energy Regulator
Artificial Lift means the use of artificial means to increase the flow of hydrocarbons out of a well
ARO means Asset Retirement Obligation
bbl and bbl/d means barrels of oil and barrels of oil per day, respectively
bopd means barrel of oil per day
boe, boe/d means barrels of oil equivalent and barrels of oil equivalent per day, respectively
CAGR means compound annual growth rate
Capital Expenditures & Capex includes all direct costs related to our operated and non-operated development programs including drilling, completions, tie-in, development of and expansions to existing facilities and major infrastructure, optimization and EOR activities
CFPS means cash flow per share
CGR means condensate gas ratio
Company or OBE means Obsidian Energy Ltd; as applicable
Decommissioning means decommissioning expenditures
Enviro means decommissioning expenditures
EUR means estimated ultimate recovery
NGTL means a TransCanada operated transmission line
NPV means net present value, before tax discounted at 10 percent
NYSE means New York Stock Exchange
OGIP means original gas in place
Opex means operating costs
Payout means the time it takes to cover the return of your initial cash outlay
PCU means Pembina Cardium Unit
PIR means profit investment ratio, defined as NPV divided by capital outlay
POR means porosity
Perm means permeability
PROP means Peace River Oil Partnership
PSO means peace sour
ROP means rate of penetration
SEC means U.S. Securities and Exchange Commission
Spud mean the process of beginning to drill a well
Unbooked means locations that are internal estimates based on Obsidian Energy’s prospective acreage and an assumption as to the number of wells that can be drilled per section based on industry practice and internal review. Unbooked locations do not have attributed reserves or resources (including contingent and prospective). Unbooked locations have been identified by management as an estimation of Obsidian Energy’s multi-year drilling activities based on evaluation of applicable geologic, seismic, engineering, production and reserves information.
VHS means shale volume of a given rock volume.
WCS means Western Canadian Select
WI means working interest
WF means waterflood
WTI means West Texas Intermediate
YOY means year over year
Non-GAAP Measures Advisory
67
Non-GAAP measures advisory
In this presentation, we refer to certain financial measures that are not determined in accordance with IFRS. These measures as presented do not have any standardized meaning prescribed by IFRS and therefore they may not be comparable with calculations of similar measures for other companies. We believe that, in conjunction with results presented in accordance with IFRS, these measures assist in providing a more complete understanding of certain aspects of our results of operations and financial performance. You are cautioned, however, that these measures should not be construed as an alternative to measures determined in accordance with IFRS as an indication of our performance. These measures include the following:
EBITDA is cash flow from operations excluding the impact of changes in non-cash working capital, decommissioning expenditures, financing expenses, realized gains and losses on foreign exchange hedges on prepayments, realized foreign exchange gains and losses on debt prepayments and restructuring expenses. In addition, under the syndicated credit facility, realized foreign exchange gains or losses related to debt maturities are excluded from the calculation. EBITDA as defined by Obsidian Energy’s debt agreements excludes the EBITDA contribution from assets sold in the prior 12 months and is used within Obsidian Energy’s covenant calculations related to its syndicated bank facility and senior notes.
Fund flow is cash flow from operating activities before changes in non-cash working capital, decommissioning expenditures and office lease settlements
Funds flow from operations or FFO is cash flow from operating activities before changes in non-cash working capital, decommissioning expenditures and office lease settlements which also excludes the effects of financing related transactions from foreign exchange contracts and debt repayments and certain other expenses and is representative of cash related to continuing operations.
Netback is a measure of cash operating margin on an absolute or per-unit-of-production basis and is calculated as the absolute or per-unit-of-production amount of revenue less royalties, operating costs and transportation. The measure is used to assess the operational profitability of the company as well as relative profitability of individual assets. For additional information relating to netbacks, including a detailed calculation of our netbacks, see our latest management's discussion and analysis which is available in Canada at www.sedar.com and in the United States at www.sec.gov; and
Net debt is the amount of long-term debt, comprised of long-term notes and bank debt, plus net working capital (surplus)/deficit. Net debt is a measure of leverage and liquidity
Oil and Gas Information AdvisoryBarrels of oil equivalent ("boe") may be misleading, particularly if used in isolation. A boe conversion ratio of six thousand cubic feet of natural gas to one barrel of crude oil is based on an energy equivalency conversion method primarily applicable at the burner tip and does not represent a value equivalency at the wellhead. Given that the value ratio based on the current price of crude oil as compared to natural gas is significantly different from the energy equivalency conversion ratio of 6:1, utilizing a conversion on a 6:1 basis is misleading as an indication of value.
Reserves Disclosure and Definitions
68
Unless otherwise noted, any reference to reserves in this presentation are based on the report ("Sproule Report") prepared by Sproule Associates Limited dated January 29, 2018 where they evaluated one
hundred percent of the crude oil, natural gas and natural gas liquids reserves of Obsidian Energy and the net present value of future net revenue attributable to those reserves effective as at December 31,
2017. For further information regarding the Sproule Report, see Appendix A to our Annual Information Form dated March 6, 2018 ("AIF"). It should not be assumed that the estimates of future net revenues
presented herein represent the fair market value of the reserves. There is no assurance that the forecast price and cost assumptions will be attained and variances could be material. The recovery and reserves
estimates of crude oil, natural gas liquids and natural gas reserves provided herein are estimates only and there is no guarantee that the estimated reserves will be recovered. Actual crude oil, natural gas and
natural gas liquid reserves may be greater than or less than the estimates provided herein. The estimates of reserves for individual properties may not reflect the same confidence level as estimates of reserves
for all properties, due to the effects of aggregation.
Production and Reserves
The use of the word "gross" in this presentation (i) in relation to our interest in production and reserves, means our working interest (operating or non-operating) share before deduction of royalties and without
including our royalty interests, (ii) in relation to wells, means the total number of wells in which we have an interest, and (iii) in relation to properties, means the total area of properties in which we have an
interest. The use of the word "net" in this presentation (i) in relation to our interest in production and reserves, means our working interest (operating or non-operating) share after deduction of royalty
obligations, plus our royalty interests, (ii) in relation to our interest in wells, means the number of wells obtained by aggregating our working interest in each of our gross wells, and (iii) in relation to our interest in
a property, means the total area in which we have an interest multiplied by the working interest owned by us. Unless otherwise stated, production volumes and reserves estimates in this presentation are stated
on a gross basis. All references to well counts are net to the Company, unless otherwise indicated.
Reserve Definitions
Reserves are estimated remaining quantities of oil and natural gas and related substances anticipated to be recoverable from known accumulations, as of a given date, based on the analysis of drilling,
geological, geophysical, and engineering data; the use of established technology; and specified economic conditions, which are generally accepted as being reasonable. Reserves are classified according to the
degree of certainty associated with the estimates.
proved reserves are those reserves that can be estimated with a high degree of certainty to be recoverable. It is likely that the actual remaining quantities recovered will exceed the estimated
proved reserves.
probable reserves are those additional reserves that are less certain to be recovered than proved reserves. It is equally likely that the actual remaining quantities recovered will be greater or less
than the sum of the estimated proved plus probable reserves.
Each of the reserves categories (proved and probable) may be divided into developed and undeveloped categories:
Developed reserves are those reserves that are expected to be recovered from existing wells and installed facilities or, if facilities have not been installed, that would involve a low expenditure (for example,
when compared to the cost of drilling a well) to put the reserves on production. The developed category may be subdivided into producing and non-producing.
Developed producing reserves are those reserves that are expected to be recovered from completion intervals open at the time of the estimate. These reserves may be currently producing or, if
shut-in, they must have previously been on production, and the date of resumption of production must be known with reasonable certainty.
Developed non-producing reserves are those reserves that either have not been on production, or have previously been on production, but are shut-in, and the date of resumption of production is
unknown.
Undeveloped reserves are those reserves expected to be recovered from known accumulations where a significant expenditure (for example, when compared to the cost of drilling a well) is required to render
them capable of production. They must fully meet the requirements of the reserves category (proved, probable) to which they are assigned.
For additional reserve definitions, see "Notes to Reserves Data Tables" in our AIF.
Forward-Looking Information Advisory
69
Certain statements contained in this presentation constitute forward-looking statements or information (collectively "forward-looking statements. Forward-looking statements are typically identified by words such as "anticipate", "continue",
"estimate", "expect", "forecast", "budget", "may", "will", "project", "could", "plan", "intend", "should", "believe", "outlook", "objective", "aim", "potential", "target" and similar words suggesting future events or future performance. In addition, statements
relating to "reserves" or "resources" are deemed to be forward-looking statements as they involve the implied assessment, based on certain estimates and assumptions, that the reserves and resources described exist in the quantities predicted or
estimated and can be profitably produced in the future. In particular, this presentation contains, without limitation, forward-looking statements pertaining to the following: the expectation that full year 2018 guidance will be below guidance and
reasons for that expectation; the production wedge from 15 Willesden Green available in early 2019 which is 75% drilled; how the near term margin assessment decisions impact 2019 net cash flow; the expected impact of WTI and differentials on
the business; our expectations for Q4 2018 and the anticipation there will be a modest recovery in light differentials in Q1/Q2 2019; our plan to maintain optionality to respond to price volatility in the coming months; our expectations for our hedging
strategy, PROP and AB Viking moving forward; that we will review our NYSE listing and consider a share consolidation in Q1 2019 if required; our potential drilling locations and tie-in dates moving forward; our expected production at certain
locations; that participating in the ABC program enables a clear path to further reduce liability spend in a regulated and staged approach, yielding a more efficient and moderated spend profile; our expected ARO and how the Company plans to
deal with that obligation moving forward; that the AER’s ABC program creates a vehicle for disciplined ARO management and reduces the drag on the business; our plans to shut-in certain legacy properties and the impact that has on certain
corporate metrics and the ARO; what steps the Company will take to ensure wells coming on production continue to deliver returns; our 2019 development plans including capital expenditure, expected growth rates and areas to be concentrated
on; that we will have a decision point during Spring breakup on how much capital should be spent in the rest of 2019 based on current pricing; our inventory; our 2019 guidance including production, production growth, operating and G&A cost
ranges and how that capital will be allocated; the impact to annual production growth rates if the Company elects to increase it total capital spend to $160 million and the impact of that spend to Cardium production for Q4 2019; our strategic
priorities including meaningful year over year cash flow growth, improved balance sheet strength, and simplify and grow the light oil business and the details thereunder for each of these categories; that the Deep Basin plant and pipeline
infrastructure allow for development and operational synergies with the Cardium program; that we consider a return of capital to shareholders with excess free cash flow; that we are looking to exit of commercialize certain assets in the Company
portfolio; that the AB Viking provide opportunity for consolidation, farm outs, swaps; that the Cardium has significant remaining untapped potential; our ability to waterflood certain locations and for minimal capital through existing infrastructure;
our targeted reduction in type well costs for our 2019 activity; that our ability to grow waterflood scale through existing wells and infrastructure for minimal capital cost allows for corporate decline maintenance; that our owned and operated
infrastructure kit can handle our development plans; our expectations for the 3 year production range and 3 year NOI and free cash flow in the Cardium and how strip pricing and greater than strip pricing will impact self funded growth in the area;
that there is immediate costs savings by utilizing existing pad sites, surface infrastructure and operational proximity in the two well upper Mannville program; that multi-horizon inventory provide optionality; that the Company will managing operating
costs and limit discretionary spending in continued differential environment with ability to toggle growth; that we will spend within funds flow to manage debt balance and reduce overall leverage profile; our expectations for FFO and total capital
expenditures; that we are targeting focused capital programs driven by high-graded investment metrics; that we will focus on liquids weighting to target top tier cash margins/boe and reduce opex/boe; that in 2021 and beyond our capital program
will focus on a manufacturing style development lowering non-productive capital and improving capital efficiencies; our development target capital efficiencies target and breakdown of spend; to evolve our Senior Debt/EBITDA to 1.5 times over
coming 2-3 years; our target for growth on the Cardium light oil platform; and maintaining certain operated secondary recovery projects to support corporate decline rates.
The key metrics for the Company set forth in this presentation may be considered to be future-oriented financial information or a financial outlook for the purposes of applicable Canadian securities laws. Financial outlook and future-oriented
financial information contained in this presentation are based on assumptions about future events based on management's assessment of the relevant information currently available. In particular, this presentation contains projected operational
and financial information for 2018, 2019 and beyond for the Company. The future-oriented financial information and financial outlooks contained in this presentation have been approved by management as of the date of this presentation. Readers
are cautioned that any such financial outlook and future-oriented financial information contained herein should not be used for purposes other than those for which it is disclosed herein.
With respect to forward-looking statements contained in this document, we have made assumptions regarding, among other things: our ability to complete asset sales and the terms and timing of any such sales; the economic returns that we
anticipate realizing from expenditures made on our assets; future crude oil, natural gas liquids and natural gas prices and differentials between light, medium and heavy oil prices and Canadian, WTI and world oil and natural gas prices; future
capital expenditure levels; future crude oil, natural gas liquids and natural gas production levels; drilling results; future exchange rates and interest rates; future taxes and royalties; the continued suspension of our dividend; our ability to execute our
capital programs as planned without significant adverse impacts from various factors beyond our control, including weather, infrastructure access and delays in obtaining regulatory approvals and third party consents; our ability to obtain equipment
in a timely manner to carry out development activities and the costs thereof; our ability to market our oil and natural gas successfully; our ability to obtain financing on acceptable terms, including our ability to renew or replace our reserve based
loan; our ability to finance the repayment of our senior secured notes on maturity; and our ability to add production and reserves through our development and exploitation activities. In addition, many of the forward-looking statements contained in
this document are located proximate to assumptions that are specific to those forward-looking statements, and such assumptions should be taken into account when reading such forward-looking statements. Please note that illustrative examples
are not to be construed as guidance for the Company and further details on assumptions can be found in the End Notes section of the presentation.
Although Obsidian Energy believes that the expectations and assumptions on which such forward-looking information is based are reasonable, undue reliance should not be placed on the forward-looking information because Obsidian Energy can
give no assurances that they will prove to be correct. Since forward-looking information addresses future events and conditions, by its very nature it involves inherent risks and uncertainties. Actual results could differ materially from those currently
anticipated due to a number of factors and risks. These include, but are not limited to: the risks associated with the oil and gas industry in general such as operational risks in development, exploration and production; the possibility that the semi-
annual borrowing base re-determination under our reserve-based loan is not acceptable to the Company or that we breach one or more of the financial covenants pursuant to our amending agreements with holders of our senior, secured notes;
delays or changes in plans with respect to exploration or development projects or capital expenditures; the uncertainty of estimates and projections relating to reserves, production, costs and expenses; health, safety and environmental risks;
commodity price and exchange rate fluctuations; interest rate fluctuations; marketing and transportation; loss of markets; environmental risks; competition; incorrect assessment of the value of acquisitions; failure to complete or realize the
anticipated benefits of acquisitions or dispositions; ability to access sufficient capital from internal and external sources; failure to obtain required regulatory and other approvals; reliance on third parties; and changes in legislation, including but not
limited to tax laws, royalties and environmental regulations. Readers are cautioned that the foregoing list of factors is not exhaustive.
Additional information on these and other factors that could affect Obsidian Energy, or its operations or financial results, are included in the Company's Annual Information Form (See "Risk Factors" and "Forward-Looking Statements" therein)
which may be accessed through the SEDAR website (www.sedar.com), EDGAR website (www.sec.gov) or Obsidian Energy's website.
Unless otherwise specified, the forward-looking statements contained in this document speak only as of November 14, 2018. Except as expressly required by applicable securities laws, we do not undertake any obligation to publicly update or
revise any forward-looking statements, whether as a result of new information, future events or otherwise. The forward-looking statements contained in this document are expressly qualified by this cautionary statement.