obstacles into opportunities: a 90% high school graduation...
TRANSCRIPT

Obstacles Into Opportunities:
A 90% High School Graduation Rate in Alabama by 2020 Provides the Educated
Workforce That is Key to Expanding Our Economy
A report prepared for the Business Education Alliance by the Public Affairs Research Council of Alabama, with economic modeling by Keivan Deravi, Ph.D., Professor
of Economics at Auburn University at Montgomery.
August 2, 2014
Business Education Alliance Board of Directors
Jeremy Arthur, President Chamber of Commerce Association of Alabama Will Brooke, Managing Partner Harbert Management Corporation Billy Canary, President & CEO Business Council of Alabama
Carol Gordy, President & CEO Natural Decorations, Inc. Joe Morton, Chairman and President Business Education Alliance of Alabama
Business Education Alliance Advisory Council
Donny Bynum, 2013 Alabama Superintendent of the Year Dale County Schools Billy Canary, President and CEO Business Council of Alabama Gen. Ed Crowell, Senior Vice President VT Miltope Allison Grizzle, Ph.D., 2013 Alabama Teacher of the Year Jackson Olin High School Carl Jamison, Shareholder Jamison Money Farmer Debbie Long, Senior Vice President Protective Life Corporation Jay Love, Finance Chairman Business Education Alliance Bill Lyons, President Lyons HR Koko Mackin, VP of Corporate Communications and Community Relations BlueCross BlueShield of Alabama
Fred McCallum, President AT&T Alabama Harris Morrissette, President China Doll Rice and Beans, Inc. Joe Morton, Chairman and President Business Education Alliance Caroline Novak, President A+ Education Foundation Ray Perez, General Counsel & Division Manager Honda Manufacturing of Alabama Paul Pinyan, Executive Director Alabama Farmers Federation Gordon Stone, Executive Director Higher Education Partnership Jeff Thompson, Executive Director Alabama Aerospace Industry Association Chester Vrocher, Acting Director Alabama Technology Network Donna Watts, President South Baldwin Chamber of Commerce
Special Acknowledgements
A special thanks to the AT & T Foundation for their generous financial support of this project and to Fred McCallum, AT &T President - Alabama, for his support. To the A+ Education Partnership, for contributing its policy expertise and research capabilities to this project.

Table of Contents
The Challenge ........................................................................................................................... 1
Potential Impact ........................................................................................................................ 3
The Consequences of the Status Quo ................................................................................ 5
Signs of Progress ....................................................................................................................... 7
Improvements Targeted Across the Educational Spectrum ....................................... 10
1. Start Early. ....................................................................................................................... 11
2. Set High Expectations. ................................................................................................. 14
3. Break Down Barriers to Learning. ............................................................................ 23
4. Seek Continuous Improvement in Teaching and Leading.................................... 28
5. Equip Every Student with a Plan for Success and a Pathway to Prosperity..... 36
It’s Up to Us. .......................................................................................................................... 43
Appendix ................................................................................................................................. 45
Endnotes .................................................................................................................................. 51


1
The Challenge
In the 21st Century workplace, the demand for knowledge-equipped and high-skill workers is
dramatically increasing, while the share of jobs available to those without educational credentials is
rapidly shrinking. Experts say that by 2020, about two of every three jobs in America will require
postsecondary education and training of some kind, from the certificate to the graduate level.
Historically, Alabama has set its educational standards lower than other states. Our students have
performed poorly on national assessments. Our high school graduation rate has trailed the national
average. Students in some schools, particularly those from poverty backgrounds, have lagged far behind
their peers. Our college-going rate is at the national average, but our graduation rates from two-year
and four-year colleges are low.
To supply the workforce needed to meet future demands, to build a state that can compete nationally
and internationally, we must have a concerted plan to ensure that the rising generation of Alabamians
graduates from high school prepared to succeed in college and in their careers.
Recognizing the need, the state is pursuing an array of strategies to improve educational outcomes.
These start early, reaching out to children in the critical early years of development through expansion
of Alabama’s First Class Pre-K program.
Our system of elementary and secondary schools has adopted new nationally-competitive standards,
raising expectations for what our children are to learn.
Some college / no degree, 23% Some college / no
degree, 18%
Associate's, 8%Associate's, 12%
Bachelor's, 15%Bachelor's, 24%
Master's or Better, 9%
Master's or Better, 11%
0%
10%
20%
30%
40%
50%
60%
70%
Alabama now Expected share of jobs in 2020
Educational Requirements for Jobs are Increasing

2
Along with those standards, the state is employing a new and improved set of assessments designed to
clearly measure student achievement against national norms and to chart progress toward college and
career readiness.
Student planning for college and career goals is being emphasized, and options are being developed to
earn college credit while in high school. Career and technical education is being reinvigorated. Efforts
have begun to align education offerings with workforce needs.
These initiatives involve not only the educational community, but also the business community, the
Governor and Legislature, who have supported investments in educational improvement.
The end goal of these efforts, known collectively as Plan 2020, is to raise Alabama’s high school
graduation rate to 90 percent, while at the same time producing graduates who are demonstrably better
prepared for college and the workplace. The Plan was adopted in August of 2012 by the Alabama Board
of Education. It’s motto is, “Every child a graduate. Every graduate prepared.”
Attainment of Plan 2020’s goals would set the stage for a much more prosperous state. But execution is
everything. A plan is only as good as its implementation, which must be tracked in order to succeed.
In this report, we begin the process of following the progress of Plan 2020.

3
Potential Impact For every child we move up the educational ladder, we reap big dividends in earnings and employability.
Income and unemployment data maintained by the Bureau of Labor Statistics tell us that high-school
graduates typically earn 38% more than non-graduates, and have an unemployment rate 36% lower. For
those who have an associate’s degree, earnings are 65% higher than for a non-high school graduate, with
half the unemployment rate. The holder of a bachelor’s degree earns 2.3 times more than an individual
lacking a high school diploma, with an unemployment rate only 36% as high.
These advantages of higher earnings and lower unemployment are compounded over the years of a
typical working career. Those who graduate from high school, particularly those who graduate ready for
college and career, are likely to earn significantly more over time and are much less likely to be
dependent on government support services. For the economy, more graduates mean more earnings,
which translate into higher spending, more economic output, and thus more tax revenue.
Economic impact models developed for this report by Auburn University at Montgomery Professor of
Economics Keivan Deravi assume steady progress toward a 90-percent graduation rate by 2020. Each
year along the way would see higher employment, earnings, and tax revenue due to the increased
educational attainment, and these increases would be compounded. By 2020, assuming the 90-percent
goal is reached, economic output would be $430 million higher than it otherwise would have been, and
Education Trust Fund revenues would be up by $22 million.
$472
$651
$727
$1,108
$1,329
$1,329
$1,714
$1,623

4
Each class of graduates thereafter would produce a direct net increase to the economy of 1,167 jobs.
Each new graduating class would be 5,463 larger and would collectively earn $68 million more annually
than would have been produced by a class graduating at the 80 percent rate. The effect would be similar
to landing an industrial mega-project every year.
The compounding would continue from year to year, assuming that the state maintains the 90-percent
graduation rate, creating a virtuous cycle that will bring a better-educated workforce, higher quality
employees for the state’s employers, and more affluent consumers to drive the economy. (A full
explanation of Dr. Deravi’s findings can be found in the Appendix at the end of this report, The
Potential Economic Impact to Alabama of a 90 Percent High School Graduation Rate.)
The results will be even greater if our students are better prepared for college and thus are more
successful in postsecondary completion. Currently, Alabama’s college-going rates are at the national
average, but completion rates for students at the 2-year and 4-year levels are below the national
averages.(1) Moving to the national averages would increase the economic impact of meeting the
graduation-rate goal by 67%, according to our calculations.
0
5,000
10,000
15,000
20,000
25,000
30,000
2010 2015 2020 2025 2030 2035 2040
Direct Net Employment Increase
$0.0
$0.5
$1.0
$1.5
$2.0
$2.5
$3.0
2015 2020 2025 2030 2035 2040
Billio
ns
Total Impact to State GDP through 2040

5
The Consequences of the Status Quo
Failure to raise educational outcomes in Alabama would have serious consequences.
Already, Alabama – like other states – is suffering from a “jobs gap” created by the so-called “Great
Recession” that began late in 2007. This gap is the reduction in employment due to the drop in labor-
force participation that has occurred since the onset of the recession. The chart below looks at the
negative change in the employment-to-population ratio from 2007 to date, and the resulting drop in
total employment. Alabama’s jobs gap by this measure is currently 223,000 jobs.(2)
The chart below compares Alabama to nine other southeastern states. All have a jobs gap, although it is
larger for some than for others. As of April 2014, Alabama’s employment-to-population ratio ranked
below every other southeastern state except Mississippi. Although Alabama is well-positioned for
employment growth, a jobs gap will persist into the future without workforce improvement, according
to the most recent State of the Workforce Report produced by the Center for Business and Economic
Research at the University of Alabama. This report projects a shortfall of over 300,000 workers to fill
potentially available jobs by the year 2030, absent policies that increase labor force participation, worker
productivity, and in-migration.(3)

6
The current composition of Alabama’s workforce doesn’t match up with the levels of education needed
in the modern workplace. Experts project that by 2020 almost two out of every three jobs will require
some sort of postsecondary credential, from a certificate to a graduate or professional degree.(4) But
Alabama’s workforce today is far short of the educational attainment that will be needed. This mismatch
may already be affecting our ability to achieve a desirable employment-to-population ratio, but it surely
will constrain our future economic success if not corrected.
Less than high school Less than high school
High school diploma
High school diploma
Some college/no degree
Some college/no degree
Associate's degree
Associate's degree
Bachelor's degree
Bachelor's degree
Master's degree or better
Master's degree or better
0%
10%
20%
30%
40%
50%
60%
70%
80%
90%
100%
Alabama now Expected share of jobs in 2020
Current Alabama Workforce vs. 2020 Job Needs

7
Signs of Progress
The saying goes, “What gets measured, gets done.” As Alabama’s public schools begin to focus
on increasing the graduation rate and preparedness for college and career, there are many signs
that success can be achieved.
Early success on the graduation rate
The National Center for
Education Statistics (NCES)
has begun to publish 4-year
adjusted cohort graduation
rates for all states, allowing
progress to be measured.
The implementation of
Plan 2020 also has focused
attention on the goal of an
increased graduation rate.
School systems around the
state have responded. In
2011, Alabama’s graduation
rate was 72 percent, seven
points lower than the
national average as
measured by NCES. In 2012,
Alabama’s graduation rate
rose to 75 percent, five
points shy of the national
average. The state’s 2013 graduation rate climbed to 80 percent, with national figures not yet released.
Further progress toward the 90-percent goal undoubtedly will become more difficult, particularly as the
focus broadens to include indicators of increased preparedness for college and career. However, this
early success provides an example of how setting goals and focusing on improvements can drive change.
Low-income, high achievement
That same combination of raised expectations, goal-setting, focused effort, and measurement of
progress has been shown to work in the classroom. In a number of high-poverty schools around the
state, teachers and administrators have demonstrated that the demographics of children do not dictate
their academic destiny. Two examples:
72% 75%
80% 79% 80%
50%
55%
60%
65%
70%
75%
80%
85%
2011 2012 2013
4-year Cohort Graduation
Rates
Alabama U.S.

8
George Hall Elementary in Mobile has received national attention for its success. An all-black, all-poverty
school, its students have regularly produced top-notch results on the state’s assessments in reading and
math, far exceeding the statewide averages for all students.
At Moundville Elementary in Hale County, two-thirds of students are eligible for free and reduced-price
lunches. The school’s math results on statewide assessments have shown sharp improvement over the
past few years. In 2013, over 80 percent of its students scored at Level IV, the highest grade, and it was
well above the statewide average in all three grades tested.
State intervention helps struggling schools
In 2011, Midfield High School was adrift and chaotic, registering a graduation rate of just 46 percent that
year. The superintendent was replaced. The State Board of Education voted to intervene, and the State
Superintendent sent a team to help the new administration rebuild.
20082009
20102011
20122013 2008
20092010
20112012
2013 20082009
20102011
20122013
0
10
20
30
40
50
60
70
80
90
100
% of Students at Level IV ARMT in MathGeorge Hall vs. Statewide
ALL STUDENTS STATEWIDE
GRADE 5GRADE 4GRADE 3
20082009
20102011
20122013 2008
20092010
20112012
2013 20082009
20102011
20122013
0
10
20
30
40
50
60
70
80
90
100
% of Students at Level IV ARMT in MathMoundville vs. Statewide
ALL STUDENTS STATEWIDE
GRADE 5GRADE 4GRADE 3

9
Working in support of the new
superintendent, the state team
helped move the system back to
firmer financial footing. Meanwhile,
order and discipline were re-
established at the high school. The
new administration, in cooperation
with the state, began a student-by-
student audit of enrollment and
academic status, removing students
from the rolls who’d moved away
and identifying those who were
behind academically. Through a new
dropout prevention program,
students who were behind in credits
were assigned a team of special
support personnel to help them catch up. Results came quickly. By 2012, the graduation rate had
climbed to 60 percent. In 2013, Midfield posted an 80 percent graduation rate, pulling even with the
state average.
Focus on attendance keeps kids in school
During the 2013 school year, a pilot group of schools in ten Alabama school systems began
implementing a comprehensive system of learning supports. The idea was to bring administrators,
teachers and support personnel together to identify factors that interfere with learning. The pilot
schools chose to focus on decreasing absences among the student body. The teams devised a variety of
approaches, from celebrating students with perfect attendance to methodically reaching out to students
who were not making it to school consistently. On average, schools involved in the pilot saw a 25-
percent decrease in absences over the previous year. In total, the efforts in these schools cut absences
by 110,000 days.
0%
10%
20%
30%
40%
50%
60%
70%
80%
90%
2011 2012 2013
Midfield High School Graduation Rate
0
25,000
50,000
75,000
100,000
Number of Absences in Learning Supports Schools
Absences 2013 Absences 2014

10
Improvements Targeted Across the
Educational Spectrum
Plan 2020 has already produced early signs of success. But if Alabama is to achieve its education goals, it
is important to understand the comprehensive nature of what has been proposed. Certain aspects of
the Alabama’s overall education strategy have received important support from the Governor, the
Legislature, and the business community, particularly the expansion of Pre-K and workforce
development initiatives. However, all parties involved should come to a common understanding of how
the various pieces of the overall plan fit together and how they fit together to bring about the desired
improvements.
To describe the variety of initiatives underway, this report identifies five broad areas of emphasis. The
five areas described are interdependent pieces of the whole, all of which drive toward an end goal of
producing more high school graduates who are prepared to succeed in technical training, in college, and
in careers. If these initiatives are successful, the bottom line result should be a state with a better-
educated workforce ready to meet the demands of the 21st century economy.
Those areas of emphasis are:
1. Start Early: We need to reach children as early as possible to establish a strong foundation in those
earliest years of learning by providing quality Pre-Kindergarten.
2. Set High Expectations: We must believe that our students can reach the same level of learning
children in other states are expected to master. We have adopted higher standards and better
assessments, which will drive an improved system of accountability. With those tools as a foundation,
we need to measure how students and schools are performing over time and pay attention to the
results. We need the state, school systems, teachers, parents, students, and communities to pay
attention to results, to celebrate success and to focus on areas that need improvement.
3. Break down barriers to learning: We need schools, in partnership with communities, to keep
kids enrolled, engaged, and academically on track. That means identifying problems and addressing them
before they lead to failure. This will require a particular focus on children from low-income families,
who are at a higher risk for falling behind.
4. Seek continuous improvement in teaching and leading: We need well-trained and well-
supported teachers, teachers who are given the time and resources they need to master new
challenging material and to adapt to new ways of teaching. We need to draw talented new recruits to
the profession. We need a commitment to evaluation and to using evaluations to foster improvement.
That means raising standards for teacher preparation programs and providing better data on how new
teachers are performing in the classroom. For both new and existing educators, we need to complete
implementation of a new system for evaluating teacher and principal quality.

11
5. Equip every student with a plan for prosperity and pathway to success: We need students
who understand why they’re in school and how their learning connects with their future as citizens and
in college and career. We need to help them plan and navigate toward attainment of their fullest
potential. We need to build better connections between business and education so that new graduates
are prepared for jobs, and employers can find prepared employees.
In the remainder of this report, we describe the efforts that are underway in each of these areas and
draw conclusions.
1. Start Early. An ever-growing body of research points to the first five years of a child’s life as being the most crucial
period for brain development. It’s also in these first five years that a gap begins to form between
children born in differing economic circumstances. Children from more affluent families are likely to
have access to educationally rich Pre-K programs. Low-income children often enter kindergarten at a
disadvantage, having missed out on opportunities in those valuable early years.
A strong body of evaluative research has shown that high-quality, voluntary Pre-Kindergarten programs
are effective at significantly improving children’s school readiness and lead to significant cognitive and
social development among children, higher performance on achievement tests in the early grades and in
some cases, reduced retention rates, producing substantial cost savings for school systems. A good
summary of these findings can be found in “The Case for Pre-K in Education Reform: A Summary of
Program Evaluation Findings,” a 2010 publication by the Pew Center on the States. An earlier Pew
report, “Dollars and Sense: A Review of the Economic Analyses of Pre-K” (2007), also found research
support for the impact of high-quality Pre-K on lifetime earnings, reduced reliance on welfare, and lower
incidence of arrest and incarceration.
Recognizing this, states across the country have been increasing investment in public Pre-Kindergarten
programs. Alabama trails most other Southeastern states in the availability of Pre-K. However, the
state’s voluntary public Pre-K program, known as “Alabama’s First Class Pre-K,” has consistently ranked
among the country’s best on ratings of quality.(5)
0%
20%
40%
60%
80%
100%
FL GA SC AR LA KY TN NC Alabama
Percent of 4 year-olds in Public Pre-K in Southeastern States, 2013 (Source: NIEER, “The State of Preschool”)

12
Evidence of that quality shows up in education data. A PARCA study found that, on average, students
who have participated in Alabama’s Pre-K Program perform better on state reading and math tests than
the student body as a whole.(6) That performance advantage persists well into elementary school.
Former First Class Pre-K students miss fewer days in elementary school. Fewer of them need special
education services. The positive effects of Pre-K are particularly strong in children from poverty
backgrounds. Thus, Pre-K serves as a tool for closing the achievement gap that develops between
poverty and non-poverty students in test results and graduation rates.
The Alabama School Readiness Alliance formed a Pre-K Task Force in 2011 to identify and develop
short- and long-term strategies to increase public investments in high-quality, voluntary Pre-K in
Alabama. Its members are prominent Alabama educators, business leaders, philanthropists, advocates, as
well as representatives from military, medical and legal backgrounds. The Task Force’s
recommendations, adopted in 2012 and revised the following year, called for expanding First Class Pre-
K to cover all families that want to take advantage of the opportunity. The cost of the program at full
implementation has been estimated at $144 million a year.
The Governor and Legislature have responded. In the two years since the Pre-K Task Force
recommendations were released, state leaders have doubled investments in the First Class Pre-K
program, despite difficult economic conditions. This fall, the state will support 425 Pre-K classrooms,
serving approximately 7,650 Pre-K students throughout the state. That represents about 12 percent of
4-year-olds.
In addition to its Pre-K initiative, the Department of Children’s Affairs has been increasing outreach
efforts to families with children from birth to three years old. Home visitation programs, supported
through state funding, federal and private grants, have been consolidated under the department’s
supervision. Through the home visitation programs, trained professionals visit parents and children to
encourage early learning, reading to children, and to advise parents on creating a safe, healthy, and
stimulating environment. The evidence-based models being utilized include Nurse Family Partnership,
Parents as Teachers, and Home Instruction for Parents of Preschool Youngsters (HIPPY). Home
visitation programs have been established in 43 Alabama counties, serving 2,300 families. DCA has
aggressively pursued grant funding and through that has increased the total funding for the programs
from no funding in 2010 to $4 million for 2015.
Conclusions
[VALUE]M [VALUE]M
[VALUE]M
[VALUE]M
$-
$20
$40
$60
$80
$100
$120
$140
$160
2013 2014 2015 10 year goal (2024)
Mill
ion
s
Appropriations for First Class Pre-K

13
Continue the expansion of First Class Pre-K toward full implementation.
Given the obvious value of high-quality Pre-K to educational improvement, we recommend continuing
the expansion of First Class Pre-K toward the established goal of full implementation. We also
recommend that the Department of Children’s Affairs (DCA), which administers First Class Pre-K,
continue to focus on stretching state dollars by matching them with local and federal support for early
childhood education where possible.
Take advantage of federal money to speed the expansion of Pre-K.
Head Start: Head Start is the federal pre-school program for low-income children. It currently serves
10,835 four-year-old children in Alabama, supported by over $100 million in spending in 2013. Under
the terms of the federal Improving Head Start for School Readiness Act of 2007, the program is working
to improve the quality and credentials of Head Start’s teachers and curriculum. DCA works with Head
Start providers to meet First Class standards. Currently, only 47 percent of Alabama’s Head Start
teachers have a bachelor’s degree, a quality standard required by Alabama’s First Class Pre-K program.
Supplemental funds provided by DCA, with federal matching, are used for materials and curricula, as
well as scholarships that help existing Head Start employees gain educational credentials. Through this
approach, DCA can help the Head Start program meet its aim of improving quality, while creating First
Class Pre-K classrooms at roughly half the cost of a classroom supported by state and local funding
alone.
Title I: Some K-12 systems around the state also provide Pre-K programs, typically using funds from
the federal Title I program aimed at improving educational opportunities for low-income students.
Money from the Title I program flows through the State Department of Education. Until recently, the
Department has not tracked where and how much Title I money is being spent on Pre-K. We
recommend that local systems, where possible, develop Pre-K programs using Title I money. This form
of early intervention can help head off educational disadvantages that are harder to remedy once a child
is older and in school. However, wherever Pre-K programs are supported by Title I dollars, those
programs should be required to meet First Class Pre-K’s high quality standards.
Encourage community coalitions to provide local support for Pre-K expansion.
First Class Pre-K grants are awarded through a competitive application process, and a local match of at
least 25 percent is required. Business and local community leaders should be encouraged to inventory
assets and needs in their area and form partnerships among existing providers or schools and systems to
apply for First Class Pre-K grants expansion grants.
Provide the necessary state support for assessment of Pre-K effectiveness.
Given the size of the investment in First Class Pre-K, it is crucial to develop a robust evaluation of the
success of the program, statewide as well as in local classrooms. The Governor and Legislature should
support DCA in its ongoing efforts to track the educational impact of Pre-K and to evaluate the
effectiveness of individual First Class Pre-K programs.

14
DCA is planning a long-term study of the impact of Pre-K on school readiness, retention, absences,
discipline, academic success, and graduation rates. The study will compare randomly selected students
who receive First Class Pre-K with those who do not. Students are to be paired in their schools and
region to ensure comparability of results. The project is being administered by DCA with assistance
from the Alabama State Department of Education, and with advice and consultation from the Center for
Education Accountability at the University of Alabama at Birmingham, PARCA, the Alabama School
Readiness Alliance, Family Resource Centers, the State Department of Education, and the National
Institute for Early Education Research at Rutgers University.
PARCA estimates the costs for the multi-year project to be about $300,000 per year. These costs are
related to testing students in years subsequent to the year of Pre-K eligibility, providing incentives to
parents for gathering data on the students who have been randomly selected, and analyzing results for
students who did and did not receive First Class Pre-K.
DCA is also supporting a pilot program to train kindergarten teachers in K-12 school systems to
administer a Kindergarten Entry Assessment. Data sharing between DCA and the State Department of
Education around this issue should be a priority. Taking lessons from this pilot, a standard statewide
Kindergarten Entry Assessment should be deployed to kindergarten classrooms statewide as soon as
possible.
Assessing the kindergarten readiness of all children will enable the state to gain a better picture of the
varying levels of preparation of children entering kindergarten, to promote early identification of
children who have deficits and learning disabilities, to identify communities in need of additional Pre-K
resources, and to evaluate the benefits of Pre-K and the effectiveness of individual programs.
Administering the Kindergarten Entry Assessment statewide to every kindergarten student would
require about $500,000 a year; the one-time expense of training all kindergarten teachers to administer
the test might require another $500,000.
2. Set High Expectations. In order for Alabama’s public schools to achieve a higher graduation rate and produce graduates who
are college- and career-ready, the state must have higher standards and more rigorous assessments of
performance than it has had in the past.
Until 2010, Alabama’s standards for what children should learn at each grade level didn’t match up with
what other states were asking their children to learn. Our standards were not as clearly written as most
states’ and in some cases, they were lower. As a result, when Alabama students have taken national
tests that allowed comparisons with students in other states, they often have performed poorly.
One exception to that has been in elementary school reading. Through a concerted effort to improve
reading instruction, known as the Alabama Reading Initiative, Alabama’s reading scores on the National
Assessment of Educational Progress (NAEP) improved so markedly that by 2011, Alabama fourth
graders tested at the national average, making larger gains on that measure than any other state.(7)

15
Unfortunately, that progress in “learning to read” has never carried over to the more advanced skills of
“reading to learn” that are measured by the 8th grade reading assessment. The trends in scale scores on
NAEP reading assessments for Alabama and the nation are shown in the charts below.
Even more disappointing has been the state’s weakness in math assessments. Alabama’s math scores on
the NAEP have remained very low, and our 8th grade math scores were the lowest in the country in
2013. NAEP math results for Alabama and the nation are shown in charts below.
NAEP tests are typically given only once every other year, and then only to a sample of 4th and 8th grade
students in each state. They are useful for comparing states to one another, but to improve Alabama’s
results we must have annual data on student results in every school and school system. These state-level
assessments should be based on standards that are aligned with other states, so that we keep the
advantage of interstate comparisons. Without these fundamentals, Alabama is “flying blind” in its efforts
to improve.
215
220
225
230
235
240
245
1995 2000 2005 2010 2015
NAEP 4th Grade Math
AL US
260
265
270
275
280
285
290
1995 2000 2005 2010 2015
NAEP 8th Grade Math
AL US
250
255
260
265
270
1995 2000 2005 2010 2015
NAEP 8th Grade Reading
AL US
205
210
215
220
225
1995 2000 2005 2010 2015
NAEP 4th Grade Reading
AL US

16
Alabama’s primary assessments in years past consisted of the Alabama Reading and Math Tests (ARMT)
for students in grades 3-8 and the Alabama High School Graduation Exam. These tests were built on
low levels of performance and were not aligned nationally, which limited their utility.
ARMT results, for example, defined students as proficient when they scored at Level III or IV on a 4-
point scale. However, when data from the ARMT and the ACT college entrance exam are correlated,
we see that only students scoring at Level IV (essentially, an “A” on the ARMT), were really proficient in
national terms. The chart above illustrates this, showing the relationship between ARMT Level IV and
ACT scores.(8)
ARMT Level IV results also consistently showed a large gap between the success rates of students from
poverty backgrounds and students from non-poverty circumstances. This gap stands out clearly in the
chart below, which also reveals a significant reduction in the math success rates of both student
subgroups when they reach the middle grades (6-8). These result patterns are common across Alabama
and point to the need to address issues that affect the academic progress of poverty-level and middle-
grade students.
Gr. 3 Gr. 4 Gr. 5 Gr. 6 Gr. 7 Gr. 8
0
20
40
60
80
100Non-Poverty Poverty
2013 ARMT Results in MathPercent of Students at Level IV

17
Higher standards have been adopted.
To bring Alabama’s educational standards up to nationally-competitive levels, the Alabama State Board
of Education in 2010 adopted new standards, known as Alabama’s College and Career Ready Standards.
In developing the new standards, which define what children should know and be able to do in math and
language arts at each grade level, Alabama partnered with other states, taking into consideration the
results of research coordinated by the National Governors Association and the Council of Chief State
School Officers. While this resulted in general alignment of the standards among the states, the State
Board also adopted amendments designed to keep strongly held Alabama values intact, and to eliminate
features not consistent with those values. The State Board also took steps to ensure that it maintains
state control of standard-setting. The resulting College and Career Ready Standards are available to
teachers, students, parents, and others on the State Department’s College and Career Ready Standards
website (http://alex.state.al.us/ccrs/).
The new standards challenge our children to match the pace and depth of learning expected of students
in the top performing states. They challenge teachers to adopt new approaches that should lead
students to better master underlying concepts, keep them more engaged in their work, and promote a
better understanding of the connection between what they are learning in the classroom and real world
application of that knowledge.
Ultimately, successful mastery of the content and skills required by Alabama’s College and Career
Standards should better prepare high school graduates for college, but this will require sustained effort.
In 2013, among Alabama students who took the ACT, only 20 percent met the benchmark for college
readiness in all subjects.(9) Preparation in math was particularly weak, as the chart below demonstrates.
Figures tracked by the Alabama Commission on Higher Education indicate that 25 percent of students
entering Alabama public colleges and universities are required to take remedial math courses before
they can move into college-level work.(10)
Better assessments have been created.
64%
44% 44% 36%
66%
41% 31% 30%
Met English Benchmark Met Reading Benchmark Met MathematicsBenchmark
Met Science Benchmark
Percent of Students Meeting ACT Measures of College Readiness, by Subject, 2013
National Alabama

18
Higher standards are of little value unless they are accompanied by comprehensive, end-of-year (or
“summative”) assessments that allow teachers and school leaders to recognize successes as well as
weaknesses in performance, so that improvement efforts can be directed efficiently and effectively to
produce better results. Such assessments also are necessary to focus state assistance, encouragement,
and even intervention where necessary. Transparent reporting of assessments helps to develop and
maintain public confidence in the progress toward a higher graduation rate accompanied by greater
college- and career-readiness.
The state has a new suite of summative assessments that will give a clearer picture of academic progress
in comparison to national and state averages. The tests also should create a better understanding of
student progress toward potential college and career paths.
These summative assessment tools are designed to be better aligned with Alabama’s new courses of
study and with national norms. The tests should be more meaningful because they relate to the familiar
ACT College Readiness Assessment. They take less time to administer and can be administered online,
which speeds the analysis of performance and decreases opportunities for gaming the results. The state
also now offers a service that allows for the administration of “formative” (that is, informal and
diagnostic) assessments throughout the year, providing teachers and students with early and ongoing
feedback rather than waiting for a year-end wrap-up of results.
The state-sponsored summative assessments include:
The ACT Aspire tests in reading and math for students in grades 3-8.
These tests, given for the first time in spring 2014, create a summary of academic performance for
students and schools. They replace the ARMT and have been designed to correlate with national
standards, to track academic progress from year to year, and to indicate a student’s educational
trajectory toward college readiness as measured by the ACT College Readiness Assessment. The
illustration below shows how these features are combined in a draft version of a student report that
shows progress over time versus the national average and readiness benchmarks.

19
Draft reports for classes and schools display the distribution of results for the groups of students
involved, as shown below.
ACT end-of-course tests to measure mastery of high-school core subjects.
Beginning in 2013, end-of-course tests developed by ACT have been given in English 10 and Algebra I,
with the state using available federal money to pay ACT a per-student fee for each test. Plans call for
adding ACT-developed end-of-course tests in other core subjects. However, $6 million in additional
funding required to support new end-of-course assessments was not approved by the Legislature in the
2014 legislative session.
The ACT College Readiness Assessment for all high-school juniors.
The ACT is the most common test used for admission to college. Its results for test-takers include not
only the well-known summary score based on a 36-point scale, but also a measure of the student’s
performance in core subject areas against benchmarks that ACT has developed to indicate readiness for
college-level work in each subject. Among the state’s 2013 graduating class, an estimated 78 percent had
taken the ACT. The test was given to all juniors for the first time in spring 2014.
The ACT WorkKeys assessment for high-school seniors.
WorkKeys is an assessment designed to measure job readiness skills widely expected by employers. It
includes measures of a student’s ability to locate and comprehend information and to apply mathematics
on the job. It can result in the awarding of a National Career Readiness Certificate, a portable credential
for students seeking a path to a career. Plans call for giving WorkKeys to all high-school seniors
beginning with the 2014-15 school year, but this is dependent on legislative funding support. Money to

20
provide for the WorkKeys assessment was included in the $6 million request not funded in the 2014
legislative session.
For detailed information on all ACT’s testing products, see ACT’s state testing page for Alabama.
http://www.act.org/aap/alabama.
The state also has provided all schools and school systems with access, at no cost, to GlobalScholar
software for the purpose of creating formative, interim, and benchmark assessments during the school
year. Teachers can develop and use informal assessments for diagnostic purposes, student placement,
measuring growth, and recommending instructional adjustments.
The State is developing an accountability system for all schools and school systems.
In Act 402 of 2012, the Alabama Legislature mandated the creation of a school grading system based on
the traditional “A” through “F” framework, in which school performance is graded:
“A” for excellent progress,
“B” for above-average progress,
“C” for satisfactory progress,
“D” for less than satisfactory progress, or
“F” for failing to make adequate progress.
Act 402 (codified as Section 16-6C-1to -3, Code of Alabama) created the Alabama Legislative School
Performance Recognition Program to recognize schools that are ranked in the top 25 percent on the
school grading system, and schools that improve their performance by one letter grade from one year
to the next. The Act authorizes financial awards subject to the availability of funds as an incentive to
improve performance. At least eighty percent of those rewards would go to schools making letter-grade
improvements. In addition, Act 402 exempts schools eligible for financial awards from any statute or
regulation related to the prescribed use of funds at the school level, or any categorical spending
requirements imposed through the appropriation of funds from the state, except those requirements
associated with the receipt of federal funds.
In June 2013, Alabama received approval of a waiver from federal regulations under the Elementary and
Secondary Education Act (ESEA).(11) One of the requirements of the waiver is that the state must field
an accountability system that encompasses performance enhancement for all of the state’s public
schools. In its waiver request, the State of Alabama described its Plan 2020 Accountability Model, which
is designed to meet the requirements of both Act 402 and the U.S. Department of Education. This
Accountability Model is being implemented in two phases, beginning in school year 2014 with
completion set for 2016.
The Plan 2020 Accountability Model incorporates the following kinds of performance data:

21
Achievement data from the Aspire, end-of-course, and ACT tests. Performance will be
measured in terms of current-year scores, gaps among student subgroups, learning gains from
year to year, and participation rates in testing.
Graduation-rate data based on four-year and five-year cohorts. (The latter measure gives credit
for students who graduate in five years instead of the normal four.)
Student attendance rate.
Teacher and Leader performance evaluations.
Program reviews and indicators of college and career readiness.
School results in these categories of data will be weighted by priority, with point totals accumulated to
create a School Performance Index, allowing every school to be ranked and given a letter grade. The
Department has committed to annual reporting, in a transparent way, of the results for each of the
measures above, as well as the resulting letter grade for each school.
State support to local schools has been differentiated to offer flexibility and assistance, as
well as intervention when required.
In the past, the State Department of Education too often provided “one-size-fits-all” standards and
support to local school systems. Current thinking is that such an approach would be wasteful even if
there were enough money to make it practicable – which there is not. Rather, the new strategy favors
providing differentiated oversight of local schools and school systems. This approach incorporates both
flexibility and state assistance or intervention, depending on local circumstances.
Flexibility for local innovation.
Under the terms of Act 64 of 2013, the State Board of Education is authorized to enter into flexibility
contracts with local school systems to allow waivers from state laws, regulations, and policies allowing
the systems to provide novel approaches aimed at enhancing college and career readiness for students.
According to the law, the purpose of this waiver program is to create more school autonomy, allow
managerial flexibility, and encourage innovation in order to enhance educational performance.
According to the State Department of Education web site, twelve flexibility proposals have been
approved by the State Board of Education thus far. The two that are most comprehensive appear to be
the plan of the Birmingham City Schools to create flexibility in staffing, scheduling and other activities
within the Woodlawn High School feeder pattern, and Tuscaloosa City Schools’ plan to allow students
to obtain high school credits by demonstrating knowledge and abilities rather than by logging hours in
the classroom. This should increase students’ the opportunity for obtaining college credits. Perhaps the
most innovative is the plan of Vestavia Hills City Schools to allow its highest-achieving students to
pursue a career path through internships and independent research, in place of hours spent in the
classroom.

22
There are limits on the requirements that can be waived through flexibility contracts. Requirements that
are off-limits include those imposed by federal law, ethics laws, open records or open meetings laws, the
state’s child protection law, health and safety laws, academic and financial reporting, employee rights and
privileges, the state minimum salary schedule, and creation of charter schools.
State Assistance and Intervention.
In the past, when new standards were adopted or school rankings published, it was often left up to local
school systems to develop improvement plans. The State Department of Education was not strategic in
its approach to translating statewide standards into better results at the community level, which
requires focusing on those schools and school systems that consistently lag in their performance. But
with the roll-out of the Alabama College and Career Standards, the State Department has offered
extensive support and resources to help systems and teachers adapt to new material.
The State Department of Education has defined two categories of low-performing schools and created
procedures for providing assistance to them.
“Priority Schools” are the lowest-performing schools in the state. They include all Tier I and
II schools as defined by the federal School Improvement Grant program, all schools with a
graduation rate under sixty percent, and the lowest five percent of schools ranked by state
achievement test results.
“Focus schools” are schools with the largest test-score and graduation-rate gaps between
student subgroups. They include all non-priority schools in the lowest ten percent of Title I
schools on these gap measures.
The first set of priority and focus schools were identified in 2013, based on data available at the time.
Those on the lists will remain in that status until fall 2016, when the state will begin to use the School
Performance Index developed to comply with Act 402 of 2012 and the approved ESEA Waiver to define
which schools are in Priority and Focus status.
The State Department has created Regional Planning Teams to provide differentiated support to Priority
and Focus schools. They work with local school leaders to develop continuous improvement plans
based on proven turnaround principles. Priority and Focus schools remain in that status for a minimum
of three years, and can exit only by demonstrating specific performance improvements.
In addition to the assistance provided by Regional Planning Teams, the State Superintendent of
Education has been active in using the power to intervene where necessary. Recent interventions
include school systems in Birmingham, Midfield, Montgomery, and Selma.
Conclusions
Support the State Department of Education’s request for funding to implement its
assessment program.

23
To pay for the student assessments envisioned in Plan 2020, the State Department of Education
requested an additional $6 million in the 2015 budget. That request was not met. The assessments
affected include end-of-course exams in Algebra I and English 10 for the state’s high schools, the
WorkKeys assessment for high school seniors, and the GlobalScholar software. All are important. To
satisfy federal accountability commitments, the state must have an end-of-course assessment in math
and in English Language. The WorkKeys assessment provides a means for students exploring career
options to gain a portable credential that can be valuable to employers. GlobalScholar provides a means
for teachers to create formative assessments that can help them improve instruction.
The Department has thus far used federal funding to pay for the additional testing it is offering, but state
funding will be required going forward. We believe the Legislature should find a way to support the
Department’s request.
Aggressively implement the flexibility provisions of the Alabama Accountability Act.
If implemented well by the State Department of Education, and pursued aggressively by local school
systems, the ability to innovate locally where state rules impede success may well prove to be one of the
most valuable improvement initiatives the state has made. The flexibility provisions of this law should
encourage creativity among local school systems, and successful innovations are likely to spread across
the state. Eventually this ought to lead to improved state policies that are available to all.
In order to maximize the benefit of this power, it will be important to ensure that every innovation
approved is designed to improve educational performance, employs measurable indicators of success,
and is evaluated to ensure that it succeeds. The State Department of Education should periodically
review progress with each local school system that has a flexibility contract, develop ways to
disseminate information related to successes and lessons learned, and work to create a culture of
innovation among local school systems. The Department should establish responsibility for
implementation of this program so that the full value of the power to innovate is realized.
Assure the transparent reporting of performance data contained in the new
Accountability Model.
When the state’s new accountability model is implemented, every school will receive an annual letter
grade based on indicators contained in a School Performance Index. The measures will include
achievement data from statewide assessments, graduation rates, attendance rate, teacher and principal
evaluations, and indicators of college and career preparedness. While the combination of these
indicators into a letter-grade format is important for accountability purposes, it also will be important to
publish information on each indicator. Every school and school system has both strengths and
weaknesses that will be reflected in the individual indicators combined into the summary index number
it will receive each year. The community should have access to performance information on all of these
key areas, so that successes can be celebrated and issues addressed.
3. Break Down Barriers to Learning. Plan 2020’s most prominent numerical target is achieving a 90-percent high school graduation rate by
2020. However, in support of that topline goal, the plan includes many other priorities and metrics, all of

24
which are meant to help school systems produce more graduates who are better prepared for college
and career.
Schools are analyzing attendance, behavior, and coursework data for early warning
indicators of academic problems.
In addition to assessments of academic performance, Plan 2020 asks school systems to track other
indicators that have been shown to be related to dropping out. The State Department of Education has
provided Graduation Tracking System software to all school systems for this purpose.
The Graduation Tracking System has three components. It uses attendance data to flag students who
miss more than 10 percent of instructional time so they can supported with appropriate interventions.
The System also draws on disciplinary records and identifies students who have missed class time
because of behavior problems. Third, a course performance component tracks grade point average and
course credits to identify students who are falling behind.
Closer attention to that data can serve as an early warning system for problems in school. Intervening
early with students who are showing signs of trouble in these areas can cut down on school failure and
dropping out.
Schools are developing learning supports teams that may include local nonprofit agencies,
to identify and address problems before they lead to failure.
In pursuit of Plan 2020, the State Department of Education is working to develop systematic
cooperation among administrative, instructional, and support staffs in the schools to watch for and
address these sorts of problems. School- and system-based learning supports teams that are part of this
effort include teachers, administrators, counselors, nurses and social workers. They also may include
representatives of local nonprofits, as well as social service and law enforcement agencies.
Academic problems can be precipitated by problems outside of school. Absences and discipline
problems can be rooted in poor health and nutrition, transportation difficulty, or economic distress in
families. In 2013, an initial ten school systems piloted this new approach, which grew out of research
from the National Center for Mental Health in Schools, located at UCLA. Implementation work in
Alabama is being supported by Scholastic, the educational publishing company.
The initial focus in the pilot schools was on bolstering attendance. Across Alabama, schools recorded 11
million days of absence over the course of the 2010-11 school year. When students aren’t in school,
they aren’t making academic progress. Close to 200,000 students, more than a quarter of total
statewide enrollment, had five or more or more unexcused absences, a danger sign for school failure.
The learning supports teams in the pilot schools and systems addressed attendance at three levels: (1)
strategies to increase attendance generally, among all students; (2) strategies to address students with
higher than normal absence rates; and (3) strategies for students with chronic attendance problems.
To bolster attendance among all students, successful schools designed a simple recognition and reward
system for those with perfect attendance, posting their pictures on a bulletin board or offering prizes.
Schools also devoted special attention to new students, making sure their transition to the new
environment went smoothly. They invited community groups to establish mentoring programs for at-
risk students.

25
The learning supports teams then looked at the data to discern patterns that might explain absences. By
asking why students were missing school rather than just recording their attendance, schools began to
identify and address problems. They urged teachers to pay more attention to providing students with
materials needed to make up for lost time. They contacted parents earlier to express concern and offer
aid.
Finally, for students who had real problems with attendance, schools changed their approach. Under
standard practice, letters to parents are generated after four unexcused absences. Additional absences
lead to further steps, eventually ending with truancy proceedings. Schools engaged in the learning
supports work moved from a punitive to a proactive model, acting at an early stage to address the
individual student needs that were leading to school days missed. They partnered with mental health
providers to offer services to troubled students. School officials contacted parents and offered help in
addressing their particular situation.
The results were impressive. The chart on the right
lists the percentage decrease in student absences in
the school year ending in 2014 as compared to the
previous year.
Schools participating in the pilot saw a 25 percent
decrease in absences over the previous year. That
decrease represents a total of 110,000 avoided
absences, meaning students in those schools received
that many more days of instruction.
A second group with thirty school systems is adopting
the learning supports model this fall. The State Superintendent has set a goal of having all systems
trained in the approach in five years. A description of the philosophy behind the learning supports
system and how it is implemented in schools can be found online at
http://web.alsde.edu/general/ALDOEDesignDocument.pdf.
The state provides funds for an at-risk student grant program.
Schools with high rates of student poverty face particular challenges trying to keep students in school
and on track academically. Statistics on high school graduation rates compiled by GradNation indicate
that Alabama’s graduation-rate gap between poverty and non-poverty students is nineteen percentage
points; only 10 states are higher.(12) Any attempt to raise the state’s overall graduation rate and
improve academic standards must recognize the challenges faced by schools with high percentages of at-
risk students.
These students frequently need additional support through tutoring, summer and weekend educational
offerings, and other extra academic help. In 1995, the Legislature, recognizing the need for such services,
required each local school system to provide additional support for students considered at-risk of
performing below state educational standards. The requirement was set at $100 per at risk student
(Section 16-6B-3, Code of Alabama 1975), which has not been increased in the ensuing nineteen years.
System% decrease in
absences 2013-2014
Bessemer City 35%
Calhoun County 32%
Lauderdale County 31%
Decatur City 24%
Butler County 24%
Perry County 24%
Shelby County 21%
Dothan City 18%
Chickasaw City 8%
Etowah County 4%

26
Since school systems with high percentages of at-risk students are often also poorly funded, the
Legislature has provided an appropriation for grants to cover the cost of services for at-risk students.
During the recent economic downturn, less money has been appropriated to the at-risk account than is
needed to meet the $100 threshold called for in the law.
Resources exist within many communities to work on learning supports within the schools.
Children’s Policy Councils. Each county in Alabama has a Children’s Policy Council, which includes
representatives from school systems, the departments of Human Resources, Health, Mental Health,
Youth Services, Rehabilitation Services, the courts, and law enforcement. Chaired by a local juvenile
judge, the Councils coordinate the work of children’s services providers to address the needs of
children and their families. The councils are also tasked with cataloging and prioritizing community need.
Since council membership includes local legislators and representatives of local government, as well as
community members appointed at large, the councils provide a venue for addressing social problems
that affect children in and out of school.
Family Resource Centers. One successful model for community organization and coordination of
resources can be found in the Alabama Network of Family Resource Centers. Family Resource Centers,
which are private non-profits, bring together existing social service, educational, and workforce-related
efforts of the community under a single umbrella. Recognizing that children and families often face a web
of inter-related problems, the Resource Centers work with client families to address their full range of
needs. Resource Centers are also vehicles for filling identified gaps in the community, often by pursuing
grants to start new initiatives. The Alabama Network of Family Resource Centers has a tested
framework for organizing new centers, offers peer support, and has an established set of accountability
and quality standards that centers in the network are required to meet. (More information is available at
www.anfrc.com.)
Community Partnerships. The United Way of Central Alabama and partner organizations in the
Birmingham area have organized an initiative called Bold Goals, which includes support of K-12
education as one of its central components. By aligning its goals with those found in Plan 2020, the Bold
Goals Initiative hopes to increase support for efforts to help school systems in the region attain the
their goals. A key aspect of the Bold Goals Initiative is a commitment to track data in an effort to
identify the most effective programs and gauge the impact of their efforts.
The state’s distance learning system offers equal access to high quality instruction.
Some students, particularly in rural and under-resourced systems, face a barrier to college and career
readiness in that their schools are not able to offer the full variety of electives and advanced courses
available elsewhere. Alabama has successfully addressed this shortcoming through ACCESS (Alabama
Connecting Classrooms, Educators, and Students Statewide) Distance Learning. This statewide system
offering online courses was launched in 2004 and began offering classes in 2006.
Since that initial year, ACCESS has grown from an enrollment of 650 students to 27,000 students in
2014, taught by 980 Alabama-certified and high-quality teachers. ACCESS now offers 100 different

27
courses, including 11 AP courses and instruction in five languages. Courses are also offered for
remediation and credit recovery.
In 2014, ACCESSS had 403 participating schools, serving students primarily in grades 9-12, with some
additional participation by middle school students. ACCESS not only provides a wide array of courses
that might not otherwise be available but the program also allows schools and students greater flexibility
in scheduling courses.
Supported by an $18.5 million line item in the 2015 budget, Alabama’s distance learning initiative has
grown to be the third largest in the nation, behind Florida and North Carolina.
Until now, ACCESS has not set any limits on how many students it serves, however, this year for the
first time, ACCESS will have to limit enrollments because of budget limitations. In 2015, Access plans to
serve about 21,000 students, approximately 6,000 fewer students than in 2014.
Conclusions
Ensure the diffusion of the learning supports approach to all schools and systems.
The State Department of Education should continue to pursue the pilot learning supports work and
facilitate the diffusion of this approach to all schools and school systems in the state.
Organize community resources to work in concert with schools.
The State Department should facilitate the establishment of partnerships between schools and
community organizations as part of the learning supports approach, encouraging both school officials and
community groups to come together around a common agenda to establish learning supports for at-risk
students and their families. Toward this end, the Department has requested in recent years, but never
received, an appropriation of $3.5 million for grants to community organizations to engage them in work
with the schools on learning supports issues.
Provide state funding support for at-risk student programs.
The chart below shows the appropriation trend since 2007 for the at-risk grant account associated with
the Foundation Program. In its FY 2015 budget request, the Department requested an additional $12
million for the at-risk student allocation, which has received $20 million in recent years. This would have
brought the appropriation to $32 million in total, restoring the grants back to the statutory standard of
$100 for each at-risk student in a school. The budget was approved at the existing level of $20 million.
This funding needs to be provided as a key ingredient for achieving a 90-percent graduation rate.

28
However, the money provided to local systems to help at-risk children should be linked to clear plans
for improvement. The measures undertaken with the at-risk grants should be monitored for their
effectiveness in improving student outcomes.
Continue funding for Alabama ACCESS Distance Learning Initiative so all students
at all schools may access high quality required and elective coursework.
4. Seek Continuous Improvement in
Teaching and Leading. If Alabama is to deliver on its promise of more and better-prepared graduates, we must pay attention to
the professional growth of teachers and principals in our schools. Currently work is underway to:
Adopt higher standards for the teacher preparation programs that produce the next generation
of teachers.
Adequately support professional development at the state and local level.
Implement improved systems for evaluating teachers and principals.
Draw promising candidates into the teaching profession.
Teachers are responding to the advent of new, higher academic standards.
With the coming of the new Alabama College and Career Ready Standards (CCRS), teachers are being
challenged to present new material in new ways. And they are responding with enthusiasm.
$-
$5,000,000
$10,000,000
$15,000,000
$20,000,000
$25,000,000
$30,000,000
$35,000,000
2007 2008 2009 2010 2011 2012 2013 2014 2015
Funding for At-Risk Students

29
In an online survey of teachers conducted by the Alabama State Department of Education this spring,
12,500 teachers and principals answered questions about their perceptions of the new standards, their
level of professional development support they have received, and the effects the standards are having in
their classrooms.
A large majority of respondents said the new standards are more rigorous; fewer than two percent
found them less demanding.
Asked what kinds of changes teachers are making to their teaching practice, respondents most
commonly pointed to asking students more questions and encouraging them to develop independent
answers, trying new instructional strategies, creating problem-solving opportunities for students, and
increasing collaboration with other teachers.
Respondents expressed confidence in their preparation, and appreciation for the resources provided on
the state’s website and through other professional development offerings.
Asked what would be useful to help them feel better prepared, 64 percent of teachers wanted to be
given more planning time and 54 percent more time to collaborate with colleagues. Majorities also
wanted more curriculum material and student assessment tools aligned with the new standards.
The State is providing instructional support for higher standards.
Response
Percent
75.5%
11.7%
1.6%
11.2%
How would you describe the difference between the previous academic
standards and the College and Career Ready Standards (CCRS)?
I don't know
CCRS are more demanding and raise expectations for students
CCRS Implementation Survey
CCRS are less demanding and lower expectations for students
Answer Options
answered question: 8,421
CCRS are pretty much the same as the previous standards
Response
Percent
77.5%
71.7%
56.9%
50.2%
42.4%
19.5%
Answer Options
Diversifying the ways students are assessed and provided feedback
Asking students more questions and encouraging them to develop answers independently
answered question: 7,812
What changes are teachers in your district making to teaching practices as a result of the
CCRS? Choose all that apply.
Increasing use of national resources on teaching
Incorporating new curricular materials and instructional strategies in teaching
Increasing collaboration with colleagues within the school and in other schools
CCRS Implementation Survey
Structuring opportunities for students to develop and solve their own problems

30
With the adoption of the new standards, the State Department of Education recognized the need to
provide increased professional development and instructional support to teachers in the field as they
grappled with the new material and the new teaching approaches advocated in the standards. For
example, in math, students traditionally have been taught to follow steps and procedures to solve
problems. The new standards include instruction in those procedures but go beyond that to make sure
students understand the concepts and principles that make those procedures work.
The standards call for challenging students to find various routes to solving a problem. They’re asked to
explain and defend their conclusions. Similar approaches are being encouraged in other disciplines,
asking students to weigh conflicting texts and evaluate their arguments, to delve into primary sources
rather than simply accept the summaries and interpretations found in textbooks. The standards call for
creative design of assignments so that they’re relevant to real world situations. They call for stimulating
discussion and collaboration among students.
Previously, the state had several methods of delivering support to teachers and school systems. The
Alabama Reading Initiative (ARI), focused on elementary school reading in grades K-3, using coaches
employed at schools who were supported by the state staff of ARI. The Alabama Math, Science and
Technology Initiative (AMSTI) trained school staffs through summer academies, provided professional
development support during the year and delivered instructional kits that enhanced classroom lessons.
State Department staff in Montgomery supported professional development in other disciplines.
Regional in-service centers drew on the resources of colleges and universities.
Now, all those resources are being brought to bear in a coordinated effort. Staff that had been
concentrated in Montgomery now work in the eleven existing in-service regions of the state. Training is
delivered in those regions on a regular basis. The regional teams, which include ARI and AMSTI staff, are
developing deeper ties and better understanding of the needs of the schools in their region.
Meanwhile, the state added material to help teachers on its website, the Alabama Learning Exchange
(http://alex.state.al.us). The website includes online versions of each course of study, plus podcasts,
videos, and lesson plans to supplement the course of study.
All of this was done in the context of existing state funding. Both ARI and AMSTI are below the level of
support they enjoyed prior to the recession. Together, ARI and AMSTI received $100 million in 2008. In
the 2015, the two programs will receive $77 million. The pool of money passed to local systems for
professional development, as part of the Foundation Program ($4 million in 2008), was cut to $0 in 2010
and has not been restored.

31
School-based instructional partners are connecting teachers to professional development.
In an effort to make the best use of scarce resources, the State Department has given school systems
flexibility in how they use the locally-based reading coaches paid for by ARI.
ARI school-based coaches are now working with teachers at all grade levels, not just from kindergarten
through third grade. In many systems, they’ve taken on the role of “instructional partner,” serving as the
point person at each school who can coordinate professional development and supply teaching
resources across grades and subject matter.
These instructional partners don’t evaluate or hire and fire teachers. Instead, they focus on creating an
atmosphere in which teachers are always learning and improving, whether that be through classroom
coaching, better understanding of student test data, or connecting teachers to resources available
through the state or the system.
An organized approach to developing instructional partners in schools, the Instructional Partners
Network, is now working with 140 schools in 23 systems as participating members. The Network is a
collaboration among the participating schools, regional in-service centers, the State Department of
Education, and the Alabama Best Practices Center. It provides training and spreads best practices among
participating schools. The Network’s helps the school-based partners perfect methods of working
alongside and in support of teachers, in order to create an atmosphere in which teachers can learn from
and inspire one another to continuously improve.
A state commission has recommended improved standards for teacher preparation
programs.
$6 $10
$12
$19
$31
$56
$40
$56
$64 $63 $59 $59 $61
$58
$48 $48
$15
$22
$36 $37
$26 $27 $27 $28 $28 $29
2000 2001 2002 2003 2004 2005 2006 2007 2008 2009 2010 2011 2012 2013 2014 2015
State Budget Support for ARI and AMSTI, In Millions
ARI AMSTI
32
New teachers should enter the classroom ready to perform and well-versed in the higher standards we
are expecting our children to meet. According to state law, the State Board of Education governs the
training and certification of teachers for the public schools of Alabama. The State Superintendent
exercises general supervision over teacher training institutions that are under the control of the State
Board. Alabama has 27 higher education institutions with teacher preparation programs approved by the
State Board of Education. Of these, 21 have voluntarily achieved national accreditation with the Council
for the Accreditation of Educator Preparation (CAEP).
The State Board of Education appointed an Alabama Commission on Educator Preparation, Licensure,
and Entry into the Profession (ACEPLEP) to recommend changes to improve the preparation of
teachers and leaders for Alabama’s schools. In June, the commission reported its recommendations for
raising the quality of candidates for the teaching profession and raising the standards required of the
schools of education in preparing those candidates for the classroom.(13) The Commission proposed
five updated standards for teacher preparation programs. Among them:
Increase the qualifications required for students entering the teacher preparation program at
higher education institutions.
Currently, Alabama requires students wishing to enter a teacher preparation program to pass each
section of the Alabama Educator Certification Testing Program basic skills test. In addition, entering
students are required to have a grade point average of 2.5 for admission to a teacher preparation
program.
The Commission recommended that each class of candidates for entry to a teacher preparation
program should have a 3.0 grade-point average (GPA). The 2.5 GPA minimum for an individual to be
accepted into the program would remain unchanged.
This requirement moves toward a recommendation made in a recent report by the National Council on
Teacher Quality (NCTQ), which calls for a minimum GPA of 3.0 for individual candidates, with some
mechanism to allow for limited exceptions. The NCTQ also recommends that candidates for teacher
preparation programs be required to score in the top 50 percent of the general college population on a
the ACT, GRE, or other college entry test. Alabama’s commission makes a similar recommendation but
applied to the entering cohort. (14)
The NCTQ report cited Alabama’s existing skills test as a positive attribute of its system for admitting
students to teacher preparation programs.
Measure the success of teacher preparation programs using evidence of student learning growth
and survey data from both graduates and employers.
The Commission recommended that a teacher preparation program be required to demonstrate,
through multiple measures, that its graduates contribute to student learning growth, and that both
graduates and employers be surveyed to determine their satisfaction with the teacher preparation
program.

33
Require that students demonstrate an understanding of teaching standards, that they
demonstrate proficiency in the use of assessment data for measuring student progress, and they
be able to deliver instruction at the level required by Alabama College- and Career-Ready
Standards.
The Commission recommended that students in teacher preparation programs be required to
demonstrate an understanding of the ten core teaching standards developed by the Interstate Teacher
and Support Consortium (InTASC). Candidates for the profession should also show they can effectively
use methods of measuring student progress, and they understand the state’s college- and career-ready
standards.
Standards for student teaching.
The Commission recommended that student teachers’ clinical experiences be of sufficient depth and
breadth, and led by high-quality clinical educators, to ensure that they demonstrate teaching
effectiveness. This would address a weakness pointed out in the NCQT report that Alabama currently
lacks a method of ensuring that student teachers are placed with highly qualified cooperating
teachers.(15)
A committee is working to create new professional evaluation systems for teachers and
principals.
To ensure Alabama school children are receiving the best instruction in schools and that those schools
are effectively led, the state is designing new systems for evaluating the performance of public school
teachers and principals. The Alabama Professional Evaluation Design Committee is charged with
developing the structure of the evaluations.
As a condition for the final approval of its request for a waiver from federal requirements under the
Elementary and Secondary Education Act (ESEA), the State Department of Education committed to
develop teacher and principal evaluation systems that include student learning growth as a significant
factor. The schedule calls for piloting the evaluation systems in the 2014-15 school year and to begin
implementing them statewide during the following year. The Committee will report its
recommendations to the State Board of Education, which has the responsibility of adoption.
Under the new EDUCATEAlabama evaluation system, teachers will be evaluated in three areas:
professional commitment, professional practice, and impact on learning and engagement. The evaluation
process will consider online portfolios crafted by teachers to display evidence of growth in their
educational practice and self-assessment of their performance. Student feedback and growth in student
achievement will also be considered.
Under the new LEADAlabama evaluation system, principals will be evaluated in the following areas:
professional growth and learning, student growth and achievement, school planning and progress, school
culture, professional qualities and instructional leadership, and stakeholder support and engagement.
Schools are experiencing shortages of teachers, particularly in math and science.

34
School systems across the state experience problems in recruiting an adequate supply of quality
teachers, particularly in math and science. During the past two years, over fifty systems participating in a
voluntary reporting system for teacher needs had positions they were unable to fill. In both years, math
and science teachers were the hardest to find. In the 2013-14 school year, these systems had 52 math
and 49 science positions that went unfilled.
As retirements increase with the aging of the Baby Boom generation, difficulty in finding high-quality
teachers to fill vacancies is bound to increase. Ways must be found to recruit talent into the field. While
some students come into college prepared to major in education and earn their teaching certificate,
options should be available to those with an interest in teaching but who want to earn their bachelor’s
degree in another field. This is particularly true with math and science teachers, disciplines in which state
schools are hungry for new graduates. Schools of education should create paths to certification for non-
education majors.
For example, this fall, UAB is launching the UABTeach program, which allows undergraduate students
majoring in math or science to receive both their subject matter degree and full teaching certification in
four years at no extra time or cost.
This program provides students with career options after graduation. They can go directly into teaching,
into a STEM profession, or into graduate school. The program incorporates trial classroom experience,
mentoring relationships with master teachers, and potential access to financial aid to pay for college.
UAB’s program is modeled after the long-standing, successful UTEACH program at the University of
Texas at Austin, which has been replicated at 40 universities across the country. Nationally, 80 percent
of participants go into the teaching profession. (Additional information is available on the web at
http://www.uteach-institute.org/.)
The UABTeach program is a collaboration between the School of Education and College of Arts and
Sciences. More information on the UABTeach program is available at http://www.uab.edu/uabteach/.
Other alternative routes to teaching, such as Teach for America, should be considered by school
systems experiencing difficulty in recruiting new teachers. Teach for America recruits candidates who
have earned bachelor’s degrees and/or are working professionals who are willing to commit to two
years of teaching in Alabama’s chapter of Teach for America. The chapter had 173 teachers deployed in
the field in the 2013-14 school year at 44 different sites. In many case, Teach for America teachers stay
in Alabama classroom well-beyond the two-year contract.
Conclusions
Provide sufficient support for professional development, particularly in math.
It is imperative to support teachers with the training necessary to meet rising demands on their
professional practices. Plan 2020 cannot succeed without high-quality instruction in the schools of

35
Alabama. But in recent years, the amount of money going to state’s professional development programs,
the highly successful Alabama Reading Initiative and the Alabama Math, Science, and Technology
Initiative, has declined, as has state support for local systems’ professional development efforts.
In part, professional development can occur through electronic means, as the Department is doing with
its Alabama Learning Exchange web site. Principals can increase the opportunities for teachers to plan,
to work collaboratively, and to receive professional development, through effective scheduling practices.
However, the budget of the State Department of Education Legislature should be structured in ways
that are attentive to the professional development needs expressed by the Department and local school
systems. In particular, special attention must be paid to support for improving mathematics instruction,
in light of Alabama’s very low interstate rankings on NAEP math assessments in both grades 4 and 8.
A $1 million increase provided in the FY 2015 budget for AMSTI will cover the increased costs that the
program is facing to maintain support for schools it current serves. However, that increase was $4
million short of the Department’s request for AMSTI, which would have allowed the program to expand
again, working to decrease a backlog of 400 schools on its waiting list.
Support for ARI should also be sustained.
Improve the standards governing teacher preparation programs.
A Commission appointed by the State Board of Education has made its report with recommendations
for higher standards governing teacher preparation programs. The important issues addressed in that
report include:
Should the minimum requirements for GPA and ACT/GRE scores be increased for individuals
applying to enter teacher preparation programs, or should the increased requirements rather
apply to the cohort averages for a preparation program?
How should standards for student teaching be increased to enhance the value of this
experience?
How should data on student learning growth be used in evaluating teacher candidates and the
teacher preparation program itself?
How should survey data from graduates and employers be used in evaluating teacher
preparation programs?
Should the State Department of Education relax input-based requirements for teacher
preparation programs as it moves toward outcome-based evaluation standards?
With the pending adoption of new standards in these and other areas, the State Board of Education has
the opportunity to increase the supply of highly qualified teachers coming from the colleges that supply
them. This opportunity should not be missed.
Adopt teacher and principal evaluation systems that encourage professional growth
and ensure quality.

36
The key issues involved in developing the new teacher and principal evaluation systems are how to
incorporate student achievement and feedback from students and other stakeholders in professional
evaluations. It is important that these factors be piloted successfully over the next year so that the
evaluations can be fielded on schedule in school year 2015-16. The importance of staying on schedule is
heightened by the fact that the continuation of the state’s ESEA waiver depends on implementation of
these evaluation systems.
Create incentives to aid in recruiting the best and brightest to the teaching field.
Shortages of good teachers will affect the capacity to accomplish the goals of Plan 2020. The State
Department of Education should develop periodic reports that provide information on the production
of teachers in various fields and teacher shortages by type in the various school systems, which will
improve the ability to make policy regarding recruitment. The state’s higher education institutions
should focus on the development of innovative programs such as UABTeach to attract students into the
teaching profession.
5. Equip Every Student with a Plan for
Success and a Pathway to Prosperity.
Fundamental to the reforms embedded in Plan 2020 is an effort to reconnect K-12 education to its
fundamental mission of preparing students for a lifetime as productive citizens in American society.
A high school diploma is not an end in and of itself. The knowledge and skills that a diploma represents
should be relevant to and connected with life beyond the schoolhouse. Students who understand how
their K-12 education is connected to college and career are much more likely to stay engaged, to excel
and to see their education through to completion.
The state’s testing program is now aligned with the ACT, the test most commonly used to gauge college
readiness. Throughout a student’s academic career, test results will indicate whether he or she is on a
trajectory that will lead to being prepared for college. Starting in middle school, that testing also includes
career interest inquiries, which help students to begin thinking about career options that match their
interests and talents.
All students now take a College and Career Preparedness Course.
The state now requires every student to take a College and Career Preparedness Course. Most systems
are offering this course in the ninth grade. We applaud this focus, though students should be thinking
about their path through high school toward college and career even before they enter high school. The
State Department has also recognized this need and is in the process of updating its guidance on the
role of counselors in elementary and middle schools. Counselors will be asked to take a role in engaging
students with career awareness and exploration activities as early as kindergarten.

37
The 2013-14 school year marked the debut of the College and Career Preparedness Course. The
Course introduces students to the concepts of career planning and what it takes to make it in the
workforce, including workplace etiquette, communication, and teamwork. The class can feature
presentations from local businesses who want to stimulate interest in a particular field. Students learn
about resumes, cover letters, and the presentation of credentials that demonstrate qualifications.
Students are given information about higher education and introduced to the college selection and
application process. There are also computer skills and personal financial management components to
the course.
While the state provided resources and guidance to help systems design these courses, continued
energy from the state and local systems will be required if the course is to reach its potential. Every
local system can benefit from better connections to workplaces in their local areas. Local business
representatives may be helpful in supplementing the career course components that teach students
about workplace etiquette and the soft skills required to effectively function in the world of work.
All students are able to develop plans for graduating and continuing to college and career.
The Course also offers an opportunity for students to begin the process of thinking about their post-
high school plans. The state has now made available, at no cost to local systems, an online career
planning tool accessible to every student. This system, known as the Kuder Navigator, guides students
beginning in middle school along a career planning timeline, offering research-based assessments to
identify potential careers they might be interested in. Students can then build an education plan and
explore and prepare for various options after high school. (For more information, see
http://www.al.kuder.com/.)
The state has also built an extensive online Alabama Career Information Network that contains a wealth
of information about getting into and paying for college as well as career exploration. (For more
information, see http://www.alcareerinfo.org.)
The site also includes an online database and mapping function available to local businesses interested in
connecting with career education contacts at local schools (http://alcareertech.org/workforce.html), as
well as information on the number of students who have expressed interest in or enrolled in programs
related to particular career clusters. It also identifies the contacts within the schools who can help
businesses connect with those students.
For additional aid to those planning to pursue college, schools should also be aware of outside groups
that offer help navigating the process. One example is Alabama Possible’s Blueprints College Access
Initiative, http://blueprintsalabama.wordpress.com. Blueprints pairs high school students with current
college students who can help them navigate the college admissions process. The initiative’s website also
includes a rich array of information on finding financial aid to attend college and includes thorough
grade-by-grade checklists with the steps a student should take to prepare for gaining admission to
college.
Students are able to earn college credits while in high school by taking Advanced
Placement and dual enrollment courses.
38
Advanced Placement (AP). Through participation in Advanced Placement and International
Baccalaureate courses students can earn college credit if they are successful on exams. The number of
students taking AP classes in Alabama has increased from 6,629 in 2004 to 22,194 in 2013, and the
number of public schools offering AP courses has risen to 221. Students can earn college credit by
scoring a 3 on the 5-point scale of AP exams; the number of college courses credited to students in this
way increased from 1,723 in 2003 to 4,773 in 2013. The Legislature has increased support for AP from
$2.3 million in 2013 to $4.3 million in the 2015 budget.
The increases in AP offerings have been the focus of a partnership between the state and A+ College
Ready, which is supported by a coalition of federal and state agencies as well as private companies and
foundations.
Between 2008 and 2013, Alabama had the largest percentage gain in AP math, science, and English
qualifying scores in the United States, increasing the number of qualifying scores achieved by students by
118 percent. By comparison, the number of qualifying scores posted by students across the country
increased 42 percent over the same period. Minority students in Alabama had the second highest
percentage increase in the number of qualifying scores earned over that same period.
In Alabama, A+ College Ready now works with 118 high schools implementing the AP initiative, which
prepares teachers to present college-level content. It also helps prepare students for AP success by
holding summer institutes and weekend sessions during the school year. The initiative has a goal of
serving 200 of Alabama’s 365 high schools by 2020.
Dual Enrollment. College credit can also be earned through dual enrollment, in which high school
students in grades 10-12 enroll at universities or community colleges and earn both high school and
college credit for a course. Dual enrollment agreements between the school system and postsecondary
institutions govern the financial arrangements. Students normally must have a 3.0 grade-point average
and be approved by their school principal and superintendent.
In an effort to finance expansion of dual enrollment, the Legislature in 2014 approved an income tax
credit for individuals and businesses who contribute financially to dual enrollment programs in career-
technical fields at institutions of the Alabama Community College System (Act 2014-147). The donor is
given a 50-percent credit on the investment and is able to direct up to 80 percent of the proceeds to
particular programs or courses at a particular institution. The balance is to be allocated to meet
workforce development priorities. The total of all credits is limited to $5 million statewide. Since the
credit amounts to half the donation, the ceiling for the program is effectively $10 million a year.
In 2014, the Legislature also created a new line item of $5 million in the Department of Postsecondary
Education budget to support the expansion of dual enrollment for students pursuing career-technical
programs through the Alabama Community College System. Prior to this appropriation, the Department
had a pool of $2 million to support student scholarships for career tech, awarding about 2,100
scholarships annually. The Department estimates that seven to nine percent of eligible high school
students participate in dual enrollment. The $5 million appropriation, plus the tax credits, could result in
expansion of career-tech dual enrollment to a total of $15 million annually, which would allow the two-
year system to support 10,000 scholarships annually, according to the Chancellor.

39
Taking advantage of flexibility, one school system is working to make time available for
enrollment in college-credit courses.
One of the twelve flexibility plans approved by the State Board of Education aims at increasing the time
high school students have to enroll in college-credit coursework. The Tuscaloosa City Schools earned
approval for its plan to grant credit for career-related coursework and summer athletic programs that
meet state standards, and to allow students to take end-of-course tests early when they have mastered
the content. By earning credits in these ways, high school students will have time available to enroll in
college courses that will further their career plans.
Alabama is a leading state in exposing middle and high school students to science,
mathematics, and engineering careers through robotics design and construction
competitions.
BEST (Boosting Engineering, Science, and Technology) Robotics, is a non-profit, volunteer collaboration
between schools and industry partners that involves students in team robotic design and construction
competitions. BEST’s mission is to engage and excite students in engineering, science, and technology, in
hopes they’ll pursue careers in these fields. Nationally, BEST includes 18,000 students and 875 high
school teams in 19 states. All sustaining funds are raised locally, with heavy involvement from local
businesses/industries and universities. BEST Alabama started in Mobile and Auburn University now hosts
the annual Southeastern Regional Competition. In the most recent national BEST Competition,
Wetumpka High School finished 3rd in the BEST Award competition and 4th in the Robotics Award.
Too many high school graduates enroll in remedial courses in math and English at
Alabama’s public institutions of postsecondary and higher education.
Data maintained by the Alabama Commission on Higher Education indicate that a third of Alabama high
school graduates who enroll in the state’s 2-year and 4-year institutions of higher education sign up for
non-credit remedial courses in math and English. This is wasteful to the educational system and costly to
the students involved. For a student enrolled in a typical 120-hour baccalaureate program, taking a non-
credit, 3-hour remedial course adds 2.5 percent to the cost of completion; taking two remedial courses
adds five percent. These figures are doubled to five and ten percent for a student taking remedial
courses while enrolled in a 60-hour associate degree program.
Plan 2020’s higher academic standards focus on the student side of this issue and should result in fewer
students who are ill-prepared for college coursework. But there is another side to the issue, which is
that the standards used to decide which students must pass remedial courses before enrolling in credit-
bearing courses vary from institution to institution.
This issue was debated in the Governor’s College and Career Ready Task Force, and the
recommendation was made that the state should have a uniform policy, applicable in all its
postsecondary institutions, for deciding which students are required to take remedial coursework. The
policy might, for example, incorporate a sliding scale that considers both a student’s grade-point average
in high school and his or her ACT score; the higher the GPA, the lower the ACT bar, and vice versa.
Students whose combination of GPA and ACT scores are above the line would not have to take
remedial coursework. This policy would properly be considered by the academic officers of the state
institutions. Nothing has yet been accomplished in moving toward such a policy.

40
Career coaches are being placed in Alabama high schools.
To augment the resources and expertise available to schools for college and career planning, the State
Department of Education and the Alabama Community College System are in the process of building a
corps of career coaches for deployment in high schools throughout the state. This effort was supported
in the recommendations made by the Governor’s College and Career Ready Task Force.(16)
In 2013, the State Department supported 24 career coaches, each one assigned to work with five high
schools so that they can spend one day a week at each school. An additional $600,000 was provided to
the Department for this purpose in the FY 2015 budget, which will allow it to expand the number of
coaches in the field from 24 to 36.
Several of the state’s community colleges also have career coaches on staff, working with high schools in
their coverage areas under similar arrangements. The Alabama Community College System has an
appropriation of $600,000 for these coaches. The two agencies are collaborating to avoid duplication in
the coverage of high schools.
The coaches spend the school year working with students to help them identify career opportunities.
They establish relationships with local businesses and arrange for workplace tours, internships, and
other work- and career-related opportunities. These coaches take some of the burden off school-based
counselors who are often consumed with the more immediate responsibilities of looking after the
academic and emotional well-being of children in schools.
Working cooperatively with the Alabama College System, the State Department plans to expand its
career coach initiative to a total of 80, a level at which the Department believes it can support the
schools wanting to participate. To reach the goal of 80 coaches, the Legislature will need to find an
additional $2.3 million to pay for the program.
The role of school counselors in learning supports and college/career planning activities
should be clarified.
School counselors play an essential role in the academic, career, and personal/social development of
students. Counselors are provided to each school through the Foundation Program, according to the
number of students. There are 1,483 counselor positions funded in the Foundation Program for FY
2015.
A task force is currently meeting to update Alabama’s comprehensive counseling and guidance model for
public schools. The current model (17) dates from 2003 and is based on standards developed by the
American School Counselor Association. It calls on the school counselor to facilitate student
development in three domains: academic, career, and personal/social. Within the career development
domain, there are three standards for students that fall within the responsibility of counselors. They call
for students to:
Acquire the skills to investigate the world of work in relation to knowledge of self and to make
informed career decisions

41
Employ strategies to achieve future career goals with success and satisfaction
Understand the relationship between personal qualities, education, training and the world of
work.
Key issues that the counseling task force should address include the relationship of counselors to the
career coaches and learning supports teams that are being added in Alabama schools, as discussed
earlier in this report.
Career-tech expansion increases the graduation rate.
In recent decades, K-12 schools paid less attention to vocational education than had been the case in the
past. That is changing. In Alabama a reenergized focus and modernized approach to career-technical
education is swelling enrollment in a growing number of career-tech offerings. During the 2013 school
year, an additional 4,875 students took career tech classes, a 2.5-percent increase over the previous
year. Overall participation in career tech increased by seven percent, representing both additional
students and more courses being taken.
In 2012, ninety percent of students who concentrated in career-technical education graduated from high
school, compared with the 75 percent graduation rate recorded that year for all students. Plan 2020
recognizes the effectiveness of career-technical education in improving graduation rates as well as
college and career readiness. The Plan aims at increasing the number of students achieving industry
certification. Starting in the 2014-15 school year, all 12th graders are scheduled to take the ACT
WorkKeys assessment, which measures student readiness to perform in the workplace. However, the
lack of money for assessments described earlier in the report may lead to a delay or limit the
administration of the WorkKeys tests.
In 2013, the State Legislature authorized a $50-million bond issue to help local school systems update
their career-technical education classroom technology and equipment. The 21st Century Workforce
Act is aimed at providing equipment and technology so that career-technical programs can meet the
standards of the global business community.
Creation of the Alabama Workforce Council establishes a forum for business-education
partnership.
The Legislature in its 2014 session authorized the establishment of the Alabama Workforce Council,
following a recommendation made by the Governor’s College and Career Ready Task Force. In July, the
Governor appointed 30 members to the Council, which has been created to advise state education
officials on ways to more closely tailor the state’s workforce education programs to the needs of
Alabama business and industry.
The state also has a system of 10 regional workforce councils already in place. These councils are
designed to create better communication between the businesses in the region and partners in K-12 and
higher education. The most active and successful of these councils develop a thorough understanding of
the workforce needs in their region and work to align educational opportunities with those needs.

42
Conclusions
Evaluate the impact of the new initiatives in career planning and coaching.
The new College and Career Preparedness Course, career coaches, and career planning system that
have been fielded represent potentially valuable assets in the effort to increase the graduation rate and
the preparedness of students for college and career. They should be evaluated to measure their impact
and ensure that they succeed.
Ensure that the new counseling model clarifies the relationship of counselors to
learning supports teams and career coaches.
Implement the College and Career Task Force recommendation for a statewide
standard to define which students can be enrolled in non-credit remedial courses.
43
It’s Up to Us.
Yogi Berra famously said, “When you come to a fork in the road, take it.”
We face a workforce challenge. Alabamians want and deserve high-paying jobs, but the educational
credentials of our workforce are not what they need to be. By 2020, experts say almost two-thirds of
workers must have some postsecondary education and training.
The educational leadership of the state has set a goal of increasing Alabama’s high school graduation rate
to 90 percent by the year 2020, and at the same time increasing the college and career preparedness of
its graduates.
The Governor, the Legislature, and the state’s business community have provided important leadership
in support of key initiatives, particularly in the areas of Pre-K expansion and workforce development.
Alabama’s higher education leaders, at two-year and four-year schools, are working collaboratively with
their K-12 colleagues toward the goal. These strategic partnerships must be maintained and built upon if
we are to succeed.
The plan currently being pursued will involve investment by the state. If we don’t invest in an
improvement plan, our workforce issues will only worsen.
If we are to succeed, we must do five things, all of which are components of the Plan:
1. Start early, which will require sustained investment in expanding Pre-K.
2. Set high expectations and measure progress toward our goals, which will require paying for
the assessments needed to track improvement.
3. Break down barriers to learning, which will require increased investments in helping children
who are at-risk of school failure.
4. Seek continuous improvement in teaching and leading, which will require higher standards for
teacher preparation and evaluation, as well as additional support for the ongoing professional
development of our teachers in the field.
5. Equip every student with a plan for success and a pathway to prosperity, which will require
continuing our investment in efforts to connect students to college and career.
If this plan does succeed, it will bring substantial economic benefits. Economic models prepared for this
report predict that if we reach the goal by 2020, the state’s economic output will be $430 million
greater that year than if our graduation rate were to remain at its current level. Each year we sustain
the 90 percent graduation rate, each class of graduates would be 5,643 larger, with 3,564 of them going
into the workforce, resulting in a net addition of 1,167 more people employed. Each class graduating at
90 percent would collectively earn $68 million more than a class graduating at the 80 percent rate.

44
Plan 2020’s approach to improving schools is comprehensive, goal-oriented, and multi-faceted. Its goals
and measures will define more clearly how K-12 education is performing and indicate whether our
public schools are meeting the challenge. Tracking the components and transparently reporting on
progress is essential to staying the course toward completion.
Sustaining a plan of this complexity over a period of years will only be possible with business support at
the state level and the active participation of businesses in their local school systems. The Business
Education Alliance intends to issue an annual report card on the implementation of Alabama’s plan to
produce college and career ready graduates at a 90 percent rate from its public high schools by the year
2020.
- 0 0 0 -
hhttttpp::////ppaarrccaa..ssaammffoorrdd..eedduu
PARCA is a 501(c)(3)
nonprofit educational
corporation. It exists to
provide information that will
improve state and local
government as well as public
education in Alabama.
The Business and Education Alliance of
Alabama is a 501(c)(3) foundation devoted
to helping Alabama have a well prepared
work force and a robust economy through
initiatives to improve education that are
brought about by collaboration between
educators and business/industry. hhttttpp::////bbeeaaaallaabbaammaa..ccoomm
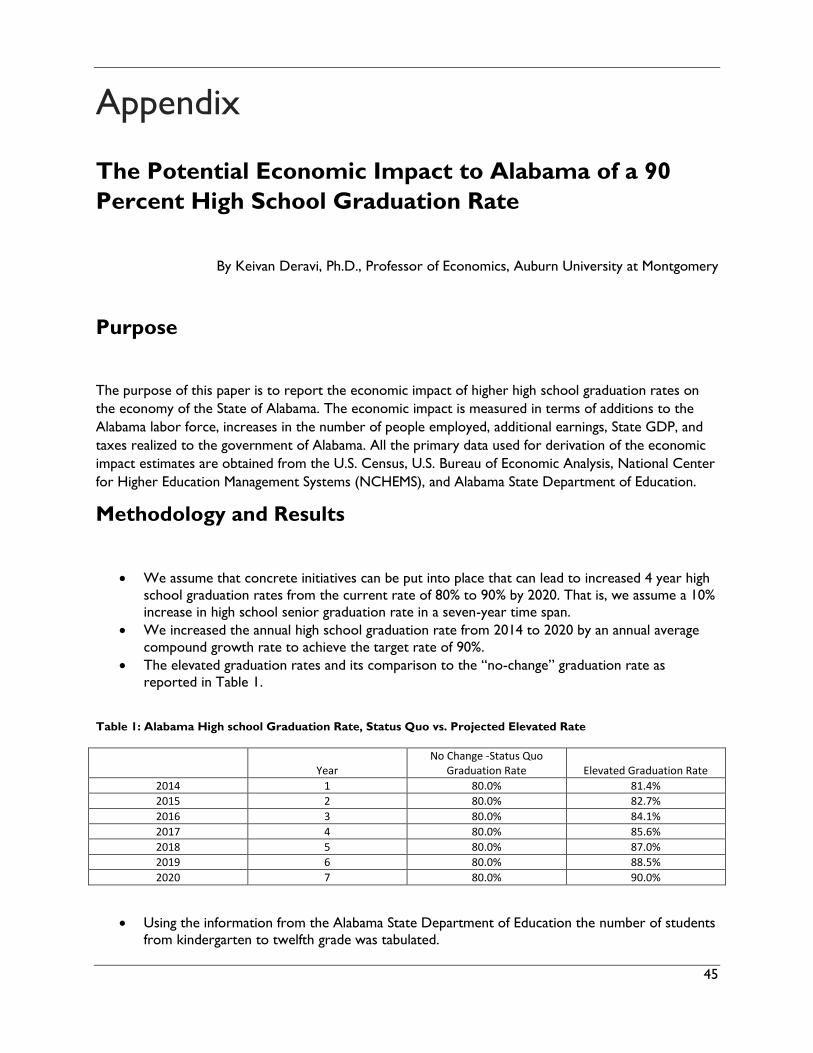
45
Appendix
The Potential Economic Impact to Alabama of a 90
Percent High School Graduation Rate
By Keivan Deravi, Ph.D., Professor of Economics, Auburn University at Montgomery
Purpose
The purpose of this paper is to report the economic impact of higher high school graduation rates on
the economy of the State of Alabama. The economic impact is measured in terms of additions to the
Alabama labor force, increases in the number of people employed, additional earnings, State GDP, and
taxes realized to the government of Alabama. All the primary data used for derivation of the economic
impact estimates are obtained from the U.S. Census, U.S. Bureau of Economic Analysis, National Center
for Higher Education Management Systems (NCHEMS), and Alabama State Department of Education.
Methodology and Results
We assume that concrete initiatives can be put into place that can lead to increased 4 year high
school graduation rates from the current rate of 80% to 90% by 2020. That is, we assume a 10%
increase in high school senior graduation rate in a seven-year time span.
We increased the annual high school graduation rate from 2014 to 2020 by an annual average
compound growth rate to achieve the target rate of 90%.
The elevated graduation rates and its comparison to the “no-change” graduation rate as
reported in Table 1.
Table 1: Alabama High school Graduation Rate, Status Quo vs. Projected Elevated Rate
Year No Change -Status Quo
Graduation Rate Elevated Graduation Rate
2014 1 80.0% 81.4%
2015 2 80.0% 82.7%
2016 3 80.0% 84.1%
2017 4 80.0% 85.6%
2018 5 80.0% 87.0%
2019 6 80.0% 88.5%
2020 7 80.0% 90.0%
Using the information from the Alabama State Department of Education the number of students
from kindergarten to twelfth grade was tabulated.

46
The graduating class of 2014 was multiplied by two alternative graduation rates. As is highlighted
in Table 1, in 2014, the “no-change” graduation rate is assumed to be 80%. The elevated rate is
81.4%.
This increase in graduation rate of 1.4% will lead to 665 additional high school graduates. This
figure is reported in Table 2 for 2014.
Table 2, highlights the number of additional high school graduates from 2014-2020 attributable
to the increased graduation rates. For example, by year 2020 Alabama will see 5,643 additional
high school graduates.
Table 2: Projected Number of Additional High school Graduates
Year
Number of Potential
Graduates
Number of Graduates at Current Rate
Number of Graduates with Elevated Rate
Additional High school Graduates
2014 1 48,965 39,172 39,837 665
2015 2 51,527 41,221 42,632 1,411
2016 3 56,144 44,915 47,241 2,325
2017 4 62,069 49,655 53,112 3,457
2018 5 58,799 47,039 51,168 4,129
2019 6 58,455 46,764 51,732 4,968
2020 7 56,428 45,142 50,785 5,643
It is an economic fact that high school graduates have a better chance of finding a job, earning more
income, and pursuing a college education relative to those with less than a high school degree.
Table 3: Median Earnings by Education Attainment, 20121
Total $31,322
Less than high school graduate $18,642
High school graduate $25,485
Some college $30,525
Bachelor degree $45,124
In Table 4, we highlight the direct impact of additional high school graduation rates on Alabama’s
economy.
Direct economic impact is the economic additions that can be directly and solely attributable to
increased high school graduation rates.
The calculations in Table 4 are to capture this increased opportunity for employment, higher
pay, and a better career.
o As highlighted in Table4, an elevated graduation rate for the year 2020 leads to 5,643
additional high school graduates, 3,564 additional employees, and $112.9 million in more
earnings.
o The figures reported above are as follows:
1. We start with data from 2020 for illustration purposes.
2. The higher graduation rate will lead to 5,643 additional high school graduates.
3. According to the most recent NCHEMS report 36.8% of high school graduates
will not pursue college (four or two year college).
1 The U.S. Census Bureau
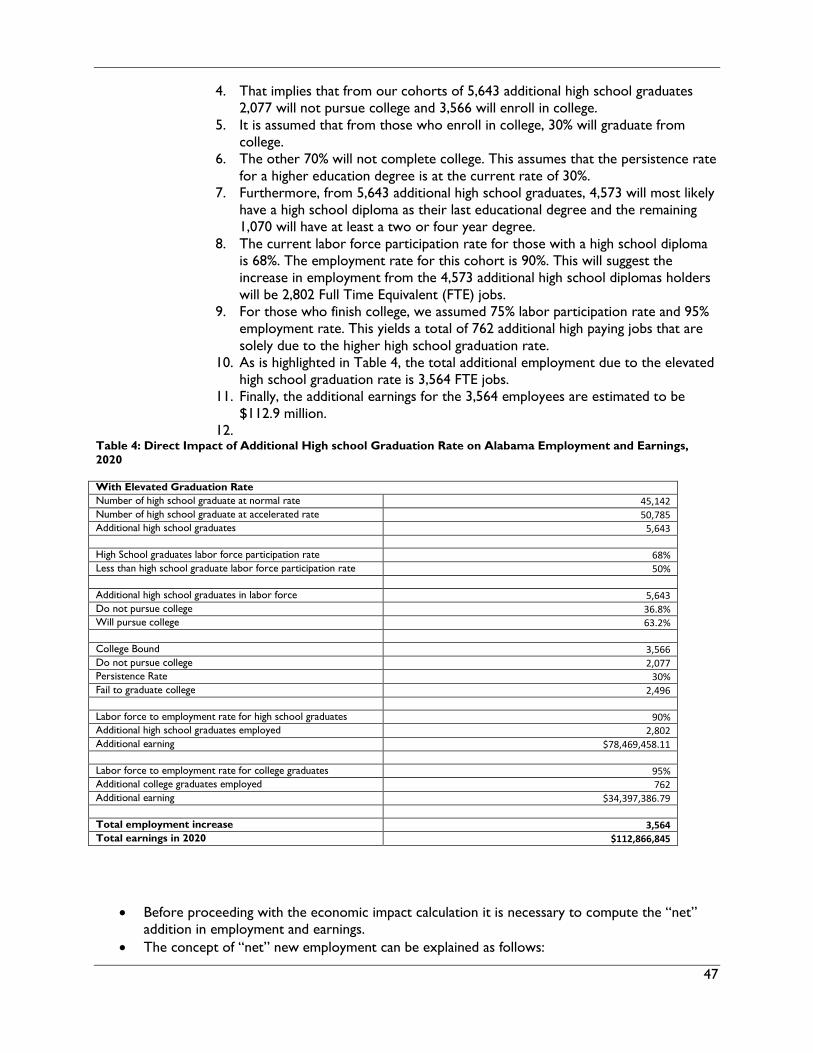
47
4. That implies that from our cohorts of 5,643 additional high school graduates
2,077 will not pursue college and 3,566 will enroll in college.
5. It is assumed that from those who enroll in college, 30% will graduate from
college.
6. The other 70% will not complete college. This assumes that the persistence rate
for a higher education degree is at the current rate of 30%.
7. Furthermore, from 5,643 additional high school graduates, 4,573 will most likely
have a high school diploma as their last educational degree and the remaining
1,070 will have at least a two or four year degree.
8. The current labor force participation rate for those with a high school diploma
is 68%. The employment rate for this cohort is 90%. This will suggest the
increase in employment from the 4,573 additional high school diplomas holders
will be 2,802 Full Time Equivalent (FTE) jobs.
9. For those who finish college, we assumed 75% labor participation rate and 95%
employment rate. This yields a total of 762 additional high paying jobs that are
solely due to the higher high school graduation rate.
10. As is highlighted in Table 4, the total additional employment due to the elevated
high school graduation rate is 3,564 FTE jobs.
11. Finally, the additional earnings for the 3,564 employees are estimated to be
$112.9 million.
12. Table 4: Direct Impact of Additional High school Graduation Rate on Alabama Employment and Earnings,
2020
With Elevated Graduation Rate
Number of high school graduate at normal rate 45,142 Number of high school graduate at accelerated rate 50,785 Additional high school graduates 5,643
High School graduates labor force participation rate 68%
Less than high school graduate labor force participation rate 50%
Additional high school graduates in labor force 5,643 Do not pursue college 36.8%
Will pursue college 63.2%
College Bound 3,566 Do not pursue college 2,077 Persistence Rate 30%
Fail to graduate college 2,496
Labor force to employment rate for high school graduates 90%
Additional high school graduates employed 2,802 Additional earning $78,469,458.11
Labor force to employment rate for college graduates 95%
Additional college graduates employed 762 Additional earning $34,397,386.79
Total employment increase 3,564 Total earnings in 2020 $112,866,845
Before proceeding with the economic impact calculation it is necessary to compute the “net”
addition in employment and earnings.
The concept of “net” new employment can be explained as follows:

48
1. If the initiatives to increase the graduation rate were not in place, in 2020 we
would have had 5,463 fewer graduates.
2. The 5,463 without a degree would have entered the labor market and some
would have been gainfully employed, albeit, at a lower rate and lower pay
relative to those with the high school diploma.
3. For those with less than a high school degree the labor force participation rate
is 50% and the employment rate is 85%. This implies that from a total of 5,463
non-graduates only 2,397 will be employed.
4. With the elevated high school graduation rate the additional employment is
estimated to be 3,564. With “no change” in the graduation rate the additional
employment is reported to be 2,397.
5. The “net” employment impact of additional high school graduation is, therefore,
1,167 (3,564 minus 2,397).
6. The “net” direct impact increase on Alabama’s employment and earnings for
2020 is reported in Table 6. It is our estimate that the “net” impact will be
1,167 FTE jobs and $68.2 million in additional earnings.
Table 5: Direct Impact of “No Change” on Graduation Rate on Alabama Employment and Earnings, 2020
With Status Quo Graduation Rate
Additional numbers without high school degree 5,463
In the labor force 2840
Employment rate 85%
Additional employment 2397
Additional earning $44,691,289
Table 6: Net Direct Impact Increase on Alabama Employment and Earnings, 2020
Net Increase
Net Employment 1,167
Net Earning $68,175,555
The process explained above was repeated for the years 2014-2020 and the results are
reported in Table 7.
As is highlighted in Table 7, the cumulative direct economic impact of the elevated high school
graduation rate, for 2014 to 2020 time span, is as follows:
1. Additional graduation of 22,597 high school seniors.
2. Additional employment of 15,291 FTE jobs.
3. Additional net employment of 4,673 of new permanent jobs.
4. Additional net new earning of $284.0 million
5. Additional net Real GDP increases of $328.5 million for the State’s economy.
6. And, additional annual tax yield increases of $42 million for all levels of
governments by 2020 (State, local and municipality).
Table 7: Direct Cumulative Impact of Additional High school Graduation Rate on Alabama Employment and
Earning, 2014 to 2020

49
Year Graduation Rate
Additional Number of
HS Graduates
Additional Employment
Additional employment
without Increase in Graduation
Rate
Net Total employment
Increase
Total earning in 2014 $
All Taxes (State, Local,
and Municipal)
GDP
2014 1 81.4% 665 450 282 137 $8,355,139 $1,235,108 $9,662,900
2015 2 82.7% 2075 1404 882 429 $26,088,944 $3,856,626 $30,172,430
2016 3 84.1% 4401 2978 1870 910 $55,319,766 $8,177,704 $63,978,512
2017 4 85.6% 7858 5317 3338 1625 $98,774,868 $14,601,502 $114,235,282
2018 5 87.0% 11987 8111 5093 2479 $150,672,296 $22,273,296 $174,255,786
2019 6 88.5% 16954 11473 7203 3506 $213,116,036 $31,504,110 $246,473,328
2020 7 90.0% 22597 15291 9600 4673 $284,045,884 $41,989,391 $328,505,239
The total economic impact is estimated by multiplying the direct cumulative impact for 2020
(Table 7) by its respective multiplier.
The total economic impact of higher high school graduation rate is reported in Table 8.
It is our estimate that the State’s economy will experience an increase of employment of 6,740
FTE permanent jobs, earning increase of $372 million, GDP increase of $430.2 million and
additional tax collections of $21.9 million and $3.9 million, for Education Trust Fund and
General Fund, respectively.
Table 8: Total Economic Impact of Additional High school Graduation Rate on Alabama Employment and
Earning, 2014 to 2020
EMPLOYMENT EARNING GDP ETF GF
2020 6,740 $371,951,669 $430,170,191 $21,912,035 $3,871,264
For the purpose of illustration, we extend our analysis to year 2030 and 2040.
The results are presented in Table 9.
Our estimate shows that, by 2040, the total economic impact of higher high school graduation
rate on Alabama’s economy will be additional employment of 33,999, earning increase of $1.7
billion, GDP increase of $2.6 billion, and State tax increase of $118 million.
Table 9: Total Economic Impact of Additional High School Graduation Rate on Alabama Employment and
Earning, 2030 and 2040
EMPLOYMENT EARNING GDP ETF GF
2030 23,572 $1,300,762,006 $1,504,359,537 $76,629,156 $13,538,299
2040 33,999 $1,703,318,468 $2,578,548,884 $100,344,149 $17,728,097
Final Words & Caveats
It is important to note that all the figures reported here are in 2014 dollars.

50
The long run impact estimates of higher high school graduation rates presented here are
significantly larger in magnitude than any mega industrial project that has been recruited to the
State.
By year 2020, the impact of higher high school graduation rates on the State’s economy
resembles that of recruiting a Mercedes or Airbus type investment every year.
In this case, the economic benefits operate similar to a permanent upward structural shock to
the State’s economic resources. As such, it will, continuously and exponentially, add to
economic prosperity of the State’s economy.
Finally, the estimates reported here are underestimating the true economic impact.
This is because higher graduation rates will lead to positive externalities such as lower crime
rate, lower Medicaid and welfare dependency, more efficient higher education operation, and
higher homeownership rates and a host of other intangible benefits that are hard to quantify.
For example, research indicates that by 2020, the State could potentially realize a saving of $75
million in Medicaid spending alone.
Should the Plan 2020 lead to higher persistence rates in two and four year college completion
rates, the impact on Alabama’s economy will be significantly larger than the numbers reported in
this study.

51
Endnotes 1. According to the National Center for Higher Education Management Systems, http://www.higheredinfo.org.
2. The Hamilton Project, http://www.hamiltonproject.org.
3. http://www.doleta.gov/performanceresults/Annual_Reports/PY2012/ALEconomicAnalysis2012.pdf.
4. Georgetown University Center on Education and the Workforce, “Recovery: Job Growth and Education
Requirements Through 2020,” June 2013.
5. National Institute for Early Education Research, “The State of Preschool,” annual reports for 2006-2013.
6. PARCA, “Analysis of ARMT Scores for Recipients of First Class/OSR Pre-K,” 2012.
7. See http://nces.ed.gov/nationsreportcard/.
8. Copied from ALSDE, “College- and Career-Ready Standards: Implementation and Resources,” Powerpoint
presentation (March 13, 2013).
9. See http://www.act.org/newsroom/data/2013/states/pdf/Alabama.pdf.
10. See http://www.ache.state.al.us/Content/Remedial/Remedial.aspx.
11. See http://web.alsde.edu/home/general/plan_2020_esea.aspx.
12. http://gradnation.org/resource/building-gradnation-2012-acgr-state-graduation-gap-between-low-income-and-
non-low-income
13. Alabama Commission on Educator Preparation, Licensure, and Entry into the Profession (ACEPLEP) Report to
State Superintendent, Dr. Tommy Bice, and the State Board of Education, June 2014.
14. National Council on Teacher Quality, “2014 Teacher Prep Review.”
15. National Council on Teacher Quality, “2013 State Teacher Policy Yearbook: Alabama,” January 2014.
16. Recommendations of Governor’s College and Career Ready Task Force, See
http://governor.alabama.gov/assets/2014/07/College-and-Career-Ready-Standards.pdf
17. Alabama State Department of Education, “Comprehensive Counseling and Guidance State Model for Alabama
Public Schools,” Bulletin 2003, No. 89.