oc4 page 1 of 12 - ocean palms elementary $71,805.76 $36,953.19 $34,852.57 48.54% pbm - pacetti bay...
TRANSCRIPT
OC4 Page 1 of 12
OC4 Page 2 of 12
St Johns County School DistrictEnergy CAP
Cost Avoidance Program
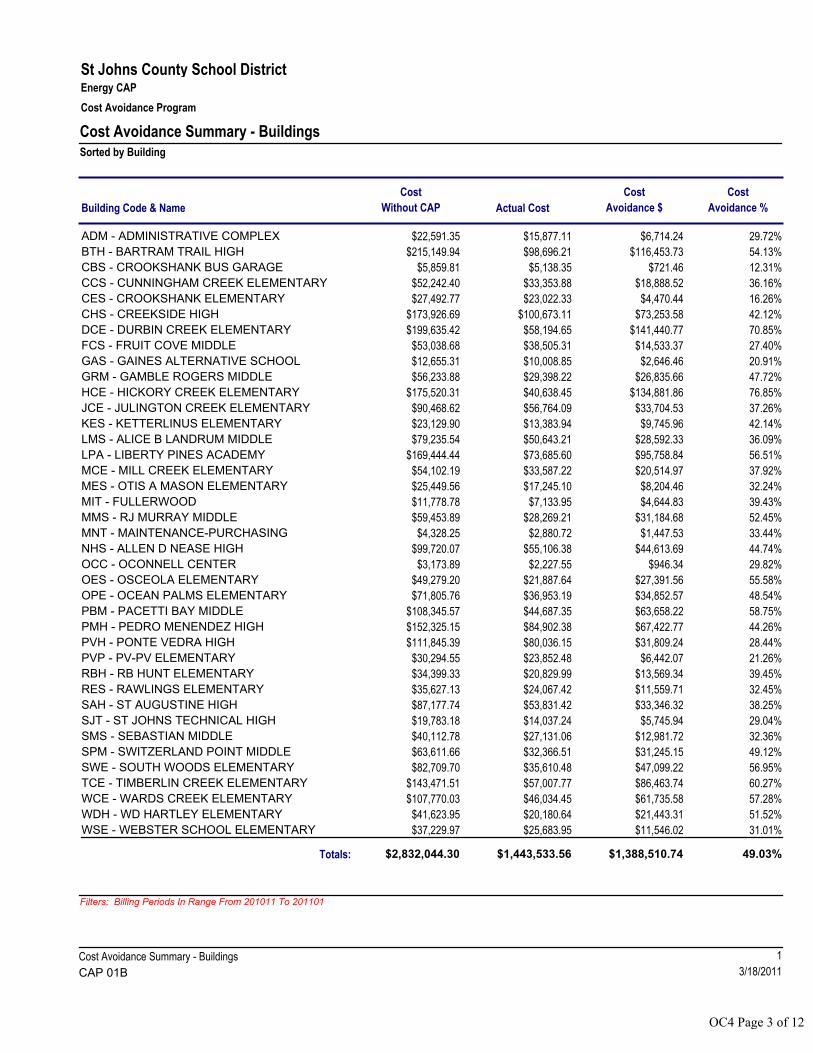
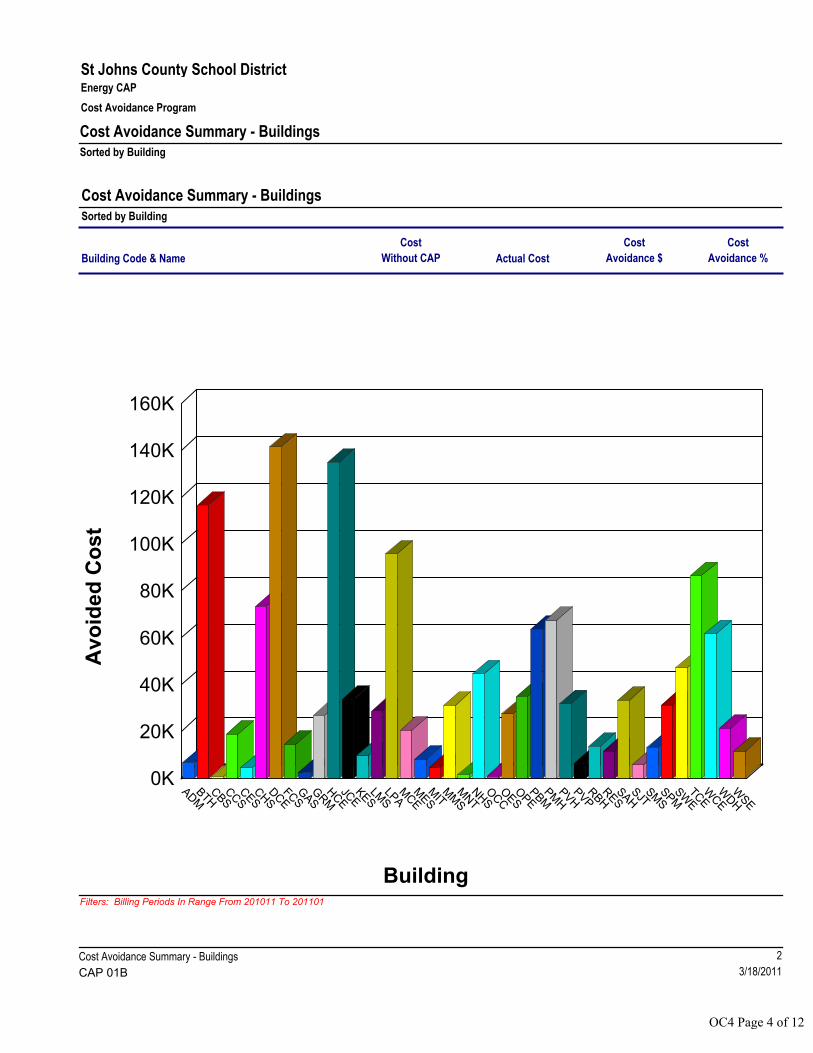
Cost Avoidance Summary - BuildingsSorted by Building
Building Code & Name
Cost
Avoidance %Actual Cost
Cost
Without CAP
Cost
Avoidance $
$15,877.11 $22,591.35 $6,714.24 29.72%ADM - ADMINISTRATIVE COMPLEX
$98,696.21 $215,149.94 $116,453.73 54.13%BTH - BARTRAM TRAIL HIGH
$5,138.35 $5,859.81 $721.46 12.31%CBS - CROOKSHANK BUS GARAGE
$33,353.88 $52,242.40 $18,888.52 36.16%CCS - CUNNINGHAM CREEK ELEMENTARY
$23,022.33 $27,492.77 $4,470.44 16.26%CES - CROOKSHANK ELEMENTARY
$100,673.11 $173,926.69 $73,253.58 42.12%CHS - CREEKSIDE HIGH
$58,194.65 $199,635.42 $141,440.77 70.85%DCE - DURBIN CREEK ELEMENTARY
$38,505.31 $53,038.68 $14,533.37 27.40%FCS - FRUIT COVE MIDDLE
$10,008.85 $12,655.31 $2,646.46 20.91%GAS - GAINES ALTERNATIVE SCHOOL
$29,398.22 $56,233.88 $26,835.66 47.72%GRM - GAMBLE ROGERS MIDDLE
$40,638.45 $175,520.31 $134,881.86 76.85%HCE - HICKORY CREEK ELEMENTARY
$56,764.09 $90,468.62 $33,704.53 37.26%JCE - JULINGTON CREEK ELEMENTARY
$13,383.94 $23,129.90 $9,745.96 42.14%KES - KETTERLINUS ELEMENTARY
$50,643.21 $79,235.54 $28,592.33 36.09%LMS - ALICE B LANDRUM MIDDLE
$73,685.60 $169,444.44 $95,758.84 56.51%LPA - LIBERTY PINES ACADEMY
$33,587.22 $54,102.19 $20,514.97 37.92%MCE - MILL CREEK ELEMENTARY
$17,245.10 $25,449.56 $8,204.46 32.24%MES - OTIS A MASON ELEMENTARY
$7,133.95 $11,778.78 $4,644.83 39.43%MIT - FULLERWOOD
$28,269.21 $59,453.89 $31,184.68 52.45%MMS - RJ MURRAY MIDDLE
$2,880.72 $4,328.25 $1,447.53 33.44%MNT - MAINTENANCE-PURCHASING
$55,106.38 $99,720.07 $44,613.69 44.74%NHS - ALLEN D NEASE HIGH
$2,227.55 $3,173.89 $946.34 29.82%OCC - OCONNELL CENTER
$21,887.64 $49,279.20 $27,391.56 55.58%OES - OSCEOLA ELEMENTARY
$36,953.19 $71,805.76 $34,852.57 48.54%OPE - OCEAN PALMS ELEMENTARY
$44,687.35 $108,345.57 $63,658.22 58.75%PBM - PACETTI BAY MIDDLE
$84,902.38 $152,325.15 $67,422.77 44.26%PMH - PEDRO MENENDEZ HIGH
$80,036.15 $111,845.39 $31,809.24 28.44%PVH - PONTE VEDRA HIGH
$23,852.48 $30,294.55 $6,442.07 21.26%PVP - PV-PV ELEMENTARY
$20,829.99 $34,399.33 $13,569.34 39.45%RBH - RB HUNT ELEMENTARY
$24,067.42 $35,627.13 $11,559.71 32.45%RES - RAWLINGS ELEMENTARY
$53,831.42 $87,177.74 $33,346.32 38.25%SAH - ST AUGUSTINE HIGH
$14,037.24 $19,783.18 $5,745.94 29.04%SJT - ST JOHNS TECHNICAL HIGH
$27,131.06 $40,112.78 $12,981.72 32.36%SMS - SEBASTIAN MIDDLE
$32,366.51 $63,611.66 $31,245.15 49.12%SPM - SWITZERLAND POINT MIDDLE
$35,610.48 $82,709.70 $47,099.22 56.95%SWE - SOUTH WOODS ELEMENTARY
$57,007.77 $143,471.51 $86,463.74 60.27%TCE - TIMBERLIN CREEK ELEMENTARY
$46,034.45 $107,770.03 $61,735.58 57.28%WCE - WARDS CREEK ELEMENTARY
$20,180.64 $41,623.95 $21,443.31 51.52%WDH - WD HARTLEY ELEMENTARY
$25,683.95 $37,229.97 $11,546.02 31.01%WSE - WEBSTER SCHOOL ELEMENTARY
Totals: $2,832,044.30 $1,443,533.56 49.03%$1,388,510.74
Filters: Billing Periods In Range From 201011 To 201101
1
3/18/2011
Cost Avoidance Summary - Buildings
CAP 01B
OC4 Page 3 of 12
St Johns County School DistrictEnergy CAP
Cost Avoidance Program
Cost Avoidance Summary - BuildingsSorted by Building
Cost Avoidance Summary - BuildingsSorted by Building
Building Code & Name
Cost
Avoidance %Actual Cost
Cost
Without CAP
Cost
Avoidance $
0K
20K
40K
60K
80K
100K
120K
140K
160K
ADMBTH
CBS
CCSCES
CHSDCEFC
SGAS
GRMHCEJC
EKES
LMSLPA
MCEM
ESM
ITM
MSM
NTNHSOCCOES
OPE
PBMPM
HPVH
PVPRBH
RES
SAHSJT
SMSSPM
SWETC
EW
CEW
DHW
SE
Building
Av
oid
ed
Co
st
Filters: Billing Periods In Range From 201011 To 201101
2
3/18/2011
Cost Avoidance Summary - Buildings
CAP 01B
OC4 Page 4 of 12
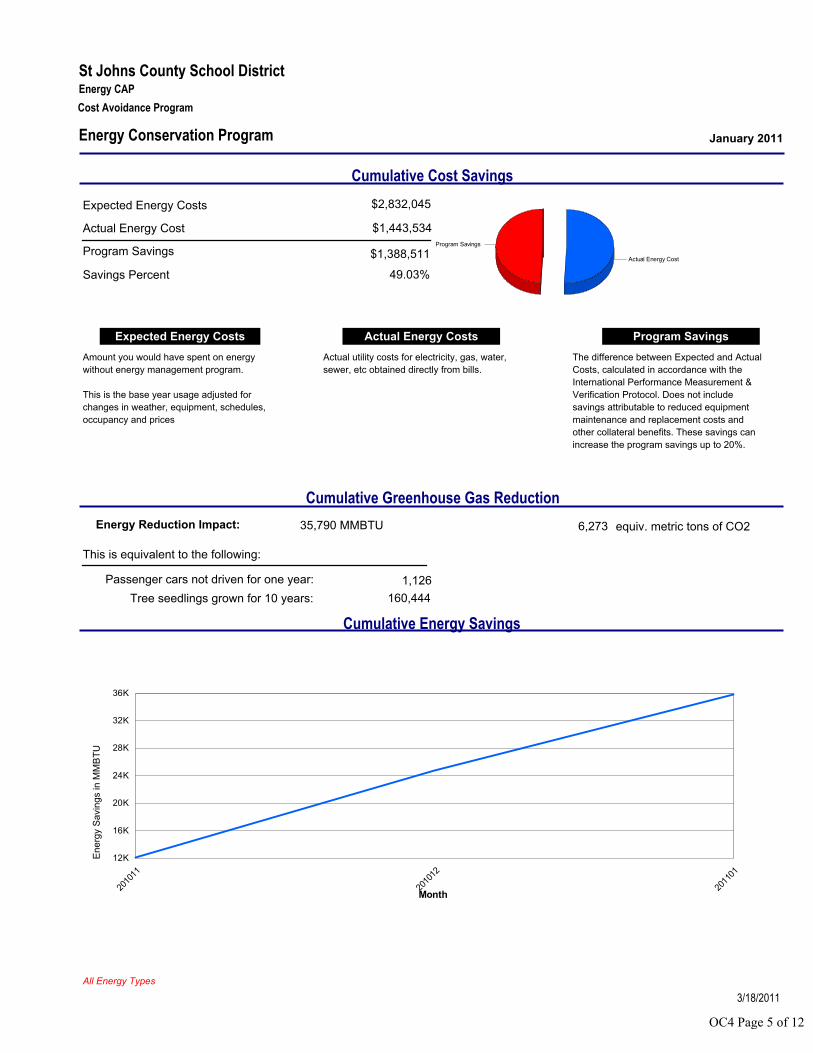
Energy Conservation Program
St Johns County School DistrictEnergy CAP
Cost Avoidance Program
January 2011
Cumulative Cost Savings
Expected Energy Costs
Actual Energy Cost
Program Savings
$2,832,045
$1,443,534
$1,388,511Actual Energy Cost
Program Savings
Expected Energy Costs Actual Energy Costs Program Savings
Amount you would have spent on energy
without energy management program.
This is the base year usage adjusted for
changes in weather, equipment, schedules,
occupancy and prices
Actual utility costs for electricity, gas, water,
sewer, etc obtained directly from bills.
The difference between Expected and Actual
Costs, calculated in accordance with the
International Performance Measurement &
Verification Protocol. Does not include
savings attributable to reduced equipment
maintenance and replacement costs and
other collateral benefits. These savings can
increase the program savings up to 20%.
49.03%Savings Percent
Cumulative Greenhouse Gas Reduction
1,126
160,444
Energy Reduction Impact: 35,790 MMBTU
This is equivalent to the following:
Passenger cars not driven for one year:
Tree seedlings grown for 10 years:
6,273 equiv. metric tons of CO2
Cumulative Energy Savings
12K
16K
20K
24K
28K
32K
36K
2010
11
2010
12
2011
01
Month
En
erg
y S
avi
ng
s in
MM
BT
U
All Energy Types
3/18/2011
OC4 Page 5 of 12
Overall Program Summary
St Johns County School DistrictEnergy CAP
Cost Avoidance Program
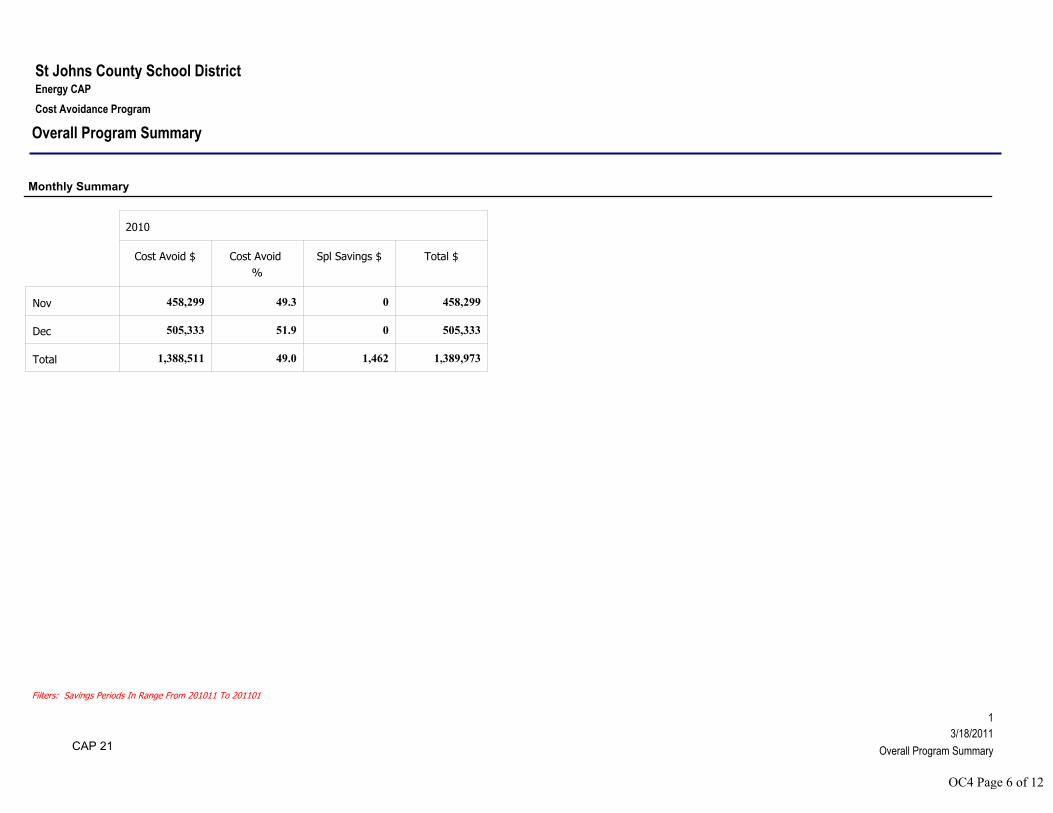
2010
Cost Avoid $ Cost Avoid
%
Spl Savings $ Total $
Nov 458,299 49.3 0 458,299
Dec 505,333 51.9 0 505,333
Total 1,388,511 49.0 1,462 1,389,973
Monthly Summary
Filters: Savings Periods In Range From 201011 To 201101
3/18/2011
Overall Program Summary
1
CAP 21
OC4 Page 6 of 12
Overall Program Summary
St Johns County School DistrictEnergy CAP
Cost Avoidance Program
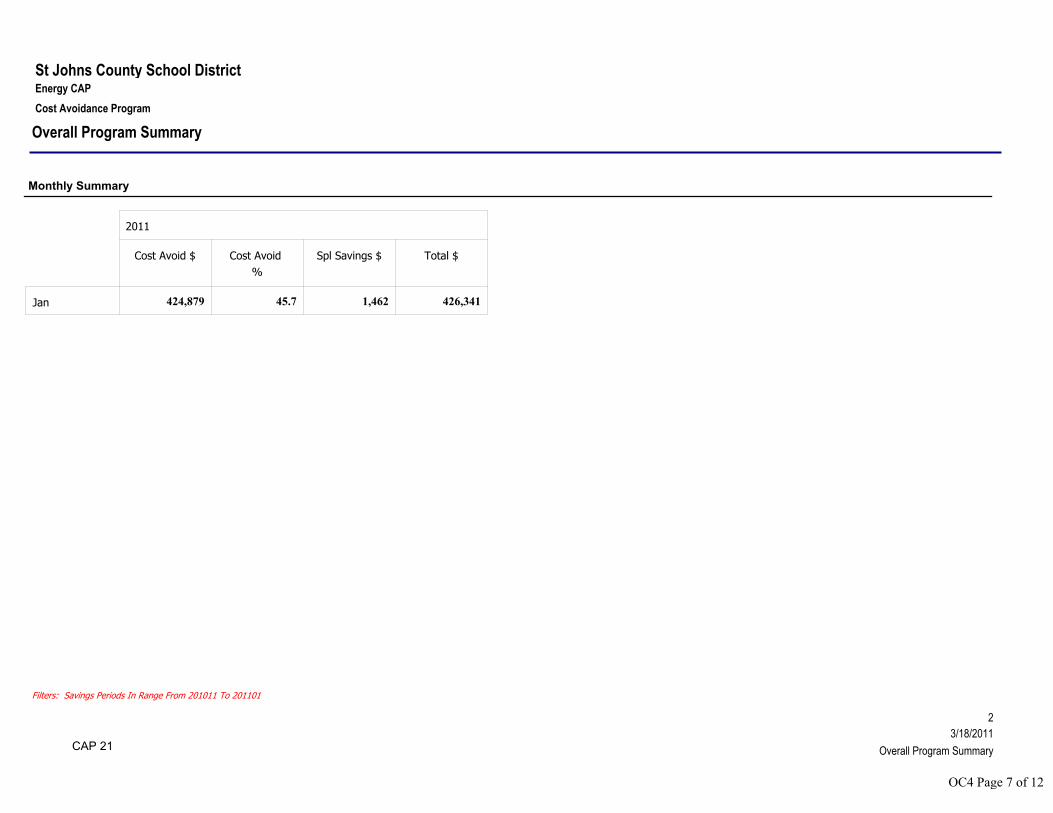
2011
Cost Avoid $ Cost Avoid
%
Spl Savings $ Total $
Jan 424,879 45.7 1,462 426,341
Monthly Summary
Filters: Savings Periods In Range From 201011 To 201101
3/18/2011
Overall Program Summary
2
CAP 21
OC4 Page 7 of 12

Overall Program Summary
St Johns County School DistrictEnergy CAP
Cost Avoidance Program
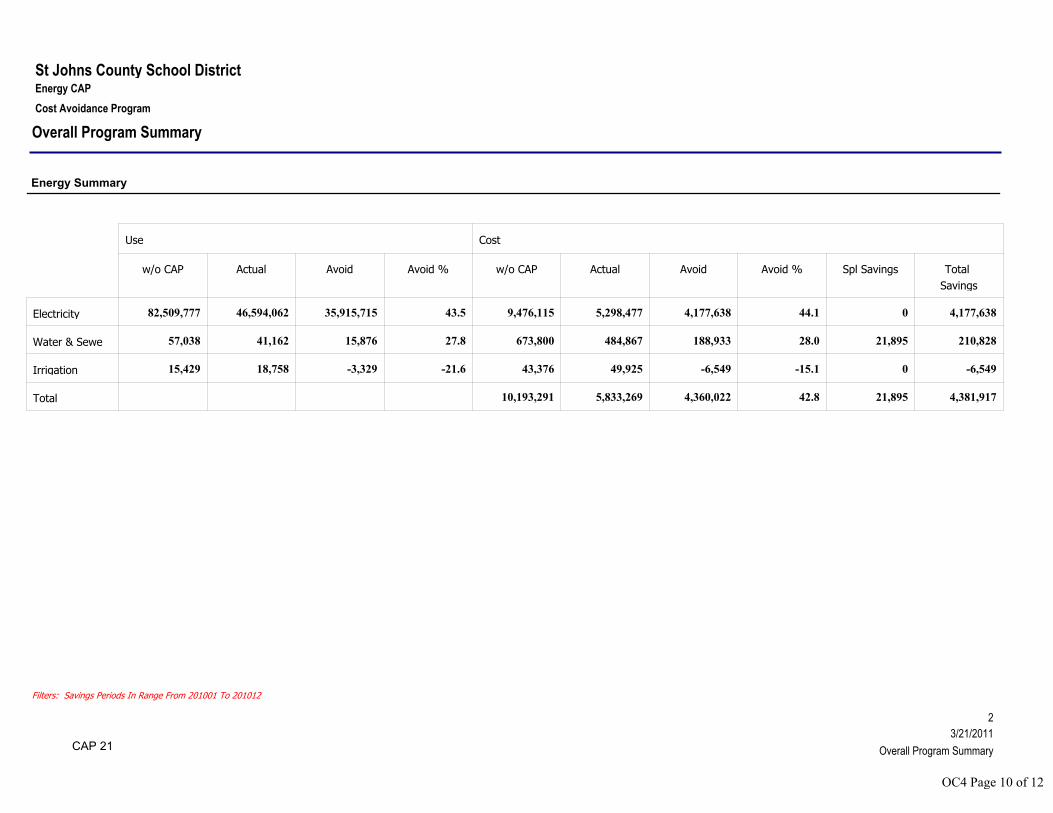
Energy Summary
Use Cost
w/o CAP Actual Avoid Avoid % w/o CAP Actual Avoid Avoid % Spl Savings Total
Savings
Electricity 21,137,786 10,651,550 10,486,236 49.6 2,643,046 1,314,056 1,328,990 50.3 1,462 1,330,452
Water & Sewe 13,900 9,496 4,404 31.7 180,729 122,745 57,984 32.1 0 57,984
Irrigation 2,819 2,544 275 9.8 8,270 6,733 1,537 18.6 0 1,537
Total 2,832,045 1,443,534 1,388,511 49.0 1,462 1,389,973
Filters: Savings Periods In Range From 201011 To 201101
3/21/2011
Overall Program Summary
3
CAP 21
OC4 Page 8 of 12
Overall Program Summary
St Johns County School DistrictEnergy CAP
Cost Avoidance Program
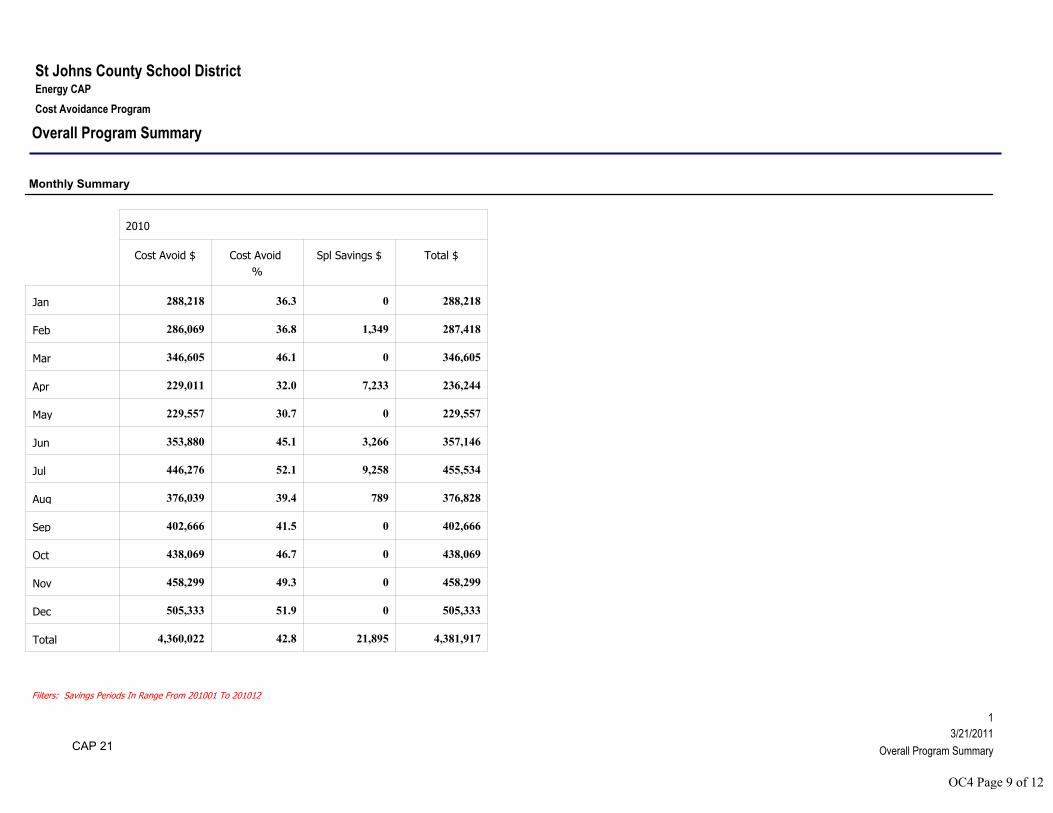
2010
Cost Avoid $ Cost Avoid
%
Spl Savings $ Total $
Jan 288,218 36.3 0 288,218
Feb 286,069 36.8 1,349 287,418
Mar 346,605 46.1 0 346,605
Apr 229,011 32.0 7,233 236,244
May 229,557 30.7 0 229,557
Jun 353,880 45.1 3,266 357,146
Jul 446,276 52.1 9,258 455,534
Aug 376,039 39.4 789 376,828
Sep 402,666 41.5 0 402,666
Oct 438,069 46.7 0 438,069
Nov 458,299 49.3 0 458,299
Dec 505,333 51.9 0 505,333
Total 4,360,022 42.8 21,895 4,381,917
Monthly Summary
Filters: Savings Periods In Range From 201001 To 201012
3/21/2011
Overall Program Summary
1
CAP 21
OC4 Page 9 of 12
Overall Program Summary
St Johns County School DistrictEnergy CAP
Cost Avoidance Program
Energy Summary
Use Cost
w/o CAP Actual Avoid Avoid % w/o CAP Actual Avoid Avoid % Spl Savings Total
Savings
Electricity 82,509,777 46,594,062 35,915,715 43.5 9,476,115 5,298,477 4,177,638 44.1 0 4,177,638
Water & Sewe 57,038 41,162 15,876 27.8 673,800 484,867 188,933 28.0 21,895 210,828
Irrigation 15,429 18,758 -3,329 -21.6 43,376 49,925 -6,549 -15.1 0 -6,549
Total 10,193,291 5,833,269 4,360,022 42.8 21,895 4,381,917
Filters: Savings Periods In Range From 201001 To 201012
3/21/2011
Overall Program Summary
2
CAP 21
OC4 Page 10 of 12
St Johns County School DistrictEnergy CAP
Cost Avoidance Program
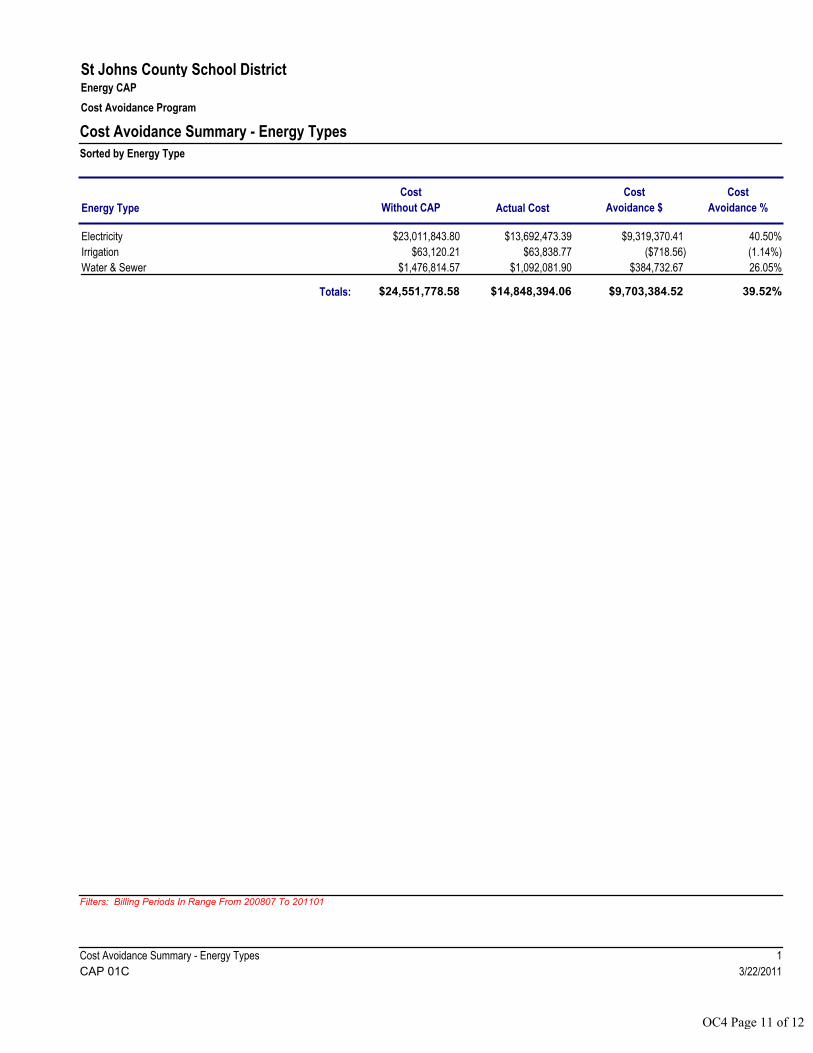
Cost Avoidance Summary - Energy TypesSorted by Energy Type
Energy Type
Cost
Avoidance %Actual Cost
Cost
Without CAP
Cost
Avoidance $
$13,692,473.39 $23,011,843.80 $9,319,370.41 40.50%Electricity
$63,838.77 $63,120.21 ($718.56) (1.14%)Irrigation
$1,092,081.90 $1,476,814.57 $384,732.67 26.05%Water & Sewer
Totals: $24,551,778.58 $14,848,394.06 39.52%$9,703,384.52
Filters: Billing Periods In Range From 200807 To 201101
1
3/22/2011
Cost Avoidance Summary - Energy Types
CAP 01C
OC4 Page 11 of 12
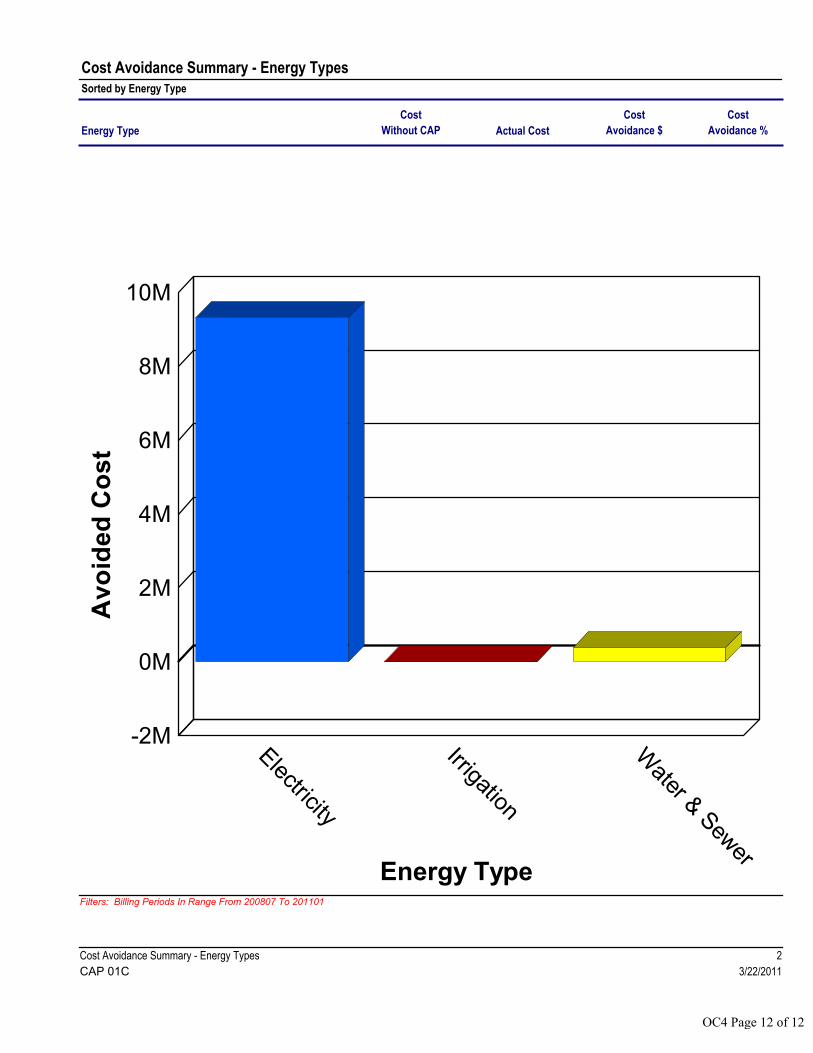
Cost Avoidance Summary - Energy TypesSorted by Energy Type
Energy Type
Cost
Avoidance %Actual Cost
Cost
Without CAP
Cost
Avoidance $
-2M
0M
2M
4M
6M
8M
10M
Electricity
Irrigation
Water & Sew
erEnergy Type
Av
oid
ed
Co
st
Filters: Billing Periods In Range From 200807 To 201101
2
3/22/2011
Cost Avoidance Summary - Energy Types
CAP 01C
OC4 Page 12 of 12