occupational atlanta, georgia, compensation survey .... department of labor bureau of labor...
TRANSCRIPT

Occupational Atlanta, Georgia,Compensation Survey: Metropolitan Area,Pay Only May 1995________________________________________________________________________________________________________________________________________________________________
U.S. Department of LaborBureau of Labor Statistics
Bulletin 3080-28

________________________________________________________________
Preface
This bulletin provides results of a May 1995 survey of occupational payin the Atlanta, GA Metropolitan Statistical Area. This survey wasconducted as part of the U.S. Bureau of Labor Statistics OccupationalCompensation Survey Program. Data from this program are for use inimplementing the Federal Employees Pay Comparability Act of 1990. Thesurvey was conducted by the Bureau's regional office in Atlanta, underdirection of Dianne R. Farrior, Assistant Regional Commissioner forOperations.
The survey could not have been conducted without the cooperation of themany private firms and government jurisdictions that provided pay dataincluded in this bulletin. The Bureau thanks these respondents for theircooperation.
For additional information regarding this survey or similar surveysconducted in this regional area, please contact the BLS Atlanta RegionalOffice at (404) 347-4416. You may also write to the Bureau of LaborStatistics at: Division of Occupational Pay and Employee Benefits, 2Massachusetts Avenue, NE, Washington, D.C. 20212-0001 or call theOccupational Compensation Survey Program information line at (202)606-6220.
Material in this bulletin is in the public domain and, with appropriatecredit, may be reproduced without permission. This information will bemade available to sensory impaired individuals upon request. Voicephone: (202) 606-STAT; TDD phone: (202) 606-5897; TDD messagereferral phone: 1-800-326-2577.
For sale by the Superintendent of Documents, U.S. Government
Printing Office, Washington, DC 20402, GPO bookstores, and the
Bureau of Labor Statistics, Publications Sales Center, P.O. Box 2145,
Chicago, IL 60690-2145.
For an account of a similar survey conducted in 1994, see
Occupational Compensation Survey: Pay Only, Atlanta, GA, BLS
Bulletin 3075-40.

Occupational Atlanta, Georgia,Compensation Survey: Metropolitan Area,Pay Only May 1995____________________________________________________________________________________________________________________________________________________________________
Contents
Page
Introduction .............................................................................................................. 2
Tables:
All establishments:
A-1. Weekly hours and pay of professional and administrative
occupations ................................................................................ 3
A-2. Weekly hours and pay of technical and protective service
occupations ................................................................................ 9
A-3. Weekly hours and pay of clerical occupations .............................. 11
A-4. Hourly pay of maintenance and toolroom occupations .................. 14
A-5. Hourly pay of material movement and custodial occupations ....... 16
Establishments employing 500 workers or more:
A-6. Weekly hours and pay of professional and administrative
occupations ................................................................................ 18
Page
Tables—Continued
A-7. Weekly hours and pay of technical and protective service
occupations ................................................................................ 23
A-8. Weekly hours and pay of clerical occupations ............................... 25
A-9. Hourly pay of maintenance and toolroom occupations ................. 28
A-10. Hourly pay of material movement and custodial occupations......... 30
Appendixes:
A. Scope and method of survey ......................................................... A-1
B. Occupational descriptions .............................................................. B-1
U.S. Department of LaborRobert B. Reich, Secretary
Bureau of Labor StatisticsKatharine G. Abraham,Commissioner
December 1995
Bulletin 3080-28

2
This survey of occupational pay in the Atlanta, GA Metropolitan Statistical Area(Barrow, Butts, Cherokee, Clayton, Cobb, Coweta, Dekalb, Douglas, Fayette,Forsyth, Fulton, Gwinnett, Henry, Newton, Paulding, Rockdale, Spalding, andWalton Counties) was conducted as part of the U.S. Bureau of Labor StatisticsOccupational Compensation Survey Program. The survey is one of a number ofmetropolitan areas surveyed annually throughout the United States. (See listing ofreports for other surveys at the end of this bulletin.)
A major objective of the Occupational Compensation Survey Program is todescribe the level and distribution of occupational pay in a variety of the Nation'slocal labor markets, using a consistent survey approach. Another Programobjective is to provide information on the incidence of employee benefits amongand within local labor markets. However, no benefits data were collected for thissurvey.
The Program develops information that is used for a variety of purposes,including wage and salary administration, collective bargaining, and assistance indetermining business or plant location. Survey results also are used by the U.S.Department of Labor in making wage determinations under the Service ContractAct, and by the President's Pay Agent (the Secretary of Labor and Directors of theU.S. Office of Personnel Management and the U.S. Office of Management andBudget) in determining local pay adjustments under the Federal Employee PayComparability Act of 1990. This latter requirement resulted in: (1) Expanding thesurvey's industrial coverage to include all private nonfarm establishments (excepthouseholds) employing 50 workers or more and to State and local governments and
(2) adding more professional, administrative, technical, and protective serviceoccupations to the surveys.
PayThe A-series tables provide estimates of straight-time weekly or hourly pay by
occupation. Tables A-1 through A-5 provide data for selected white- and blue-collar occupations common to a variety of industries. Tables A-6 through A-10include similar information, but are limited to establishments employing 500workers or more. Separate occupational pay data were collected for the healthservices industry, however, these data did not meet publication criteria.
Occupational pay information is presented for all industries covered by the surveyand, where possible, for private industry (e.g., for goods- and service-producingindustries) and for State and local governments. Within private industry, moredetailed information is presented to the extent that the survey establishment samplecan support such detail.
AppendixesAppendix A describes the concepts, methods, and coverage used in the
Occupational Compensation Survey Program. It also includes information on thearea's industrial composition and the reliability of occupational pay estimates.
Appendix B includes the descriptions used by Bureau field economists to classifyworkers in the survey occupations.
Introduction

Table A-1. All establishments: Weekly hours and pay of professional and administrative occupations, Atlanta, GA, May 1995
Occupation and levelNumber
ofworkers
Averageweeklyhours1
(stan-dard)
Weekly pay (in dollars)2 Percent of workers receiving straight-time weekly pay (in dollars) of—
Mean Median Middle range
350and
under400
400-
500
500-
600
600-
700
700-
800
800-
900
900-
1000
1000-
1100
1100-
1200
1200-
1300
1300-
1400
1400-
1500
1500-
1600
1600-
1700
1700-
1800
1800-
1900
1900-
2000
2000-
2100
2100-
2200
2200andover
PROFESSIONAL OCCUPATIONS
AccountantsLevel I ....................................................... 347 39.7 $490 $481 $440 – $529 1 60 34 4 3(� ) – – – – – – – – – – – – – – –
Private industry ..................................... 296 39.7 491 481 439 – 535 1 59 34 5 3(� ) – – – – – – – – – – – – – – –Service-producing industries ............ 271 39.8 488 480 438 – 529 1 59 36 3 3(� ) – – – – – – – – – – – – – – –
State and local government .................. 51 39.9 483 484 445 – 515 – 67 33 – – – – – – – – – – – – – – – – –
Level II ...................................................... 993 39.8 604 596 536 – 659 – 11 41 31 14 2 – 3(� ) – – – – – – – – – – – –Private industry ..................................... 805 39.8 602 587 536 – 652 – 12 42 30 13 2 – 3(� ) – – – – – – – – – – – –
Service-producing industries ............ 642 39.8 594 577 530 – 635 – 11 45 31 9 2 – 3(� ) – – – – – – – – – – – –Transportation and utilities ........... 125 40.0 582 558 500 – 627 – 22 49 11 16 2 – – – – – – – – – – – – – –
State and local government .................. 188 39.9 610 608 542 – 663 – 7 40 37 16 – – – – – – – – – – – – – – –
Level III ..................................................... 1,159 39.8 772 755 692 – 846 – – 6 21 36 24 10 3 1 – – – – – – – – – – –Private industry ..................................... 1,009 39.8 776 755 699 – 848 – – 5 20 37 23 11 3 1 – – – – – – – – – – –
Goods-producing industries .............. 211 39.5 832 808 755 – 912 – – 3(� ) 11 34 22 25 7 – – – – – – – – – – – –Manufacturing ............................... 194 39.5 829 803 755 – 913 – – – 12 37 22 22 7 – – – – – – – – – – – –
Service-producing industries ............ 798 39.9 760 731 692 – 834 – – 7 22 37 24 7 2 2 – – – – – – – – – – –Transportation and utilities ........... 152 40.0 760 721 686 – 809 – – 7 26 38 14 7 3 4 – – – – – – – – – – –
State and local government .................. 150 39.8 749 754 664 – 824 – – 9 29 29 27 5 1 – – – – – – – – – – – –
Level IV ..................................................... 587 39.7 1,003 1,003 893 – 1,100 – – 3(� ) 2 7 15 21 29 14 7 3 1 – – – – – – – –Private industry ..................................... 535 39.7 1,009 1,010 913 – 1,108 – – 3(� ) 2 7 15 21 30 14 8 4 1 – – – – – – – –
Goods-producing industries .............. 154 39.4 996 1,000 904 – 1,099 – – – 3 8 13 25 26 16 6 1 1 – – – – – – – –Manufacturing ............................... 144 39.3 993 979 887 – 1,108 – – – 3 9 14 26 22 17 6 1 1 – – – – – – – –
Service-producing industries ............ 381 39.9 1,015 1,020 913 – 1,124 – – 3(� ) 1 6 15 20 31 13 8 4 3(� ) – – – – – – – –Transportation and utilities ........... 108 40.0 971 893 806 – 1,171 – – 1 2 19 30 6 8 18 13 3 1 – – – – – – – –
State and local government .................. 52 39.9 937 947 820 – 1,075 – – – 6 15 23 17 23 13 2 – – – – – – – – – –
Level V ...................................................... 160 39.7 1,266 1,246 1,101 – 1,378 – – – – 1 6 11 8 11 29 13 14 2 – – – 7 – – –Private industry ..................................... 142 39.6 1,304 1,254 1,177 – 1,402 – – – – – 5 4 8 12 31 14 15 3 – – – 8 – – –
Service-producing industries ............ 124 39.6 1,309 1,250 1,156 – 1,436 – – – – – 6 5 8 11 31 11 16 3 – – – 9 – – –Transportation and utilities ........... 42 40.0 1,186 1,225 1,058 – 1,269 – – – – – 5 10 17 17 33 10 7 2 – – – – – – –
State and local government .................. 18 40.0 973 964 932 – 992 – – – – 6 11 61 11 – 11 – – – – – – – – – –
AttorneysLevel II ...................................................... 232 39.4 1,046 1,019 962 – 1,185 – – – – 7 8 19 33 18 10 5 – – – – – – – – –
State and local government .................. 55 40.0 867 854 789 – 946 – – – – 31 33 31 4 2 – – – – – – – – – – –
Level III ..................................................... 217 39.1 1,390 1,417 1,306 – 1,486 – – – – 3(� ) – 6 4 4 11 18 35 12 2 2 6 – – – –Private industry ..................................... 178 39.0 1,440 1,448 1,352 – 1,490 – – – – – – 2 1 3 10 17 43 13 2 2 7 – – – –
Service-producing industries ............ 161 39.2 1,427 1,448 1,346 – 1,486 – – – – – – 2 1 3 11 17 45 12 – 1 7 – – – –Transportation and utilities ........... 48 39.4 1,363 1,314 1,267 – 1,474 – – – – – – – 2 10 25 27 19 13 – 4 – – – – –
State and local government .................. 39 39.6 1,164 – – – – – – – – 3 – 28 15 8 13 21 3 8 3 – – – – – –
See footnotes at end of table.
3
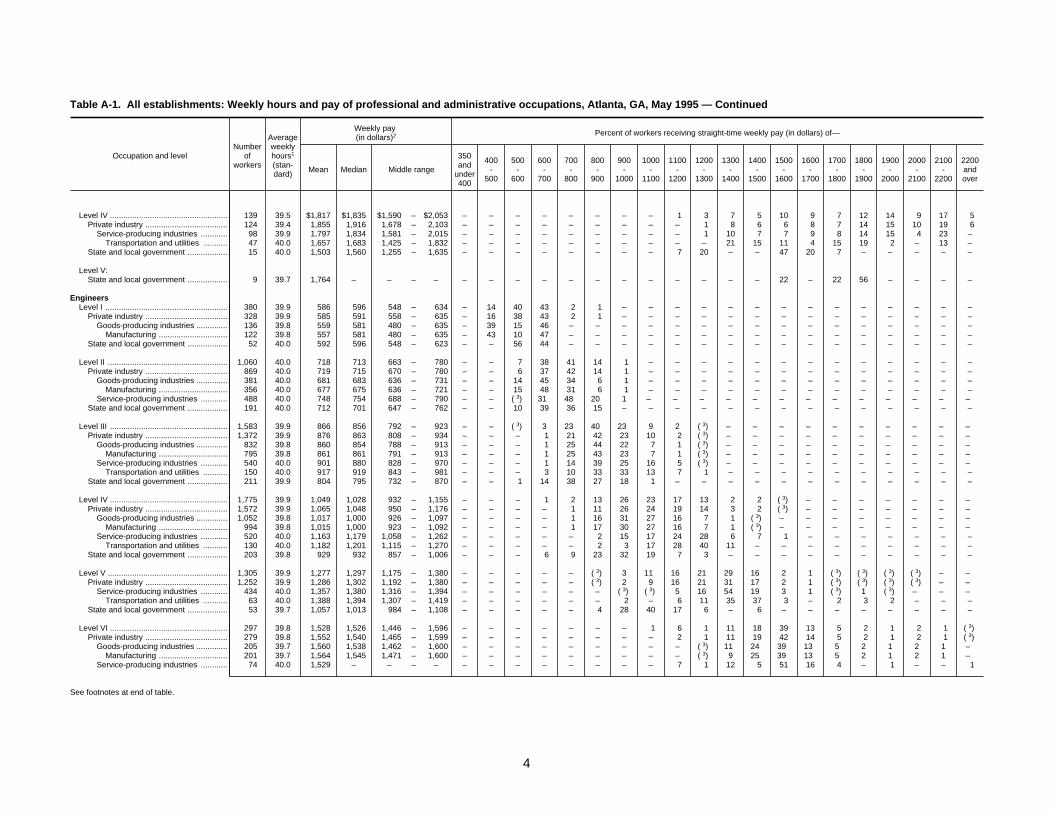
Table A-1. All establishments: Weekly hours and pay of professional and administrative occupations, Atlanta, GA, May 1995 — Continued
Occupation and levelNumber
ofworkers
Averageweeklyhours1
(stan-dard)
Weekly pay (in dollars)2 Percent of workers receiving straight-time weekly pay (in dollars) of—
Mean Median Middle range
350and
under400
400-
500
500-
600
600-
700
700-
800
800-
900
900-
1000
1000-
1100
1100-
1200
1200-
1300
1300-
1400
1400-
1500
1500-
1600
1600-
1700
1700-
1800
1800-
1900
1900-
2000
2000-
2100
2100-
2200
2200andover
Level IV ..................................................... 139 39.5 $1,817 $1,835 $1,590 – $2,053 – – – – – – – – 1 3 7 5 10 9 7 12 14 9 17 5Private industry ..................................... 124 39.4 1,855 1,916 1,678 – 2,103 – – – – – – – – – 1 8 6 6 8 7 14 15 10 19 6
Service-producing industries ............ 98 39.9 1,797 1,834 1,581 – 2,015 – – – – – – – – – 1 10 7 7 9 8 14 15 4 23 –Transportation and utilities ........... 47 40.0 1,657 1,683 1,425 – 1,832 – – – – – – – – – – 21 15 11 4 15 19 2 – 13 –
State and local government .................. 15 40.0 1,503 1,560 1,255 – 1,635 – – – – – – – – 7 20 – – 47 20 7 – – – – –
Level V:State and local government .................. 9 39.7 1,764 – – – – – – – – – – – – – – – – 22 – 22 56 – – – –
EngineersLevel I ....................................................... 380 39.9 586 596 548 – 634 – 14 40 43 2 1 – – – – – – – – – – – – – –
Private industry ..................................... 328 39.9 585 591 558 – 635 – 16 38 43 2 1 – – – – – – – – – – – – – –Goods-producing industries .............. 136 39.8 559 581 480 – 635 – 39 15 46 – – – – – – – – – – – – – – – –
Manufacturing ............................... 122 39.8 557 581 480 – 635 – 43 10 47 – – – – – – – – – – – – – – – –State and local government .................. 52 40.0 592 596 548 – 623 – – 56 44 – – – – – – – – – – – – – – – –
Level II ...................................................... 1,060 40.0 718 713 663 – 780 – – 7 38 41 14 1 – – – – – – – – – – – – –Private industry ..................................... 869 40.0 719 715 670 – 780 – – 6 37 42 14 1 – – – – – – – – – – – – –
Goods-producing industries .............. 381 40.0 681 683 636 – 731 – – 14 45 34 6 1 – – – – – – – – – – – – –Manufacturing ............................... 356 40.0 677 675 636 – 721 – – 15 48 31 6 1 – – – – – – – – – – – – –
Service-producing industries ............ 488 40.0 748 754 688 – 790 – – 3(� ) 31 48 20 1 – – – – – – – – – – – – –State and local government .................. 191 40.0 712 701 647 – 762 – – 10 39 36 15 – – – – – – – – – – – – – –
Level III ..................................................... 1,583 39.9 866 856 792 – 923 – – 3(� ) 3 23 40 23 9 2 3(� ) – – – – – – – – – –Private industry ..................................... 1,372 39.9 876 863 808 – 934 – – – 1 21 42 23 10 2 3(� ) – – – – – – – – – –
Goods-producing industries .............. 832 39.8 860 854 788 – 913 – – – 1 25 44 22 7 1 3(� ) – – – – – – – – – –Manufacturing ............................... 795 39.8 861 861 791 – 913 – – – 1 25 43 23 7 1 3(� ) – – – – – – – – – –
Service-producing industries ............ 540 40.0 901 880 828 – 970 – – – 1 14 39 25 16 5 3(� ) – – – – – – – – – –Transportation and utilities ........... 150 40.0 917 919 843 – 981 – – – 3 10 33 33 13 7 1 – – – – – – – – – –
State and local government .................. 211 39.9 804 795 732 – 870 – – 1 14 38 27 18 1 – – – – – – – – – – – –
Level IV ..................................................... 1,775 39.9 1,049 1,028 932 – 1,155 – – – 1 2 13 26 23 17 13 2 2 3(� ) – – – – – – –Private industry ..................................... 1,572 39.9 1,065 1,048 950 – 1,176 – – – – 1 11 26 24 19 14 3 2 3(� ) – – – – – – –
Goods-producing industries .............. 1,052 39.8 1,017 1,000 926 – 1,097 – – – – 1 16 31 27 16 7 1 3(� ) – – – – – – – –Manufacturing ............................... 994 39.8 1,015 1,000 923 – 1,092 – – – – 1 17 30 27 16 7 1 3(� ) – – – – – – – –
Service-producing industries ............ 520 40.0 1,163 1,179 1,058 – 1,262 – – – – – 2 15 17 24 28 6 7 1 – – – – – – –Transportation and utilities ........... 130 40.0 1,182 1,201 1,115 – 1,270 – – – – – 2 3 17 28 40 11 – – – – – – – – –
State and local government .................. 203 39.8 929 932 857 – 1,006 – – – 6 9 23 32 19 7 3 – – – – – – – – – –
Level V ...................................................... 1,305 39.9 1,277 1,297 1,175 – 1,380 – – – – – 3(� ) 3 11 16 21 29 16 2 1 3(� ) 3(� ) 3(� ) 3(� ) – –Private industry ..................................... 1,252 39.9 1,286 1,302 1,192 – 1,380 – – – – – 3(� ) 2 9 16 21 31 17 2 1 3(� ) 3(� ) 3(� ) 3(� ) – –
Service-producing industries ............ 434 40.0 1,357 1,380 1,316 – 1,394 – – – – – – 3(� ) 3(� ) 5 16 54 19 3 1 3(� ) 1 3(� ) – – –Transportation and utilities ........... 63 40.0 1,388 1,394 1,307 – 1,419 – – – – – – 2 – 6 11 35 37 3 – 2 3 2 – – –
State and local government .................. 53 39.7 1,057 1,013 984 – 1,108 – – – – – 4 28 40 17 6 – 6 – – – – – – – –
Level VI ..................................................... 297 39.8 1,528 1,526 1,446 – 1,596 – – – – – – – 1 6 1 11 18 39 13 5 2 1 2 1 3(� )Private industry ..................................... 279 39.8 1,552 1,540 1,465 – 1,599 – – – – – – – – 2 1 11 19 42 14 5 2 1 2 1 3(� )
Goods-producing industries .............. 205 39.7 1,560 1,538 1,462 – 1,600 – – – – – – – – – 3(� ) 11 24 39 13 5 2 1 2 1 –Manufacturing ............................... 201 39.7 1,564 1,545 1,471 – 1,600 – – – – – – – – – 3(� ) 9 25 39 13 5 2 1 2 1 –
Service-producing industries ............ 74 40.0 1,529 – – – – – – – – – – – – 7 1 12 5 51 16 4 – 1 – – 1
See footnotes at end of table.
4

Table A-1. All establishments: Weekly hours and pay of professional and administrative occupations, Atlanta, GA, May 1995 — Continued
Occupation and levelNumber
ofworkers
Averageweeklyhours1
(stan-dard)
Weekly pay (in dollars)2 Percent of workers receiving straight-time weekly pay (in dollars) of—
Mean Median Middle range
350and
under400
400-
500
500-
600
600-
700
700-
800
800-
900
900-
1000
1000-
1100
1100-
1200
1200-
1300
1300-
1400
1400-
1500
1500-
1600
1600-
1700
1700-
1800
1800-
1900
1900-
2000
2000-
2100
2100-
2200
2200andover
Registered NursesLevel I ....................................................... 208 39.7 $530 $532 $509 – $545 – 9 88 2 3(� ) – – – – – – – – – – – – – – –
Private industry ..................................... 208 39.7 530 532 509 – 545 – 9 88 2 3(� ) – – – – – – – – – – – – – – –Service-producing industries ............ 208 39.7 530 532 509 – 545 – 9 88 2 3(� ) – – – – – – – – – – – – – – –
Level II ...................................................... 8,327 39.9 673 667 592 – 744 – 3(� ) 26 35 28 8 1 3(� ) – – – – – – – – – – – –Private industry ..................................... 6,443 39.9 691 686 620 – 759 – 3(� ) 19 35 34 11 1 3(� ) – – – – – – – – – – – –
Service-producing industries ............ 6,425 39.9 691 686 620 – 759 – 3(� ) 19 35 34 11 1 3(� ) – – – – – – – – – – – –State and local government .................. 1,884 40.0 610 592 560 – 651 – 1 52 35 10 1 3(� ) – – – – – – – – – – – – –
Level III ..................................................... 640 40.0 817 795 719 – 906 – – – 14 36 24 18 7 1 – – – – – – – – – – –Private industry ..................................... 278 40.0 902 920 826 – 958 – – – 4 14 25 38 17 2 – – – – – – – – – – –
Service-producing industries ............ 278 40.0 902 920 826 – 958 – – – 4 14 25 38 17 2 – – – – – – – – – – –
ADMINISTRATIVE OCCUPATIONS
Budget AnalystsLevel I:
State and local government .................. 28 40.0 530 523 490 – 562 – 36 57 4 4 – – – – – – – – – – – – – – –
Level II ...................................................... 74 39.8 615 – – – – – 14 30 50 5 – – – 1 – – – – – – – – – – –State and local government .................. 64 40.0 598 602 535 – 659 – 16 34 45 5 – – – – – – – – – – – – – – –
Level III ..................................................... 70 39.3 803 – – – – – – 3 17 29 34 9 9 – – – – – – – – – – – –State and local government .................. 39 40.0 745 – – – – – – 5 26 38 31 – – – – – – – – – – – – – –
Level IV:State and local government .................. 33 40.0 873 – – – – – – – 6 6 52 27 9 – – – – – – – – – – – –
Buyers/Contracting SpecialistsLevel I ....................................................... 118 39.9 491 481 476 – 505 – 74 20 6 – – – – – – – – – – – – – – – –
Private industry ..................................... 104 39.9 493 481 476 – 502 – 75 18 7 – – – – – – – – – – – – – – – –Service-producing industries ............ 50 40.0 474 – – – – – 86 14 – – – – – – – – – – – – – – – – –
State and local government .................. 14 39.8 471 – – – – – 64 36 – – – – – – – – – – – – – – – – –
Level II ...................................................... 315 39.9 620 613 556 – 690 – 13 33 35 13 4 2 – – – – – – – – – – – – –Private industry ..................................... 253 39.9 623 617 556 – 690 – 15 28 36 15 4 2 – – – – – – – – – – – – –
Service-producing industries ............ 102 40.0 658 673 590 – 690 – 8 21 48 16 5 3 – – – – – – – – – – – – –State and local government .................. 62 39.9 605 581 535 – 677 – 3 55 32 6 3 – – – – – – – – – – – – – –
Level III ..................................................... 319 39.8 858 847 760 – 945 – – 2 9 23 30 17 16 3 – – – – – – – – – – –Private industry ..................................... 286 39.9 868 856 774 – 956 – – 2 7 21 31 17 18 3 – – – – – – – – – – –
Goods-producing industries .............. 215 39.9 874 870 785 – 951 – – 3(� ) 6 21 33 20 18 1 – – – – – – – – – – –Manufacturing ............................... 214 39.9 873 870 785 – 951 – – 3(� ) 6 21 33 21 18 1 – – – – – – – – – – –
Service-producing industries ............ 71 40.0 851 – – – – – – 7 10 23 27 8 18 7 – – – – – – – – – – –Transportation and utilities ........... 51 40.0 897 849 800 – 1,058 – – 8 – 16 31 10 25 10 – – – – – – – – – – –
State and local government .................. 33 38.6 767 – – – – – – – 30 39 18 12 – – – – – – – – – – – – –
Level IV ..................................................... 86 39.7 986 976 902 – 1,053 – – – – 5 20 36 22 9 5 1 1 1 – – – – – – –Private industry ..................................... 83 39.7 989 977 902 – 1,058 – – – – 5 19 35 23 10 5 1 1 1 – – – – – – –
Goods-producing industries .............. 75 39.7 993 – – – – – – – – 1 20 37 25 8 4 1 1 1 – – – – – – –Manufacturing ............................... 75 39.7 993 – – – – – – – – 1 20 37 25 8 4 1 1 1 – – – – – – –
See footnotes at end of table.
5

Table A-1. All establishments: Weekly hours and pay of professional and administrative occupations, Atlanta, GA, May 1995 — Continued
Occupation and levelNumber
ofworkers
Averageweeklyhours1
(stan-dard)
Weekly pay (in dollars)2 Percent of workers receiving straight-time weekly pay (in dollars) of—
Mean Median Middle range
350and
under400
400-
500
500-
600
600-
700
700-
800
800-
900
900-
1000
1000-
1100
1100-
1200
1200-
1300
1300-
1400
1400-
1500
1500-
1600
1600-
1700
1700-
1800
1800-
1900
1900-
2000
2000-
2100
2100-
2200
2200andover
Computer ProgrammersLevel I ....................................................... 92 38.9 $589 $610 $511 – $642 1 22 26 40 8 3 – – – – – – – – – – – – – –
Private industry ..................................... 86 38.8 596 615 516 – 642 – 22 23 43 8 3 – – – – – – – – – – – – – –Service-producing industries ............ 86 38.8 596 615 516 – 642 – 22 23 43 8 3 – – – – – – – – – – – – – –
Level II ...................................................... 634 39.7 596 577 533 – 652 – 11 44 34 8 3 – – – – – – – – – – – – – –Private industry ..................................... 549 39.7 601 585 543 – 643 – 9 44 37 7 3 – – – – – – – – – – – – – –
Service-producing industries ............ 412 39.6 594 577 533 – 651 – 11 50 28 7 4 – – – – – – – – – – – – – –State and local government .................. 85 40.0 566 531 474 – 665 – 26 41 14 19 – – – – – – – – – – – – – – –
Level III ..................................................... 743 39.8 737 734 673 – 802 – – 12 26 36 19 7 – – – – – – – – – – – – –Private industry ..................................... 680 39.8 743 745 673 – 807 – – 10 27 37 19 7 – – – – – – – – – – – – –
Service-producing industries ............ 504 39.7 718 728 673 – 792 – – 13 28 43 13 2 – – – – – – – – – – – – –State and local government .................. 63 40.0 676 668 571 – 793 – – 35 17 25 22 – – – – – – – – – – – – – –
Level IV ..................................................... 632 39.9 876 892 811 – 962 – – 1 9 13 29 35 11 2 – – – – – – – – – – –Private industry ..................................... 532 39.9 901 912 841 – 962 – – 3(� ) 4 11 31 39 13 2 – – – – – – – – – – –
Service-producing industries ............ 409 39.9 876 874 823 – 937 – – 3(� ) 5 15 38 31 10 1 – – – – – – – – – – –State and local government .................. 100 40.0 748 731 648 – 857 – – 6 40 19 19 14 2 – – – – – – – – – – – –
Computer Systems AnalystsLevel I ....................................................... 689 38.9 763 760 663 – 885 – 3(� ) 14 23 22 19 21 – – – – – – – – – – – – –
Private industry ..................................... 614 38.9 777 763 681 – 894 – – 12 22 23 20 24 – – – – – – – – – – – – –Goods-producing industries .............. 186 39.8 725 684 644 – 850 – – 19 44 5 29 3 – – – – – – – – – – – – –
Manufacturing ............................... 186 39.8 725 684 644 – 850 – – 19 44 5 29 3 – – – – – – – – – – – – –Service-producing industries ............ 428 38.4 800 785 715 – 937 – – 8 13 31 16 33 – – – – – – – – – – – – –
State and local government .................. 75 39.7 642 625 562 – 704 – 3 37 33 16 11 – – – – – – – – – – – – – –
Level II ...................................................... 2,304 38.9 922 932 833 – 1,035 – – 3(� ) 5 13 24 21 35 2 3(� ) 3(� ) – – – – – – – – –Private industry ..................................... 2,203 38.8 926 936 836 – 1,037 – – 3(� ) 5 12 24 22 35 2 3(� ) 3(� ) – – – – – – – – –
Goods-producing industries .............. 81 39.0 937 917 874 – 1,019 – – – 1 5 28 37 28 – – – – – – – – – – – –Manufacturing ............................... 81 39.0 937 917 874 – 1,019 – – – 1 5 28 37 28 – – – – – – – – – – – –
Service-producing industries ............ 2,122 38.8 925 937 833 – 1,037 – – 3(� ) 5 12 24 21 36 2 3(� ) 3(� ) – – – – – – – – –State and local government .................. 101 39.8 841 847 746 – 942 – – 5 11 19 37 11 18 – – – – – – – – – – – –
Level III ..................................................... 1,379 39.7 1,010 1,006 927 – 1,076 – – – 3(� ) 2 12 32 33 15 3 2 – – – – – – – – –Private industry ..................................... 1,321 39.7 1,017 1,013 940 – 1,080 – – – – 1 11 33 34 16 4 2 – – – – – – – – –
Service-producing industries ............ 1,215 39.8 1,009 1,002 927 – 1,067 – – – – 1 12 35 33 13 3 2 – – – – – – – – –State and local government .................. 58 39.9 840 830 786 – 896 – – – 7 31 38 14 10 – – – – – – – – – – – –
Level IV ..................................................... 452 39.9 1,207 1,210 1,124 – 1,276 – – – – – – 5 13 27 35 11 7 1 3(� ) 3(� ) – – – – –Private industry ..................................... 452 39.9 1,207 1,210 1,124 – 1,276 – – – – – – 5 13 27 35 11 7 1 3(� ) 3(� ) – – – – –
Service-producing industries ............ 440 39.9 1,202 1,209 1,122 – 1,273 – – – – – – 5 14 28 36 11 6 1 3(� ) 3(� ) – – – – –
See footnotes at end of table.
6
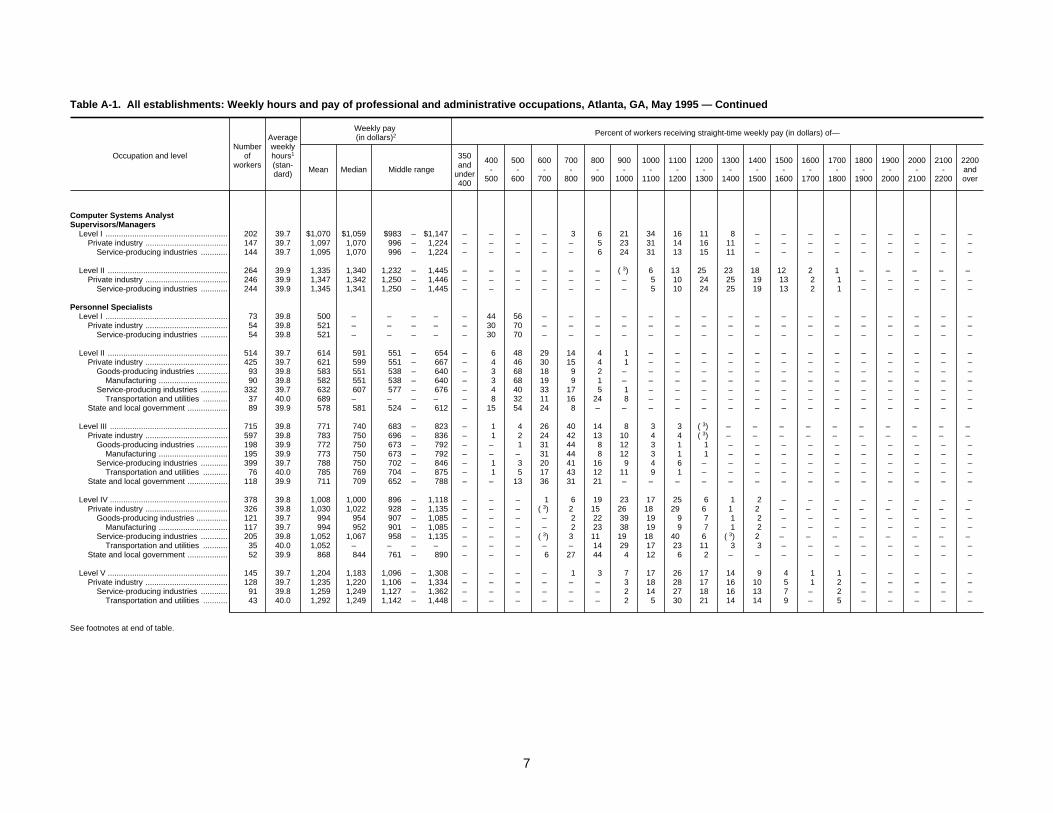
Table A-1. All establishments: Weekly hours and pay of professional and administrative occupations, Atlanta, GA, May 1995 — Continued
Occupation and levelNumber
ofworkers
Averageweeklyhours1
(stan-dard)
Weekly pay (in dollars)2 Percent of workers receiving straight-time weekly pay (in dollars) of—
Mean Median Middle range
350and
under400
400-
500
500-
600
600-
700
700-
800
800-
900
900-
1000
1000-
1100
1100-
1200
1200-
1300
1300-
1400
1400-
1500
1500-
1600
1600-
1700
1700-
1800
1800-
1900
1900-
2000
2000-
2100
2100-
2200
2200andover
Computer Systems AnalystSupervisors/Managers
Level I ....................................................... 202 39.7 $1,070 $1,059 $983 – $1,147 – – – – 3 6 21 34 16 11 8 – – – – – – – – –Private industry ..................................... 147 39.7 1,097 1,070 996 – 1,224 – – – – – 5 23 31 14 16 11 – – – – – – – – –
Service-producing industries ............ 144 39.7 1,095 1,070 996 – 1,224 – – – – – 6 24 31 13 15 11 – – – – – – – – –
Level II ...................................................... 264 39.9 1,335 1,340 1,232 – 1,445 – – – – – – 3(� ) 6 13 25 23 18 12 2 1 – – – – –Private industry ..................................... 246 39.9 1,347 1,342 1,250 – 1,446 – – – – – – – 5 10 24 25 19 13 2 1 – – – – –
Service-producing industries ............ 244 39.9 1,345 1,341 1,250 – 1,445 – – – – – – – 5 10 24 25 19 13 2 1 – – – – –
Personnel SpecialistsLevel I ....................................................... 73 39.8 500 – – – – – 44 56 – – – – – – – – – – – – – – – – –
Private industry ..................................... 54 39.8 521 – – – – – 30 70 – – – – – – – – – – – – – – – – –Service-producing industries ............ 54 39.8 521 – – – – – 30 70 – – – – – – – – – – – – – – – – –
Level II ...................................................... 514 39.7 614 591 551 – 654 – 6 48 29 14 4 1 – – – – – – – – – – – – –Private industry ..................................... 425 39.7 621 599 551 – 667 – 4 46 30 15 4 1 – – – – – – – – – – – – –
Goods-producing industries .............. 93 39.8 583 551 538 – 640 – 3 68 18 9 2 – – – – – – – – – – – – – –Manufacturing ............................... 90 39.8 582 551 538 – 640 – 3 68 19 9 1 – – – – – – – – – – – – – –
Service-producing industries ............ 332 39.7 632 607 577 – 676 – 4 40 33 17 5 1 – – – – – – – – – – – – –Transportation and utilities ........... 37 40.0 689 – – – – – 8 32 11 16 24 8 – – – – – – – – – – – – –
State and local government .................. 89 39.9 578 581 524 – 612 – 15 54 24 8 – – – – – – – – – – – – – – –
Level III ..................................................... 715 39.8 771 740 683 – 823 – 1 4 26 40 14 8 3 3 3(� ) – – – – – – – – – –Private industry ..................................... 597 39.8 783 750 696 – 836 – 1 2 24 42 13 10 4 4 3(� ) – – – – – – – – – –
Goods-producing industries .............. 198 39.9 772 750 673 – 792 – – 1 31 44 8 12 3 1 1 – – – – – – – – – –Manufacturing ............................... 195 39.9 773 750 673 – 792 – – – 31 44 8 12 3 1 1 – – – – – – – – – –
Service-producing industries ............ 399 39.7 788 750 702 – 846 – 1 3 20 41 16 9 4 6 – – – – – – – – – – –Transportation and utilities ........... 76 40.0 785 769 704 – 875 – 1 5 17 43 12 11 9 1 – – – – – – – – – – –
State and local government .................. 118 39.9 711 709 652 – 788 – – 13 36 31 21 – – – – – – – – – – – – – –
Level IV ..................................................... 378 39.8 1,008 1,000 896 – 1,118 – – – 1 6 19 23 17 25 6 1 2 – – – – – – – –Private industry ..................................... 326 39.8 1,030 1,022 928 – 1,135 – – – 3(� ) 2 15 26 18 29 6 1 2 – – – – – – – –
Goods-producing industries .............. 121 39.7 994 954 907 – 1,085 – – – – 2 22 39 19 9 7 1 2 – – – – – – – –Manufacturing ............................... 117 39.7 994 952 901 – 1,085 – – – – 2 23 38 19 9 7 1 2 – – – – – – – –
Service-producing industries ............ 205 39.8 1,052 1,067 958 – 1,135 – – – 3(� ) 3 11 19 18 40 6 3(� ) 2 – – – – – – – –Transportation and utilities ........... 35 40.0 1,052 – – – – – – – – – 14 29 17 23 11 3 3 – – – – – – – –
State and local government .................. 52 39.9 868 844 761 – 890 – – – 6 27 44 4 12 6 2 – – – – – – – – – –
Level V ...................................................... 145 39.7 1,204 1,183 1,096 – 1,308 – – – – 1 3 7 17 26 17 14 9 4 1 1 – – – – –Private industry ..................................... 128 39.7 1,235 1,220 1,106 – 1,334 – – – – – – 3 18 28 17 16 10 5 1 2 – – – – –
Service-producing industries ............ 91 39.8 1,259 1,249 1,127 – 1,362 – – – – – – 2 14 27 18 16 13 7 – 2 – – – – –Transportation and utilities ........... 43 40.0 1,292 1,249 1,142 – 1,448 – – – – – – 2 5 30 21 14 14 9 – 5 – – – – –
See footnotes at end of table.
7

Table A-1. All establishments: Weekly hours and pay of professional and administrative occupations, Atlanta, GA, May 1995 — Continued
Occupation and levelNumber
ofworkers
Averageweeklyhours1
(stan-dard)
Weekly pay (in dollars)2 Percent of workers receiving straight-time weekly pay (in dollars) of—
Mean Median Middle range
350and
under400
400-
500
500-
600
600-
700
700-
800
800-
900
900-
1000
1000-
1100
1100-
1200
1200-
1300
1300-
1400
1400-
1500
1500-
1600
1600-
1700
1700-
1800
1800-
1900
1900-
2000
2000-
2100
2100-
2200
2200andover
Tax CollectorsLevel II ...................................................... 28 40.0 $562 $572 $475 – $638 4 25 32 36 4 – – – – – – – – – – – – – – –
State and local government .................. 28 40.0 562 572 475 – 638 4 25 32 36 4 – – – – – – – – – – – – – – –
Level III ..................................................... 12 40.0 709 – – – – – – – 50 50 – – – – – – – – – – – – – – –State and local government .................. 12 40.0 709 – – – – – – – 50 50 – – – – – – – – – – – – – – –
1 Standard hours reflect the workweek for which employees receive their regular straight-time salaries (exclusive of pay forovertime at regular and/or premium rates), and the earnings correspond to these weekly hours.
2 Excludes premium pay for overtime and for work on weekends, holidays, and late shifts. Also excluded are performancebonuses and lump-sum payments of the type negotiated in the auto and aerospace industries, as well as profit-sharingpayments, attendance bonuses, Christmas or year-end bonuses, and other nonproduction bonuses. Pay increases, but notbonuses, under cost-of-living clauses, and incentive payments, however, are included. See Appendix A for definitions and
methods used to compute means, medians, and middle ranges.3 Less than 0.5 percent.
NOTE: Because of rounding, sums of individual intervals may not equal 100 percent. Dashes indicate that no data werereported or that data did not meet publication criteria. Overall occupation or occupational levels may include data forcategories not shown separately.
8

Table A-2. All establishments: Weekly hours and pay of technical and protective service occupations, Atlanta, GA, May 1995
Occupation and levelNumber
ofworkers
Averageweeklyhours1
(stan-dard)
Weekly pay (in dollars)2 Percent of workers receiving straight-time weekly pay (in dollars) of—
Mean Median Middle range
150and
under175
175-
200
200-
225
225-
250
250-
275
275-
300
300-
350
350-
400
400-
450
450-
500
500-
550
550-
600
600-
650
650-
700
700-
750
750-
800
800-
850
850-
900
900-
1000
1000-
1100
1100-
1200
TECHNICAL OCCUPATIONS
Computer OperatorsLevel II ...................................................... 509 39.5 $490 $465 $419 – $547 – – – – – – 2 12 27 20 25 5 1 3(� ) 3(� ) 6 – – – – –
Private industry ..................................... 440 39.4 493 465 419 – 547 – – – – – – 1 13 25 19 28 3 2 3(� ) 3(� ) 7 – – – – –Goods-producing industries .............. 102 40.0 537 424 389 – 798 – – – – – – – 27 29 7 4 – – – – 32 – – – – –
Manufacturing ............................... 92 40.0 555 433 400 – 798 – – – – – – – 21 32 8 4 – – – – 36 – – – – –Service-producing industries ............ 338 39.3 480 465 424 – 547 – – – – – – 2 9 24 23 35 4 2 1 1 – – – – – –
State and local government .................. 69 39.9 469 456 419 – 526 – – – – – – 6 6 35 25 9 20 – – – – – – – – –
Level III ..................................................... 479 39.4 550 555 507 – 586 – – – – – – – 1 3 17 26 32 14 6 – – – – – – –Private industry ..................................... 419 39.4 550 555 507 – 581 – – – – – – – 1 2 16 26 34 14 6 – – – – – – –
Goods-producing industries .............. 97 39.7 542 520 514 – 584 – – – – – – – – – 15 53 16 11 4 – – – – – – –Manufacturing ............................... 94 39.7 543 520 514 – 584 – – – – – – – – – 16 51 17 12 4 – – – – – – –
Service-producing industries ............ 322 39.3 553 567 505 – 581 – – – – – – – 2 3 16 18 39 15 6 – – – – – – –State and local government .................. 60 39.8 548 541 495 – 608 – – – – – – – – 10 22 22 20 17 10 – – – – – – –
Level IV ..................................................... 180 39.7 658 650 608 – 707 – – – – – – – – – 3 6 16 27 12 25 4 6 2 – – –Private industry ..................................... 133 39.5 683 700 615 – 745 – – – – – – – – – – 5 10 26 10 34 6 8 2 – – –
Service-producing industries ............ 101 39.4 676 650 610 – 745 – – – – – – – – – – 6 13 33 12 15 8 11 3 – – –State and local government .................. 47 40.0 589 585 550 – 635 – – – – – – – – – 11 11 32 30 17 – – – – – – –
DraftersLevel I ....................................................... 96 40.0 396 376 376 – 440 – – – – – – 14 46 38 3 – – – – – – – – – – –
Private industry ..................................... 89 40.0 403 376 376 – 440 – – – – – – 7 49 40 3 – – – – – – – – – – –
Level II ...................................................... 395 39.2 537 547 500 – 574 – – – – – – – 5 5 9 50 21 2 8 – – – – – – –Private industry ..................................... 368 39.2 545 547 516 – 574 – – – – – – – 1 4 8 54 23 2 8 – – – – – – –
Level III ..................................................... 279 40.0 592 580 544 – 647 – – – – – – – – 4 8 14 27 23 18 6 1 – – – – –Private industry ..................................... 227 40.0 607 610 561 – 672 – – – – – – – – – 4 14 30 23 21 7 1 – – – – –State and local government .................. 52 39.8 525 515 458 – 604 – – – – – – – – 21 23 15 15 21 4 – – – – – – –
Engineering TechniciansLevel II ...................................................... 166 38.2 533 563 496 – 563 – – – – – – – – 6 23 13 57 1 1 – – – – – – –
Private industry ..................................... 165 38.2 533 563 496 – 563 – – – – – – – – 6 23 13 57 1 1 – – – – – – –
Level III ..................................................... 248 39.8 636 629 600 – 669 – – – – – – – – – 2 6 6 50 22 10 4 3(� ) – – – –Private industry ..................................... 248 39.8 636 629 600 – 669 – – – – – – – – – 2 6 6 50 22 10 4 3(� ) – – – –
Goods-producing industries .............. 201 39.7 626 616 600 – 658 – – – – – – – – – 2 4 7 57 23 6 – – – – – –Manufacturing ............................... 201 39.7 626 616 600 – 658 – – – – – – – – – 2 4 7 57 23 6 – – – – – –
Level IV ..................................................... 172 39.8 725 735 672 – 763 – – – – – – – – – – – 2 13 16 36 16 16 1 1 – –Private industry ..................................... 167 39.8 728 735 672 – 764 – – – – – – – – – – – 2 11 16 37 16 16 1 1 – –
Goods-producing industries .............. 125 39.7 741 735 706 – 771 – – – – – – – – – – – 2 1 17 45 17 17 2 – – –Manufacturing ............................... 125 39.7 741 735 706 – 771 – – – – – – – – – – – 2 1 17 45 17 17 2 – – –
Level V ...................................................... 75 40.0 862 – – – – – – – – – – – – – – – – – – 11 29 16 4 31 5 4Private industry ..................................... 75 40.0 862 – – – – – – – – – – – – – – – – – – 11 29 16 4 31 5 4
See footnotes at end of table.
9

Table A-2. All establishments: Weekly hours and pay of technical and protective service occupations, Atlanta, GA, May 1995 — Continued
Occupation and levelNumber
ofworkers
Averageweeklyhours1
(stan-dard)
Weekly pay (in dollars)2 Percent of workers receiving straight-time weekly pay (in dollars) of—
Mean Median Middle range
150and
under175
175-
200
200-
225
225-
250
250-
275
275-
300
300-
350
350-
400
400-
450
450-
500
500-
550
550-
600
600-
650
650-
700
700-
750
750-
800
800-
850
850-
900
900-
1000
1000-
1100
1100-
1200
Engineering Technicians, CivilLevel I:
State and local government .................. 66 40.0 $361 $338 $330 – $376 – – – – – – 59 23 11 8 – – – – – – – – – – –
Level II ...................................................... 204 40.0 421 406 381 – 440 – – – – – – – 44 34 7 13 1 – – – – – – – – –Private industry ..................................... 122 40.0 417 408 381 – 438 – – – – – – – 43 39 7 7 2 – – – – – – – – –State and local government .................. 82 40.0 428 406 387 – 495 – – – – – – – 44 27 7 22 – – – – – – – – – –
Level III ..................................................... 535 40.0 545 560 481 – 585 – – – – – – – 3(� ) 11 17 11 36 21 2 – 1 – – – – –State and local government .................. 187 40.0 538 538 474 – 608 – – – – – – – 1 11 25 15 22 19 5 – 2 – – – – –
Level IV ..................................................... 591 40.0 631 640 562 – 690 – – – – – – – – 1 2 18 11 25 19 19 4 3(� ) – – – –State and local government .................. 298 39.9 606 590 515 – 677 – – – – – – – – 3(� ) 4 30 16 18 12 12 7 – – – – –
Licensed Practical NursesLevel II ...................................................... 2,400 40.0 447 440 402 – 490 – – – – – – 4 16 40 19 16 5 1 3(� ) – – – – – – –
Private industry ..................................... 1,493 40.0 444 434 406 – 471 – – – – – – 3(� ) 16 49 19 10 6 1 – – – – – – – –Service-producing industries ............ 1,490 40.0 444 434 404 – 471 – – – – – – 3(� ) 16 49 19 10 6 1 – – – – – – – –
Nursing AssistantsLevel I ....................................................... 991 38.7 225 216 206 – 249 1 17 41 16 20 4 1 – – – – – – – – – – – – – –
Level II ...................................................... 4,901 40.0 278 271 250 – 302 3(� ) 4 10 10 28 20 17 9 1 3(� ) – – – – – – – – – – –Private industry ..................................... 3,744 40.0 274 266 240 – 300 3(� ) 5 13 13 25 17 15 10 1 3(� ) – – – – – – – – – – –
Service-producing industries ............ 3,744 40.0 274 266 240 – 300 3(� ) 5 13 13 25 17 15 10 1 3(� ) – – – – – – – – – – –
Level III ..................................................... 378 40.0 334 332 294 – 374 – – – 1 12 17 26 35 10 – – – – – – – – – – – –
PROTECTIVE SERVICEOCCUPATIONS
Corrections Officers ................................... 892 40.0 396 377 353 – 409 – – – – – – 22 49 16 6 2 1 1 3(� ) 3(� ) 1 1 3(� ) – – –State and local government ...................... 892 40.0 396 377 353 – 409 – – – – – – 22 49 16 6 2 1 1 3(� ) 3(� ) 1 1 3(� ) – – –
Firefighters .................................................. 2,050 52.5 514 484 427 – 620 – – – – – – 3 6 31 17 7 7 9 17 3(� ) 2 – – – – –State and local government ...................... 2,012 52.8 509 481 424 – 614 – – – – – – 3 6 32 18 7 7 9 18 3(� ) – – – – – –
Police OfficersLevel I ....................................................... 3,336 41.1 514 470 436 – 614 – – – – – 3(� ) 1 7 35 20 7 4 6 5 15 3(� ) 3(� ) – – – –
State and local government .................. 3,252 41.1 517 470 436 – 614 – – – – – 3(� ) 3(� ) 6 35 20 8 5 6 5 15 3(� ) 3(� ) – – – –
1 Standard hours reflect the workweek for which employees receive their regular straight-time salaries (exclusive of pay forovertime at regular and/or premium rates), and the earnings correspond to these weekly hours.
2 Excludes premium pay for overtime and for work on weekends, holidays, and late shifts. Also excluded are performancebonuses and lump-sum payments of the type negotiated in the auto and aerospace industries, as well as profit-sharing payments,attendance bonuses, Christmas or year-end bonuses, and other nonproduction bonuses. Pay increases, but not bonuses, undercost-of-living clauses, and incentive payments, however, are included. See Appendix A for definitions and methods used to
compute means, medians, and middle ranges.3 Less than 0.5 percent.
NOTE: Because of rounding, sums of individual intervals may not equal 100 percent. Dashes indicate that no data were reportedor that data did not meet publication criteria. Overall occupation or occupational levels may include data for categories not shownseparately.
10

Table A-3. All establishments: Weekly hours and pay of clerical occupations, Atlanta, GA, May 1995
Occupation and levelNumber
ofworkers
Averageweeklyhours1
(stan-dard)
Weekly pay (in dollars)2 Percent of workers receiving straight-time weekly pay (in dollars) of—
Mean Median Middle range
200and
under225
225-
250
250-
275
275-
300
300-
325
325-
350
350-
375
375-
400
400-
425
425-
450
450-
500
500-
550
550-
600
600-
650
650-
700
700-
750
750-
800
800-
850
850-
900
900-
950
950-
1000
Clerks, AccountingLevel I ....................................................... 83 39.3 $338 $357 $300 – $369 – – 18 6 18 7 30 16 2 – 2 – – – – – – – – – –
Private industry ..................................... 75 39.2 336 – – – – – – 20 7 20 3 31 16 1 – 3 – – – – – – – – – –Service-producing industries ............ 71 39.1 334 – – – – – – 21 7 21 1 31 15 – – 3 – – – – – – – – – –
Level II ...................................................... 2,599 39.7 402 390 356 – 444 – 1 1 2 6 13 17 15 13 9 9 14 3(� ) – – – – – – – –Private industry ..................................... 2,368 39.6 404 390 360 – 446 – 1 1 1 6 12 17 16 12 9 9 15 3(� ) – – – – – – – –
Goods-producing industries .............. 577 39.9 395 380 356 – 440 – – 5 – 3 9 23 16 8 18 10 7 3(� ) – – – – – – – –Manufacturing ............................... 533 39.9 397 380 360 – 440 – – 5 – 3 10 22 16 8 19 10 8 – – – – – – – – –
Service-producing industries ............ 1,791 39.5 407 390 360 – 450 – 1 – 2 7 13 15 16 14 6 8 18 3(� ) – – – – – – – –State and local government .................. 231 40.0 385 374 343 – 429 – 3(� ) – 5 10 18 17 10 14 9 15 2 – – – – – – – – –
Level III ..................................................... 2,254 39.6 459 454 404 – 510 – – 3(� ) 3(� ) 1 5 7 8 14 12 24 13 15 1 3(� ) – – – – – –Private industry ..................................... 1,781 39.5 470 462 416 – 519 – – – 3(� ) 1 2 6 6 15 12 25 14 19 1 3(� ) – – – – – –
Goods-producing industries .............. 373 39.9 448 450 404 – 485 – – – – – – 7 4 21 19 32 16 1 – 3(� ) – – – – – –Manufacturing ............................... 366 39.9 448 450 404 – 485 – – – – – – 7 4 22 18 32 16 1 – 3(� ) – – – – – –
Service-producing industries ............ 1,408 39.3 476 470 421 – 558 – – – 3(� ) 1 2 5 7 13 11 23 13 24 2 – – – – – – –Transportation and utilities ........... 459 38.6 517 563 464 – 563 – – – – – – 2 7 8 7 11 4 62 – – – – – – – –
State and local government .................. 473 39.9 420 421 365 – 470 – – 3(� ) 3(� ) 1 16 12 16 8 12 21 10 1 3(� ) – – – – – – –
Level IV ..................................................... 1,063 39.5 520 515 454 – 614 – – – – – 3(� ) 2 9 7 6 24 9 17 26 3(� ) 3(� ) – – – – –Private industry ..................................... 792 39.3 544 576 463 – 615 – – – – – – 1 4 3 5 23 7 21 35 1 3(� ) – – – – –
Service-producing industries ............ 761 39.3 544 576 462 – 615 – – – – – – 1 4 3 5 22 7 21 36 1 – – – – – –Transportation and utilities ........... 498 39.2 585 614 576 – 637 – – – – – – – – – 3 13 3 26 54 1 – – – – – –
State and local government .................. 271 40.0 447 442 395 – 493 – – – – – 1 5 22 16 9 28 15 4 – – – – – – – –
Clerks, GeneralLevel I ....................................................... 70 39.9 259 – – – – 20 30 17 17 14 – – – – – 1 – – – – – – – – – –
State and local government .................. 16 40.0 287 288 265 – 309 – 6 25 31 38 – – – – – – – – – – – – – – – –
Level II ...................................................... 1,183 39.8 317 309 288 – 341 1 3 8 29 27 11 9 4 5 2 3(� ) 3(� ) 3(� ) 3(� ) – – – – – – –Private industry ..................................... 733 39.7 321 317 288 – 347 1 5 9 22 25 14 11 3 8 2 3(� ) 3(� ) 3(� ) 3(� ) – – – – – – –
Service-producing industries ............ 691 39.7 322 317 289 – 350 1 5 7 23 25 14 11 3 8 2 3(� ) 3(� ) 3(� ) 3(� ) – – – – – – –Transportation and utilities ........... 200 39.8 339 320 317 – 360 – 1 1 13 36 20 15 3 4 1 3(� ) 3(� ) 1 3(� ) – – – – – – –
State and local government .................. 450 40.0 310 302 288 – 319 – 1 6 40 32 7 6 6 1 1 – – – – – – – – – – –
Level III ..................................................... 3,024 39.4 435 434 359 – 521 – 3 3 3 5 6 9 10 8 12 6 26 2 3(� ) 4 1 – – – – –Private industry:
Goods-producing industries .............. 169 40.0 484 418 340 – 668 – – – – 1 27 6 9 8 1 8 3 4 5 28 1 – – – – –Manufacturing ............................... 143 40.0 501 486 337 – 668 – – – – 1 28 3 10 3 – 7 3 5 6 33 1 – – – – –
Service-producing industries:Transportation and utilities ........... 1,146 38.6 518 521 508 – 521 – – – 3(� ) – 1 2 1 6 5 7 67 3(� ) 3(� ) 7 2 – – – – –
State and local government .................. 545 40.0 372 376 325 – 415 – – 8 7 12 8 12 14 18 17 4 1 – – – – – – – – –
Level IV ..................................................... 1,422 39.9 432 423 366 – 480 – – – – 9 12 9 11 10 10 20 10 6 3 1 3(� ) 3(� ) – – – –Private industry ..................................... 713 39.9 475 466 423 – 506 – – – – – 1 4 12 9 13 34 10 12 4 1 3(� ) 3(� ) – – – –
Service-producing industries ............ 706 39.9 474 466 423 – 505 – – – – – 1 4 12 9 13 35 10 12 4 1 3(� ) 3(� ) – – – –Transportation and utilities ........... 221 40.0 494 478 463 – 519 – – – – – 3(� ) 1 3 3 3 54 21 9 3 2 3(� ) 3(� ) – – – –
State and local government .................. 709 40.0 389 368 338 – 424 – – – – 18 24 13 10 10 6 5 11 3(� ) 2 – – – – – – –
See footnotes at end of table.
11

Table A-3. All establishments: Weekly hours and pay of clerical occupations, Atlanta, GA, May 1995 — Continued
Occupation and levelNumber
ofworkers
Averageweeklyhours1
(stan-dard)
Weekly pay (in dollars)2 Percent of workers receiving straight-time weekly pay (in dollars) of—
Mean Median Middle range
200and
under225
225-
250
250-
275
275-
300
300-
325
325-
350
350-
375
375-
400
400-
425
425-
450
450-
500
500-
550
550-
600
600-
650
650-
700
700-
750
750-
800
800-
850
850-
900
900-
950
950-
1000
Clerks, OrderLevel II ...................................................... 141 40.0 $389 $377 $351 – $450 – – – – 24 – 21 21 1 – 26 7 – – – – – – – – –
Private industry ..................................... 141 40.0 389 377 351 – 450 – – – – 24 – 21 21 1 – 26 7 – – – – – – – – –
Key Entry OperatorsLevel I ....................................................... 825 39.9 342 330 295 – 362 3(� ) 3(� ) 4 26 9 26 12 7 4 3 3 5 – – – – – – – – –
Private industry ..................................... 598 39.8 350 330 300 – 379 3(� ) 3(� ) 4 20 6 29 14 9 4 4 3 7 – – – – – – – – –Goods-producing industries .............. 156 40.0 347 330 330 – 356 – – 2 10 – 60 11 6 – 4 6 2 – – – – – – – – –Service-producing industries ............ 442 39.7 352 340 290 – 390 3(� ) 3(� ) 5 24 8 18 15 10 5 5 2 8 – – – – – – – – –
State and local government .................. 227 40.0 319 305 288 – 338 – – 5 43 19 17 6 3 4 1 2 – – – – – – – – – –
Level II ...................................................... 741 40.0 405 398 349 – 462 – – 2 3 7 17 9 14 9 6 26 4 2 3(� ) 1 – – – – – –Private industry ..................................... 430 40.0 408 395 343 – 466 – – 3 4 6 16 7 16 4 4 33 3 3 3(� ) 1 – – – – – –
Service-producing industries ............ 306 39.9 391 380 341 – 449 – – 4 6 8 15 9 22 6 6 17 4 4 3(� ) – – – – – – –State and local government .................. 311 40.0 400 398 349 – 444 – – – – 9 19 11 11 16 9 17 5 1 – – – – – – – –
Personnel Assistants (Employment)Level II ...................................................... 88 40.0 442 428 420 – 464 – – – – – – 6 7 18 39 15 16 – – – – – – – – –
Private industry ..................................... 61 40.0 450 – – – – – – – – – – 2 7 16 39 15 21 – – – – – – – – –State and local government .................. 27 39.9 423 – – – – – – – – – – 15 7 22 37 15 4 – – – – – – – – –
Level III ..................................................... 58 39.9 530 – – – – – – – – – – – – 24 2 3 12 34 21 3 – – – – – –State and local government .................. 19 40.0 519 556 411 – 556 – – – – – – – – 26 5 5 – 53 – 11 – – – – – –
SecretariesLevel I ....................................................... 1,607 39.9 389 379 335 – 428 – – 3(� ) 7 14 11 14 15 12 9 8 5 2 3(� ) 1 – – – – – –
State and local government .................. 1,160 40.0 366 358 313 – 404 – – – 10 19 12 16 15 11 10 6 1 – – – – – – – – –
Level II ...................................................... 3,452 39.6 467 460 404 – 527 – – – – 3(� ) 7 7 10 13 8 19 16 15 2 3 – – – – – –Private industry ..................................... 1,900 39.4 508 510 449 – 567 – – – – 3(� ) – 3 5 8 9 20 22 26 3 5 – – – – – –
Service-producing industries ............ 1,854 39.3 509 510 450 – 572 – – – – 3(� ) – 3 5 8 9 19 22 26 3 5 – – – – – –State and local government .................. 1,552 40.0 417 404 374 – 458 – – – – – 17 12 15 18 8 19 8 2 1 – – – – – – –
Level III ..................................................... 2,281 39.9 539 526 474 – 598 – – – – – 3(� ) 2 3 6 5 21 22 18 11 3 10 3(� ) 3(� ) 3(� ) 3(� ) –Private industry ..................................... 1,663 39.8 560 545 487 – 614 – – – – – 3(� ) 1 3(� ) 2 4 22 23 19 11 3 13 1 3(� ) 3(� ) 1 –
Goods-producing industries .............. 378 39.9 616 620 529 – 704 – – – – – – – – – 1 15 18 14 3 1 48 1 – 1 – –Manufacturing ............................... 355 39.9 618 704 523 – 704 – – – – – – – – – 1 16 19 10 2 1 51 1 – 1 – –
Service-producing industries ............ 1,285 39.8 544 529 481 – 596 – – – – – 3(� ) 1 3(� ) 2 5 24 24 21 13 4 3 1 1 – 1 –Transportation and utilities ........... 198 39.8 552 550 481 – 605 – – – – – 1 2 1 4 7 20 16 24 12 7 4 2 2 – – –
State and local government .................. 618 40.0 484 486 412 – 549 – – – – – 1 5 11 17 6 19 18 14 10 3(� ) 3(� ) – – – – –
Level IV ..................................................... 1,244 39.6 591 598 537 – 649 – – – – – – – 3(� ) 4 5 7 14 20 25 14 8 2 1 3(� ) – –Private industry ..................................... 854 39.3 621 621 567 – 667 – – – – – – – – – 3(� ) 4 13 22 29 18 10 2 1 3(� ) – –
Goods-producing industries .............. 103 39.2 629 613 560 – 677 – – – – – – – – – – 1 5 34 24 16 17 2 1 – – –Manufacturing ............................... 100 39.1 629 614 560 – 678 – – – – – – – – – – 1 5 35 22 16 18 2 1 – – –
Service-producing industries ............ 751 39.4 620 622 567 – 667 – – – – – – – – – 3(� ) 4 14 20 30 18 9 3 1 3(� ) – –Transportation and utilities ........... 298 39.2 625 633 577 – 667 – – – – – – – – – 3(� ) 4 13 18 26 29 8 1 1 – – –
State and local government .................. 390 40.0 527 535 427 – 593 – – – – – – – 1 12 16 14 15 18 16 6 2 3(� ) – – – –
See footnotes at end of table.
12
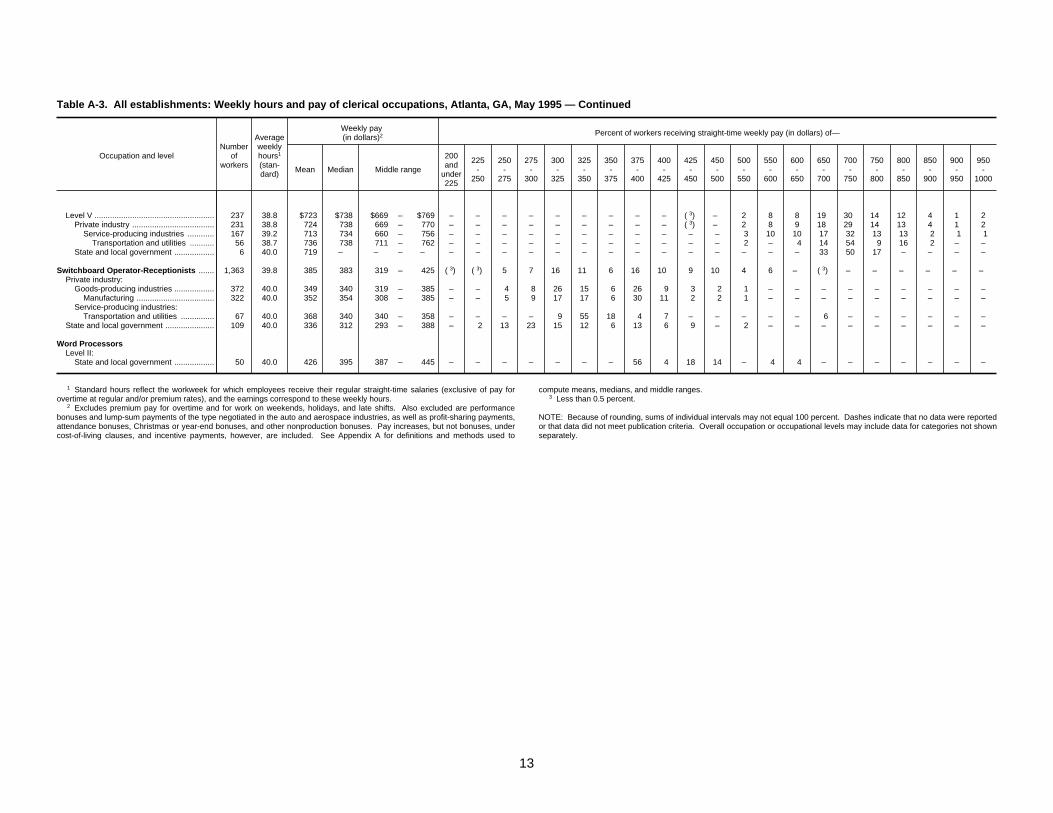
Table A-3. All establishments: Weekly hours and pay of clerical occupations, Atlanta, GA, May 1995 — Continued
Occupation and levelNumber
ofworkers
Averageweeklyhours1
(stan-dard)
Weekly pay (in dollars)2 Percent of workers receiving straight-time weekly pay (in dollars) of—
Mean Median Middle range
200and
under225
225-
250
250-
275
275-
300
300-
325
325-
350
350-
375
375-
400
400-
425
425-
450
450-
500
500-
550
550-
600
600-
650
650-
700
700-
750
750-
800
800-
850
850-
900
900-
950
950-
1000
Level V ...................................................... 237 38.8 $723 $738 $669 – $769 – – – – – – – – – 3(� ) – 2 8 8 19 30 14 12 4 1 2Private industry ..................................... 231 38.8 724 738 669 – 770 – – – – – – – – – 3(� ) – 2 8 9 18 29 14 13 4 1 2
Service-producing industries ............ 167 39.2 713 734 660 – 756 – – – – – – – – – – – 3 10 10 17 32 13 13 2 1 1Transportation and utilities ........... 56 38.7 736 738 711 – 762 – – – – – – – – – – – 2 – 4 14 54 9 16 2 – –
State and local government .................. 6 40.0 719 – – – – – – – – – – – – – – – – – – 33 50 17 – – – –
Switchboard Operator-Receptionists ....... 1,363 39.8 385 383 319 – 425 3(� ) 3(� ) 5 7 16 11 6 16 10 9 10 4 6 – 3(� ) – – – – – –Private industry:
Goods-producing industries .................. 372 40.0 349 340 319 – 385 – – 4 8 26 15 6 26 9 3 2 1 – – – – – – – – –Manufacturing ................................... 322 40.0 352 354 308 – 385 – – 5 9 17 17 6 30 11 2 2 1 – – – – – – – – –
Service-producing industries:Transportation and utilities ............... 67 40.0 368 340 340 – 358 – – – – 9 55 18 4 7 – – – – – 6 – – – – – –
State and local government ...................... 109 40.0 336 312 293 – 388 – 2 13 23 15 12 6 13 6 9 – 2 – – – – – – – – –
Word ProcessorsLevel II:
State and local government .................. 50 40.0 426 395 387 – 445 – – – – – – – 56 4 18 14 – 4 4 – – – – – – –
1 Standard hours reflect the workweek for which employees receive their regular straight-time salaries (exclusive of pay forovertime at regular and/or premium rates), and the earnings correspond to these weekly hours.
2 Excludes premium pay for overtime and for work on weekends, holidays, and late shifts. Also excluded are performancebonuses and lump-sum payments of the type negotiated in the auto and aerospace industries, as well as profit-sharing payments,attendance bonuses, Christmas or year-end bonuses, and other nonproduction bonuses. Pay increases, but not bonuses, undercost-of-living clauses, and incentive payments, however, are included. See Appendix A for definitions and methods used to
compute means, medians, and middle ranges.3 Less than 0.5 percent.
NOTE: Because of rounding, sums of individual intervals may not equal 100 percent. Dashes indicate that no data were reportedor that data did not meet publication criteria. Overall occupation or occupational levels may include data for categories not shownseparately.
13

Table A-4. All establishments: Hourly pay of maintenance and toolroom occupations, Atlanta, GA, May 1995
Occupation and levelNumber
ofworkers
Hourly pay (in dollars)1 Percent of workers receiving straight-time hourly pay (in dollars) of—
Mean Median Middle range
6.00and
under6.50
6.50-
7.00
7.00-
7.50
7.50-
8.00
8.00-
9.00
9.00-
10.00
10.00-
11.00
11.00-
12.00
12.00-
13.00
13.00-
14.00
14.00-
15.00
15.00-
16.00
16.00-
17.00
17.00-
18.00
18.00-
19.00
19.00-
20.00
20.00-
21.00
21.00-
22.00
22.00-
23.00
23.00-
24.00
24.00-
25.00
25.00andover
General Maintenance Workers .................. 1,603 $9.85 $9.61 $8.30 – $11.20 2 1 5 3 32 11 17 9 11 7 1 2(� ) – – – – – – – – – –Private industry ......................................... 1,125 9.66 8.85 8.00 – 11.00 3 2 7 3 36 6 16 7 11 8 1 2(� ) – – – – – – – – – –
Goods-producing industries .................. 211 11.50 12.00 10.00 – 12.80 – – – – – – 43 6 41 9 – 2(� ) – – – – – – – – – –Manufacturing ................................... 191 11.29 11.80 10.00 – 12.80 – – – – – – 48 6 46 – – 1 – – – – – – – – – –
Service-producing industries ................ 914 9.23 8.65 8.00 – 10.33 3 3 9 3 45 8 10 7 4 7 1 – – – – – – – – – – –State and local government ...................... 478 10.32 10.09 8.97 – 11.48 – – 1 3 23 21 20 13 12 5 2 – – – – – – – – – – –
Maintenance Electricians ........................... 641 16.57 15.79 12.44 – 21.67 – – – – – – 19 2 7 7 5 12 5 2 2 2(� ) 1 37 – – – –Private industry:
Goods-producing industries:Manufacturing ................................... 407 17.44 21.67 10.60 – 21.67 – – – – – – 28 – – 4 2 5 3 1 1 – 2(� ) 54 – – – –
Service-producing industries ................ 87 16.67 15.10 15.06 – 20.27 – – – – – – – – 7 9 7 37 9 3 – 2 5 21 – – – –State and local government ...................... 141 14.09 13.82 12.37 – 15.43 – – – – – – 3 11 29 13 9 15 11 4 6 1 – – – – – –
Maintenance Electronics TechniciansLevel I ....................................................... 133 12.98 13.25 11.04 – 13.70 – – – – 2 8 15 6 11 39 11 – – – 9 – – – – – – –
Private industry ..................................... 105 13.53 13.46 12.98 – 13.94 – – – – 3 3 10 – 11 48 13 – – – 11 – – – – – – –State and local government .................. 28 10.92 – – – – – – – – – 25 32 29 7 7 – – – – – – – – – – – –
Level II ...................................................... 1,296 16.80 16.49 15.02 – 18.62 – – – – – – – 2 4 8 10 13 16 3 29 2 13 1 – – – –Private industry ..................................... 1,061 17.16 18.02 15.15 – 18.62 – – – – – – – 1 3 8 10 14 7 3 35 2 16 1 – – – –
Goods-producing industries .............. 348 17.39 18.58 14.42 – 20.13 – – – – – – – 1 7 11 11 11 4 1 5 3 46 – – – – –Manufacturing ............................... 348 17.39 18.58 14.42 – 20.13 – – – – – – – 1 7 11 11 11 4 1 5 3 46 – – – – –
Service-producing industries ............ 713 17.05 18.02 15.38 – 18.62 – – – – – – – 1 1 7 9 16 8 5 50 2 1 1 – – – –Transportation and utilities ........... 562 17.56 18.62 15.95 – 18.62 – – – – – – – – 1 4 10 10 4 4 62 2 1 1 – – – –
State and local government .................. 235 15.15 16.21 13.91 – 16.21 – – – – – – – 7 11 9 8 6 56 2 2(� ) – – – – – – –
Level III ..................................................... 448 19.96 19.67 17.70 – 22.12 – – – – – – – – 2(� ) 2(� ) 2(� ) 7 9 11 17 9 12 8 10 5 3 8Private industry ..................................... 426 20.12 19.81 17.95 – 22.21 – – – – – – – – – – – 6 9 12 17 10 12 8 11 6 3 8
Service-producing industries ............ 415 20.14 19.92 17.92 – 22.28 – – – – – – – – – – – 6 9 12 17 8 13 8 11 6 3 8Transportation and utilities ........... 322 20.73 20.61 18.33 – 22.87 – – – – – – – – – – – 2 11 11 11 9 13 9 14 7 4 311
Maintenance Machinists ............................ 272 15.84 15.60 14.84 – 17.05 – – – – – 2(� ) – 2(� ) 1 18 11 36 5 15 – – 13 – – – – –Private industry ......................................... 266 15.88 15.60 14.84 – 17.05 – – – – – – – – 2 19 11 37 4 15 – – 13 – – – – –
Goods-producing industries .................. 264 15.87 15.60 14.84 – 17.05 – – – – – – – – 2 19 11 37 3 15 – – 13 – – – – –Manufacturing ................................... 264 15.87 15.60 14.84 – 17.05 – – – – – – – – 2 19 11 37 3 15 – – 13 – – – – –
Maintenance Mechanics, Machinery ......... 1,375 14.57 14.40 13.48 – 14.76 – – – – – – 3 2 10 13 53 4 8 1 1 2(� ) 6 2(� ) – – – –Private industry ......................................... 1,311 14.54 14.40 13.50 – 14.76 – – – – – – 3 2 10 13 55 3 7 2(� ) 1 2(� ) 6 2(� ) – – – –
Goods-producing industries .................. 1,228 14.58 14.40 13.57 – 14.40 – – – – – – 3 2 8 13 55 3 8 2(� ) 1 2(� ) 6 2(� ) – – – –Manufacturing ................................... 1,208 14.62 14.40 14.14 – 14.40 – – – – – – 3 2 7 13 56 3 8 2(� ) 1 2(� ) 6 2(� ) – – – –
Service-producing industries ................ 83 13.96 14.39 12.90 – 14.95 – – – – – – – 2 31 14 51 – – – – 1 – – – – – –State and local government ...................... 64 15.14 15.35 13.48 – 16.71 – – – – – – 3 – 9 20 8 23 22 11 3 – – – – – – –
Maintenance Mechanics, Motor Vehicle ... 1,524 16.52 17.30 14.13 – 17.92 – – – – 1 1 2 5 7 7 8 9 6 30 1 9 5 9 – – – –Private industry ......................................... 1,113 17.45 17.92 15.05 – 19.63 – – – – – – 2 3 3 7 10 4 2 38 – 12 7 12 – – – –
Goods-producing industries .................. 123 16.24 17.05 13.10 – 19.43 – – – – – – 8 4 2 20 11 – – 26 – 6 – 23 – – – –Manufacturing ................................... 98 16.91 17.05 13.56 – 21.42 – – – – – – 10 5 3 10 3 – – 33 – 7 – 29 – – – –
Service-producing industries ................ 990 17.60 17.92 15.25 – 19.63 – – – – – – 1 3 3 5 9 5 2 40 – 13 8 11 – – – –Transportation and utilities ............... 911 17.73 17.92 17.28 – 19.63 – – – – – – 1 3 2 6 5 5 2 43 – 14 9 9 – – – –
State and local government ...................... 411 13.99 14.19 12.03 – 16.11 – – – – 2 3 5 12 20 7 5 21 17 6 2 2(� ) – – – – – –
See footnotes at end of table.
14

Table A-4. All establishments: Hourly pay of maintenance and toolroom occupations, Atlanta, GA, May 1995 — Continued
Occupation and levelNumber
ofworkers
Hourly pay (in dollars)1 Percent of workers receiving straight-time hourly pay (in dollars) of—
Mean Median Middle range
6.00and
under6.50
6.50-
7.00
7.00-
7.50
7.50-
8.00
8.00-
9.00
9.00-
10.00
10.00-
11.00
11.00-
12.00
12.00-
13.00
13.00-
14.00
14.00-
15.00
15.00-
16.00
16.00-
17.00
17.00-
18.00
18.00-
19.00
19.00-
20.00
20.00-
21.00
21.00-
22.00
22.00-
23.00
23.00-
24.00
24.00-
25.00
25.00andover
Tool and Die Makers ................................... 201 $18.67 $21.69 $14.26 – $21.69 – – – – – – – 5 5 10 10 5 – – – 2(� ) 10 40 14 – – –Private industry ......................................... 201 18.67 21.69 14.26 – 21.69 – – – – – – – 5 5 10 10 5 – – – 2(� ) 10 40 14 – – –
Goods-producing industries .................. 183 19.09 21.69 14.77 – 21.69 – – – – – – – 5 5 8 8 3 – – – 1 11 44 16 – – –Manufacturing ................................... 183 19.09 21.69 14.77 – 21.69 – – – – – – – 5 5 8 8 3 – – – 1 11 44 16 – – –
1 Excludes premium pay for overtime and for work on weekends, holidays, and late shifts. Also excluded are performancebonuses and lump-sum payments of the type negotiated in the auto and aerospace industries, as well as profit-sharingpayments, attendance bonuses, Christmas or year-end bonuses, and other nonproduction bonuses. Pay increases, but notbonuses, under cost-of-living clauses, and incentive payments, however, are included. See Appendix A for definitions andmethods used to compute means, medians, and middle ranges.
2 Less than 0.5 percent.
3 Workers were distributed as follows: 6 percent at $25.00 and under $26.00 and 5 percent at $26.00 and under $27.00.
NOTE: Because of rounding, sums of individual intervals may not equal 100 percent. Dashes indicate that no data werereported or that data did not meet publication criteria. Overall occupation or occupational levels may include data for categoriesnot shown separately.
15

Table A-5. All establishments: Hourly pay of material movement and custodial occupations, Atlanta, GA, May 1995
Occupation and levelNumber
ofworkers
Hourly pay (in dollars)1 Percent of workers receiving straight-time hourly pay (in dollars) of—
Mean Median Middle range
4.25and
under4.50
4.50-
4.75
4.75-
5.00
5.00-
5.50
5.50-
6.00
6.00-
6.50
6.50-
7.00
7.00-
7.50
7.50-
8.00
8.00-
8.50
8.50-
9.00
9.00-
9.50
9.50-
10.00
10.00-
11.00
11.00-
12.00
12.00-
13.00
13.00-
14.00
14.00-
15.00
15.00-
16.00
16.00-
17.00
17.00-
18.00
18.00-
19.00
19.00-
20.00
GuardsLevel I ....................................................... 4,880 $6.59 $6.40 $5.75 – $7.00 1 1 2(� ) 16 10 25 17 10 6 6 4 2 1 2 1 2(� ) 2(� ) – – – – – –
Private industry ..................................... 4,651 6.48 6.25 5.75 – 7.00 1 1 2(� ) 17 10 26 18 10 5 4 3 1 1 1 2(� ) 2(� ) 2(� ) – – – – – –Goods-producing industries .............. 92 8.22 7.60 6.91 – 8.92 – – – – – – 43 4 7 7 15 7 1 7 8 1 1 – – – – – –
Manufacturing ............................... 89 8.23 7.60 6.91 – 8.92 – – – – – – 45 4 3 7 16 7 1 7 8 1 1 – – – – – –Service-producing industries ............ 4,559 6.44 6.25 5.75 – 7.00 1 1 2(� ) 17 11 27 18 10 5 4 3 1 1 1 2(� ) 2(� ) – – – – – – –
State and local government .................. 229 8.85 8.36 8.07 – 9.57 – – – – – – 1 3 14 36 11 9 7 13 4 2 – – – – – – –
Level II ...................................................... 164 11.43 10.10 9.14 – 14.05 – – – – – – – 7 2 1 13 5 5 27 6 1 4 7 4 17 – – –Private industry ..................................... 157 11.46 10.10 9.13 – 14.60 – – – – – – – 8 3 1 13 5 5 26 4 1 4 8 4 18 – – –
Janitors ........................................................ 13,595 6.21 5.75 5.00 – 6.96 5 4 4 23 17 14 7 7 5 4 3 2 2 2 2(� ) 2(� ) 2(� ) – 2(� ) 2(� ) – 2(� ) –Private industry ......................................... 10,731 5.83 5.50 5.00 – 6.18 6 5 5 29 20 15 6 7 3 1 2 2(� ) 2(� ) 1 2(� ) 2(� ) 2(� ) – 2(� ) 2(� ) – 1 –
Goods-producing industries .................. 363 8.12 8.75 7.01 – 9.27 – – 13 – – 8 – 15 7 6 23 6 11 8 1 2 – – – – – – –Manufacturing ................................... 360 8.13 8.75 7.01 – 9.27 – – 13 – – 8 – 14 7 6 24 6 11 8 1 2 – – – – – – –
Service-producing industries ................ 10,368 5.75 5.50 5.00 – 6.06 7 5 5 30 20 15 6 7 2 1 1 2(� ) 2(� ) 1 2(� ) 2(� ) 2(� ) – 2(� ) 2(� ) – 1 –Transportation and utilities ............... 138 8.58 7.08 6.10 – 10.00 – – – – – 33 – 20 14 – 3 – 3 16 – 1 – – 3 9 – – –
State and local government ...................... 2,864 7.64 7.63 6.45 – 8.49 2(� ) 2(� ) 1 2 9 14 11 9 13 17 7 6 6 5 1 2(� ) – – – – – – –
Material Handling Laborers:Private industry:
Goods-producing industries .................. 592 8.48 7.16 7.16 – 9.00 – – – – – – – 67 – 5 4 5 5 10 – – – – – – – 6 –Manufacturing ................................... 592 8.48 7.16 7.16 – 9.00 – – – – – – – 67 – 5 4 5 5 10 – – – – – – – 6 –
Order Fillers:Private industry:
Goods-producing industries .................. 216 8.60 8.75 8.00 – 9.31 – – – – – – 5 9 5 16 40 12 4 10 – – – – – – – – –Manufacturing ................................... 216 8.60 8.75 8.00 – 9.31 – – – – – – 5 9 5 16 40 12 4 10 – – – – – – – – –
Shipping/Receiving Clerks ........................ 1,632 10.44 9.75 8.21 – 12.21 – – – – 2 1 5 8 7 8 6 10 11 4 9 10 11 2 – – – 7 –Private industry ......................................... 1,612 10.43 9.75 8.14 – 12.21 – – – – 2 1 5 8 7 8 6 10 11 3 9 10 11 2 – – – 7 –
Goods-producing industries .................. 761 9.78 9.50 7.98 – 12.10 – – – – 4 1 7 8 6 9 4 9 15 5 7 14 12 – – – – 1 –Manufacturing ................................... 737 9.77 9.50 7.98 – 12.10 – – – – 4 1 7 8 6 9 4 10 15 1 7 14 12 – – – – 1 –
TruckdriversLight Truck ................................................ 704 8.28 7.85 7.25 – 9.75 – 4 – – – 1 9 30 13 11 3 1 8 8 12 1 2(� ) 2(� ) – – – – –
Private industry ..................................... 603 8.28 7.85 7.25 – 9.75 – 4 – – – – 5 33 12 13 3 2(� ) 9 8 13 – – 2(� ) – – – – –Service-producing industries ............ 533 7.90 7.50 7.25 – 8.25 – 5 – – – – 5 38 13 15 3 2(� ) 10 9 2 – – – – – – – –
Medium Truck ........................................... 2,419 15.70 15.73 13.43 – 19.42 – – – – – – – – 2(� ) 1 4 2 6 5 3 3 4 4 26 3 – – 39Private industry ..................................... 2,351 15.87 15.73 13.90 – 19.42 – – – – – – – – 2(� ) – 3 1 6 5 3 3 4 4 27 3 – – 40
Service-producing industries ............ 2,306 15.95 15.73 14.23 – 19.42 – – – – – – – – – – 3 1 7 5 1 3 4 4 27 3 – – 41Transportation and utilities ........... 1,904 17.26 16.19 15.58 – 19.42 – – – – – – – – – – – – – 2(� ) 2(� ) 2 5 5 33 4 – – 50
State and local government .................. 68 9.91 9.11 8.47 – 10.80 – – – – – – – – – 26 13 13 10 19 1 6 10 – – – – – –
See footnotes at end of table.
16

Table A-5. All establishments: Hourly pay of material movement and custodial occupations, Atlanta, GA, May 1995 — Continued
Occupation and levelNumber
ofworkers
Hourly pay (in dollars)1 Percent of workers receiving straight-time hourly pay (in dollars) of—
Mean Median Middle range
4.25and
under4.50
4.50-
4.75
4.75-
5.00
5.00-
5.50
5.50-
6.00
6.00-
6.50
6.50-
7.00
7.00-
7.50
7.50-
8.00
8.00-
8.50
8.50-
9.00
9.00-
9.50
9.50-
10.00
10.00-
11.00
11.00-
12.00
12.00-
13.00
13.00-
14.00
14.00-
15.00
15.00-
16.00
16.00-
17.00
17.00-
18.00
18.00-
19.00
19.00-
20.00
Heavy Truck:Private industry:
Goods-producing industries .............. 118 $10.24 $10.15 $10.00 – $10.40 – – – – – – – – – – – 22 – 69 4 – – 3 1 – – – –
Tractor Trailer ........................................... 2,476 14.60 13.72 12.23 – 17.73 – – – – – – – – – 1 1 – – 12 2(� ) 26 12 9 3 5 18 1 13Private industry ..................................... 2,476 14.60 13.72 12.23 – 17.73 – – – – – – – – – 1 1 – – 12 2(� ) 26 12 9 3 5 18 1 13
Goods-producing industries .............. 210 11.71 10.85 10.00 – 14.00 – – – – – – – – – 13 7 – – 45 – 6 – 19 – – – 6 3Manufacturing ............................... 148 11.15 10.85 8.95 – 10.85 – – – – – – – – – 19 10 – – 57 – – – – – – – 9 5
Service-producing industries ............ 2,266 14.87 13.72 12.35 – 17.73 – – – – – – – – – – – – – 8 1 28 13 8 3 5 19 – 14Transportation and utilities ........... 1,510 15.69 16.19 12.65 – 17.73 – – – – – – – – – – – – – 10 – 26 2(� ) 1 5 8 29 – 20
Warehouse Specialists .............................. 5,700 13.78 12.33 11.49 – 17.73 – – – – – – – 1 1 3 2 8 3 4 26 6 4 1 2(� ) 2(� ) 30 9 2(� )Private industry ......................................... 5,599 13.85 12.33 11.63 – 17.73 – – – – – – – 1 1 3 2 9 3 4 26 7 4 1 2(� ) 2(� ) 31 9 2(� )
Goods-producing industries .................. 952 9.87 9.35 9.15 – 10.25 – – – – – – – – – 9 3 41 17 13 7 4 5 – – – – – –Manufacturing ................................... 946 9.88 9.35 9.15 – 10.25 – – – – – – – – – 9 3 42 17 13 7 4 5 – – – – – –
Service-producing industries ................ 4,647 14.67 13.75 11.85 – 17.73 – – – – – – – 1 1 2 1 2 2(� ) 2 30 7 4 1 2(� ) 2(� ) 37 11 2(� )Transportation and utilities ............... 2,036 17.10 17.73 17.73 – 17.73 – – – – – – – – – – 2(� ) 2(� ) – 2(� ) 2 2 8 1 1 1 85 1 2(� )
State and local government ...................... 101 9.57 8.45 7.67 – 10.70 – – – – – – – 4 35 12 4 5 6 13 10 2 – 2 4 4 – – –
1 Excludes premium pay for overtime and for work on weekends, holidays, and late shifts. Also excluded are performancebonuses and lump-sum payments of the type negotiated in the auto and aerospace industries, as well as profit-sharing payments,attendance bonuses, Christmas or year-end bonuses, and other nonproduction bonuses. Pay increases, but not bonuses, undercost-of-living clauses, and incentive payments, however, are included. See Appendix A for definitions and methods used tocompute means, medians, and middle ranges.
2 Less than 0.5 percent.
NOTE: Because of rounding, sums of individual intervals may not equal 100 percent. Dashes indicate that no data were reported orthat data did not meet publication criteria. Overall occupation or occupational levels may include data for categories not shownseparately.
17

Table A-6. Establishments employing 500 workers or more: Weekly hours and pay of professional and administrative occupations, Atlanta, GA, May 1995
Occupation and levelNumber
ofworkers
Averageweeklyhours1
(stan-dard)
Weekly pay (in dollars)2 Percent of workers receiving straight-time weekly pay (in dollars) of—
Mean Median Middle range
350and
under400
400-
500
500-
600
600-
700
700-
800
800-
900
900-
1000
1000-
1100
1100-
1200
1200-
1300
1300-
1400
1400-
1500
1500-
1600
1600-
1700
1700-
1800
1800-
1900
1900-
2000
2000-
2100
2100-
2200
2200andover
PROFESSIONAL OCCUPATIONS
AccountantsLevel I ....................................................... 265 39.7 $504 $500 $460 – $542 2 49 44 6 3(� ) – – – – – – – – – – – – – – –
Private industry ..................................... 214 39.6 509 500 466 – 563 2 44 46 7 3(� ) – – – – – – – – – – – – – – –Service-producing industries ............ 194 39.7 507 500 477 – 553 2 43 50 4 1 – – – – – – – – – – – – – – –
State and local government .................. 51 39.9 483 484 445 – 515 – 67 33 – – – – – – – – – – – – – – – – –
Level II ...................................................... 584 39.7 617 608 538 – 686 – 10 38 31 19 3 – – – – – – – – – – – – – –Private industry ..................................... 426 39.7 620 613 536 – 692 – 10 36 29 21 4 – – – – – – – – – – – – – –
Goods-producing industries .............. 85 39.3 706 750 656 – 762 – – 12 27 59 2 – – – – – – – – – – – – – –Manufacturing ............................... 85 39.3 706 750 656 – 762 – – 12 27 59 2 – – – – – – – – – – – – – –
Service-producing industries ............ 341 39.8 599 580 536 – 652 – 13 43 29 12 4 – – – – – – – – – – – – – –State and local government .................. 158 39.9 608 604 542 – 660 – 8 41 37 14 – – – – – – – – – – – – – – –
Level III ..................................................... 627 39.6 794 785 698 – 883 – – 8 18 28 24 15 4 2 – – – – – – – – – – –Private industry ..................................... 488 39.6 810 800 716 – 909 – – 7 15 28 25 18 5 2 – – – – – – – – – – –
Goods-producing industries .............. 110 39.1 882 889 800 – 962 – – – 6 18 28 35 13 – – – – – – – – – – – –Manufacturing ............................... 110 39.1 882 889 800 – 962 – – – 6 18 28 35 13 – – – – – – – – – – – –
Service-producing industries ............ 378 39.7 789 772 699 – 881 – – 10 17 30 24 13 3 3 – – – – – – – – – – –Transportation and utilities ........... 109 40.0 773 731 673 – 844 – – 10 26 30 15 9 5 6 – – – – – – – – – – –
State and local government .................. 139 39.8 738 725 664 – 816 – – 10 31 31 22 5 1 – – – – – – – – – – – –
Level IV ..................................................... 404 39.7 1,007 1,018 850 – 1,149 – – 3(� ) 3 11 18 14 20 20 10 4 1 – – – – – – – –Private industry ..................................... 353 39.6 1,018 1,027 870 – 1,156 – – 3(� ) 3 10 17 13 20 21 11 4 1 – – – – – – – –
Goods-producing industries .............. 113 39.1 992 990 836 – 1,137 – – – 4 12 18 18 16 22 8 2 2 – – – – – – – –Manufacturing ............................... 113 39.1 992 990 836 – 1,137 – – – 4 12 18 18 16 22 8 2 2 – – – – – – – –
Service-producing industries ............ 240 39.9 1,030 1,033 873 – 1,179 – – 3(� ) 2 9 17 11 21 21 12 5 3(� ) – – – – – – – –Transportation and utilities ........... 104 40.0 977 916 808 – 1,175 – – 1 2 19 27 7 9 18 13 3 1 – – – – – – – –
State and local government .................. 51 39.9 935 933 820 – 1,083 – – – 6 16 24 18 22 14 2 – – – – – – – – – –
Level V ...................................................... 142 39.6 1,259 1,235 1,096 – 1,334 – – – – 1 6 12 7 11 30 13 8 3 – – – 8 – – –Private industry ..................................... 124 39.6 1,300 1,249 1,165 – 1,377 – – – – – 6 5 6 13 33 15 10 3 – – – 9 – – –
Service-producing industries ............ 107 39.6 1,306 1,246 1,154 – 1,397 – – – – – 7 6 7 12 33 13 9 4 – – – 10 – – –Transportation and utilities ........... 36 40.0 1,189 – – – – – – – – – 6 11 11 19 31 11 8 3 – – – – – – –
State and local government .................. 18 40.0 973 964 932 – 992 – – – – 6 11 61 11 – 11 – – – – – – – – – –
AttorneysLevel II:
State and local government .................. 15 39.8 913 938 855 – 969 – – – – – 47 53 – – – – – – – – – – – – –
Level III ..................................................... 196 39.0 1,396 1,419 1,296 – 1,486 – – – – 1 – 7 4 4 11 13 39 12 2 2 6 – – – –Private industry ..................................... 168 39.0 1,444 1,448 1,347 – 1,507 – – – – – – 2 1 3 11 13 45 14 2 2 7 – – – –
Service-producing industries ............ 151 39.1 1,431 1,448 1,317 – 1,486 – – – – – – 2 1 3 12 12 48 13 – 1 7 – – – –Transportation and utilities ........... 48 39.4 1,363 1,314 1,267 – 1,474 – – – – – – – 2 10 25 27 19 13 – 4 – – – – –
State and local government .................. 28 39.4 1,110 – – – – – – – – 4 – 36 18 7 11 18 4 4 – – – – – – –
Level IV ..................................................... 99 39.3 1,780 1,817 1,552 – 2,015 – – – – – – – – – 3 10 7 10 11 6 17 9 12 7 7Private industry ..................................... 93 39.2 1,801 1,819 1,577 – 2,015 – – – – – – – – – 1 11 8 8 11 6 18 10 13 8 8
Service-producing industries ............ 67 39.9 1,694 – – – – – – – – – – – – – 1 15 10 10 13 7 21 7 4 9 –State and local government .................. 6 40.0 1,461 – – – – – – – – – – – – – 33 – – 50 17 – – – – – –
See footnotes at end of table.
18

Table A-6. Establishments employing 500 workers or more: Weekly hours and pay of professional and administrative occupations, Atlanta, GA, May 1995 — Continued
Occupation and levelNumber
ofworkers
Averageweeklyhours1
(stan-dard)
Weekly pay (in dollars)2 Percent of workers receiving straight-time weekly pay (in dollars) of—
Mean Median Middle range
350and
under400
400-
500
500-
600
600-
700
700-
800
800-
900
900-
1000
1000-
1100
1100-
1200
1200-
1300
1300-
1400
1400-
1500
1500-
1600
1600-
1700
1700-
1800
1800-
1900
1900-
2000
2000-
2100
2100-
2200
2200andover
EngineersLevel I ....................................................... 86 39.7 $620 $623 $596 – $644 – – 30 65 2 2 – – – – – – – – – – – – – –
State and local government .................. 42 40.0 602 623 576 – 623 – – 45 55 – – – – – – – – – – – – – – – –
Level II ...................................................... 492 40.0 728 722 680 – 769 – – 4 35 45 16 1 – – – – – – – – – – – – –Private industry ..................................... 301 40.0 738 728 692 – 769 – – 1 32 50 16 1 – – – – – – – – – – – – –
Goods-producing industries .............. 197 40.0 720 712 683 – 750 – – – 39 52 8 1 – – – – – – – – – – – – –Manufacturing ............................... 197 40.0 720 712 683 – 750 – – – 39 52 8 1 – – – – – – – – – – – – –
State and local government .................. 191 40.0 712 701 647 – 762 – – 10 39 36 15 – – – – – – – – – – – – – –
Level III ..................................................... 888 39.8 872 867 785 – 935 – – 3(� ) 4 25 30 28 10 3 3(� ) – – – – – – – – – –Private industry ..................................... 693 39.8 892 885 808 – 948 – – – 1 22 31 31 12 4 3(� ) – – – – – – – – – –
Goods-producing industries .............. 511 39.7 875 870 791 – 931 – – – 1 26 32 30 11 1 3(� ) – – – – – – – – – –Manufacturing ............................... 511 39.7 875 870 791 – 931 – – – 1 26 32 30 11 1 3(� ) – – – – – – – – – –
Service-producing industries ............ 182 40.0 938 934 854 – 1,015 – – – 1 11 28 34 15 11 1 – – – – – – – – – –Transportation and utilities ........... 116 40.0 930 926 853 – 986 – – – 1 10 29 38 11 9 1 – – – – – – – – – –
State and local government .................. 195 39.9 803 788 728 – 892 – – 1 15 36 26 20 2 – – – – – – – – – – – –
Level IV ..................................................... 1,316 39.8 1,034 1,013 923 – 1,154 – – – 1 2 16 26 21 16 15 3 3(� ) – – – – – – – –Private industry ..................................... 1,138 39.9 1,051 1,030 936 – 1,175 – – – – 1 15 25 21 18 16 3 3(� ) – – – – – – – –
Goods-producing industries .............. 895 39.8 1,013 999 916 – 1,100 – – – – 1 19 30 24 16 8 2 3(� ) – – – – – – – –Manufacturing ............................... 895 39.8 1,013 999 916 – 1,100 – – – – 1 19 30 24 16 8 2 3(� ) – – – – – – – –
Service-producing industries ............ 243 40.0 1,193 1,216 1,142 – 1,270 – – – – – 1 6 10 25 49 10 – – – – – – – – –Transportation and utilities ........... 121 40.0 1,185 1,209 1,115 – 1,274 – – – – – 2 3 16 25 43 12 – – – – – – – – –
State and local government .................. 178 39.8 919 932 832 – 1,004 – – – 7 11 26 31 17 5 3 – – – – – – – – – –
Level V ...................................................... 927 39.9 1,247 1,244 1,133 – 1,361 – – – – – 3(� ) 5 14 21 22 20 14 2 1 3(� ) 3(� ) 3(� ) 3(� ) – –Private industry ..................................... 874 39.9 1,259 1,251 1,154 – 1,365 – – – – – 3(� ) 3 13 21 23 21 14 2 1 3(� ) 3(� ) 3(� ) 3(� ) – –
Service-producing industries ............ 97 40.0 1,404 1,392 1,319 – 1,454 – – – – – – 1 – 5 11 38 28 6 4 1 4 1 – – –State and local government .................. 53 39.7 1,057 1,013 984 – 1,108 – – – – – 4 28 40 17 6 – 6 – – – – – – – –
Level VI ..................................................... 241 39.7 1,539 1,531 1,456 – 1,600 – – – – – – – 1 5 2 7 22 37 14 5 2 2 2 1 3(� )Private industry ..................................... 223 39.7 1,569 1,546 1,479 – 1,616 – – – – – – – – – 1 8 24 40 14 5 2 2 2 1 3(� )
Goods-producing industries .............. 196 39.7 1,570 1,547 1,479 – 1,607 – – – – – – – – – 1 7 26 40 13 6 3 2 3 1 –Manufacturing ............................... 196 39.7 1,570 1,547 1,479 – 1,607 – – – – – – – – – 1 7 26 40 13 6 3 2 3 1 –
Registered NursesLevel I ....................................................... 198 39.6 530 532 509 – 545 – 9 88 3 1 – – – – – – – – – – – – – – –
Private industry ..................................... 198 39.6 530 532 509 – 545 – 9 88 3 1 – – – – – – – – – – – – – – –Service-producing industries ............ 198 39.6 530 532 509 – 545 – 9 88 3 1 – – – – – – – – – – – – – – –
Level II ...................................................... 7,216 39.9 673 666 586 – 752 – 3(� ) 29 32 29 9 1 3(� ) – – – – – – – – – – – –Private industry ..................................... 5,506 39.8 693 690 614 – 759 – 3(� ) 21 31 35 11 2 3(� ) – – – – – – – – – – – –
Service-producing industries ............ 5,491 39.8 693 690 614 – 759 – 3(� ) 21 31 34 11 2 3(� ) – – – – – – – – – – – –State and local government .................. 1,710 40.0 609 586 560 – 645 – 1 55 33 10 2 3(� ) – – – – – – – – – – – – –
Level III ..................................................... 640 40.0 817 795 719 – 906 – – – 14 36 24 18 7 1 – – – – – – – – – – –Private industry ..................................... 278 40.0 902 920 826 – 958 – – – 4 14 25 38 17 2 – – – – – – – – – – –
Service-producing industries ............ 278 40.0 902 920 826 – 958 – – – 4 14 25 38 17 2 – – – – – – – – – – –
See footnotes at end of table.
19

Table A-6. Establishments employing 500 workers or more: Weekly hours and pay of professional and administrative occupations, Atlanta, GA, May 1995 — Continued
Occupation and levelNumber
ofworkers
Averageweeklyhours1
(stan-dard)
Weekly pay (in dollars)2 Percent of workers receiving straight-time weekly pay (in dollars) of—
Mean Median Middle range
350and
under400
400-
500
500-
600
600-
700
700-
800
800-
900
900-
1000
1000-
1100
1100-
1200
1200-
1300
1300-
1400
1400-
1500
1500-
1600
1600-
1700
1700-
1800
1800-
1900
1900-
2000
2000-
2100
2100-
2200
2200andover
ADMINISTRATIVE OCCUPATIONS
Budget AnalystsLevel I:
State and local government .................. 21 40.0 $541 $560 $496 – $568 – 29 62 5 5 – – – – – – – – – – – – – – –
Level II ...................................................... 58 39.7 617 – – – – – 17 22 52 7 – – – 2 – – – – – – – – – – –State and local government .................. 50 40.0 597 613 515 – 664 – 20 26 48 6 – – – – – – – – – – – – – – –
Level III ..................................................... 63 39.2 804 – – – – – – 3 17 27 35 8 10 – – – – – – – – – – – –State and local government .................. 33 40.0 741 – – – – – – 6 27 36 30 – – – – – – – – – – – – – –
Buyers/Contracting SpecialistsLevel I ....................................................... 87 39.9 492 485 454 – 506 – 70 22 8 – – – – – – – – – – – – – – – –
Private industry ..................................... 73 39.9 495 – – – – – 71 19 10 – – – – – – – – – – – – – – – –State and local government .................. 14 39.8 471 – – – – – 64 36 – – – – – – – – – – – – – – – – –
Level II ...................................................... 231 39.8 650 657 577 – 696 – 6 25 44 17 5 2 – – – – – – – – – – – – –Private industry ..................................... 179 39.8 659 668 597 – 705 – 7 19 45 20 6 3 – – – – – – – – – – – – –
Goods-producing industries .............. 86 39.6 653 654 576 – 722 – 6 24 37 24 6 2 – – – – – – – – – – – – –Manufacturing ............................... 86 39.6 653 654 576 – 722 – 6 24 37 24 6 2 – – – – – – – – – – – – –
Service-producing industries ............ 93 40.0 663 675 604 – 690 – 9 14 53 16 5 3 – – – – – – – – – – – – –State and local government .................. 52 39.9 619 599 552 – 682 – 4 46 38 8 4 – – – – – – – – – – – – – –
Level III ..................................................... 279 39.8 838 834 750 – 920 – – 2 11 25 32 19 8 3 – – – – – – – – – – –Private industry ..................................... 246 39.9 848 841 764 – 933 – – 2 8 24 34 20 9 3 – – – – – – – – – – –
Goods-producing industries .............. 175 39.9 847 846 773 – 914 – – 1 7 24 37 25 5 2 – – – – – – – – – – –Manufacturing ............................... 175 39.9 847 846 773 – 914 – – 1 7 24 37 25 5 2 – – – – – – – – – – –
Service-producing industries ............ 71 40.0 851 – – – – – – 7 10 23 27 8 18 7 – – – – – – – – – – –Transportation and utilities ........... 51 40.0 897 849 800 – 1,058 – – 8 – 16 31 10 25 10 – – – – – – – – – – –
State and local government .................. 33 38.6 767 – – – – – – – 30 39 18 12 – – – – – – – – – – – – –
Level IV ..................................................... 83 39.6 986 962 885 – 1,058 – – – – 5 20 34 23 10 5 1 1 1 – – – – – – –Private industry ..................................... 80 39.7 989 976 889 – 1,058 – – – – 5 20 32 24 10 5 1 1 1 – – – – – – –
Computer ProgrammersLevel II ...................................................... 392 39.9 610 606 566 – 661 – 9 34 43 12 2 – – – – – – – – – – – – – –
Private industry ..................................... 317 39.9 617 607 576 – 652 – 6 33 50 9 2 – – – – – – – – – – – – – –Service-producing industries ............ 189 39.8 611 602 561 – 670 – 10 37 40 12 2 – – – – – – – – – – – – – –
State and local government .................. 75 40.0 578 542 511 – 690 – 21 41 16 21 – – – – – – – – – – – – – – –
Level III ..................................................... 358 39.9 749 755 658 – 842 – – 15 21 27 26 11 – – – – – – – – – – – – –Private industry ..................................... 295 39.9 765 769 673 – 859 – – 11 21 27 27 14 – – – – – – – – – – – – –
Service-producing industries ............ 163 39.8 697 685 617 – 769 – – 20 34 34 12 1 – – – – – – – – – – – – –State and local government .................. 63 40.0 676 668 571 – 793 – – 35 17 25 22 – – – – – – – – – – – – – –
Level IV ..................................................... 345 39.8 837 830 736 – 932 – – 2 17 21 23 24 8 4 – – – – – – – – – – –Private industry ..................................... 245 39.8 873 877 769 – 965 – – 3(� ) 8 22 25 28 11 5 – – – – – – – – – – –
Service-producing industries ............ 186 39.7 829 821 760 – 910 – – 1 11 30 31 25 1 2 – – – – – – – – – – –State and local government .................. 100 40.0 748 731 648 – 857 – – 6 40 19 19 14 2 – – – – – – – – – – – –
See footnotes at end of table.
20

Table A-6. Establishments employing 500 workers or more: Weekly hours and pay of professional and administrative occupations, Atlanta, GA, May 1995 — Continued
Occupation and levelNumber
ofworkers
Averageweeklyhours1
(stan-dard)
Weekly pay (in dollars)2 Percent of workers receiving straight-time weekly pay (in dollars) of—
Mean Median Middle range
350and
under400
400-
500
500-
600
600-
700
700-
800
800-
900
900-
1000
1000-
1100
1100-
1200
1200-
1300
1300-
1400
1400-
1500
1500-
1600
1600-
1700
1700-
1800
1800-
1900
1900-
2000
2000-
2100
2100-
2200
2200andover
Level V ...................................................... 104 39.5 $991 $975 $917 – $1,060 – – – – 2 19 36 29 13 – 2 – – – – – – – – –Private industry ..................................... 104 39.5 991 975 917 – 1,060 – – – – 2 19 36 29 13 – 2 – – – – – – – – –
Service-producing industries ............ 104 39.5 991 975 917 – 1,060 – – – – 2 19 36 29 13 – 2 – – – – – – – – –
Computer Systems AnalystsLevel I ....................................................... 591 38.8 759 756 663 – 894 – 3(� ) 16 24 21 14 24 – – – – – – – – – – – – –
Private industry ..................................... 516 38.6 776 763 674 – 930 – – 13 23 22 15 28 – – – – – – – – – – – – –State and local government .................. 75 39.7 642 625 562 – 704 – 3 37 33 16 11 – – – – – – – – – – – – – –
Level II ...................................................... 2,070 38.8 927 942 846 – 1,037 – – 3(� ) 4 11 23 22 38 3(� ) – 3(� ) – – – – – – – – –Private industry ..................................... 1,969 38.8 932 946 850 – 1,037 – – 3(� ) 4 11 23 23 39 3(� ) – 3(� ) – – – – – – – – –
Goods-producing industries .............. 69 38.8 929 – – – – – – – 1 6 29 36 28 – – – – – – – – – – – –Manufacturing ............................... 69 38.8 929 – – – – – – – 1 6 29 36 28 – – – – – – – – – – – –
Service-producing industries ............ 1,900 38.8 932 946 850 – 1,037 – – 3(� ) 4 11 22 22 40 3(� ) – 3(� ) – – – – – – – – –State and local government .................. 101 39.8 841 847 746 – 942 – – 5 11 19 37 11 18 – – – – – – – – – – – –
Level III ..................................................... 1,043 39.7 1,014 1,016 935 – 1,090 – – – 3(� ) 2 12 29 34 18 5 3(� ) – – – – – – – – –Private industry ..................................... 985 39.6 1,025 1,022 949 – 1,096 – – – – 3(� ) 11 30 35 19 5 1 – – – – – – – – –
Service-producing industries ............ 879 39.8 1,013 1,013 938 – 1,078 – – – – 3(� ) 12 33 34 16 4 3(� ) – – – – – – – – –State and local government .................. 58 39.9 840 830 786 – 896 – – – 7 31 38 14 10 – – – – – – – – – – – –
Level IV ..................................................... 356 39.8 1,213 1,211 1,112 – 1,294 – – – – – – 6 15 21 35 13 9 1 3(� ) 3(� ) – – – – –Private industry ..................................... 356 39.8 1,213 1,211 1,112 – 1,294 – – – – – – 6 15 21 35 13 9 1 3(� ) 3(� ) – – – – –
Service-producing industries ............ 344 39.8 1,207 1,210 1,110 – 1,285 – – – – – – 6 15 22 36 12 7 1 3(� ) 3(� ) – – – – –
Computer Systems AnalystSupervisors/Managers
Level I ....................................................... 138 39.9 1,078 1,067 983 – 1,154 – – – – 4 5 19 28 23 12 9 – – – – – – – – –Private industry ..................................... 83 40.0 1,131 1,145 1,000 – 1,265 – – – – – 2 20 17 25 20 14 – – – – – – – – –
Level II ...................................................... 234 39.9 1,346 1,340 1,248 – 1,446 – – – – – – 3(� ) 4 12 24 25 18 13 3 1 – – – – –Private industry ..................................... 216 39.9 1,362 1,350 1,254 – 1,462 – – – – – – – 3 9 23 27 19 14 3 1 – – – – –
Service-producing industries ............ 214 39.9 1,359 1,346 1,254 – 1,459 – – – – – – – 3 9 23 28 19 14 2 1 – – – – –
Personnel SpecialistsLevel II ...................................................... 283 39.7 641 631 545 – 726 – 8 33 27 25 6 1 – – – – – – – – – – – – –
Private industry ..................................... 201 39.6 664 667 568 – 733 – 8 23 27 32 8 1 – – – – – – – – – – – – –Service-producing industries ............ 158 39.6 676 676 590 – 749 – 8 19 25 35 10 2 – – – – – – – – – – – – –
Transportation and utilities ........... 35 40.0 696 – – – – – 9 29 11 17 26 9 – – – – – – – – – – – – –State and local government .................. 82 39.9 587 585 535 – 612 – 9 57 26 9 – – – – – – – – – – – – – – –
Level III ..................................................... 415 39.7 788 760 669 – 890 – 3(� ) 6 27 27 17 13 3 6 3(� ) – – – – – – – – – –Private industry ..................................... 316 39.7 815 774 685 – 932 – 3(� ) 3 22 28 16 18 4 8 1 – – – – – – – – – –
Goods-producing industries .............. 86 39.9 825 808 673 – 938 – – – 27 21 19 24 6 1 2 – – – – – – – – – –Manufacturing ............................... 86 39.9 825 808 673 – 938 – – – 27 21 19 24 6 1 2 – – – – – – – – – –
Service-producing industries ............ 230 39.6 811 773 693 – 906 – 3(� ) 5 21 30 15 15 3 10 – – – – – – – – – – –Transportation and utilities ........... 62 40.0 788 768 654 – 901 – 2 6 21 31 15 13 11 2 – – – – – – – – – – –
State and local government .................. 99 39.8 703 686 634 – 784 – – 15 41 24 19 – – – – – – – – – – – – – –
See footnotes at end of table.
21

Table A-6. Establishments employing 500 workers or more: Weekly hours and pay of professional and administrative occupations, Atlanta, GA, May 1995 — Continued
Occupation and levelNumber
ofworkers
Averageweeklyhours1
(stan-dard)
Weekly pay (in dollars)2 Percent of workers receiving straight-time weekly pay (in dollars) of—
Mean Median Middle range
350and
under400
400-
500
500-
600
600-
700
700-
800
800-
900
900-
1000
1000-
1100
1100-
1200
1200-
1300
1300-
1400
1400-
1500
1500-
1600
1600-
1700
1700-
1800
1800-
1900
1900-
2000
2000-
2100
2100-
2200
2200andover
Level IV ..................................................... 264 39.8 $985 $965 $874 – $1,084 – – – 2 7 23 25 23 12 6 1 1 – – – – – – – –Private industry ..................................... 223 39.8 1,007 991 904 – 1,085 – – – 3(� ) 2 22 29 25 13 8 1 1 – – – – – – – –
Goods-producing industries .............. 102 39.7 1,003 962 896 – 1,085 – – – – 2 26 28 22 11 8 1 2 – – – – – – – –Manufacturing ............................... 102 39.7 1,003 962 896 – 1,085 – – – – 2 26 28 22 11 8 1 2 – – – – – – – –
Service-producing industries ............ 121 39.9 1,011 1,001 935 – 1,067 – – – 1 2 17 29 28 14 7 1 1 – – – – – – – –Transportation and utilities ........... 29 40.0 1,039 – – – – – – – – – 17 34 21 7 14 3 3 – – – – – – – –
State and local government .................. 41 39.9 864 834 754 – 909 – – – 7 34 32 5 15 7 – – – – – – – – – – –
Level V ...................................................... 140 39.8 1,205 1,185 1,096 – 1,308 – – – – 1 4 7 16 26 16 14 9 4 1 1 – – – – –Private industry ..................................... 123 39.8 1,237 1,222 1,106 – 1,335 – – – – – – 3 18 28 17 16 11 5 1 2 – – – – –
Service-producing industries ............ 87 39.9 1,262 1,249 1,127 – 1,369 – – – – – – 2 14 28 17 16 14 7 – 2 – – – – –Transportation and utilities ........... 43 40.0 1,292 1,249 1,142 – 1,448 – – – – – – 2 5 30 21 14 14 9 – 5 – – – – –
Tax CollectorsLevel II ...................................................... 28 40.0 562 572 475 – 638 4 25 32 36 4 – – – – – – – – – – – – – – –
State and local government .................. 28 40.0 562 572 475 – 638 4 25 32 36 4 – – – – – – – – – – – – – – –
Level III ..................................................... 12 40.0 709 – – – – – – – 50 50 – – – – – – – – – – – – – – –State and local government .................. 12 40.0 709 – – – – – – – 50 50 – – – – – – – – – – – – – – –
1 Standard hours reflect the workweek for which employees receive their regular straight-time salaries (exclusive of pay forovertime at regular and/or premium rates), and the earnings correspond to these weekly hours.
2 Excludes premium pay for overtime and for work on weekends, holidays, and late shifts. Also excluded are performancebonuses and lump-sum payments of the type negotiated in the auto and aerospace industries, as well as profit-sharingpayments, attendance bonuses, Christmas or year-end bonuses, and other nonproduction bonuses. Pay increases, but notbonuses, under cost-of-living clauses, and incentive payments, however, are included. See Appendix A for definitions and
methods used to compute means, medians, and middle ranges.3 Less than 0.5 percent.
NOTE: Because of rounding, sums of individual intervals may not equal 100 percent. Dashes indicate that no data werereported or that data did not meet publication criteria. Overall occupation or occupational levels may include data forcategories not shown separately.
22

Table A-7. Establishments employing 500 workers or more: Weekly hours and pay of technical and protective service occupations, Atlanta, GA, May 1995
Occupation and levelNumber
ofworkers
Averageweeklyhours1
(stan-dard)
Weekly pay (in dollars)2 Percent of workers receiving straight-time weekly pay (in dollars) of—
Mean Median Middle range Under225
225-
250
250-
275
275-
300
300-
325
325-
350
350-
375
375-
400
400-
425
425-
450
450-
475
475-
500
500-
525
525-
550
550-
600
600-
650
650-
700
700-
750
750-
800
800-
850
850-
900
TECHNICAL OCCUPATIONS
Computer OperatorsLevel I ....................................................... 52 39.8 $342 – – – – – – 17 6 17 15 12 12 21 – – – – – – – – – – – –
Level II ...................................................... 374 39.4 505 $485 $423 – $547 – – – – 2 1 6 9 13 10 7 6 2 25 7 2 1 1 9 – –Private industry ..................................... 311 39.3 511 487 423 – 547 – – – – 1 1 6 9 12 10 6 5 2 29 4 2 1 1 11 – –
Goods-producing industries .............. 75 40.0 584 – – – – – – – – – – 5 20 15 5 4 5 1 – – – – – 44 – –Manufacturing ............................... 75 40.0 584 – – – – – – – – – – 5 20 15 5 4 5 1 – – – – – 44 – –
Service-producing industries ............ 236 39.1 488 511 423 – 547 – – – – 1 1 7 6 11 11 7 4 3 39 5 3 1 1 – – –State and local government .................. 63 39.9 473 463 414 – 530 – – – – 6 – 2 5 19 10 13 14 3 6 22 – – – – – –
Level III ..................................................... 345 39.3 553 560 514 – 588 – – – – – – – 2 3(� ) 3 4 10 19 7 33 16 6 – – – –Private industry ..................................... 285 39.2 554 564 514 – 581 – – – – – – – 2 – 2 2 10 21 5 35 16 5 – – – –
Service-producing industries ............ 203 39.0 563 576 527 – 598 – – – – – – – 3 – 3 3 7 7 6 45 18 6 – – – –State and local government .................. 60 39.8 548 541 495 – 608 – – – – – – – – 2 8 10 12 8 13 20 17 10 – – – –
Level IV ..................................................... 135 39.6 646 635 585 – 690 – – – – – – – – – – 1 3 6 2 16 36 13 12 4 8 –Private industry ..................................... 88 39.4 676 650 610 – 745 – – – – – – – – – – – – 7 – 7 39 11 18 6 13 –
Service-producing industries ............ 85 39.4 677 650 610 – 745 – – – – – – – – – – – – 7 – 7 39 11 18 6 13 –State and local government .................. 47 40.0 589 585 550 – 635 – – – – – – – – – – 2 9 4 6 32 30 17 – – – –
DraftersLevel II ...................................................... 214 38.6 523 547 515 – 547 – – – – – – 3 6 3 1 5 7 5 61 7 4 – – – – –
Level III ..................................................... 101 39.9 589 608 495 – 659 – – – – – – – – 3 8 7 9 4 6 9 27 9 17 2 – –State and local government .................. 52 39.8 525 515 458 – 604 – – – – – – – – 6 15 13 10 8 8 15 21 4 – – – –
Engineering TechniciansLevel II ...................................................... 161 38.1 530 563 496 – 563 – – – – – – – – – 6 8 16 12 1 57 – – – – – –
Private industry ..................................... 160 38.1 530 563 496 – 563 – – – – – – – – – 6 8 16 13 1 57 – – – – – –
Level IV ..................................................... 100 39.6 738 742 678 – 791 – – – – – – – – – – – – – – 3 5 21 27 21 21 2Private industry ..................................... 95 39.6 743 742 698 – 792 – – – – – – – – – – – – – – 3 1 22 27 22 22 2
Goods-producing industries .............. 95 39.6 743 742 698 – 792 – – – – – – – – – – – – – – 3 1 22 27 22 22 2Manufacturing ............................... 95 39.6 743 742 698 – 792 – – – – – – – – – – – – – – 3 1 22 27 22 22 2
Engineering Technicians, CivilLevel I ....................................................... 66 40.0 361 338 330 – 376 – – – – 24 35 11 12 6 5 6 2 – – – – – – – – –
State and local government .................. 66 40.0 361 338 330 – 376 – – – – 24 35 11 12 6 5 6 2 – – – – – – – – –
Level II ...................................................... 82 40.0 428 406 387 – 495 – – – – – – 17 27 22 5 2 5 17 5 – – – – – – –State and local government .................. 82 40.0 428 406 387 – 495 – – – – – – 17 27 22 5 2 5 17 5 – – – – – – –
Level III ..................................................... 187 40.0 538 538 474 – 608 – – – – – – – 1 7 4 20 5 10 5 22 19 5 – 2 – –State and local government .................. 187 40.0 538 538 474 – 608 – – – – – – – 1 7 4 20 5 10 5 22 19 5 – 2 – –
Level IV ..................................................... 301 39.9 608 590 515 – 690 – – – – – – – – – 3(� ) 1 3 24 5 16 18 12 12 8 1 –State and local government .................. 298 39.9 606 590 515 – 677 – – – – – – – – – 3(� ) 1 3 24 5 16 18 12 12 7 – –
See footnotes at end of table.
23
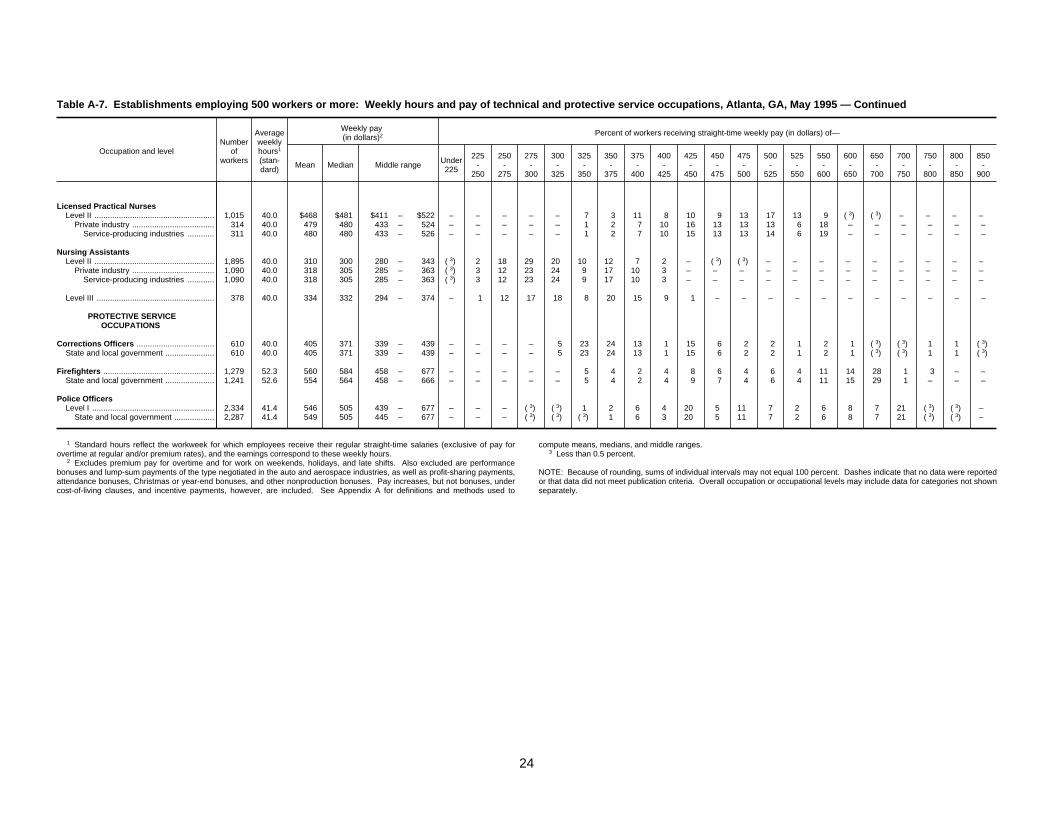
Table A-7. Establishments employing 500 workers or more: Weekly hours and pay of technical and protective service occupations, Atlanta, GA, May 1995 — Continued
Occupation and levelNumber
ofworkers
Averageweeklyhours1
(stan-dard)
Weekly pay (in dollars)2 Percent of workers receiving straight-time weekly pay (in dollars) of—
Mean Median Middle range Under225
225-
250
250-
275
275-
300
300-
325
325-
350
350-
375
375-
400
400-
425
425-
450
450-
475
475-
500
500-
525
525-
550
550-
600
600-
650
650-
700
700-
750
750-
800
800-
850
850-
900
Licensed Practical NursesLevel II ...................................................... 1,015 40.0 $468 $481 $411 – $522 – – – – – 7 3 11 8 10 9 13 17 13 9 3(� ) 3(� ) – – – –
Private industry ..................................... 314 40.0 479 480 433 – 524 – – – – – 1 2 7 10 16 13 13 13 6 18 – – – – – –Service-producing industries ............ 311 40.0 480 480 433 – 526 – – – – – 1 2 7 10 15 13 13 14 6 19 – – – – – –
Nursing AssistantsLevel II ...................................................... 1,895 40.0 310 300 280 – 343 3(� ) 2 18 29 20 10 12 7 2 – 3(� ) 3(� ) – – – – – – – – –
Private industry ..................................... 1,090 40.0 318 305 285 – 363 3(� ) 3 12 23 24 9 17 10 3 – – – – – – – – – – – –Service-producing industries ............ 1,090 40.0 318 305 285 – 363 3(� ) 3 12 23 24 9 17 10 3 – – – – – – – – – – – –
Level III ..................................................... 378 40.0 334 332 294 – 374 – 1 12 17 18 8 20 15 9 1 – – – – – – – – – – –
PROTECTIVE SERVICEOCCUPATIONS
Corrections Officers ................................... 610 40.0 405 371 339 – 439 – – – – 5 23 24 13 1 15 6 2 2 1 2 1 3(� ) 3(� ) 1 1 3(� )State and local government ...................... 610 40.0 405 371 339 – 439 – – – – 5 23 24 13 1 15 6 2 2 1 2 1 3(� ) 3(� ) 1 1 3(� )
Firefighters .................................................. 1,279 52.3 560 584 458 – 677 – – – – – 5 4 2 4 8 6 4 6 4 11 14 28 1 3 – –State and local government ...................... 1,241 52.6 554 564 458 – 666 – – – – – 5 4 2 4 9 7 4 6 4 11 15 29 1 – – –
Police OfficersLevel I ....................................................... 2,334 41.4 546 505 439 – 677 – – – 3(� ) 3(� ) 1 2 6 4 20 5 11 7 2 6 8 7 21 3(� ) 3(� ) –
State and local government .................. 2,287 41.4 549 505 445 – 677 – – – 3(� ) 3(� ) 3(� ) 1 6 3 20 5 11 7 2 6 8 7 21 3(� ) 3(� ) –
1 Standard hours reflect the workweek for which employees receive their regular straight-time salaries (exclusive of pay forovertime at regular and/or premium rates), and the earnings correspond to these weekly hours.
2 Excludes premium pay for overtime and for work on weekends, holidays, and late shifts. Also excluded are performancebonuses and lump-sum payments of the type negotiated in the auto and aerospace industries, as well as profit-sharing payments,attendance bonuses, Christmas or year-end bonuses, and other nonproduction bonuses. Pay increases, but not bonuses, undercost-of-living clauses, and incentive payments, however, are included. See Appendix A for definitions and methods used to
compute means, medians, and middle ranges.3 Less than 0.5 percent.
NOTE: Because of rounding, sums of individual intervals may not equal 100 percent. Dashes indicate that no data were reportedor that data did not meet publication criteria. Overall occupation or occupational levels may include data for categories not shownseparately.
24

Table A-8. Establishments employing 500 workers or more: Weekly hours and pay of clerical occupations, Atlanta, GA, May 1995
Occupation and levelNumber
ofworkers
Averageweeklyhours1
(stan-dard)
Weekly pay (in dollars)2 Percent of workers receiving straight-time weekly pay (in dollars) of—
Mean Median Middle range
200and
under225
225-
250
250-
275
275-
300
300-
325
325-
350
350-
375
375-
400
400-
425
425-
450
450-
500
500-
550
550-
600
600-
650
650-
700
700-
750
750-
800
800-
850
850-
900
900-
950
950-
1000
Clerks, AccountingLevel I ....................................................... 65 39.3 $345 – – – – – – 12 8 12 8 37 18 2 – 3 – – – – – – – – – –
Private industry ..................................... 57 39.2 343 – – – – – – 14 9 14 2 39 19 – – 4 – – – – – – – – – –Service-producing industries ............ 57 39.2 343 – – – – – – 14 9 14 2 39 19 – – 4 – – – – – – – – – –
Level II ...................................................... 1,273 39.4 423 $415 $370 – $473 – 3(� ) – 3 5 9 11 11 16 11 13 22 3(� ) – – – – – – – –Private industry ..................................... 1,065 39.2 430 424 378 – 502 – – – 2 4 7 10 11 16 12 12 26 3(� ) – – – – – – – –
Goods-producing industries .............. 192 39.7 408 410 378 – 439 – – – – – 5 14 29 15 24 9 4 – – – – – – – – –Manufacturing ............................... 192 39.7 408 410 378 – 439 – – – – – 5 14 29 15 24 9 4 – – – – – – – – –
Service-producing industries ............ 873 39.1 435 434 376 – 521 – – – 3 5 7 9 7 17 9 13 30 3(� ) – – – – – – – –State and local government .................. 208 40.0 384 375 343 – 429 – 3(� ) – 6 11 18 15 11 14 7 16 2 – – – – – – – – –
Level III ..................................................... 1,389 39.3 463 460 396 – 544 – – 3(� ) 3(� ) 1 7 9 9 13 8 15 13 23 2 3(� ) – – – – – –Private industry ..................................... 973 39.0 483 499 408 – 563 – – – 3(� ) 1 2 7 5 15 8 13 14 32 2 3(� ) – – – – – –
Goods-producing industries .............. 207 39.8 453 450 404 – 500 – – – – – – – 3(� ) 38 16 17 26 1 – 3(� ) – – – – – –Manufacturing ............................... 207 39.8 453 450 404 – 500 – – – – – – – 3(� ) 38 16 17 26 1 – 3(� ) – – – – – –
Service-producing industries ............ 766 38.8 491 506 419 – 563 – – – 1 1 3 9 6 9 6 12 10 40 3 – – – – – – –State and local government .................. 416 39.9 416 404 360 – 470 – – 3(� ) 3(� ) 1 18 13 17 10 10 18 12 1 3(� ) – – – – – – –
Level IV ..................................................... 974 39.4 522 525 445 – 615 – – – – – 3(� ) 2 10 7 6 19 9 18 28 3(� ) 3(� ) – – – – –Private industry ..................................... 715 39.2 550 576 477 – 615 – – – – – – 1 5 4 5 17 7 22 38 3(� ) 3(� ) – – – – –
Service-producing industries ............ 684 39.2 550 576 477 – 615 – – – – – – 1 5 4 6 16 6 22 39 3(� ) – – – – – –Transportation and utilities ........... 486 39.2 585 614 576 – 637 – – – – – – – – – 3 13 3 26 55 3(� ) – – – – – –
State and local government .................. 259 40.0 446 438 395 – 495 – – – – – 1 5 23 17 9 25 15 4 – – – – – – – –
Clerks, GeneralLevel I ....................................................... 64 39.9 257 – – – – 22 33 19 9 16 – – – – – 2 – – – – – – – – – –
State and local government .................. 16 40.0 287 288 265 – 309 – 6 25 31 38 – – – – – – – – – – – – – – – –
Level II ...................................................... 788 39.7 323 313 294 – 344 – 1 4 32 27 13 9 6 6 1 3(� ) 3(� ) 3(� ) 3(� ) – – – – – – –Private industry ..................................... 369 39.4 338 324 306 – 360 – 1 1 21 28 19 12 5 11 1 3(� ) 3(� ) 1 3(� ) – – – – – – –
Service-producing industries ............ 364 39.4 338 327 305 – 363 – 1 1 21 27 20 12 5 12 1 3(� ) 3(� ) 1 3(� ) – – – – – – –State and local government .................. 419 40.0 310 299 287 – 324 – 1 6 43 27 8 6 7 1 1 – – – – – – – – – – –
Level III ..................................................... 2,436 39.3 439 436 345 – 521 – 4 4 4 6 7 6 5 8 11 5 33 3(� ) 3(� ) 5 1 – – – – –Private industry ..................................... 1,891 39.1 459 508 361 – 521 – 5 3 4 4 7 4 2 5 9 5 42 3(� ) 1 7 1 – – – – –
Goods-producing industries .............. 140 40.0 501 491 337 – 668 – – – – 1 29 3 11 3 – 5 4 5 6 34 1 – – – – –Manufacturing ............................... 140 40.0 501 491 337 – 668 – – – – 1 29 3 11 3 – 5 4 5 6 34 1 – – – – –
Service-producing industries ............ 1,751 39.0 455 508 365 – 521 – 6 3 4 5 5 4 2 5 9 5 45 3(� ) 3(� ) 5 1 – – – – –Transportation and utilities ........... 1,131 38.6 519 521 508 – 521 – – – 3(� ) – 1 2 3(� ) 6 5 7 68 3(� ) 3(� ) 7 2 – – – – –
State and local government .................. 545 40.0 372 376 325 – 415 – – 8 7 12 8 12 14 18 17 4 1 – – – – – – – – –
Level IV ..................................................... 1,215 39.9 421 406 350 – 479 – – – – 10 15 10 11 10 7 20 12 3 2 3(� ) 3(� ) 3(� ) – – – –Private industry ..................................... 506 39.9 465 464 416 – 496 – – – – – 2 5 13 9 7 41 14 6 1 1 3(� ) 3(� ) – – – –
Service-producing industries ............ 499 39.9 463 463 415 – 495 – – – – – 2 5 13 10 7 42 14 6 1 1 3(� ) 3(� ) – – – –Transportation and utilities ........... 218 40.0 495 479 463 – 523 – – – – – 3(� ) 1 3 3 2 55 21 9 3 2 3(� ) 3(� ) – – – –
State and local government .................. 709 40.0 389 368 338 – 424 – – – – 18 24 13 10 10 6 5 11 3(� ) 2 – – – – – – –
See footnotes at end of table.
25

Table A-8. Establishments employing 500 workers or more: Weekly hours and pay of clerical occupations, Atlanta, GA, May 1995 — Continued
Occupation and levelNumber
ofworkers
Averageweeklyhours1
(stan-dard)
Weekly pay (in dollars)2 Percent of workers receiving straight-time weekly pay (in dollars) of—
Mean Median Middle range
200and
under225
225-
250
250-
275
275-
300
300-
325
325-
350
350-
375
375-
400
400-
425
425-
450
450-
500
500-
550
550-
600
600-
650
650-
700
700-
750
750-
800
800-
850
850-
900
900-
950
950-
1000
Key Entry OperatorsLevel I ....................................................... 386 39.8 $355 $337 $299 – $389 1 – 5 24 15 15 13 7 3 6 4 9 – – – – – – – – –
Private industry ..................................... 175 39.6 394 374 335 – 460 1 – 5 6 9 11 20 11 1 11 6 19 – – – – – – – – –Service-producing industries ............ 171 39.6 392 371 331 – 426 1 – 5 6 9 11 20 11 1 12 4 20 – – – – – – – – –
State and local government .................. 211 40.0 322 307 295 – 349 – – 5 38 20 18 7 3 4 1 2 – – – – – – – – – –
Level II ...................................................... 508 40.0 397 389 343 – 451 – – 2 4 10 18 11 9 12 8 17 4 3 3(� ) 1 – – – – – –Private industry ..................................... 201 39.9 392 366 321 – 458 – – 6 9 12 17 10 7 6 6 16 2 5 3(� ) 3 – – – – – –
Service-producing industries ............ 187 39.9 382 358 319 – 444 – – 6 10 13 18 10 6 6 6 15 2 6 1 – – – – – – –State and local government .................. 307 40.0 400 400 349 – 444 – – – – 9 19 11 11 17 9 18 6 1 – – – – – – – –
Personnel Assistants (Employment)Level II ...................................................... 84 40.0 438 427 417 – 460 – – – – – – 6 7 18 40 15 13 – – – – – – – – –
Private industry ..................................... 57 40.0 446 – – – – – – – – – – 2 7 16 42 16 18 – – – – – – – – –State and local government .................. 27 39.9 423 – – – – – – – – – – 15 7 22 37 15 4 – – – – – – – – –
Level III:State and local government .................. 19 40.0 519 556 411 – 556 – – – – – – – – 26 5 5 – 53 – 11 – – – – – –
SecretariesLevel I ....................................................... 1,302 39.9 382 374 320 – 428 – – 3(� ) 9 18 11 12 13 10 11 8 5 2 1 – – – – – – –
Private industry ..................................... 305 39.9 446 450 380 – 504 – – 1 – 5 6 10 10 12 6 19 21 8 3 – – – – – – –Service-producing industries ............ 304 39.9 446 450 380 – 504 – – 1 – 5 6 10 11 12 6 19 21 8 3 – – – – – – –
State and local government .................. 997 40.0 362 358 310 – 403 – – – 12 22 13 13 13 10 12 5 1 – – – – – – – – –
Level II ...................................................... 2,997 39.6 468 462 394 – 534 – – – – 3(� ) 9 7 10 12 7 17 16 17 2 3 – – – – – –Private industry ..................................... 1,522 39.3 519 526 464 – 579 – – – – 3(� ) – 3 5 5 7 15 24 32 3 5 – – – – – –
Service-producing industries ............ 1,491 39.3 520 526 467 – 584 – – – – 3(� ) – 2 5 5 8 15 24 32 3 5 – – – – – –State and local government .................. 1,475 40.0 416 404 374 – 456 – – – – – 17 12 15 18 7 18 8 2 1 – – – – – – –
Level III ..................................................... 1,682 39.9 546 535 474 – 610 – – – – – 3(� ) 1 4 7 5 18 21 15 12 3 12 1 3(� ) 3(� ) 1 –Private industry ..................................... 1,115 39.9 579 561 504 – 652 – – – – – 3(� ) 3(� ) 3(� ) 1 4 16 22 16 13 4 19 1 1 3(� ) 1 –
Goods-producing industries .............. 317 39.9 629 704 530 – 704 – – – – – – – – – 3(� ) 13 20 6 2 1 57 1 – 1 – –Manufacturing ............................... 317 39.9 629 704 530 – 704 – – – – – – – – – 3(� ) 13 20 6 2 1 57 1 – 1 – –
Service-producing industries ............ 798 39.9 559 552 498 – 608 – – – – – 3(� ) 1 3(� ) 2 6 18 23 20 18 6 3 1 1 – 1 –Transportation and utilities ........... 171 39.7 558 553 496 – 605 – – – – – 1 2 1 1 4 22 17 26 12 6 4 2 2 – – –
State and local government .................. 567 40.0 480 474 408 – 546 – – – – – 1 4 12 18 6 20 18 12 9 3(� ) 3(� ) – – – – –
Level IV ..................................................... 1,028 39.6 583 586 521 – 647 – – – – – – – 3(� ) 5 6 8 16 19 22 15 6 2 1 3(� ) – –Private industry ..................................... 651 39.3 618 625 563 – 667 – – – – – – – – – 3(� ) 5 16 20 25 22 8 3 1 3(� ) – –
Goods-producing industries .............. 75 38.8 641 – – – – – – – – – – – – – – 1 7 23 25 20 20 3 1 – – –Manufacturing ............................... 75 38.8 641 – – – – – – – – – – – – – – 1 7 23 25 20 20 3 1 – – –
Service-producing industries ............ 576 39.4 615 624 556 – 667 – – – – – – – – – 3(� ) 5 17 19 25 22 6 3 1 3(� ) – –Transportation and utilities ........... 283 39.1 620 627 577 – 667 – – – – – – – – – 3(� ) 4 13 19 26 31 4 1 1 – – –
State and local government .................. 377 40.0 521 521 427 – 586 – – – – – – – 1 13 16 14 15 19 16 3 2 3(� ) – – – –
Level V ...................................................... 223 38.8 724 738 668 – 773 – – – – – – – – – 3(� ) – 2 8 9 17 29 14 13 4 1 2Private industry ..................................... 220 38.8 724 738 666 – 774 – – – – – – – – – 3(� ) – 2 8 9 17 28 14 13 5 1 2
Service-producing industries ............ 157 39.2 712 734 659 – 760 – – – – – – – – – – – 3 10 10 15 31 13 13 3 1 1Transportation and utilities ........... 56 38.7 736 738 711 – 762 – – – – – – – – – – – 2 – 4 14 54 9 16 2 – –
See footnotes at end of table.
26

Table A-8. Establishments employing 500 workers or more: Weekly hours and pay of clerical occupations, Atlanta, GA, May 1995 — Continued
Occupation and levelNumber
ofworkers
Averageweeklyhours1
(stan-dard)
Weekly pay (in dollars)2 Percent of workers receiving straight-time weekly pay (in dollars) of—
Mean Median Middle range
200and
under225
225-
250
250-
275
275-
300
300-
325
325-
350
350-
375
375-
400
400-
425
425-
450
450-
500
500-
550
550-
600
600-
650
650-
700
700-
750
750-
800
800-
850
850-
900
900-
950
950-
1000
Switchboard Operator-Receptionists ....... 368 39.1 $447 $425 $365 – $546 1 – 1 1 11 10 5 8 13 5 11 13 21 – 1 – – – – – –State and local government ...................... 25 40.0 372 365 315 – 425 – – – 8 24 8 20 4 24 4 – 8 – – – – – – – – –
Word ProcessorsLevel II ...................................................... 150 39.7 446 441 395 – 475 – – – – – 1 2 26 10 18 29 8 4 2 – 1 – – – – –
Private industry ..................................... 100 39.5 456 456 414 – 481 – – – – – 1 3 11 13 18 36 12 4 1 – 1 – – – – –Service-producing industries ............ 85 39.8 446 449 404 – 479 – – – – – 1 4 13 13 21 35 11 2 – – – – – – – –
State and local government .................. 50 40.0 426 395 387 – 445 – – – – – – – 56 4 18 14 – 4 4 – – – – – – –
1 Standard hours reflect the workweek for which employees receive their regular straight-time salaries (exclusive of pay forovertime at regular and/or premium rates), and the earnings correspond to these weekly hours.
2 Excludes premium pay for overtime and for work on weekends, holidays, and late shifts. Also excluded are performancebonuses and lump-sum payments of the type negotiated in the auto and aerospace industries, as well as profit-sharing payments,attendance bonuses, Christmas or year-end bonuses, and other nonproduction bonuses. Pay increases, but not bonuses, undercost-of-living clauses, and incentive payments, however, are included. See Appendix A for definitions and methods used to
compute means, medians, and middle ranges.3 Less than 0.5 percent.
NOTE: Because of rounding, sums of individual intervals may not equal 100 percent. Dashes indicate that no data were reportedor that data did not meet publication criteria. Overall occupation or occupational levels may include data for categories not shownseparately.
27
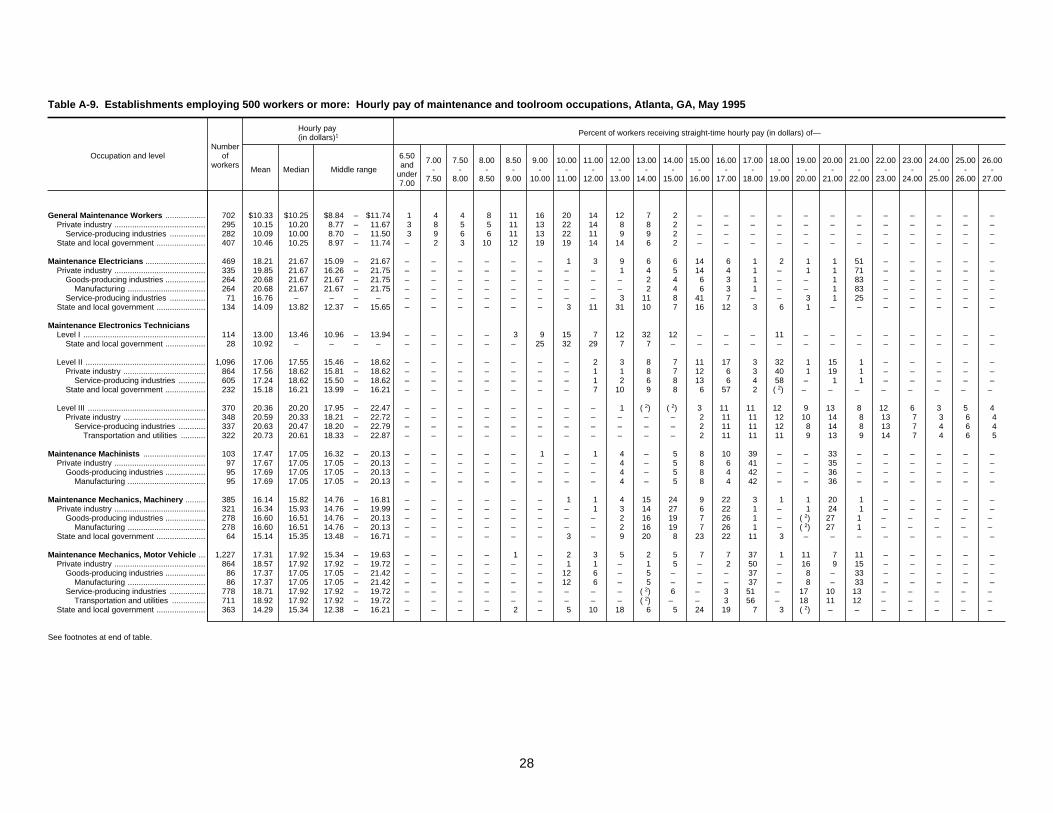
Table A-9. Establishments employing 500 workers or more: Hourly pay of maintenance and toolroom occupations, Atlanta, GA, May 1995
Occupation and levelNumber
ofworkers
Hourly pay (in dollars)1 Percent of workers receiving straight-time hourly pay (in dollars) of—
Mean Median Middle range
6.50and
under7.00
7.00-
7.50
7.50-
8.00
8.00-
8.50
8.50-
9.00
9.00-
10.00
10.00-
11.00
11.00-
12.00
12.00-
13.00
13.00-
14.00
14.00-
15.00
15.00-
16.00
16.00-
17.00
17.00-
18.00
18.00-
19.00
19.00-
20.00
20.00-
21.00
21.00-
22.00
22.00-
23.00
23.00-
24.00
24.00-
25.00
25.00-
26.00
26.00-
27.00
General Maintenance Workers .................. 702 $10.33 $10.25 $8.84 – $11.74 1 4 4 8 11 16 20 14 12 7 2 – – – – – – – – – – – –Private industry ......................................... 295 10.15 10.20 8.77 – 11.67 3 8 5 5 11 13 22 14 8 8 2 – – – – – – – – – – – –
Service-producing industries ................ 282 10.09 10.00 8.70 – 11.50 3 9 6 6 11 13 22 11 9 9 2 – – – – – – – – – – – –State and local government ...................... 407 10.46 10.25 8.97 – 11.74 – 2 3 10 12 19 19 14 14 6 2 – – – – – – – – – – – –
Maintenance Electricians ........................... 469 18.21 21.67 15.09 – 21.67 – – – – – – 1 3 9 6 6 14 6 1 2 1 1 51 – – – – –Private industry ......................................... 335 19.85 21.67 16.26 – 21.75 – – – – – – – – 1 4 5 14 4 1 – 1 1 71 – – – – –
Goods-producing industries .................. 264 20.68 21.67 21.67 – 21.75 – – – – – – – – – 2 4 6 3 1 – – 1 83 – – – – –Manufacturing ................................... 264 20.68 21.67 21.67 – 21.75 – – – – – – – – – 2 4 6 3 1 – – 1 83 – – – – –
Service-producing industries ................ 71 16.76 – – – – – – – – – – – – 3 11 8 41 7 – – 3 1 25 – – – – –State and local government ...................... 134 14.09 13.82 12.37 – 15.65 – – – – – – 3 11 31 10 7 16 12 3 6 1 – – – – – – –
Maintenance Electronics TechniciansLevel I ....................................................... 114 13.00 13.46 10.96 – 13.94 – – – – 3 9 15 7 12 32 12 – – – 11 – – – – – – – –
State and local government .................. 28 10.92 – – – – – – – – – 25 32 29 7 7 – – – – – – – – – – – – –
Level II ...................................................... 1,096 17.06 17.55 15.46 – 18.62 – – – – – – – 2 3 8 7 11 17 3 32 1 15 1 – – – – –Private industry ..................................... 864 17.56 18.62 15.81 – 18.62 – – – – – – – 1 1 8 7 12 6 3 40 1 19 1 – – – – –
Service-producing industries ............ 605 17.24 18.62 15.50 – 18.62 – – – – – – – 1 2 6 8 13 6 4 58 – 1 1 – – – – –State and local government .................. 232 15.18 16.21 13.99 – 16.21 – – – – – – – 7 10 9 8 6 57 2 2(� ) – – – – – – – –
Level III ..................................................... 370 20.36 20.20 17.95 – 22.47 – – – – – – – – 1 2(� ) 2(� ) 3 11 11 12 9 13 8 12 6 3 5 4Private industry ..................................... 348 20.59 20.33 18.21 – 22.72 – – – – – – – – – – – 2 11 11 12 10 14 8 13 7 3 6 4
Service-producing industries ............ 337 20.63 20.47 18.20 – 22.79 – – – – – – – – – – – 2 11 11 12 8 14 8 13 7 4 6 4Transportation and utilities ........... 322 20.73 20.61 18.33 – 22.87 – – – – – – – – – – – 2 11 11 11 9 13 9 14 7 4 6 5
Maintenance Machinists ............................ 103 17.47 17.05 16.32 – 20.13 – – – – – 1 – 1 4 – 5 8 10 39 – – 33 – – – – – –Private industry ......................................... 97 17.67 17.05 17.05 – 20.13 – – – – – – – – 4 – 5 8 6 41 – – 35 – – – – – –
Goods-producing industries .................. 95 17.69 17.05 17.05 – 20.13 – – – – – – – – 4 – 5 8 4 42 – – 36 – – – – – –Manufacturing ................................... 95 17.69 17.05 17.05 – 20.13 – – – – – – – – 4 – 5 8 4 42 – – 36 – – – – – –
Maintenance Mechanics, Machinery ......... 385 16.14 15.82 14.76 – 16.81 – – – – – – 1 1 4 15 24 9 22 3 1 1 20 1 – – – – –Private industry ......................................... 321 16.34 15.93 14.76 – 19.99 – – – – – – – 1 3 14 27 6 22 1 – 1 24 1 – – – – –
Goods-producing industries .................. 278 16.60 16.51 14.76 – 20.13 – – – – – – – – 2 16 19 7 26 1 – 2(� ) 27 1 – – – – –Manufacturing ................................... 278 16.60 16.51 14.76 – 20.13 – – – – – – – – 2 16 19 7 26 1 – 2(� ) 27 1 – – – – –
State and local government ...................... 64 15.14 15.35 13.48 – 16.71 – – – – – – 3 – 9 20 8 23 22 11 3 – – – – – – – –
Maintenance Mechanics, Motor Vehicle ... 1,227 17.31 17.92 15.34 – 19.63 – – – – 1 – 2 3 5 2 5 7 7 37 1 11 7 11 – – – – –Private industry ......................................... 864 18.57 17.92 17.92 – 19.72 – – – – – – 1 1 – 1 5 – 2 50 – 16 9 15 – – – – –
Goods-producing industries .................. 86 17.37 17.05 17.05 – 21.42 – – – – – – 12 6 – 5 – – – 37 – 8 – 33 – – – – –Manufacturing ................................... 86 17.37 17.05 17.05 – 21.42 – – – – – – 12 6 – 5 – – – 37 – 8 – 33 – – – – –
Service-producing industries ................ 778 18.71 17.92 17.92 – 19.72 – – – – – – – – – 2(� ) 6 – 3 51 – 17 10 13 – – – – –Transportation and utilities ............... 711 18.92 17.92 17.92 – 19.72 – – – – – – – – – 2(� ) – – 3 56 – 18 11 12 – – – – –
State and local government ...................... 363 14.29 15.34 12.38 – 16.21 – – – – 2 – 5 10 18 6 5 24 19 7 3 2(� ) – – – – – – –
See footnotes at end of table.
28

Table A-9. Establishments employing 500 workers or more: Hourly pay of maintenance and toolroom occupations, Atlanta, GA, May 1995 — Continued
Occupation and levelNumber
ofworkers
Hourly pay (in dollars)1 Percent of workers receiving straight-time hourly pay (in dollars) of—
Mean Median Middle range
6.50and
under7.00
7.00-
7.50
7.50-
8.00
8.00-
8.50
8.50-
9.00
9.00-
10.00
10.00-
11.00
11.00-
12.00
12.00-
13.00
13.00-
14.00
14.00-
15.00
15.00-
16.00
16.00-
17.00
17.00-
18.00
18.00-
19.00
19.00-
20.00
20.00-
21.00
21.00-
22.00
22.00-
23.00
23.00-
24.00
24.00-
25.00
25.00-
26.00
26.00-
27.00
Tool and Die Makers ................................... 143 $20.92 $21.69 $21.69 – $21.69 – – – – – – – – – 3 3 3 – – – 1 14 56 20 – – – –Private industry ......................................... 143 20.92 21.69 21.69 – 21.69 – – – – – – – – – 3 3 3 – – – 1 14 56 20 – – – –
Goods-producing industries .................. 143 20.92 21.69 21.69 – 21.69 – – – – – – – – – 3 3 3 – – – 1 14 56 20 – – – –Manufacturing ................................... 143 20.92 21.69 21.69 – 21.69 – – – – – – – – – 3 3 3 – – – 1 14 56 20 – – – –
1 Excludes premium pay for overtime and for work on weekends, holidays, and late shifts. Also excluded are performancebonuses and lump-sum payments of the type negotiated in the auto and aerospace industries, as well as profit-sharing payments,attendance bonuses, Christmas or year-end bonuses, and other nonproduction bonuses. Pay increases, but not bonuses, undercost-of-living clauses, and incentive payments, however, are included. See Appendix A for definitions and methods used tocompute means, medians, and middle ranges.
2 Less than 0.5 percent.
NOTE: Because of rounding, sums of individual intervals may not equal 100 percent. Dashes indicate that no data were reported orthat data did not meet publication criteria. Overall occupation or occupational levels may include data for categories not shownseparately.
29

Table A-10. Establishments employing 500 workers or more: Hourly pay of material movement and custodial occupations, Atlanta, GA, May 1995
Occupation and levelNumber
ofworkers
Hourly pay (in dollars)1 Percent of workers receiving straight-time hourly pay (in dollars) of—
Mean Median Middle range
4.25and
under4.50
4.50-
4.75
4.75-
5.00
5.00-
5.50
5.50-
6.00
6.00-
6.50
6.50-
7.00
7.00-
7.50
7.50-
8.00
8.00-
8.50
8.50-
9.00
9.00-
9.50
9.50-
10.00
10.00-
11.00
11.00-
12.00
12.00-
13.00
13.00-
14.00
14.00-
15.00
15.00-
16.00
16.00-
17.00
17.00-
18.00
18.00-
19.00
19.00-
20.00
Forklift Operators ....................................... 1,534 $13.58 $13.45 $9.50 – $18.58 – – – – – – – 20 1 2(� ) 2(� ) 3 2 2 3 2 31 – 2 – – 34 –Private industry ......................................... 1,534 13.58 13.45 9.50 – 18.58 – – – – – – – 20 1 2(� ) 2(� ) 3 2 2 3 2 31 – 2 – – 34 –
Goods-producing industries .................. 247 13.51 11.81 9.31 – 18.75 – – – – – – – – 4 1 2(� ) 20 12 9 4 3 – – 15 – – 32 –Manufacturing ................................... 247 13.51 11.81 9.31 – 18.75 – – – – – – – – 4 1 2(� ) 20 12 9 4 3 – – 15 – – 32 –
Service-producing industries ................ 1,287 13.59 13.45 11.21 – 18.58 – – – – – – – 23 – – – – – 2(� ) 2 2 37 – – – – 35 –
GuardsLevel I ....................................................... 2,161 7.08 6.75 6.25 – 7.95 – – – 7 4 26 20 10 8 10 5 3 2 3 1 2(� ) 2(� ) – – – – – –
Private industry ..................................... 1,942 6.87 6.50 6.10 – 7.50 – – – 8 4 29 23 11 7 7 4 2 1 2 1 2(� ) 2(� ) – – – – – –Service-producing industries ............ 1,880 6.85 6.50 6.00 – 7.49 – – – 8 4 30 21 12 7 7 4 2 1 2 1 2(� ) – – – – – – –
State and local government .................. 219 8.93 8.40 8.07 – 9.75 – – – – – – – – 15 37 11 10 7 14 5 2 – – – – – – –
Janitors ........................................................ 6,984 6.78 6.25 5.57 – 7.69 1 1 1 15 19 19 9 7 7 8 4 3 2 3 2(� ) 2(� ) 2(� ) – 2(� ) 2(� ) – 1 –Private industry:
Goods-producing industries .................. 84 8.24 7.35 7.01 – 10.05 – – – – – – – 60 – 11 – 5 – 20 5 – – – – – – – –Manufacturing ................................... 84 8.24 7.35 7.01 – 10.05 – – – – – – – 60 – 11 – 5 – 20 5 – – – – – – – –
State and local government ...................... 2,756 7.66 7.67 6.46 – 8.53 2(� ) 2(� ) 1 1 9 14 11 9 13 17 7 6 6 5 1 2(� ) – – – – – – –
Material Handling Laborers ....................... 678 11.28 10.05 8.00 – 12.63 – – – – 2(� ) 4 9 8 2 4 5 6 7 16 4 11 2 – – – – 20 –Private industry ......................................... 666 11.33 10.05 8.02 – 12.63 – – – – 2(� ) 4 10 9 2 4 4 6 7 17 5 11 2 – – – – 21 –
Goods-producing industries .................. 194 10.81 9.76 8.75 – 10.05 – – – – – – – 18 – 5 11 4 14 29 – – – – – – – 19 –Manufacturing ................................... 194 10.81 9.76 8.75 – 10.05 – – – – – – – 18 – 5 11 4 14 29 – – – – – – – 19 –
Service-producing industries ................ 472 11.55 10.60 7.70 – 12.63 – – – – 2(� ) 5 14 5 3 3 2 7 4 11 6 15 3 – – – – 22 –
Order Fillers ................................................ 915 13.41 12.10 10.76 – 18.58 – – – – – – – – 1 2(� ) 2(� ) 3 11 17 16 12 12 – – – – 29 –Private industry ......................................... 915 13.41 12.10 10.76 – 18.58 – – – – – – – – 1 2(� ) 2(� ) 3 11 17 16 12 12 – – – – 29 –
Service-producing industries ................ 880 13.57 12.35 10.76 – 18.58 – – – – – – – – 1 2(� ) – – 10 18 17 12 12 – – – – 30 –
Shipping/Receiving Clerks ........................ 300 11.52 11.86 9.70 – 13.64 – – – – 1 1 – 1 6 8 3 3 12 10 5 11 25 12 – – – 3 –Private industry ......................................... 280 11.55 12.00 9.70 – 13.61 – – – – 1 1 – 1 6 7 2 4 13 9 5 11 25 11 – – – 3 –
Goods-producing industries .................. 69 11.34 – – – – – – – – – – – – 17 16 – 1 – 9 12 25 9 – – – – 12 –Manufacturing ................................... 69 11.34 – – – – – – – – – – – – 17 16 – 1 – 9 12 25 9 – – – – 12 –
Service-producing industries ................ 211 11.62 12.41 9.75 – 13.94 – – – – 1 2 – 2 2 5 3 4 17 9 3 7 30 15 – – – – –
TruckdriversMedium Truck ........................................... 1,956 17.11 16.19 15.58 – 19.42 – – – – – – – – – – – – 2(� ) 2 2(� ) 3 5 5 32 4 – – 48
Private industry ..................................... 1,933 17.17 16.19 15.58 – 19.42 – – – – – – – – – – – – – 2 2(� ) 2 5 5 33 4 – – 49Service-producing industries ............ 1,926 17.19 16.19 15.58 – 19.42 – – – – – – – – – – – – – 1 2(� ) 2 5 5 33 4 – – 49
Transportation and utilities ........... 1,904 17.26 16.19 15.58 – 19.42 – – – – – – – – – – – – – 2(� ) 2(� ) 2 5 5 33 4 – – 50
Tractor Trailer ........................................... 1,497 16.17 17.73 13.72 – 17.73 – – – – – – – – – – 1 – – 5 1 3 20 11 2(� ) 8 29 1 21Private industry ..................................... 1,497 16.17 17.73 13.72 – 17.73 – – – – – – – – – – 1 – – 5 1 3 20 11 2(� ) 8 29 1 21
Goods-producing industries .............. 59 12.87 – – – – – – – – – – – – – – 25 – – 41 – – – – – – – 22 12Manufacturing ............................... 59 12.87 – – – – – – – – – – – – – – 25 – – 41 – – – – – – – 22 12
Service-producing industries ............ 1,438 16.31 17.73 13.72 – 17.73 – – – – – – – – – – – – – 3 1 3 21 12 2(� ) 8 30 – 21Transportation and utilities ........... 880 18.05 17.73 17.73 – 19.52 – – – – – – – – – – – – – – – 2(� ) 2(� ) 1 2(� ) 14 50 – 34
See footnotes at end of table.
30
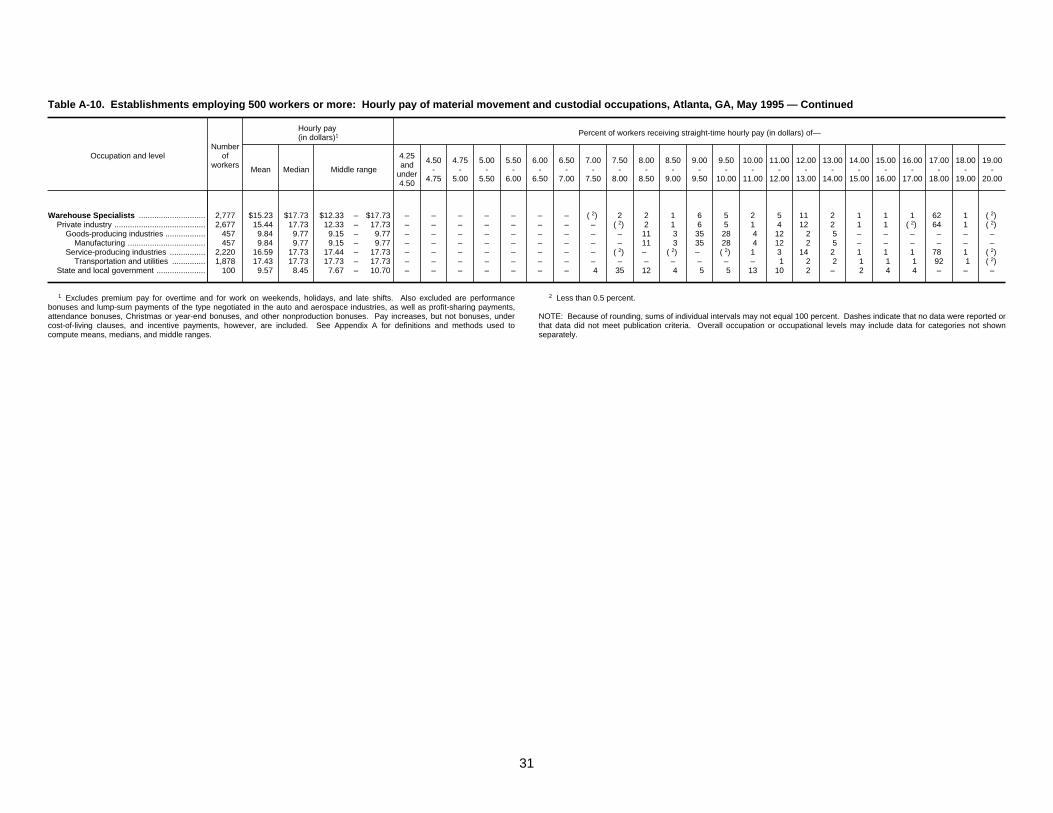
Table A-10. Establishments employing 500 workers or more: Hourly pay of material movement and custodial occupations, Atlanta, GA, May 1995 — Continued
Occupation and levelNumber
ofworkers
Hourly pay (in dollars)1 Percent of workers receiving straight-time hourly pay (in dollars) of—
Mean Median Middle range
4.25and
under4.50
4.50-
4.75
4.75-
5.00
5.00-
5.50
5.50-
6.00
6.00-
6.50
6.50-
7.00
7.00-
7.50
7.50-
8.00
8.00-
8.50
8.50-
9.00
9.00-
9.50
9.50-
10.00
10.00-
11.00
11.00-
12.00
12.00-
13.00
13.00-
14.00
14.00-
15.00
15.00-
16.00
16.00-
17.00
17.00-
18.00
18.00-
19.00
19.00-
20.00
Warehouse Specialists .............................. 2,777 $15.23 $17.73 $12.33 – $17.73 – – – – – – – 2(� ) 2 2 1 6 5 2 5 11 2 1 1 1 62 1 2(� )Private industry ......................................... 2,677 15.44 17.73 12.33 – 17.73 – – – – – – – – 2(� ) 2 1 6 5 1 4 12 2 1 1 2(� ) 64 1 2(� )
Goods-producing industries .................. 457 9.84 9.77 9.15 – 9.77 – – – – – – – – – 11 3 35 28 4 12 2 5 – – – – – –Manufacturing ................................... 457 9.84 9.77 9.15 – 9.77 – – – – – – – – – 11 3 35 28 4 12 2 5 – – – – – –
Service-producing industries ................ 2,220 16.59 17.73 17.44 – 17.73 – – – – – – – – 2(� ) – 2(� ) – 2(� ) 1 3 14 2 1 1 1 78 1 2(� )Transportation and utilities ............... 1,878 17.43 17.73 17.73 – 17.73 – – – – – – – – – – – – – – 1 2 2 1 1 1 92 1 2(� )
State and local government ...................... 100 9.57 8.45 7.67 – 10.70 – – – – – – – 4 35 12 4 5 5 13 10 2 – 2 4 4 – – –
1 Excludes premium pay for overtime and for work on weekends, holidays, and late shifts. Also excluded are performancebonuses and lump-sum payments of the type negotiated in the auto and aerospace industries, as well as profit-sharing payments,attendance bonuses, Christmas or year-end bonuses, and other nonproduction bonuses. Pay increases, but not bonuses, undercost-of-living clauses, and incentive payments, however, are included. See Appendix A for definitions and methods used tocompute means, medians, and middle ranges.
2 Less than 0.5 percent.
NOTE: Because of rounding, sums of individual intervals may not equal 100 percent. Dashes indicate that no data were reported orthat data did not meet publication criteria. Overall occupation or occupational levels may include data for categories not shownseparately.
31

A-1
ScopeThis survey of the Atlanta, GA Metropolitan Statistical Area covered
establishments employing 50 workers or more in goods producing industries(mining, construction, and manufacturing); service producing industries(transportation, communications, electric, gas, and sanitary services; wholesaletrade; retail trade; finance, insurance, and real estate; and service industries,including health services); and State and local governments.1 Private households,agriculture, the Federal Government, and the self-employed were excluded from thesurvey. Table 1 in this appendix shows the estimated number of establishments andworkers within scope of the survey and the number actually included in the surveysample.
Sampling frameThe list of establishments from which the survey sample was selected (the
sampling frame) was developed from the State unemployment insurance reports forthe Atlanta, GA Metropolitan Statistical Area (February 1992). Establishmentswith 50 workers or more during the sampling frame's reference period wereincluded in the survey sample even if they employed fewer than 50 workers at thetime of the survey.
The sampling frame was reviewed for completeness and accuracy prior to thesurvey and, when necessary, corrections were made: Missing establishments wereadded; out-of-business and out-of-scope establishments were removed; andaddresses, employment levels, industry classification, and other information wereupdated.
Survey designThe survey design includes classifying individual establishments into groups
(strata) based on industry and employment size, determining the size of the samplefor each group (stratum), and selecting an establishment sample from each stratum.The establishment sample size in a stratum was determined by expected number ofemployees to be found (based on previous occupational pay surveys) in professional,administrative, technical, protective service, and clerical occupations. In other
words, the larger the number of employees expected to be found in designatedoccupations, the larger the establishment sample in that stratum. An upwardadjustment to the establishment sample size also was made in strata expected tohave relatively high sampling error for certain occupations, based on previoussurvey experiences. (See section on "Reliability of estimates" below for discussionof sampling error.)
Data collection and payroll referenceData for the survey were obtained primarily by personal visits of the Bureau's field
economists to a sample of establishments within the Atlanta, GA MetropolitanStatistical Area. Collection for the survey was from March 1995 throughSeptember 1995 and reflects an average payroll reference month of May 1995. Dataobtained for a payroll period prior to the end of May 1995 were updated to includegeneral wage changes, if granted, scheduled to be effective through that date.
Occupational payOccupations surveyed are common to a variety of public and private industries,
and were selected from the following employment groups: (1) Professional andadministrative; (2) technical and protective service; (3) clerical; (4) maintenanceand toolroom; and (5) material movement and custodial. Occupationalclassification was based on a uniform set of job descriptions designed to takeaccount of interestablishment variation in duties within the same job. Occupationsselected for study are listed and described in appendix B, along with correspondingoccupational codes and titles from the 1980 edition of the Standard OccupationalClassification Manual.
Unless otherwise indicated, the pay data following the job titles are for allindustries combined. Pay data for some of the occupations for all industriescombined (or for some industry divisions within the scope of the survey) are notpresented in the A-series tables because either (1) data did not provide statisticallyreliable results, or (2) there was the possibility of disclosure of individualestablishment data. Pay data not shown separately for industry divisions areincluded in data for all industries combined.
Appendix A.Scope and Methodof Survey

A-2
Occupational pay data are shown for full-time workers, i.e., those hired to work aregular weekly schedule. Pay data exclude premium pay for overtime and for workon weekends, holidays, and late shifts. Also excluded are bonuses and lump-sumpayments of the type negotiated in the auto and aerospace industries, as well asprofit-sharing payments, attendance bonuses, Christmas or year-end bonuses, andother nonproduction bonuses. Pay increases—but not bonuses—under cost-of-living allowance clauses and incentive payments, however, are included in the paydata. Weekly hours for professional, administrative, technical, protective service,and clerical occupations refer to the standard workweek (rounded to the nearesttenth of an hour) for which employees receive regular straight-time pay (exclusiveof pay for overtime at regular and/or premium rates). Average weekly pay for theseoccupations are rounded to the nearest dollar. A-series tables provide distributionsof workers by pay intervals.
Average pay reflect areawide estimates. Industries and establishments differ inpay levels and job staffing, and thus contribute differently to the estimates for eachjob. Therefore, average pay may not reflect the pay differential among jobs withinindividual establishments. Job descriptions used to classify employees in this surveyusually are more generalized than those used in individual establishments to allowfor minor differences among establishments in specific duties performed.
The mean is computed for each job by totaling the pay of all workers and dividingby the number of workers. The median designates position—one-half of theworkers receive the same as or more and one-half receive the same as or less thanthe rate shown. The middle range is defined by two rates of pay; one-fourth of theworkers earn the same as or less than the lower of these rates and one-fourth earnthe same as or more than the higher rate. Medians and middle ranges are notprovided when they do not meet reliability criteria.
Occupational employment estimates represent the total in all establishmentswithin the scope of the study and not the number actually surveyed. Becauseoccupational structures among establishments differ, estimates of occupationalemployment obtained from the sample of establishments studied serve only toindicate the relative importance of the jobs studied.
Survey nonresponseData were not available from 22.1 percent of the sample establishments
(representing 203,618 employees covered by the survey). An additional 5.5 percentof the sample establishments (representing 27,158 employees) were either out ofbusiness or outside the scope of the survey.
If data were not provided by a sample member, the weights (based on theprobability of selection in the sample) of responding sample establishments wereadjusted to account for the missing data. The weights for establishments whichwere out of business or outside the scope of the survey were changed to zero.
Some sampled establishments had a policy of not disclosing salary data for certainemployees. No adjustments were made to salary estimates for the survey as a result
of these missing data. The proportion of employees for whom salary data were notavailable was less than 5 percent.
Reliability of estimatesThe data in this bulletin are estimates from a scientifically selected probability
sample. There are two types of errors possible in an estimate based on a samplesurvey—sampling and nonsampling.
Sampling errors occur because observations come only from a sample, not theentire population. The particular sample used in this survey is one of a number ofall possible samples of the same size that could have been selected using the sampledesign. Estimates derived from the different samples would differ from each other.
A measure of the variation among these differing estimates is called the standarderror or sampling error. It indicates the precision with which an estimate from aparticular sample approximates the average result of all possible samples. Therelative standard error (RSE) is the standard error divided by the estimate. Forexample, if the estimated average weekly salary of Secretaries Level IV is $500 andthe standard error is $8, the RSE is 1.6 percent, or $8/$500x100 = 1.6%.
Estimates of relative standard errors for this survey vary among the occupationalwork levels depending on such factors as the frequency with which the job occurs,the dispersion of pay for the job, and the survey design. The distribution ofpublished work levels for one relative standard error was as follows:
Relative standard Percent of publishederror occupational work levels
Less than 1 percent 4.51 and under 3 percent 67.03 and under 5 percent 22.05 percent and over 6.5
The standard error can be used to calculate a "confidence interval" around asample estimate. For example, a 95 percent confidence interval is centered at thesample estimate and includes all values within 2 times the estimate's standard error.If all possible samples were selected to estimate the population value, the intervalfrom each sample would include the true population value approximately 95 percentof the time.
Using the RSE example above, there is 95 percent confidence that the truepopulation value for Secretaries Level IV is between $484 and $516 (i.e., $500 plusor minus 2 x $8).
Nonsampling errors can stem from many sources, such as inability to obtaininformation from some establishments; difficulties with survey definitions; inabilityof respondents to provide correct information; mistakes in recording or coding thedata obtained; and other errors of collection, response, coverage, and estimation of

A-3
missing data. Although not specifically measured, the survey's nonsampling errorsare expected to be minimal due to the high response rate, the extensive andcontinuous training of field economists who gather survey data by personal visit,careful screening of data at several levels of review, annual evaluation of thesuitability of job definitions, and thorough field testing of new or revised jobdefinitions.
To measure and better control nonsampling errors that occur during datacollection, a quality control procedure was applied to the survey design. Theprocedure, job match validation (JMV), is designed to identify the frequency,reasons for, and sources of incorrect decisions made by Bureau field economists inmatching company jobs to survey occupations. Once identified, the problems arediscussed promptly with the field economists while the data are still being collected.Subsequently, the JMV results are tallied, reported to BLS staff, and become the
basis for remedial action for future surveys.Approximately 12 percent of the 466 sampled job match decisions reviewed by the
JMV reviewers and checked with the respondents were subsequently changed by theJMV reviewers. These results are from a similar survey conducted in 1994, seeOccupational Compensation Survey: Pay Only, Atlanta, GA, BLS Bulletin 3075-40.
1 For this survey, an establishment is an economic unit which produces goods or services, a centraladministrative office, or an auxiliary unit providing support services to a company. In manufacturingindustries, the establishment is usually at a single physical location. In service-producing industries, alllocations of an individual company in a Metropolitan Statistical Area are usually considered an establishment.In government, an establishment is defined as all locations of a government entity.

Appendix table 1. Establishments and workers within scope of survey and number studied, Atlanta, GA1, May1995
Industry division2
Number of establishments Workers in establishments
Within scope ofsurvey3 Studied
Within scope of survey4
StudiedNumber Percent
ALL ESTABLISHMENTS
All divisions ................................................................................... 3,310 333 1,028,893 100 351,339
Private industry ....................................................................... 3,206 305 871,496 85 247,873Goods producing .............................................................. 911 76 165,578 16 44,949
Manufacturing ............................................................. 708 61 147,152 14 42,193Mining5 ........................................................................ 5 4 978 6(� ) 753Construction5 .............................................................. 198 11 17,448 2 2,003
Service producing ............................................................. 2,295 229 705,918 69 202,924Transportation, communication, electric, gas, and
sanitary services7 ................................................. 212 34 112,051 11 62,341Wholesale trade8 ........................................................ 348 30 58,662 6 12,388Retail trade8 ................................................................ 564 25 248,347 24 40,398Finance, insurance, and real estate8 .......................... 238 19 62,265 6 16,376Services8 .................................................................... 933 121 224,593 22 71,421
State and local government .................................................... 104 28 157,397 15 103,466
ESTABLISHMENTS EMPLOYING500 WORKERS OR MORE
All divisions ................................................................................... 360 111 656,354 100 312,205
Private industry ....................................................................... 324 94 512,168 78 211,329Goods producing .............................................................. 61 22 66,858 10 35,315
Manufacturing ............................................................. 61 22 66,858 10 35,315Service producing ............................................................. 263 72 445,310 68 176,014
Transportation, communication, electric, gas, andsanitary services7 ................................................. 29 14 86,826 13 58,477
Wholesale trade8 ........................................................ 24 6 21,927 3 8,919Retail trade8 ................................................................ 124 12 200,764 31 38,792Finance, insurance, and real estate8 .......................... 24 7 39,709 6 14,380Services8 .................................................................... 62 33 96,084 15 55,446
State and local government .................................................... 36 17 144,186 22 100,876
HEALTH SERVICES9
All divisions ................................................................................... 152 34 73,079 7 29,610
Private industry ................................................................. 141 29 56,306 5 21,519State and local government .............................................. 11 5 16,773 2 8,091
Hospitals ................................................................................. 47 17 54,493 5 24,431Private industry ................................................................. 39 14 38,435 4 16,762State and local government .............................................. 8 3 16,058 2 7,669
1 The Atlanta Metropolitan Statistical Area, as defined by the Office ofManagement and Budget through October 1984, consists of Barrow, Butts,Cherokee, Clayton, Cobb, Coweta, Dekalb, Douglas, Fayette, Forsyth, Fulton,Gwinnett, Henry, Newton, Paulding, Rockdale, Spalding, and WaltonCounties. The "workers within scope of survey" estimates provide areasonably accurate description of the size and composition of the labor forceincluded in the survey. Estimates are not intended, however, for comparisonwith other statistical series to measure employment trends or levels since (1)planning of wage surveys requires establishment data compiled considerablyin advance of the payroll period studied, and (2) establishments employingfewer than 50 workers are excluded from the scope of the survey.
2 The Standard Industrial Classification Manual was used in classifyingestablishments by industry.
3 Includes all establishments with at least 50 total employees. In goodsproducing, an establishment is defined as a single physical location whereindustrial operations are performed. In service producing industries, anestablishment is defined as all locations of a company in the area within thesame industry division. In government, an establishment is generally defined
as all locations of a government entity.4 Includes all workers in all establishments with total employment (within
an area) at or above the minimum limitations.5 Separate data for this division are not shown in the A-series tables, but
the division is represented in the "all industries" and "goods producing"estimates.
6 Less than 0.5 percent.7 Abbreviated to "Transportation and utilities" in the A-series tables. This
division is represented in the "all industries" and "service producing"estimates.
8 Separate data for this division are not shown in the A-series tables, butthe division is represented in the "all industries" and "service producing"estimates.
9 Health services includes establishments primarily engaged in furnishingmedical, surgical, and other health services to persons.
Note: Overall industries may include data for industry divisions not shownseparately.
A-4