occupational closure in germany and the united kingdom · occupational closure and wage inequality...
TRANSCRIPT

Occupational Closure and Wage Inequality in Germany and the
United Kingdom
THIJS BOL
KIM A. WEEDEN
University of Amsterdam Cornell University
Abstract The rapid rise in inequality has renewed scholarly interest in how labor market institutions affect wages and their distribution across labor market positions. This article examines the relationship between institutionalized closure practices and occupational wages in the United Kingdom, a prototypical liberal market economy (LME), and Germany, a prototypical coordinated market economy (CME). Hierarchical models applied to micro data from the German Microcensus and the British Labor Force Survey, and newly collected occupation-level data on closure practices (licensure, credentialing, unionization, and apprenticeships) show that in both countries, closure practices increase mean occupational wages. The magnitude of the closure wage premium varies across both practices and countries, with important implications for comparative inequality research. Keywords: social closure; income inequality; rents; comparative inequality; occupations; varieties of capitalism
ROUGH DRAFT ONLY: PLEASE DO NOT QUOTE, CITE, OR DISTRIBUTE.1
1 This is a slightly adapted version of the paper presented at ISOL. The participants of the February 2012 session noted several mistakes in the descriptive statistics tables. This is the version with the correct tables – with thanks to ISOL.
1
In the wake of the recent take-off in wage inequality in many advanced industrialized
societies, an extensive literature has emerged to identify the sources of inequality, explain
why it has risen so dramatically, and account for cross-national differences in its levels and
patterns. Within the inequality literature, institutional approaches that focus on “non-market”
or post-market income-setting processes are often pitted against market approaches that focus
on supply and demand factors, especially on demand factors driven by technology and trade
(Fortin and Lemieux 1997). More recently, scholars have sought to understand how
contemporary institutions affect the labor supply, thereby implying a possible reconciliation
between the institutional and supply-and-demand approaches. In particular, there has been a
resurgence of interest in institutionalized sources of social closure (Weber 1978 [1922], see
also Parkin 1974; Tilly 1998; Weeden 2002; Tomaskovic-Devey 2003, 2010, Grusky and
Weeden 2010) that restrict the supply of labor in “closed” positions below the level of
demand, generating higher returns for position members than one would observe in the
absence of such institutions.
The returns to closure can be understood as economic rents, where rents are defined in
the usual way as the wages above that which would be necessary to keep that asset in
production in a competitive labor market (e.g., Tullock 1967; Sørensen 2000, 1996). Or, more
simply, rents are “the surplus of pure profit obtained from owning the resource […]
independently of the efforts of whoever owns [that] resource” (Sørensen 1996, p. 1337-1338).
These rents may emerge from newly erected or long-established barriers that prevent the
supply of labor from rising in response to an exogenous increase in demand. The closure
argument thus does not deny the importance of demand-side factors in affecting the wage
distribution, but it emphasizes the institutional barriers that create long-term shortages in the
labor supply.
To date, the closure argument has primarily been applied to understand patterns and
trends in inequality in the United States (see, e.g., Weeden 2002; Grusky and Weeden 2010;
Tomaskovic-Devey 2003, 2010), leaving its implications for comparative inequality research
woefully underdeveloped. We simply don’t yet know whether wage effects of closure are
unique to liberal market economies (such as the US or UK), or whether they are instead a
more universal feature of advanced industrialized societies. Likewise, although much research
has examined how particular institutions, especially unions, contribute to cross-national
differences in inequality and inequality trends, unionization is but one source of closure, and
its impact on the wage distribution but one piece of a larger puzzle of closure effects.
Closure is, we argue, critical to understanding how and why inequality varies so

2
dramatically across advanced industrialized societies. Comparative inequality scholars
correctly note that wage inequality is relatively high in liberal market economies (LMEs),
where economic coordination is achieved through competitive markets and arms-length
contracting, compared to coordinated market economies (CMEs), where economic
coordination is achieved through “strategic interaction” between employers, trade unions, the
state, the education system, and other institutional actors (e.g., Hall and Soskice 2001; see
also Estevez-Abe 2009). The focus then shifts to identifying the institutions (e.g., trade
unions) in CMEs that raise wages for workers at the bottom of the wage distribution, thereby
compressing inequality. The implicit assumption is that the relatively high inequality in LMEs
is due to the absence of institutions that suppress the inequality-exacerbating effects of arms-
length contracting in a competitive labor market. Institution-poor LMEs thus serve primarily
as a foil against which institution-rich CMEs are compared.
This near-exclusive emphasis on wage-compressing institutions in CME has, in our
view, led to an impoverished understanding of the institutional sources of inequality and how
they differ across market contexts. The characteristically high levels of inequality in LMEs is
generated not only by the near absence of institutions that create or redistribute economic
rents to workers at the bottom of the wage distribution, but also by the presence of top-end
rents, including those secured through occupational closure. Conversely, the characteristically
low levels of inequality in CMEs stem not only from the inequality-supressing effects of
institutions that generate rents for lower-wage workers (e.g., unions, collective bargaining),
but also weakly developed institutions that generate top-end rents. Put differently, the labor
markets in both types of economies are entirely polluted by rents, but cross-national variations
in the distribution of closure strategies across the occupational structure and the magnitude of
the returns to different forms of closure generate the distinctive levels and patterns of
inequality in CMEs and LMEs.
In this article, we elaborate the closure argument for understanding cross-national
differences in the patterns of wage inequality, and offer the first systematic assessment of its
predictions in the European context.2 Our specific goals in this article are twofold. At the most
basic level, we offer the first systematic assessment of the extent of closure and its impact on
the wage structure in two European countries, Germany and the United Kingdom (UK). This
analysis serves as an extension and replication of extant efforts to assess the inequality-
generating effects of closure in the United States (US). If closure theory is to serve as a
2 As we discuss in the conclusion, our findings also have implication for understanding cross-country differences in the aggregate level of wage inequality. The latter is not the primary focus of this article.

3
general account of wage inequality in advanced industrialized societies, it is surely necessary
to demonstrate that it receives empirical support beyond the home turf of its major
proponents.
Our second goal is to contribute to the scholarly dialogue on comparative inequalities,
using the closure framework. We argue that cross-national variation in the relative prevalence
of closure practices (e.g., educational credentialing, licensure) and the relative strength of
their effects on wages are explicable in terms of the rules and institutions that govern
economic exchange in a given societal context. To choose an obvious example, one might
expect that educational credentialing creates stronger barriers to entry, and generates higher
wage premia, in Germany, where the education system is highly vocationalized and integrated
into a highly coordinated system of exchange, than in the UK, where the education system
emphasizes general rather than vocational education. At the same time, we argue that although
the distribution and wage effects of particular closure practices vary in systematic ways
across institutional contexts, occupational closure of some form is present in multiple
institutional contexts, and generates much cross-occupational wage inequality thereby.
In light of this second goal, our choice of countries in which to examine closure effects
is strategic: in the comparative inequality literature, Germany represents the prototypical
CME, while the UK represents the prototypical (European) LME. By identifying differences
across these two countries in (a) the pattern and prevalence of closure, and (b) the wage
effects of closure, we offer important new insight into institutional differences in the sources
of economic inequality. Granted, we can’t make general claims about all CMEs based solely
on the German case, nor can we make claims about all LMEs based solely on the UK case. At
the same time, if any systematic differences in the distribution and payoff to closure strategies
across the economic types highlighted in the comparative inequality literature are to be found,
one would expect them to be revealed in a comparison of these two countries.
Our empirical analysis features new and extensive data on closure practices in these
two countries. As we discuss in the next section, we are especially concerned with closure that
restricts access to occupations, or “occupational closure.” We have accordingly collected data
on four sources of occupational closure (licensure, credentialing in the formal education
system, unionization, and apprenticeships) and the extent to which they are found in detailed
occupations: 330 in Germany and 344 in the UK. We link these country-specific closure data
to (1) occupation-level data on skill requirements, and (2) individual-level microdata from
2006-2007 (UK) and 2006 (Germany). We analyse these data with multilevel models that take
full advantage of the data’s nested structure, in which workers with varying human capital

4
attributes are nested within occupations of varying degrees of closure and skills. Although we
cannot formally model differences in the estimated parameters across the two countries, our
measures and models are sufficiently comparable to allow us to draw informal conclusions
about how the wage effects of closure compare in these two contexts. To foreshadow our
results, we find a strong positive relationship between occupational closure and wages in both
countries, but the prevalence and wage impact of specific closure practices (e.g.,
apprenticeships, licensure, educational credentialing) vary across Germany and the UK in
systematic ways.
In the rest of this article, we briefly review the occupational closure argument, the
mechanisms through which closure ostensibly generates wage returns to members of closed
occupation, and the major institutional forms through which occupational closure is secured.
Next, we discuss variations in the distribution and strength of closure practices across our two
countries, as prototypes of CMEs and LMEs. After a necessarily detailed discussion of the
data we collected for this project, we describe the basic contours of occupational closure in
Germany and the UK and present results from multilevel models that identify the net
relationship between occupational closure and wages in the UK and Germany. We conclude
with a discussion of the implications of our results for understanding the oft-observed
differences between these two countries in aggregate levels of inequality.
Occupational closure and its sources
One of the key findings of empirical research on wage inequality is that a large, and by
some accounts growing, proportion of such inequality occurs between occupations (Juhn,
Murphy, and Pierce 1993; Weeden et al. 2007; Mouw and Kalleberg 2010; but see Kim and
Sakamoto 2008). In much of the neoclassical economic literature, these cross-occupational
differences in wages are understood as little more than a statistical artefact of the clustering of
workers with particular skills into different occupations (e.g., Juhn, Murphy, Pierce 1993;
Katz and Autor 1999). In the sociological tradition, by contrast, occupations are understood as
deeply institutionalized labor market structures that fundamentally affect the allocation of all
sorts of life chances, including wages (e.g., Kalleberg and Griffin 1980, p. 735; Grusky and
Sørensen 1998; Weeden and Grusky 2005, 2012 [forthcoming]).3
The occupational closure argument falls squarely in the latter camp. According to this 3 These disciplinary boundaries are blurring, with some institutionally oriented economists devoting attention to the wage consequences of occupational monopolies (Kleiner 2006; Baker 2000) and some sociologists retreating from the strong claim that occupations “form the backbone of the inequality system” (Parkin 1971, p. 18; see, e.g., Kim and Sakamoto 2008).

5
argument, occupations, or their representatives, seek to secure closure through various legal
and normative barriers to entry. As with other forms of closure, these barriers protect
occupational incumbents from external competition, either by restricting the supply of labor
that receives the training necessary to enter an occupation or by restricting the supply of labor
that can legally practice the tasks that are under the occupation’s jurisdiction (Sørensen 2000;
see also Weeden 2002; Abbott 1988; Larson 1977). Where labor supply is held below
demand, closure secures rents for occupation members. It is a “rising tides lifts all boats”
argument, in that these rents accrue to all members of the closed occupation.4
Occupational closure may not, of course, reflect purely self-interested, rent-seeking
behaviour. Closure is often defended, by occupational incumbents and outsiders alike, as a
way to protect the public from incompetent or malfeasant practitioners and to ensure the
efficient provision of an occupation’s services (e.g., Halliday 1987; Law and Sukkoo 2005).
As such, even in liberal market societies in which ideological commitments to “free markets”
are deeply held, laws that protect occupations from competition are tolerated if they are also
understood as protecting the public (see, e.g., Council of State Governments 1952). For our
purposes, the motivations underlying closure are far less important than its consequences.
Although the concept of closure has a long history within inequality scholarship and
the sociology of the professions (e.g., Murphy 1988; Larson 1977; Parkin 1974, 1979),
surprisingly few empirical studies have assessed its effect on wages. In one of the few
exceptions, Weeden’s (2002) analysis of US data showed that occupations characterized by
closure have higher wages than is predicted by individual-level attributes and occupation-
level measures of skills and gender composition; the wage effects of licensure and educational
credentialing were especially strong, the wages effects of voluntary certification and
unionization relatively modest, and the wage effect of representation by occupational
associations non-existent, a pattern of findings she attributes to the effectiveness of closure
practices that restrict the supply of labor compared to those that attempt to increase demand
for the occupation’s services (Weeden 2002). More recently, Kleiner (2006; see also Kleiner
and Krueger 2010) demonstrates a positive effect of licensure on occupational wages in the
US and the UK (Humphris et al 2011). By and large, though, the empirical record on the
closure-wage relationship remains exceedingly sparse, a curious state of affairs given
sociologists’ longstanding fascination with social closure and its effects on life chances.
4 Closure theory does not assume that the economic returns to closure are equally distributed across all positional incumbents. In this article, we are concerned solely with the closure effect on mean occupational wages, not on its within-occupation distribution.

6
It also bears emphasizing that institutionalized sources of closure may differ across
countries. That is, the closure argument does not claim that there is a fixed menu of closure
practices in all advanced industrialized societies, nor that the returns to a given closure
practice will be constant across contexts. Building on Weeden’s results, we estimate wage
returns to educational credentialing, licensure and related forms of state regulation, and
unionization. We extend Weeden’s analysis, though, in that we include measures of closure
through apprenticeships, a labor market institution prevalent in Europe but only weakly
developed in the U.S.
In selecting educational credentialing, licensure, unionization, and apprenticeships, we
do not mean to imply that these are the only possible sources of closure. We do not examine
voluntary certification or association representation, two occupational closure strategies that
Weeden (2002) found to have a weak net effect in the U.S. context, nor closure secured
through social networks (including intergenerational inheritance). We believe, however, that
the four closure practices represent the main institutionalized forms of closure in
contemporary labor markets. If closure has any impact on cross-occupational differences in
wages, it should surely appear as a positive association between our four measures of closure
and mean occupational wages.
Educational credentials
Educational credentials refer to the degrees and certifications earned in the formal
education system. The longstanding debate in the education literature is whether credentials
serve primarily as a filtering device for children of privileged class positions, with no
necessary relationship to actual skills (Collins 1979, p. 21; Berg 1979), or whether they
signify the successful completion of a training program that teaches job-relevant and
productivity-enhancing skills. For our purposes, it only matters that educational credentials
are (for whatever reason) required for entry into particular labor market positions, whether
these requirements are embedded in licensure laws (see below) or “merely” in employers’
beliefs in the necessity or value of educational credentials.
If opportunities to obtain educational credentials were unrestricted, presumably
workers would respond to market signals and invest in education in sufficient numbers to
meet employer demand; in such a market, there would be no education rents. Instead, modern
education systems are characterized by rationing, both of primary and secondary training that
prepares all adolescents for college and of slots in the educational programs whose graduates
are sought by employers (see Grusky and Weeden 2011, Weeden and Grusky 2012). For those
7
who obtain the necessary preparatory training and successfully navigate through college, the
wage returns to their educational credentials in excess of the wage returns necessary to pay for
the costs of training can be understood as rents (Sørensen 2000, p. 1554; Weeden 2002).
If the education system is a rent-generating institution, is it also a source of
occupational closure and rents? We argue that wherever entry into an occupation requires (a)
an educational credential that can only be obtained in the formal education system (the
credentialist view) and socially produced restrictions on the supply of credential holders; or
(b) training and skills that can only be acquired through the formal education system (the
training view), educational closure produces occupational closure. As we discuss below, the
correspondence between educational closure and occupational closure may differ across
countries. Here we wish only to make the general point that educational credentials that are
themselves in short supply will limit the potential supply of workers in those occupations
where credentials are required, whether legally or normatively.
Licensure
The closure and professions literatures have long acknowledged the role of the state in
creating and enforcing barriers to entry into particular occupations, chiefly through licensure
but also through mandatory registration and legal mandates. Mandatory registration is
typically a low barrier to entry: new occupation members must simply register their names
with the relevant bureaucracy, perhaps paying a small fee or showing proof of insurance.
Licensure, by contrast, typically requires that practitioners demonstrate a minimum level of
competence (e.g., by passing a test), pay an often substantial fee, and meet other non-task-
relevant requirements such as residency, citizenship, or “moral turpitude.” Competence may
be evaluated by the licensing agency or by organizations representing the occupation, and in
either case may be based on standards set by occupational agents. Many licenses also require
evidence that the applicant has earned a specific educational credential and has completed
mandatory continuing education, but the credential is itself not sufficient for licensure.
Licensure protects occupation members’ exclusive right to sell a particular set of
services and, often, to claim a specific title, and as such serve as a “patent on a practice”
(Larson 1977; see also Weber [1922] 1978, p. 342). Like patents on technology or intellectual
property, licenses embed rights to the asset – in this case, a particular type of labor – in the
state, which has the power to enforce the rights of the “patent holders” by prosecuting those
who practice without a license. This legal backing makes licensure one of the stronger sources
of closure (Friedman 1962), especially where occupational agents have direct control over the
8
number of new entrants that meet the licensure requirements (e.g., passing bar exams). Even
where licenses are administered by the state, rather than by occupational agents, they
represent barriers to entry that require time, energy, and resources for potential occupational
practitioners to clear. By restricting the supply of workers who can legally practice an
occupation or claim an occupational title, licensure generates rent.
Unionization
Unions have long been understood as institutions that generate rents for union
members and for non-union workers in heavily unionized industries (e.g., Freeman and
Medoff 1984; see also Western and Rosenfeld 2011). The union literature identifies two
mechanisms through which unions generate rents: exclusion and negotiation. Exclusion
generates rents for union members by protecting them from competition by outsiders
(e.g.,Wright 2009, p. 106); they do so wherever union agreements impose barriers to entry
that fix the supply of labor below the demand for it. Unions may also have an indirect
exclusionary effect on wages wherever they control access to training and the acquisition of
skills necessary to perform particular tasks (see, e.g., Bills 2005, p. 78). The second
mechanism refers to unions’ ability to help workers negotiate a larger share of firm profits, or
what Morgan and Tang (2007) call “negotiated rents.” In both cases, the key to union-
generated rents lies in the unions’ state-granted right to bargain collectively, with the threat of
the withdrawal of labor (e.g., through strikes) as a key weapon in the negotiations.
Unions do not exclusively represent occupations. The relationship between
unionization and occupational closure depends on the type of union (see also Weeden 2002:
64). Unions that represent entire industries or social classes (e.g., “workers’ unions”) will
affect occupation-level wages to the extent that occupations are unevenly distributed across
the represented industries or classes: e.g., a union that represents workers in the
telecommunications industry will, in theory, generate a wage premium for line repairers,
simply because line repairers are concentrated in telecommunications. Unions that explicitly
represent particular occupations (e.g., teachers, airline pilots, mail carriers) are more directly
source of occupational closure. The efficacy of unionization as an occupational closure
strategy thus depends not only on the strength and power of unions, but also whether the
unions in a particular national labor market are predominantly organized around occupations,
industries, or aggregations of these labor market structures.

9
Apprenticeships
Parkin (1974, p. 13; see also Weber [1922] 1978: 344) argues that apprenticeship
systems serve much the same function for the skilled trades as educational credentialing does
for the professions: they restrict entry into occupations. In the classic apprenticeship system,
virtually all job-relevant training takes place on the job itself, with employers taking primary
responsibility for “educating” workers and administering the apprenticeships (Ryan 2001).
Today, the majority of master-apprenticeship relations are institutionalized in dual systems,
where vocational training in the education system is combined with “on the job” training
through practical work experience.
Apprenticeship systems can have both direct and indirect effects on the supply of
labor. A direct limit on supply emerges wherever restrictions, whether formal or informal,
limit the number of apprentices that a master can take on and hence the number of future
workers who obtain the “credential” of journeyman. In addition, apprenticeships may limit the
supply of labor indirectly, as when training in the trade’s skills can only be acquired through
apprenticeship (Shavit and Muller 1998). In the latter view, it is not merely that masters
certify apprentices and give them an official stamp of approval that allows the apprentices to
claim skills (which they may have had prior to becoming apprentices), but that there are
barriers to access to skill acquisition itself. As we discussed in the context of educational
closure, if the apprenticeship system fails to produce as many skilled workers as are necessary
to meet demand, the returns to skill accruing to individual workers is appropriately
understood as a combination of returns necessary to compensate for the costs of training and
of economic rents (see, e.g. Sørensen 2000; Weeden and Grusky 2012).
Occupational closure in comparative context
We have intentionally avoided making claims about the relative prevalence of these
closure strategies or the magnitude of the economic rents they generate, reflecting our interest
in testing the simpler claim that occupational closure is positively associated with mean
wages. In our view, this hypothesis strikes closer to the heart of closure theory as it has so far
been developed. In this section, we extend the closure argument with the goal of identifying
and making sense of differences across countries in both the relative prevalence of the closure
strategies and the relative magnitude of their anticipated wage returns.
As we noted above, closure strategies restrict the supply of labor indirectly, by
restricting access to training or directly, by restricting access to the right to practice an
occupation (even assuming training). Somewhat ironically, direct restrictions on the supply of

10
labor are more prevalent in LMEs than in CMEs. In LMEs, the reliance on market-based
exchange fosters closure practices that correct, or at least are understood as correcting, the
market failures that occur in conditions of imperfect information. Take, for example,
licensure, which almost by definition violates the “first principles” of free markets. Licensure
is nevertheless prevalent in LMEs because its proponents have successfully argued that it
weeds out incompetence and malfeasance, thereby overcoming information shortfalls and
improving the efficiency of market exchanges. In CMEs, by contrast, it is assumed that the
education system, which is closely monitored and integrated with production needs, weeds
out incompetence, and there is hence less perceived need for further filtering in the form of
licensure.
Conversely, closure practices that restrict access to training and skills are more
prevalent and more effective in generating rents in CMEs than in LMEs. In CMEs, various
institutions (e.g., the education system, unions, the state) collaborate and coordinate to grease
the wheels of economic exchange, emphasizing long-range planning more than the short-term
market exchanges characteristics of LMEs (Hall and Soskice 2001). The education system,
for example, is closely monitored by the state and plays an overt role in coordinating
economic exchange (Rubery 1999, p. 196; Estevez Abe et al. 2001). It does so not only by
training workers in occupation-specific skills – the oft-noted vocationalism of education in
CMEs – but also by setting standards of minimum competence. Unlike in LMEs, the
competency filter is embedded in the educational credential itself, with the assumption that
the credential is sufficient for filtering. Similarly, apprenticeship systems are well-developed,
which is consistent with CME’s emphasis on long-term planning and labor market
coordination. Far from being a mere accident of history, then, closure in CMEs is thus much
more likely to be embedded in practices – e.g., vocational education, apprenticeship,
unionization – that limit the supply of labor in an occupation by limiting access to training.
We do not mean to imply that barriers to access to training are altogether absent in
LMEs, or that barriers to legal rights to practice (independent of training) are absent in CMEs.
As we discuss below, both can be found in our two contexts. However, the two countries are
expected to differ in the prevalence of the four types of closure and the relative wage returns
associated with each of them.
Occupational Closure in the UK
The formal institutions of closure in the UK reflect its status as a liberal market
economy characterized by few efforts to coordinate between educational institutions,

11
employers, unions, and state agencies. The output of the education system, for example, is not
coordinated to anticipate the input needs of the labor market; indeed, UK educational
institutions guard their independence jealously, and look askance at efforts by employers to
dictate the content of educational training. Tertiary education in the UK emphasizes
intellectual exploration, critical thinking, and personal development rather than narrow job
training. As a result, educational degrees in the UK are neither highly differentiated nor, with
a few notable exceptions (e.g., the JD), occupation specific, and the correspondence between
educational degrees and occupational placement is accordingly weak.5
The relatively limited control that occupations exert over the supply of labor through
mandatory and occupation-specific educational qualifications is partially offset by the
relatively well developed system of occupational licensure. In the UK system of licensure,
licenses vary in restrictiveness from voluntary licenses, which as the name suggests offer very
few constraints on access, to statutory licenses, which are required to practice the occupation
legally. In most cases, statutory licenses (the only kind with which we are concerned) are
mandated by the state but administered by state-recognized professional organizations,
thereby giving occupational representatives control over the content of licensing criteria. Gas
installers, for example, are required to obtain the appropriate National Vocational
Qualification, register with the Confederation of Registered Gas Installers (CORGI), and
renew their license each five years (Frontier Economics 2003: 30). As this example suggests,
educational credentials are often necessary, but not sufficient for licensure. Although prior
research suggest a positive correlation between licensure and occupational earnings in the UK
(Humphris et al. 2011), it is not clear whether this effect obtains when conditioning on
mandatory educational credentialing.
If licensure is relatively well-developed in the UK, unionization is not. The level of
collective bargaining coverage is comparatively low in the UK and has been declining rapidly
(from 70 percent in 1980 to 30 percent in 2000; OECD 2004, p. 145). Moreover, what
bargaining remains is highly decentralized and exercised at the company or plant level rather
than the occupation level. The direct control unions have over the supply of labor in an
occupation is limited to whatever restrictions they can implement through their involvement
in the apprenticeship system (Steedman 2001), which, as we argue below, is itself weakly
5 Educational institutions in Northern Ireland, Scotland and Wales offer slightly different degrees than England. In 2005, the member states in the UK tried to harmonize their qualification systems through the National Qualification Framework (NQF). In the NQF, each state-specific qualification is assigned a level, under the assumption that this would help standardize degrees. For clarity, we offer English examples, although there are comparable degrees in Northern Ireland, Scotland and Wales.
12
developed. We therefore anticipate that the wage returns to occupations accruing through
unionization will be relatively modest.
The apprenticeship system is similarly undeveloped in the UK. Although the UK, like
many LMEs, has attempted to set up apprenticeship systems to overcome skill shortages, they
seldom succeed. A dual system, in which educational institutions and employers (often with
input from unions) coordinate to provide apprenticeships, is altogether absent. Instead, the
approximately 190 apprenticeships currently offered in the UK are a heterogeneous array of
programs, with no coordination amongst employers (Thelen 2004), no agreed-upon meaning
of the “apprenticeship” label, and no state-coordinated or national regulation of programs that
adopt the label (Ryan 2001; Ryan and Unwin 2001).6 Apprenticeships are rarely required to
practice an occupation, although they may be incorporated as part of a National Vocational
Qualification (NVQ) or professional qualification. This high level of decentralization of
apprenticeships, coupled with their voluntary status, makes apprenticeships a relatively
ineffective closure strategy, with weak effects on occupational wages.
Occupational Closure in Germany
The German education system is justly famous for its vocational orientation and
emphasis on occupation-specific skills (Brauns, Scherer, and Gangl 2001; Busemeyer 2009).
It is highly differentiated, with a relatively large number of educational qualifications that can
be obtained given similar years of training. Tertiary education, for example, is provided
through two types of institutions: state universities, which offer general degrees (similar to
most universities in LMEs); and the Fachhochschule (University of Applied Sciences), which
offers occupation-specific degrees. Critically, in the German system, the content of the
credential, and not just its level, drives job placements (Solga and Konietzka 1999, p. 28). The
high differentiation in the education system, an emphasis on occupation-specific training, and
limits on the number of slots for several disciplines in universities and Fachhochschulen
(Mayer, Muller, and Pollak 2007, p. 251), translates into a restricted pool of workers who
have access to occupation-specific training and credentials (Klein 2011). These barriers to
access to training are further reinforced by state mandates that specify the educational
credential requirements in occupations. To become a self-employed baker in Germany, for
example, one must obtain a “master craftsman” diploma in baking or the equivalent
6 The Adult Learning Inspectorate (since 2007 known as Ofsted) was set up in 2001 to inspect the quality of apprenticeship programs, but has few “teeth” relative to the national regulation of the German apprenticeship system (Ryan & Unwin 2001).
13
qualification.7 The result is a highly developed system of education-based occupational
closure in Germany, and, we predict, accordingly high wage returns to educational
credentialing.
If educational credentialing is well-developed in Germany relative to the UK,
licensure is only weakly developed. There are nonetheless several occupations that require
professional registration, often voluntary (OECD 2006), and a handful of others in which the
state imposes restrictions above and beyond the mandated educational credentials. In the latter
occupations, which are primarily in medicine and the law, performing the tasks of the
occupation, using the title, and carrying the official uniform or badge without official
permission is punishable under criminal law (Article §132a of the Strafgesetzbuch8).
Compared to the UK, however, we anticipate relatively little licensure in Germany, and
relatively weak net effects of licensure on wages above and beyond that which is secured
through educational credentialing.
In Germany, as in other CMEs, unions take a central role in negotiations over wages,
negotiations that often culminate in legally binding and enforceable collective labor
agreements (CLAs). Although trade union membership rates are lower in Germany (22.6%)
than in the UK (29.3%, see Visser 2006), CLA coverage in Germany is relatively high at 68
percent of all employees (OECD 2004, p. 145). Most of these CLAs govern wages at the
industry or company level, meaning that their effect on occupational wages is indirect. Trade
unions nevertheless exert indirect occupational closure by virtue of their involvement in the
development and implementation of occupations-specific apprenticeships, as trade unions
define the requirements for entry for some 300 occupations (Busemeyer 2009, p. 394).
Although the trade union effect on occupational closure per se may thus be indirect, we
expect the relatively strong bargaining power of trade unions and their involvement in the
apprenticeship system to translate into large wage premium in unionized occupations in
Germany compared to the UK.
The German apprenticeship system has been described as the heart of the “German
skills machine” (Culpepper and Finegold 1999). It is a dual system in which the education
system and employers jointly administer the apprenticeship. According to the Federal
Ministry of Education and Research (BMBF), two-thirds of German secondary school
students learned a “recognised occupation requiring formal training” (BMBF 2003, p.1;
7 See the Handwerksordnung, Appendix A, nr. 30 (http://bundesrecht.juris.de/hwo/anlage_a_195.html, accessed 12 July 2011). 8 The article can be visited at http://dejure.org/gesetze/StGB/132a.html, accessed April 22 2011.

14
emphasis added). Recognised occupations formally require a master craftsmanship degree,
per the Crafts and Trade Code (Handwerksordnung), meaning that an apprenticeship is
mandatory for self-employment.9 Although less than a third (41 out of 153) require an
apprenticeship, slightly more than a third (53) offer a voluntary apprenticeship program, and
the remainder do not offer an apprenticeship. Apprenticeships are regulated by regional
Chambers of Industry and Commerce and the Crafts Chambers, which set the curriculum and
requirements for apprenticeships, and advise and monitor employers who offer
apprenticeships.10 Even so, occupational groups are closely involved in setting up
apprenticeship systems, and thereby exercising control over the number and training of new
entrants (see, e.g., Thelen 2004). This should, in theory, generate higher average wages for
occupations in which apprenticeships are mandatory for entry, but with one important caveat:
because apprenticeships are part of a dual system, some of the wage-enhancing effects of
apprenticeships may be “absorbed by” measures of educational closure, particularly insofar as
they capture requirements for vocational training.
Summary
As the preceding discussion implies, all four closure strategies are present in the UK
and Germany, but they differ in prevalence and in strength (of anticipated wage returns)
across these two contexts. Educational credentialing, unionization, and apprenticeship
systems are much better developed in Germany than in the UK, while licensure is better
developed in the UK than in Germany. Although we anticipate wage returns to all four closure
strategies, we expect greater payoffs to credentialing, apprenticeships, and unionization in
Germany (relative to the UK), with the caveat that the union effect may be mediated by
apprenticeship systems, and any residual effect driven by industry composition. Conversely,
we anticipate high wage returns to licensure in the UK, modest wage returns to tertiary
credentialing, and relatively weak payoffs to closure through unionization and apprenticeship
systems.
Methods and data
Our analytic task is to estimate the wage returns to occupational closure (rents) in excess of
the wages that would accrue in the absence of artificial restrictions on supply. The challenge, 9 An English translation of the Handwerksordnung can be found online at http://www.zdh.de/en/trade-and-crafts-code.html , accessed 14 July 2011. 10 Almost a quarter of all companies offer apprenticeships. Of all large companies (more than 500 employees) more than 93 percent offered apprenticeships (BMBF 2003: 7).

15
which faces virtually all rent-based analyses, is that competitive market wages are unobserved
(see, e.g., Sørensen 2000; also Morgan and Tang 2007). Weeden (2002) addresses this
problem by estimating the returns to closure after adjusting for individual level human capital
and, in some models, occupational skills. This strategy “gives away” all of the individual
wage returns to education, for example, to competitive market processes, whereas the closure
argument implies that some portion of these individual-level returns is properly understood as
rents. Similarly, adjusting for occupational skills “gives away” all of the effects of closure that
accrue by virtue of barriers to access to training in those occupations for which training is
necessary, i.e., those that require especially high levels of skills. As such, the adjusted
occupation-level wage returns to closure practices can be understood as a lower-bound
estimate of the total closure effect, and the unadjusted wage returns an upper-bound estimate.
Methods
We estimate the association between occupational closure and wages with multilevel random
intercept models in which individuals (i) are nested in occupations (j). Multilevel models have
several advantages, among them that individual level and occupational level variances are
estimated simultaneously (Raudenbusch and Bryk 2002). The basic multilevel model is given
by the following equation:
ijjjxijxijij Y
eu ++Β+Α+ = ββα (1)
In this equation, Y are the logged earnings, A are the individual level characteristics, B are the
occupational level characteristics, uj is the error term at the occupational level and eij is the
error term at the individual level. By changing the covariates in B, we construct a series of
nested models that allow us to identify gross and net closure effects. We apply these nested
models to data for Germany and the UK separately, mostly because differences in the
meanings and measures of each closure strategy (see below) and in the individual-level data
make a single model problematic.
Individual-level data and measures
The individual-level data were obtained from nationally representative household
surveys conducted in 2006 (Germany) and 2006 and 2007 (UK). The German micro-data are
extracted from the public use file of the German Microcensus, which is collected by states

16
under the direction of German Federal Statistics Office.11 The UK micro-data are extracted
from the Quarterly Labor Force Survey (QLFS), which is collected by the Office of National
Statistics.12 In the QLFS, data are collected quarterly, and each sampled household
participates in five waves; to eliminate duplicate observations, we limit our analytic sample to
new observations in the first and fifth wave of data collected in 2006 and in the first wave of
data collected in 2007. We restrict our analyses to respondents who are currently employed,
who are between the ages of 18 and 65, and who indicated that their reported income is
predominantly from wages and salaries (Germany only). The final analytic sample for
Germany consists of 134,376 individuals nested in 330 occupations, and the final analytic
sample for the UK consists of 75,681 individuals nested in 344 occupations.
In all models, the dependent variable is the natural logarithm of monthly earnings.13 In
the German data, earnings are measured in 24 categories. To approximate a continuous
measure, we assign each category its midpoint earnings value. In the waves of the UK data
that we analyse here, earnings are measured as a continuous variable and no transformation is
necessary. We also fit our models to data in which we discretize the UK earnings measure into
an ordinal variable comparable to the German measure, and found highly similar results.
Our models estimate coefficients for the same set of individual level covariates, at
least to the extent possible given the constraint of each nation’s labor force survey (see Table
1 for the UK, Table 2 for Germany). The demographic covariates include binary indicators for
gender (female = 1), marital status (married = 1), ethnicity14 (ethnic minority = 1), and the
presence of dependent children in the home (yes = 1). We also control for geographic region:
in the German models, we fit a binary indicator of residence in former Eastern Germany; and
in the UK models, we add a series of dummy variables corresponding to the member states
(Scotland, Wales, and Northern Ireland, with England as the omitted category).
Our individual-level models also include measures of labor force participation and
human capital. In each model, we adjust for the number of hours normally worked in a week,
a binary indicator for full-time or part-time employment (part-time = 1), work experience, and
work experience squared. Work experience is measured by the difference between the date at
11 For a more detailed description of the Microcensus see http://www.gesis.org/en/services/data-analysis/official-microdata/microcensus/ , accessed November 23, 2011. 12 For a more detailed description of the QLFS see http://www.esds.ac.uk/government/lfs/, accessed November 23, 2011. 13 In the Microcensus not earnings but monthly net income is asked. However, as we only analyze those individuals which reported that their income consists primarily from employment wages (instead from, for example, social benefits), we come closest to earnings as possible with this data. 14 The German Microcensus asks respondents to indicate if they belong to an ethnic minority. The best available analog in the UK data is a flag for whether respondents were born in non-Western countries.

17
which the respondent completed his or her formal education and the date of the interview,
which in most cases is compatible with the standard proxy (of age minus years of education
minus 6) used in analyses of labor force surveys that lack direct measures of work experience.
Our models also include measures of individual-level educational attainment: years of
formal education, and level of the highest degree earned.15 Level of education is measured in
different ways across the two countries, in line with their very different education systems.
For the German data, we use the CASMIN scale (Brauns, Scherer and Steinman 2003), which
differentiates between vocational and general education. CASMIN is measured in five
categories: “CASMIN 1abc” (elementary education or less, the reference category),
“CASMIN 2ab” (vocational secondary education from Realschule), “CASMIN 2c” (full
vocational maturity degree [Abitur, Fachhochschulreiffe]), “CASMIN 3a” (Fachhochschule-
degree) or “CASMIN 3b” (university degree). In the UK data, educational degrees are
standardized into levels of National Vocational Qualifications, and we perforce rely on these
categories. The seven available categories are: “no qualifications” (the reference category),
“other qualifications,” “below NVQ Level 2,” “NVQ Level 2,” “trade apprenticeships,”
“NVQ Level 3,” and “NVQ Level 4 and above”. Rather than impose a hierarchy on these
categories, we fit them as dummy variables.
[Tables 1 and 2 about here]
Occupational-level data
We adopt the most detailed coding scheme of occupations that the data allow, which in
practice means relying on the “indigenous” occupational classification scheme in which the
data were collected in each country.16 The German data are coded on into the 1992
Klassifizierung der Berufe (KldB-1992), which contains 369 categories defined, for the most
part, by occupational activities. Eleven categories are reserved for respondents who are still in
school or who can only be coded into an industry. Given our theoretical focus is on
occupational closure, we exclude respondents who fall into these categories from the analysis.
The UK occupation data are coded into the 2000 Standard Occupational Classification (SOC-
2000), the official UK coding scheme. Unlike the KldB-1992, the SOC categorizes
occupations based not only on tasks but also on skill level. We use the most detailed (353- 15 Some respondents reported 35 or more years of education. We assume these are errors or outliers, and exclude these respondents from the analysis. 16 In 2010 a new version of both the KldB and the SOC was made, this is however not yet available in the micro data we use.

18
category) version of SOC-2000. Due to missing individual- and the occupational-level data,
we perforce lose 27 occupational categories in the German data and 9 in the UK data. These
are either very small occupations (e.g., saddlers, craft shoe makers, musical instrument
makers) that are unrepresented in the sample or, less commonly, residual categories (e.g.,
“metal workers not elsewhere classified”) for which we could not obtain reliable information
on occupation skills or closure practices.
Neither Germany nor the UK systematically collects official occupation-level data on
skills or closure practices at a sufficient level of detail or comprehensiveness for our goals.17
We instead constructed our own occupation-level data set from an array of sources, many of
which are country-specific or use coding schemes other than the KldB-1992 or SOC-2000.
We first describe the occupation-level “controls” that we fit in some models, then our
measures of closure practices.
Occupational skills and demographic controls
A long tradition of research, primarily using US data, shows a net effect of the gender
composition of occupations on wages (see, e.g., Kilbourne et al 1994; Tomaskevic-Devey
1993; Huffman and Cohen 2004). The gender composition effect, in particular, persists when
adjusting for occupational closure (see Weeden 2002). In keeping with this prior research, we
constructed aggregate measures of the percentage of women and the percentage of ethnic
minorities in each occupation, using the micro-data in the Microcensus and QLFS for
Germany and the UK, respectively.
Indicators of occupational skills and demographic composition were extracted from
the BIBB/BAuA Employment Survey of 2006 (Germany)18 and the British Skill Survey (BSS)
of 2001 and 2006 (pooled) for the UK.19 Both surveys are based on a representative sample of
the employed workforce, ask detailed questions about occupational skills, and contain
sufficient cases (N = 20,000 for the BIBB/BAuA, N = 12,257 for the cumulative BSS) to
generate measures of occupational skills at the level of detail in the KldB-1992 and SOC-
2000.
17 The EurOccupations data (Tijdens et al 2009) represents a recent collaboration among several European countries to construct a comparative occupation-level data set. It is insufficient for our purposes, however, in that it is limited to approximately half of the occupations in the labor force surveys, and also that many of the key closure variables have missing values. 18 More information on the BIBB/BAuA Employment Survey can be found at: http://www.bibb.de/dokumente/pdf/BIBB_BAuA_2006_Data_Manual_neu.pdf , accessed November 23, 2011. 19 More information on the British Skill Surveys can be found at: http://www.esds.ac.uk/findingData/snDescription.asp?sn=4972 and http://www.esds.ac.uk/findingData/snDescription.asp?sn=6004, both accessed at November 23, 2011.

19
Our measures of occupational skills include scales of physical abilities, technical
skills, complex mental processing, mathematical skills, interaction skills, and presentation
skills. Each scale combines information from multiple questions in the BIBB-BAuA survey
and the British Skill Surveys. We chose composite items for each skill scale by matching the
available items to the items used to construct skill measures in O*NET, an occupational-level
database in the U.S.20 We constructed our scales using factor analysis, saving the factor scores
with a mean of zero and a standard deviation of one; the composite items in each of the six
skill scales loaded predominantly on one factor, thereby confirming that we chose the
appropriate composite items. We then mapped the factor scores onto the categories in our
occupation coding schemes, thereby generating occupation-level measures. A more detailed
description of all skill variables, a list of the specific items used in each scale, and the results
from the factor analysis are available in Appendix A.
Measures of occupational closure
The featured measures in our analysis are the indicators of occupational closure. Very
few of these indicators can be aggregated from standard labor force data, so we instead
collected and merged in data from external sources. Take, for example, educational
credentialing, which we measure with two indicators: the required level of education, and an
indicator of whether the occupation is regulated by the European Qualifications Network
(discussed below). In our German data set, the required level of education was estimated by
aggregating (to the occupation level) responses to a question in the BIBB/BAuA survey,
“What qualification is normally required to do the job you have now?” This question has three
possible response categories: (1) no qualification needed, (2) vocational training or
Meister/Techniker degree, and (3) university degree. We constructed occupation-level
measures of the percentage of occupational incumbents who reported each of the latter two
levels of education. For our UK data base, we obtained measures of educational entry
requirements directly from the SOC-2000 manual (Office for National Statistics 2000). If the
SOC-2000 listed more than one entry route, we coded the minimum level of education that
was needed for entry. The UK version of the educational requirements variable is thus a three-
category variable: (1) no formal requirements (the reference category), (2) low qualifications
(GCSEs, NVQ 1-2), and (3) high qualifications (A-levels, university degrees, NVQ 3-4).
The second indicator of educational credentialing measures whether or not an
20 For more information, see http://www.onetonline.org, accessed at March 7, 2012.

20
occupation is regulated by the European Qualifications Network. In 2005, the EU passed a
directive that requires all member states to generate a list of occupations that, according to
national law, require a particular educational degree to enter. We code this into a simple
dummy variable, where occupations listed in the directive are assigned a value of 1 and those
that are not listed constitute the reference category.
Licensure also varies across our two national contexts. For the German data, we
identify all occupations that are covered by licensure laws. We obtain this information
primarily from Article §132a of the criminal law, but supplemented it with information on
legal job protection from the German occupational database.21 Rather than simply code each
occupation as licensed or not, we obtained more fine-grained information on the percentage of
occupational incumbents who are licensed, in recognition that the occupations as defined by
laws and the occupational categories in administrative classification schemes do not always
overlap perfectly (see also Weeden 2002). Similarly, for the UK we identified the percentage
of workers in an occupation category that are hold mandatory licenses or the Chartered
designation, which is likewise a legally protected designation. As in Germany, we anticipate
that this continuous measure will provide more precise estimates of the closure effect than a
simple dummy variable. We collected information on occupational licensure in the UK based
on an extensive investigation of legal codes, annual reports and websites of professional
associations, websites with job profiles, e-mail contacts and telephone calls; additional details
are available from the first author.
Our measures of unionization are aggregated from individual-level survey questions
on trade union membership (0 = no, 1 = yes).22 For the German case, we obtain unionization
data from the cumulative file of the European Social Survey, which was collected in four
waves from 2002-2008.23 From this survey, we constructed a measure of union density in
each of the three-digit ISCO codes collected in this survey, and matched these codes to the
KldB-1992 occupation scheme used in the Microcensus. For the UK, we could obtain union
participation by occupation directly from the QLFS, although due to the survey design only
from the fourth quarter of the 2006 and 2007 QLFS.
21 This database can be found at http://berufenet.arbeitsagentur.de, accessed May 14, 2011. 22 In the QLFS data on collective labour agreement coverage exists, unfortunately, no direct measures of worker’s protection were available for Germany. For this reason we decided to use the better comparable trade union density as our measure of unionization. 23 The European Social Survey (ESS) is a cross-national survey in Europe that focuses on topics that are especially relevant for social scientists. In Germany the survey is conducted by GESIS, and the data is a random sample of the German population. The combined number of observations of the 4 surveys that we can use for the aggregation is 11,413. More information on the ESS can be found at http://www.europeansocialsurvey.org/ , accessed November 23, 2011.

21
Finally, we coded the percentage of workers in an occupation who completed
apprenticeships for each country. For our German data, we identified apprenticeships based
on the education question in our micro-data, which indicates whether respondents had a
vocational degree or any other apprenticeship, and aggregated this to the occupation level. For
the UK we aggregated responses to the QLFS question, “Are you doing or have you
completed a recognised apprenticeship?” In both cases, we recorded the percentage of
workers in each occupation who answered “yes” as our indicator of closure through
apprenticeships.
Results
We first examine the descriptive statistics for our closure measures in Germany and the UK,
thereby gaining new insight into the pervasiveness of occupational closure in these contexts.
We then turn to the heart of our analysis, which examines the gross and adjusted wage premia
associated with occupational closure.
Levels of occupational closure
Tables 3 and 4 provide descriptive statistics for our occupation-level covariates (table 3) and
their bivariate correlations (table 4). The means and standard deviations are estimated in two
ways: unweighted, and weighted by occupation size.
[Table 3 about here]
Table 3 reveals, firstly, that within each of our two countries, educational credentialing
is the most pervasive closure strategy, at least as measured by the percentage of workers who
are in occupations (or, at the occupation level, the percentage of occupations) that require a
university or vocational degree (Germany) or a university degree (the UK). In Germany,
apprenticeships are also a quite common closure strategy. EU regulation and unionization
rates are lower but still substantial, while licensure covers but a small fraction of German
workers and occupations. In the UK, apprenticeship is relatively rare and licensure, while still
the least prevalent of the four closure strategies, more substantial.
More central to our story, however, are the between-country comparisons. In line with
our earlier discussion, credential closure is much more pervasive in Germany than it is in the
UK, reflecting the Germany’s notoriously differentiated and vocationalized education system
and the strong ties between credentials and job placement. These between-country differences
22
emerge not in the share of occupations that require the highest level of educational
qualifications for that country, but rather in the greater share of UK occupations that have no
formal or perceived educational requirements. Put differently, the German labor market places
greater emphasis on intermediate levels of education, which corresponds to vocational
education. Similarly, a much higher percentage of occupations require apprenticeships in
Germany than in the UK.
Licensure, by contrast, is far more prevalent in the UK than it is in Germany. In the
UK, about 13 percent of individuals are in occupations that are closed by professional
licenses, on average (see also Humphris et al 2011), compared to 5 percent in our German
data. The average occupational union density is also higher in the UK than it is in Germany,
which is consistent with studies that compare the proportions of workers in each country (not
accounting for occupations) that are unionized (see, e.g., Visser 2006).24
[Table 4 about here]
The correlations in table 4 are calculated from unweighted occupational level data. The table
reveals positive correlations between the various closure strategies in both countries.
Licensure is more common among occupations that require the highest level of educational
qualification, as well as among occupations that are regulated by the European Union. While
these correlations are consistent across countries, others are not. In Germany, for example,
unionization rates have relatively low correlations with either educational credentialing or
licensure; in the UK, by contrast, the occupations that have the highest rates of licensure and
educational closure also tend to be those with the greatest levels of unionization. For example,
in Germany the correlation between the proportion of occupational incumbents who are union
members and the measure of tertiary degree requirements is a (non-significant) -0.07, whereas
in the UK these measures are correlated at a statistically significant level of 0.23.
A second notable difference across our two countries emerges in the observed
correlations between closure through apprenticeships and educational credentialing. In the
UK, the apprenticeship measure has a lower correlation with educational credentialing than in
Germany, reflecting the prominence of apprenticeships in Germany in occupations that 24 On average, UK occupations contain a higher percentage of workers from ethnic minority groups than German occupations, although this could be due to the more expansive definition of ethnic minorities used in the UK micro-data. Occupations in the UK contain a greater proportion of women, on average, than in Germany. Because our measures of occupational skills are standardized with a mean of zero, we cannot usefully compare skill levels across the two countries.
23
require a vocational qualification. Although it is somewhat tangential to the main focus of this
paper, we also note cross-country differences in the (negative) correlations between
apprenticeship coverage and the percentage of women in the occupation, which are much
stronger in the UK (-0.58) than in Germany (-0.20). This likely reflects the greater diffusion
of apprenticeships throughout the occupational structure in Germany, compared to its
concentration in the male-dominated occupations in the craft sector in the UK.
Finally, we note that there are some differences across the two countries in the
correlations between the closure strategies and occupational skills, although few differences
between the countries in the correlations of the skill measures with each other. Physical
abilities are more often required in occupations that do not entail educational credentialing
through tertiary degrees and, in Germany, in occupations where vocational credentials limit
access. Not surprisingly, the German data also show a strong correlation between occupations
that require technical skills and those that require a vocational degree or are unionized,
whereas neither is true in the UK.
Almost all “soft” skill requirements correlate positively with credentialing, licensure
and unionization. In both countries, closure is more likely in occupations that require high
levels of complex processing skills or interaction skills (see also Weeden 2002), and less
likely in occupations that require technical or physical skills; the notable exception is closure
through apprenticeship, which is negatively correlated with two (UK) and four (Germany)
“soft” skill requirements.
Our descriptive results thus reveal significant, albeit predictable, differences between
Germany and the UK, in the levels of closure, their relative strength in each country, and their
correlation with skills. In the UK, occupational closure is more likely to take the form of
occupational licensure or tertiary degree requirements, whereas in Germany it is more often
secured through vocational educational credentialing and apprenticeships; unionization rates
are relatively compatible in both countries, although as noted this masks differences in the
level of union organization (i.e., firms or industries). These are consistent with our claim that,
firstly, institutionalized closure practices can be observed in LMEs and CMEs alike, and
secondly, that closure practices that directly and explicitly reduce competition (e.g., licensure)
are, ironically, more prevalent in LMEs than in CMEs.
Wage effects of occupational closure in the UK and Germany
We next turn to our multivariate analyses of the wage effects of the occupational closure in
our two countries. For ease of presentation, we will first discuss the results for the UK and

24
Germany separately, and then explicitly compare the findings. In our tables, we present only
the coefficients for the occupation-level covariates. The models on which these results are
based, however, include all individual-level covariates as well (see Appendix B).
[Table 5 about here]
Table 5 presents the results of the multilevel models applied to the UK data. We begin,
firstly, with a null model that fits no occupation or individual-level covariates. This model
shows that nearly 40% of the variation in logged earnings takes place between occupations
and 60% within them. 25 This percentage decreases by roughly 1/3 (to 28%) in a model (not
shown) that fits individual-level effects but no occupation-level covariates, that is, a model
that adjusts the between-occupation variance for compositional differences between
occupations in the human capital and other individual-level attributes of their incumbents. In
model 1, which fits the occupational demography measures, this is further reduced to 27%,
the “baseline” against which the contributions of the closure measures can be compared. In
model 2, which adds the closure measures, the unexplained occupation-level variance declines
to 18.3 percent. These results show, firstly, that occupations remain an important source of
heterogeneity in wages in the UK labor market, and secondly, that closure practices can
account for much (but not all) of the occupation-level variation that remains after
compositional effects are purged out.26
Our main interest is, of course, in the estimated effects of the occupation level closure
variables, which are introduced in Model 2; this model also fits all individual-level covariates
and the measures of occupational demography, but not measures of occupational skills. We
find that in the UK, three of the four closure strategies have the anticipated positive wage
returns at the occupation level: educational credentialing, licensure, and unionization. The
wage premium for educational credentialing is observed for occupations that have low
educational requirements and high educational requirements, relative to those with no
requirements, and for occupations that are regulated under EU directives. The impact of
tertiary educational requirements is quite substantial, generating a wage premium of 24.6%
(0.246) relative to those with no requirements. Fully licensed occupations have a wage
25 As Weeden argues (2002, p. 92), the share of between-occupation heterogeneity is affected by the specificity of the occupational classification schemes. Although we use the most detailed schemes we could find, these classifications are still aggregations of the occupational boundaries that exist in practice. 26 In the final model, which includes measures of skills as well as of closure practices, the unexplained occupation-level variance shrinks to 10.8 percent.

25
premium of nearly 8% (0.076), compared to unlicensed occupations, while fully unionized
occupations offer an anticipated earnings premium of 15.7% (0.157)27. Apprenticeships, by
contrast, have no significant effect on wages in the UK context, a finding that we will unpack
below. These results are consistent with the general claim of the closure approach, namely
that institutionalized closure practices generate rents for occupation members even in
prototypical liberal market economies.
Model 3 adds our measures of occupational skills to the occupation-level equation. As
we argued above, the inclusion of measures of skills will likely underestimate the “true”
effects of closure, because the wage returns to skills are a mix of marginal returns to
productivity, compensation for investments in training, and rents derived from restrictions on
access to skill training. These occupational skill-adjusted estimates are nevertheless useful
insofar address the alternative interpretation of the closure effects in Model 2, namely that our
closure measures are only picking up returns to skills that, unfortunately, are unobserved at
the individual level. Model 4 indeed shows that after adjusting for skills, closure effects on
earnings are greatly reduced, but not altogether eliminated.28 The most striking change,
relative to Model 2, is the absence of adjusted effects of credential closure: in the UK,
credentials generate rents only insofar as occupations that require high levels of education are
also those that are highly skilled. By contrast, the positive effect of licensure persists: even
after adjusting skill, licensure generates a wage premium for the occupations in which it is
prevalent. These findings are in line with our general argument about closure in the UK: in a
deregulated labor market with an education system that emphasizes general learning,
professional licenses are the principal means through which occupations generate rents.
Unionization, however, also shows a persistent positive effect in Model 4, indicating that this
institutionalized form of closure generates rents even after adjusting for skill levels.
Do the same patterns obtain in Germany, our representative CME? Before addressing
this core question, we note that the German data reveals a different pattern of association
between the two measures of occupational demography (gender and ethnic composition) than
27 It must be noted that when we use an aggregate of trade union membership we are likely to overestimate the effect of unionization in the UK. When we use an aggregate measure of CLA coverage, based on the QLFS question “Are your pay and conditions of employment directly affected by agreements between your employer and any trade union(s) or staff association?”, the effect of unions on wages is much smaller. In model 2 the wage premium for occupations that are fully covered by a CLA would only be 9 percent, instead of the 15 percent for occupations from which all members are union members. However, due to the absence of a comparable CLA measure for Germany, we use trade union membership. 28 The coefficients pertaining to skills show effects comparable to other analyses: complex processing skills and presentation skills are positively associated with earnings, and physical complexity is negatively associated with earnings. Given the dearth of surprises in these coefficients, we will not devote further space to them.
26
the UK data. In the UK, as in the US, ethnic composition had no net association with earnings
whereas gender composition was negatively associated with earnings (see also Weeden 2002).
In the German data, both measures of occupational demography are negatively correlated with
wages, although the wage penalty associated with high percentages of ethnic minorities in an
occupation disappears when adjusting for skills. Gender segregation contributes to wage
inequality in both countries, and moreover these effects cannot be attributed to either the skills
associated with “women’s work” or the higher levels of closure found in male-dominated
occupations (see, e.g., Tomaskovic-Devey 1993).
[Table 6 about here]
As much as scholars emphasize differences between CMEs and LMEs in the extent to which
institutional configurations affect levels and patterns of wage inequality, Model 2 in Table 6
also shows that similarities between the UK and Germany extend beyond segregation effects:
the pattern of closure effects on wages estimated for the German data are remarkably similar
to the pattern of effects estimated in the UK. Educational credentialing has a positive effect on
occupational wages, even after adjusting for individual-level educational attainment. As in the
UK, occupations that require either a mid-level degree (here, a vocational degree) or a general
university degree benefit have higher wages than those that do not require a degree. Also as in
the UK, occupations that require a tertiary degree have higher wages, all else equal, than
occupations that require a vocational degree. In Germany, the estimated coefficient of our
crude indicator of EU regulation, does not reach statistical significance, although its effect is
in the anticipated direction. In Germany, licensure positively affects occupational earnings,
with fully licensed occupations receive a wage premium of 8.2% (0.082) relative to
unlicensed occupations, an effect size comparable to the analogous effect in the UK. Striking
differences between Germany and the UK emerge, however, in the estimated wage effects of
unionization. In Germany, unlike in the UK, the wage effect of licensure is trivial relative to
the wage effect of unionization. In a hypothetical occupation in which all workers are
unionized, occupational earnings would exceed those in a nonunionized occupation by 40.6%,
or 0.406. Apprenticeships, by contrast, do not have a positive effect on occupational earnings
in Germany, an unanticipated result to which we return below.
The unadjusted closure estimates for Germany and the UK are thus remarkably
similar: occupational closure secured through credentialing, licensure, and unionization
generates higher occupational earnings in both countries, whereas apprenticeships do not.

27
This pattern of results persists in models that adjust for occupational skills (see Model 4 in
Table 6). Indeed, although the credentialing and licensure effects are reduced in size in the
skill-adjusted models, the unionization effects is essentially unchanged.
How do these results compare to those we observed for the UK? The most striking
feature of the skill-adjusted closure results in Table 6, compared to the analogous results for
the UK, is the persistence of the educational credentialing effect in the skill-adjusted models.
German employees with similar individual level attributes, including education, benefit from
working in an occupation in which educational credentialing is prevalent. This disparity with
the UK case can, we think, be understood as a consequence of the highly stratified German
education system, which not only provides and signals highly occupation-specific skills but
also limits the supply of labor into the occupations that are at the end of the vocational track.
The more general qualifications secured through the UK education system, by contrast, only
generate wage premia to occupational incumbents by virtue of the association between
educational closure and occupational skills.
Unionization, too, has a strong net effect on occupational wage levels in Germany.
Indeed, its coefficient is barely changed when adjusting for occupational skill (compare
models 2 and 4 in Table 6). Moreover, the union effect has the strongest effect among the
closure variables that are specified in comparable ways, i.e., with density measures. This
result confirms our hypothesis that unionization would be especially effective in Germany, at
least relative to the other closure practices.
The third result of the skill-adjusted model that we wish to highlight is the persistent,
positive wage premium associated with occupational licensure in Germany. In absolute terms,
the wage premiums to licensure in Germany are comparable in magnitude to those in the UK.
At the same time, it bears emphasizing that licensure in Germany covers a much narrower
range of occupations, primarily in the health field. Although we do not wish to downplay the
importance of licensure in securing economic rents for members of these occupations, the
aggregate effect of licensure on the occupational earnings distribution is perforce limited to
this sector. Moreover, relative to the other closure practices, and in particular educational
credentialing and unionization, licensure has a more modest effect on the wage distribution in
Germany than in the UK.
The results for credentialing, unionization, and licensure thus largely conform to our
expectations for the German data. We did not, however, anticipate the absence of an
apprenticeship effect, which we observe in both the unadjusted and the skill-adjusted
multilevel models. In interpreting the absence of an observed apprenticeship effect, two points
28
are worth noting. First, our models also fit effects for vocational training that is secured in the
formal education system. Although we have treated this, we think properly, as an educational
credentialing effect, in the dual system apprenticeships are of course tightly linked to
vocational training in schools. Put differently, apprenticeships may secure rents, but only
through the barriers to access to vocational education.
It is also plausible that apprenticeships have a sector-limited effect, raising wages of
apprenticed occupations relative to non-apprenticed occupations in the same aggregate “class”
(e.g., craft, manual labor), but not relative to wages in the average occupation. A closer
examination of the distribution of apprenticeships reveals that they are primarily concentrated
in the skilled trade and operative occupations, which are, on average, lower paid than the
skilled non-manual sector occupations. When we apply our models to data from the manual
sector, we indeed find that an apprenticeship pays off with statistically and substantively
significant wage returns compared to other occupations in this sector (see Appendix C). It
thus seems to be the case that apprenticeships generate economic rents, much as the closure
approach suggests, but their effect on overall levels of wage inequality is more complex than
our three other closure practices: apprenticeships raise the average wages of occupations that
have secured this form of closure relative to comparable manual occupations, but because
these occupations tend to be found in the lower half of the wage distribution, the aggregate
effect of apprenticeships is to reduce income inequality rather than increase it, as is the case
for licensure. This pattern of results is consistent with Parkin’s observation long ago of dual
closure in the manual sector (Parkin 1974, p. 13).
Finally, it is useful to examine the variance decompositions in the German data, and
how these compare to the UK. A null model fit to the German data suggests that 26 percent of
the total variance in earnings takes place between occupations, which is less than the
comparable percentage in the UK (40%) but still substantial. (The overall variance in earnings
is compressed in the German data, not only because of the cruder measure of income
available in the microdata, but also because of the lower levels of inequality that are
characteristic of CMEs [OECD 2008; Solt 2009]). The reduction in variance attributable to
our occupation-level measures, however, shows a similar pattern in Germany as in the UK,
with residual occupation-level variance declining by nearly three quarters (to 7.2%) in models
that estimate occupational demography and closure effects (see Model 2, Table 6). In
Germany, just as in the UK, occupational closure practices generate much of the occupation-
level heterogeneity in earnings.

29
Conclusion and discussion
In this article, we analyzed four key, institutionalized occupational closure practices
and their relationship to wages in Germany and in the UK. In so doing, we extended the
geographic range of extant empirical tests of the closure approach. Although many studies
have examined the effects of unionization and educational credentialing on wages outside the
United States, ours is the first, so far as we know, to have incorporated a broader range of
closure practices, and in the context of multilevel models that also adjust, as best as we can,
for occupational skills and demography.
Our theoretical contribution is to elaborate the closure approach to the comparative
context, and link this work to the much broader comparative inequality literature on labor
market regimes, we think to the benefit of both closure theory and the VoC literature. Just as
the occupational closure framework has developed largely without reference to the broader
system of institutions that coordinate economic exchange, so too has the comparative
inequality literature developed largely without reference to institutionalized forms of
occupational closure and their effects on labor prices within systems of economic exchange.
While in the VoC-literature rent-generating institutions at the bottom of the income
distribution are fully acknowledged for their role in mitigating wage inequality, almost no
attention is given to rent-generating institutions at the top of the income distribution. This
article takes a critical step toward addressing these gaps in the inequality literature.
Our empirical analysis supports three important conclusions: 1) occupational closure,
at least by the four institutionalized practices we examined, is more prevalent in Germany
than in the UK; 2) occupational closure generates economic rents in both countries; and 3) the
closure practices that have the strongest and weakest impact on occupational wages differ in
systematic ways between Germany, our representative CME, and the UK, our representative
LME. Formal educational credentials and apprenticeships are more important closure
strategies in Germany, with its highly stratified and vocationally oriented education system,
than in the UK. The opposite is true for licensure: in the UK almost three times as many
individuals are in licensed occupations than in Germany, however, both countries do not
outreach each other much on the levels of unionization. We can therefore conclude that,
overall, there is more closure in Germany, which is hardly a surprise as the ideal typical CME
is often characterized by its high levels of institutionalized (government) regulation. While
differences in the levels of closure are a finding in itself, we are especially interested in how
occupational closure generates inequalities.
Our second main finding is that occupational closure generates economic rents for
30
incumbents of closed occupations, thereby affecting the wage distribution and wage
inequality in critical ways. In both Germany and the UK unionization and licensure generate a
wage premium, even after controlling for the individual-level human capital attributes of
occupation members and other features of occupations. Educational credentialing is also an
effective closure practice, although the lower-bound estimates presented in models that also
adjust for skill requirements suggest this effect may be limited to Germany; similarly,
apprenticeships appear to have a “local” effect on wages, raising wages in manual
occupations relative to other manual occupations, but not relative to the “average” occupation.
These measures of closure, moreover, account for a substantial portion of the (substantial)
between-occupation variance in earnings. Occupational closure generates rents across two
very different European contexts.
Even so, our third main conclusion is that the prevalence and strength of the four
closure practices vary in systematic and predictable ways between Germany, the prototypical
coordinated market economy, and the UK, the prototypical European liberal market economy.
Educational credentialing is an especially effective form of closure in Germany, in terms of
wage returns, which is consistent with an economy in which educational institutions are
highly vocationalized and educational degrees tightly linked to particular occupational
positions. In the UK, by contrast, educational credentialing largely generates wage returns
insofar as it limits access to training for highly skilled occupations; and once occupational
skills are controlled, the credentialing effect disappears. Licensure, by contrast, exerts strong
wage effects in the UK, and serves as the primary institution through which occupational
representatives can exert some measure of control over the supply of labor into their
occupations.
So far, we have framed these findings in terms of their implications for understanding
differences across countries in patterns of wage inequality between occupations. Are they also
relevant for understanding differences across countries in the level of aggregate wage
inequality? Logically, the impact of occupational closure on aggregate levels of inequality
depends on (a) the closure effect on mean occupational wages, (b) the closure effect on
within-occupation wage inequality, (c) the distribution of closure practices across
occupations, and (d) the relative size of the closure effect across different kinds of
occupations. If closure is primarily found in, or generates the greatest wage premia in,
occupations that even in the absence of closure would fall near the top of the occupational
wage distribution, closure will have an exacerbating effect on aggregate levels of wage
inequality. Conversely, if closure is primarily found in, or has the greatest benefits for,

31
occupations that would in the counterfactual closure-free world fall at the bottom of the wage
distribution, closure will suppress aggregate levels of inequality.
We cannot, in the present article, formally test the impact of closure on aggregate
levels of inequality. Our results nevertheless allow us to make tentative statements in this
regard, if only to highlight the importance of examining these distributional and interaction
effects more closely in future research. Our data suggest that in Germany, compared to the
UK, closure practices are diffused more evenly throughout the division of labor, and moreover
that the strategies that have the strongest positive association with wages are also those that
are most likely to be found in the manual and unskilled sectors. We show, for example, that
trade unionization and vocational degree requirements generate net occupational returns, and
that apprenticeships have uneven effects: they raise wages of apprenticed occupations in the
manual sector, but not in other sectors. Although it remains to be demonstrated more formally,
the net result is that closure in Germany is likely to compress overall levels of wage inequality
(even as it creates greater wage differences within the manual sector, for example). In the UK,
by contrast, closure that generate rents for members of unskilled occupations is less prevalent
(e.g., apprenticeships), and their wage effects weak relative to the wage premiums generated
by the closure practices (e.g., licensure) favored by the professions.
More generally, our analysis serves as a useful corrective to the comparative inequality
literature, which overemphasizes the institutions “at the bottom” of the wage distribution that
compress inequality in CMEs, in particular, at the expense of the many labor market
institutions that generate rents for occupations at the top of the wage distribution. If we want
to understand why LMEs have so much more inequality than CMEs, we need to understand
not only how the institutions in the institution-rich CMEs compress wage inequality, but also
how the institutions in ostensibly liberal market economies exacerbate it. We are hesitant to
make too many grand claims about inequality in CMEs relative to LMEs, given we have
“only” examined occupational closure effects in two countries, carefully chosen though they
may be. Nevertheless, our analysis demonstrates the ongoing importance of closure practices
in generating wage inequality in liberal and coordinated market economies alike.

32
References
Abbott, Andrew. 1988. The System of Professions: An Essay on the Division of Expert Labor.
Chicago: University of Chicago Press.
Berg, Ivar. 1970. Education and Jobs: The Great Training Robbery. New York: Praeger.
Bills, David B. 2005. “Participation in Work-related Education: Variations in Skill
Enhancement Among Workers, Employers, and Occupational Closure.” Research in
Social Stratification and Mobility 23: 67-102.
BMBF. 2003. German Vocational´s Education at a Glance. Bonn: Federal Ministry of
Education and Research.
Brauns Hildegard, and Susanne Steinmann. 1999. “Educational reform in France, West-
Germany and the United Kingdom: updating the CASMIN educational classification”.
ZUMA-Nachrichten 44: 7-44.
Brauns, Hildegard, Markus Gangl, and Stefani Scherer. 2001. “Education and
Unemployment: Patterns of Labour Market Entry in France, the United Kingdom and
West Germany.” Pp. 287-312 in Education, the Labour Market and Transitions in Youth:
Cross-National Perspectives, edited by David Raffe, Rolf Van der Velden, and Patrick
Werquin. Edinburgh: CES, University of Edinburgh.
Busemeyer, Marius R. 2009. “Asset specificity, institutional complementarities and the
variety of skill regimes in coordinated market economies.” Socio-Economic Review 7:
375–406.
Council of State Governments. 1952. Occupational Licensing Regulations in the States.
Council of State Governments.
Collins, Randall. 1979. The Credential Society: An Historical Sociology of Education and
Stratification. New York: Academic Press.
Culpepper Pepper D., and David Finegold. 1999. The German skills machine: Sustaining
comparative advantage in a global economy. NY/Oxford: Berghan Books.
Estevez-Abe, Maragarita, Torben Iversen, and David Soskice. 2001 “Social Protection and the
Formation of Skills: A Reinterpretation of the Welfare State.” Pp.145-183 Varieties of
Capitalism. The Institutional Foundations of Comparative Advantage, edited by Peter A.
Hall and David Soskice. Oxford: Oxford University Press.
Freeman, Richard B., and James L. Medoff. 1984. What do Unions Do? New York: Basic
Books.
Friedman, Milton. 1962. Capitalism and Freedom. Chicago: University of Chicago Press.
Frontier Economics. 2003. An Economic Review and Analysis of the Implications of
33
Occupational Licensing. Department for Education and Skills.
Hall, Peter A., and David Soskice. 2001. Varieties of Capitalism. The Institutional
Foundations of Comparative Advantage. Oxford: Oxford University Press
Halliday, Terence. 1987. Beyond Monopoly: Lawyers, State Crises, and Professional
Empowerment. Chicago: University of Chicago Press.
Huffman, Matt L., and Phillip N. Cohen. 2004. “Racial Wage Inequality: Job Segregation and
Devaluation across US Labor Markets.” American Journal of Sociology 109(4): 902-36.
Humphris, Amy, Morris Kleiner, and Maria Koumenta. 2011. “How does the government
regulate occupations in the UK and US? Issues and policy implications.” Pp. 87-101 in
Employment in the Lean Years: Policy and Prospects for the Next Decade, edited by
David Marsden. Oxford: Oxford University Press.
Juhn, Chinhui, Keven M. Murphy, and Brooks Pierce. 1993. “Wage inequality and the rise in
returns to skill.” Journal of Political Economy 101: 410-442.
Kalleberg, Arne L., and Larry J. Griffin. 1980. “Class, Occupation, and Inequality of Job
Rewards.” American Journal of Sociology 85 (4): 731–68.
Katz, Larry F., and David H. Autor. 1999. “Changes in the Wage Structure and Earnings
Inequality.” Pp. 1463–1555 in Handbook of Labor Economics, vol. 3, edited by Orley
Ashenfelter and David Card. Amsterdam: North-Holland.
Kilbourne, Barbara Stanek, Paula England, George Farkas, Kurt Beron, and Dorothea Weir.
1994. “Returns to Skills, Compensating Differentials, and Gender Bias: Effects of
Occupational Characteristics on the Wages of Women and Men.” American Journal of
Sociology 100: 689-719.
Kim, Chang Hwan, and Arthur Sakamoto. 2008. “The Rise of Intra-Occupational Wage
Inequality in the U.S., 1983-2002. American Sociological Review 73:129-57.
Klein, Markus. 2011. “Trends in the association between educational attainment and class
destinations in West Germany: Looking inside the service class.” Research in Social
Stratification and Mobility 29(4): 427-444.
Kleiner, Morris .2006. Licensing Occupations: Ensuring Quality or Restricting Competition?.
Kalamazoo, Michigan: W.E. Upjohn Institute for Employment Research.
Kleiner, Morris, and Alan B. Krueger. 2010. “The Prevalence and Effects of Occupational
Licensing.” British Journal of Industrial Relations 48: 676-687.
Larson, Magali Sarfatti. 1977. The Rise of Professionalism: A Sociological Analysis.
Berkeley: University of California Press.

34
Law, Mark T., and Sukkoo Kim. 2005. “Specialization and Regulation: The Rise of
Professionals and the Emergence of Occupational Licensing Regulations.” The Journal
of Economic History 65(3): 723-756.
Manza, Jeff. 1992. “Classes, Status Groups, and Social Closure: A Critique of Neo-Weberian
Closure Theory.” Pp. 275-302 in Current Perspectives in Social Theory, edited by Ben
Agger. Greenwich, Conn.: JAI Press.
Mayer, Karl-Ulrich, Walter Muller, and Reinhard Pollak. 2007. “Germany: Institutional
Change and Inequalities of Access in Higher Education.” Pp. 240-265 in Stratification
in Higher Education. A Comparative Study. Edited by Yossi Shavit, Richard Arum, and
Adam Gamoran. Stanford: Stanford University Press.
Morgan, Stephen L., and Zun Tang. 2007. “Social Class and Workers’ Rent, 1983-2001.”
Research in Social Stratification and Mobility 25: 273-293.
Mouw, Ted, and Arne L. Kalleberg. 2010. “Occupations and the Structure of Wage Inequality
in the US, 1980s-2000s.” American Sociological Review 75 (3): 402-431.
Murphy, Raymond. 1988. Social Closure: The Theory of Monopolization and Exclusion.
Oxford: Clarendon Press.
OECD. 2004. Employment Outlook 2004. Paris: OECD.
———. 2006. OECD Economic Surveys. Germany. Paris: OECD.
———. 2008. Growing unequal? Income distribution and poverty in OECD countries. Paris:
OECD.
Office for National Statistics. 2000. Standard Occupational Classification 2000. Volume 1:
Structure and descriptions of unit groups. London: The Stationery Office.
Parkin Frank. 1971. Class inequality and political order: Social stratification in capitalist and
communist societies. New York: Praeger.
———, (ed.). 1974. The Social Analysis of Class Structure. New York: Harper Row.
———. 1979. Marxism and Class Theory: A Bourgeois Critique. New York: Columbia
University Press.
Raudenbush, Stephen W., and Anthony S. Bryk. 2002. Hierarchical linear models:
Applications and data analysis methods. 2nd edition. Newbury Park , CA : Sage
Rubery, Jill, Mark Smith, and Colette Fagan. 1999 Women’s Employment in Europe: Trends
and Prospects. London: Routledge.
Ryan, Paul. 2001. “The School-to-Work Transition: A Cross-National Perspective.” Journal of
Economic Perspectives 39: 34-92.
Ryan, Paul, and Lorna Unwin. 2001. Apprenticeship in the British ´Training Market´.

35
National Institute Economic Review 178: 99-114.
Shavit, Yossi, and Walter Müller. 1998. From School to Work. A Comparative Study of
Educational Qualifications and Occupational Destinations. Oxford, England: Clarendon
Press.
Solga, Heike, and Dirk Konietzka. 1999. “Occupational Matching and Social Stratification
Theoretical Insights and Empirical Observations Taken from a German-German
Comparison.” European Sociological Review 15(1): 25-47.
Solt, Frederick. 2009. "The Standardized World Income Inequality Database",
http://hdl.handle.net/1902.1/11992 V3 [Version].
Sørensen, Aage B. 1996. “The Structural Basis of Social Inequality.” American Journal of
Sociology 101 (5): 1333–65.
———. 2000. “Toward a Sounder Basis for Class Analysis.” American Journal of Sociology
105 (6): 1559–71.
Steedman, Hilary. 2001. “Benchmarking Apprenticeship: UK and Continental Europe
Compare.” CEP Discussion Paper 513, London.
Thelen, Kathleen. 2004. How institutions evolve: the political economy of skills in Germany,
Britain, the United States and Japan. Cambridge: Cambridge University Press.
Tijdens, Kea.G., Esther De Ruijter, Judith De Ruijter, Joyce Jacobs, and Yves De Weerd.
(2009) EurOccupations dataset on 150 occupations. Rotterdam: Erasmus University/
Tilburg: AO Consult.
Tilly, Charles. 1998. Durable Inequality. Berkeley, CA: University of California Press.
Tomaskovic-Devey, Donald. 1993. Gender and Racial Inequality at Work: The Sources and
Consequences of Job Segregation. Ithaca, NY: ILR Press.
Tullock, Gordon. 1967. “The Welfare Costs of Tariffs, Monopolies, and Theft.” Economic
Inquiry 5: 224-232.
Visser, Jelle. 2006. “Union Membership Statistics in 24 Countries.” Federal Publications.
Paper 273.
Weber, Max. 1978 [1922]. Economy and Society: An Outline of Interpretive Sociology.
Berkeley and Los Angeles: University of California Press.
Weeden, Kim A. 2002. “Why Do Some Occupations Pay More than Others? Social Closure
and Earnings Inequality in the United States.” American Journal of Sociology 108: 55-
101.
Weeden, Kim A., and David B. Grusky. 2005. “The Case for a New Class Map.” American
Journal of Sociology 111(1):141-212.

36
———. 2012. “Inequality and Market Failure.” Working Paper, Department of Sociology,
Cornell University.
Weeden, Kim A., Young-Mi Kim, Matthew Di Carlo, and David B. Grusky. 2007. "Social
Class and Earnings Inequality." American Behavioral Scientist 50(5):702-36.
Western, Bruce, and Jake Rosenfeld. 2011. “Unions, Norms, and the Rise in U.S. Wage
Inequality.” American Sociological Review 76(4): 513-537.
Wright, Erik Olin. 2009. “Understanding Class. Towards an Integrated Analytical Approach.”
New Left Review 60: 101-116.
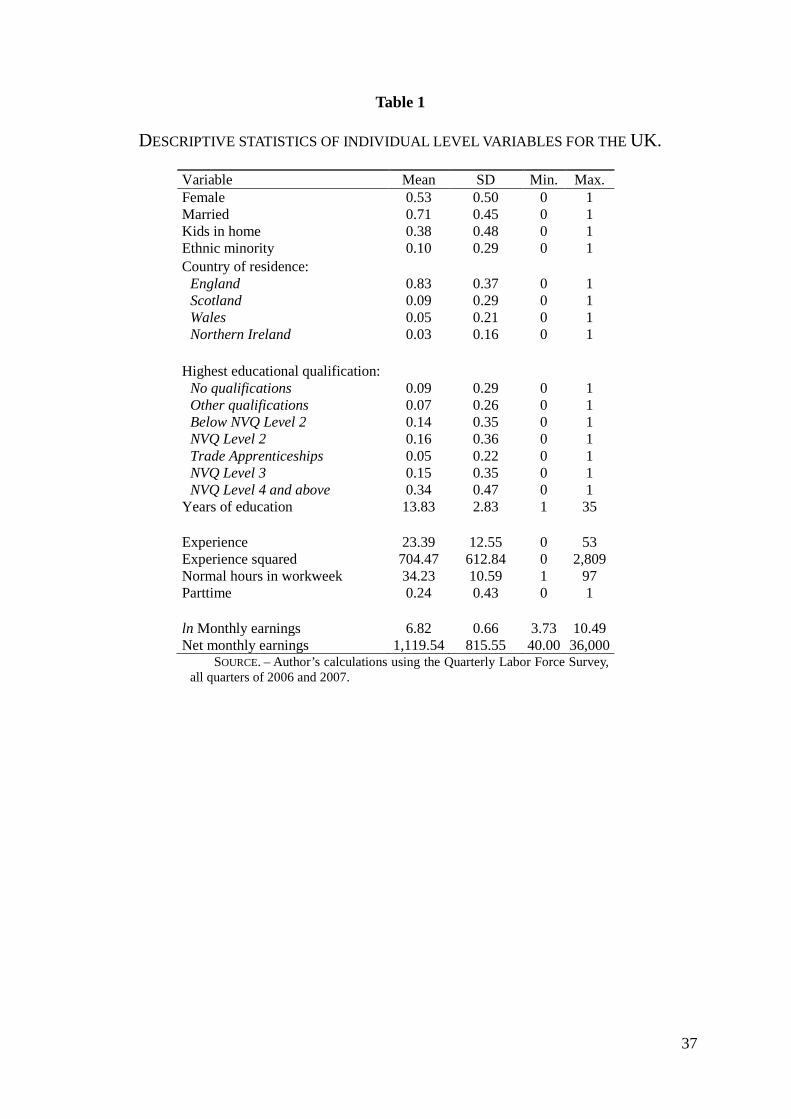
37
Table 1
DESCRIPTIVE STATISTICS OF INDIVIDUAL LEVEL VARIABLES FOR THE UK.
Variable Mean SD Min. Max. Female 0.53 0.50 0 1 Married 0.71 0.45 0 1 Kids in home 0.38 0.48 0 1 Ethnic minority 0.10 0.29 0 1 Country of residence:
England 0.83 0.37 0 1 Scotland 0.09 0.29 0 1 Wales 0.05 0.21 0 1 Northern Ireland 0.03 0.16 0 1
Highest educational qualification:
No qualifications 0.09 0.29 0 1 Other qualifications 0.07 0.26 0 1 Below NVQ Level 2 0.14 0.35 0 1 NVQ Level 2 0.16 0.36 0 1 Trade Apprenticeships 0.05 0.22 0 1 NVQ Level 3 0.15 0.35 0 1 NVQ Level 4 and above 0.34 0.47 0 1
Years of education 13.83 2.83 1 35 Experience 23.39 12.55 0 53 Experience squared 704.47 612.84 0 2,809 Normal hours in workweek 34.23 10.59 1 97 Parttime 0.24 0.43 0 1 ln Monthly earnings 6.82 0.66 3.73 10.49 Net monthly earnings 1,119.54 815.55 40.00 36,000
SOURCE. – Author’s calculations using the Quarterly Labor Force Survey, all quarters of 2006 and 2007.

38
Table 2
DESCRIPTIVE STATISTICS OF INDIVIDUAL LEVEL VARIABLES FOR GERMANY.
Variable Mean SD Min. Max. Female 0.43 0.49 0 1 Married 0.60 0.49 0 1 Kids in home 0.52 0.50 0 1 Ethnic minority 0.02 0.14 0 1 Former Eastern Germany 0.23 0.42 0 1 Highest qualification CASMIN 1abc 0.27 0.45 0 1 CASMIN 2ab 0.39 0.49 0 1 CASMIN 2c 0.13 0.33 0 1 CASMIN 3a 0.07 0.26 0 1 CASMIN 3b 0.14 0.35 0 1
Years of education 16.44 4.98 9 35 Experience 19.60 11.41 0 50 Experience squared 514.30 480.05 0 2,500 Normal hours in workweek 37.98 10.41 1 90 Parttime 0.18 0.39 0 1 ln Monthly earnings 7.32 0.60 4.32 9.99 Net monthly earnings 1,821.30 1,452.06 75.00 22,000
SOURCE. – Author’s calculations using the German Microcensus, wave 2006.
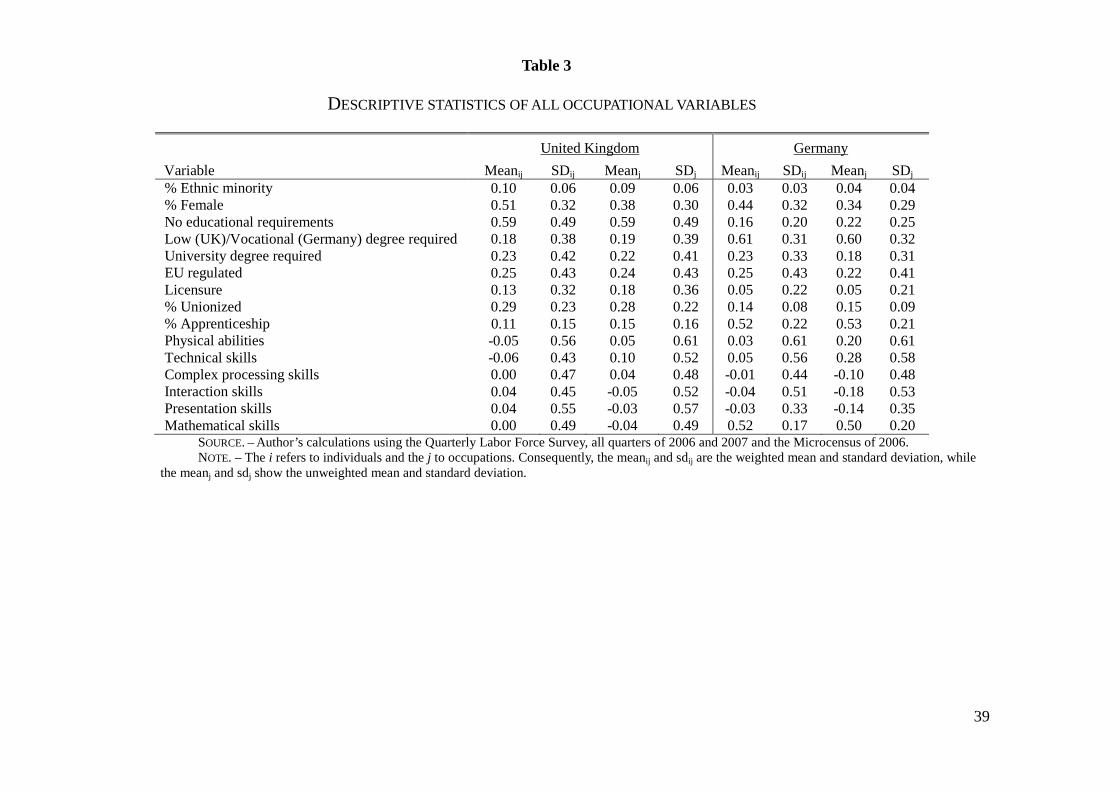
39
Table 3
DESCRIPTIVE STATISTICS OF ALL OCCUPATIONAL VARIABLES
Variable United Kingdom Germany
Meanij SDij Meanj SDj Meanij SDij Meanj SDj % Ethnic minority 0.10 0.06 0.09 0.06 0.03 0.03 0.04 0.04 % Female 0.51 0.32 0.38 0.30 0.44 0.32 0.34 0.29 No educational requirements 0.59 0.49 0.59 0.49 0.16 0.20 0.22 0.25 Low (UK)/Vocational (Germany) degree required 0.18 0.38 0.19 0.39 0.61 0.31 0.60 0.32 University degree required 0.23 0.42 0.22 0.41 0.23 0.33 0.18 0.31 EU regulated 0.25 0.43 0.24 0.43 0.25 0.43 0.22 0.41 Licensure 0.13 0.32 0.18 0.36 0.05 0.22 0.05 0.21 % Unionized 0.29 0.23 0.28 0.22 0.14 0.08 0.15 0.09 % Apprenticeship 0.11 0.15 0.15 0.16 0.52 0.22 0.53 0.21 Physical abilities -0.05 0.56 0.05 0.61 0.03 0.61 0.20 0.61 Technical skills -0.06 0.43 0.10 0.52 0.05 0.56 0.28 0.58 Complex processing skills 0.00 0.47 0.04 0.48 -0.01 0.44 -0.10 0.48 Interaction skills 0.04 0.45 -0.05 0.52 -0.04 0.51 -0.18 0.53 Presentation skills 0.04 0.55 -0.03 0.57 -0.03 0.33 -0.14 0.35 Mathematical skills 0.00 0.49 -0.04 0.49 0.52 0.17 0.50 0.20
SOURCE. – Author’s calculations using the Quarterly Labor Force Survey, all quarters of 2006 and 2007 and the Microcensus of 2006. NOTE. – The i refers to individuals and the j to occupations. Consequently, the meanij and sdij are the weighted mean and standard deviation, while
the meanj and sdj show the unweighted mean and standard deviation.

40
Table 4 DESCRIPTIVE STATISTICS OF ALL OCCUPATIONAL VARIABLES AND THEIR BIVARIATE CORRELATIONS FOR THE UNITED
KINGDOM.
United Kingdom Variable 1 2 3 4 5 6 7 8 9 10 11 12 13 14 15 1 % Ethnic minority 1.00 2 % Female 0.16 1.00 3 No educational req. -0.08 -0.14 1.00 4 Low educational req. -0.09 0.07 -0.59 1.00 5 High educational req. 0.18 0.10 -0.63 -0.26 1.00 6 EU regulated 0.07 0.06 -0.40 0.16 0.32 1.00 7 Licensure 0.08 0.00 -0.35 0.07 0.35 0.51 1.00 8 % Unionized 0.08 0.01 -0.20 0.02 0.23 0.18 0.33 1.00 9 % Apprenticeship -0.30 -0.58 0.07 0.05 -0.13 -0.09 -0.08 -0.06 1.00 10 Physical abilities -0.13 -0.37 0.41 -0.15 -0.35 -0.22 -0.13 0.04 0.31 1.00 11 Technical skills -0.07 -0.38 0.23 -0.03 -0.24 -0.10 -0.04 -0.02 0.49 0.66 1.00 12 Complex processing skills -0.02 -0.12 -0.50 0.17 0.43 0.30 0.23 0.11 0.15 -0.27 -0.02 1.00 13 Interaction skills 0.03 0.24 -0.44 0.13 0.41 0.24 0.21 0.26 -0.24 -0.35 -0.39 0.62 1.00 14 Presentation skills 0.03 0.19 -0.56 0.14 0.53 0.37 0.29 0.26 -0.24 -0.59 -0.52 0.68 0.76 1.00 15 Mathematical skills 0.05 -0.08 -0.37 0.13 0.32 0.26 0.06 -0.19 0.12 -0.35 -0.11 0.51 0.35 0.40 1.00
Germany 1 % Ethnic minority 1.00 2 % Female -0.12 1.00 3 No educational req. 0.50 0.10 1.00 4 Vocational degree req. -0.10 -0.19 -0.43 1.00 5 University degree req. -0.30 0.11 -0.36 -0.68 1.00 6 EU regulated -0.15 0.02 -0.24 0.04 0.16 1.00 7 Licensure -0.11 -0.01 -0.09 -0.26 0.34 0.19 1.00 8 % Unionized -0.03 -0.38 -0.10 0.14 -0.07 -0.07 0.00 1.00 9 % Apprenticeship 0.21 -0.20 0.21 0.69 -0.88 -0.18 -0.29 0.14 1.00 10 Physical abilities 0.32 -0.37 0.17 0.37 -0.52 0.20 -0.16 0.05 0.45 1.00 11 Technical skills 0.11 -0.67 -0.20 0.47 -0.32 0.07 -0.10 0.29 0.35 0.55 1.00 12 Complex processing skills -0.55 -0.04 -0.65 0.01 0.52 0.20 0.15 0.08 -0.49 -0.24 0.00 1.00 13 Interaction skills -0.50 0.21 -0.46 -0.18 0.56 0.34 0.14 -0.05 -0.56 -0.25 -0.29 0.72 1.00 14 Presentation skills -0.49 0.24 -0.43 -0.37 0.73 0.14 0.16 -0.10 -0.70 -0.55 -0.44 0.69 0.78 1.00 15 Mathematical skills -0.37 -0.28 -0.61 0.26 0.23 0.07 -0.02 0.09 -0.16 -0.07 0.35 0.47 0.25 0.26 1.00
SOURCE. – Author’s calculations using the Quarterly Labor Force Survey, all quarters of 2006 and 2007 and the German Microcensus, wave 2006. NOTE. – The correlations are unweighted, all occupations have equal weight. All correlations that are shown in italics are not significant.
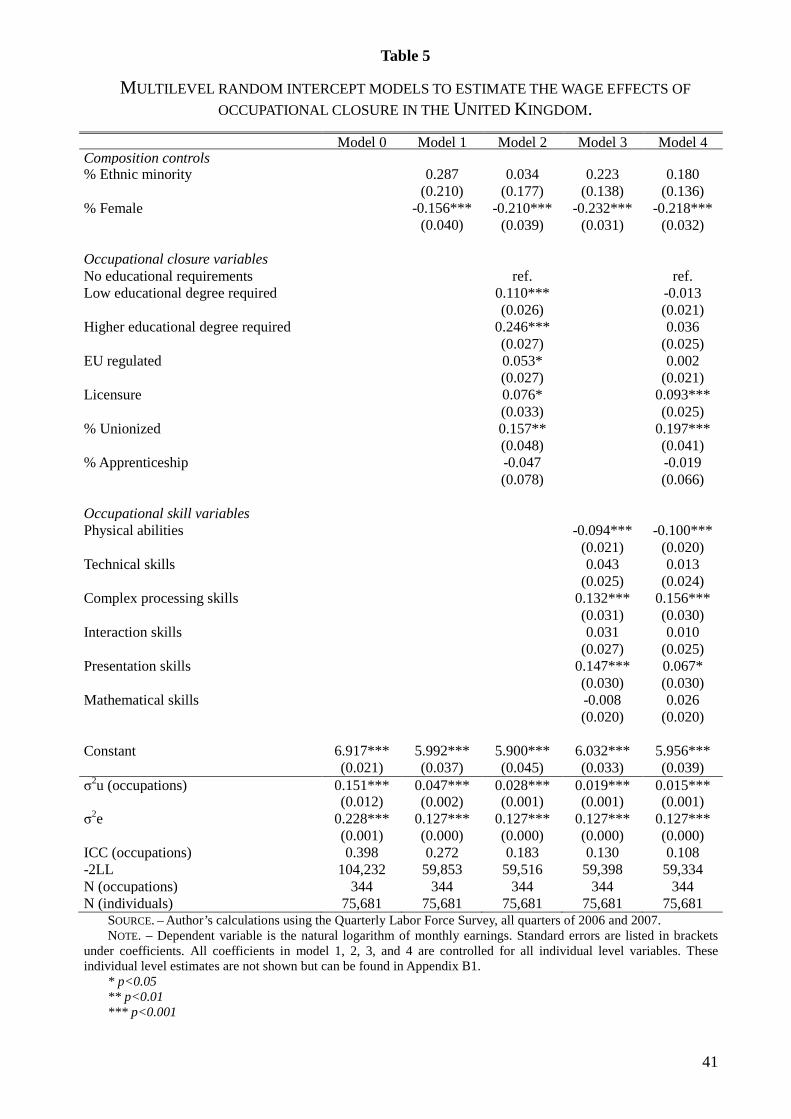
41
Table 5
MULTILEVEL RANDOM INTERCEPT MODELS TO ESTIMATE THE WAGE EFFECTS OF OCCUPATIONAL CLOSURE IN THE UNITED KINGDOM.
Model 0 Model 1 Model 2 Model 3 Model 4 Composition controls % Ethnic minority 0.287 0.034 0.223 0.180 (0.210) (0.177) (0.138) (0.136) % Female -0.156*** -0.210*** -0.232*** -0.218*** (0.040) (0.039) (0.031) (0.032) Occupational closure variables No educational requirements ref. ref. Low educational degree required 0.110*** -0.013 (0.026) (0.021) Higher educational degree required 0.246*** 0.036 (0.027) (0.025) EU regulated 0.053* 0.002 (0.027) (0.021) Licensure 0.076* 0.093*** (0.033) (0.025) % Unionized 0.157** 0.197*** (0.048) (0.041) % Apprenticeship -0.047 -0.019 (0.078) (0.066) Occupational skill variables Physical abilities -0.094*** -0.100*** (0.021) (0.020) Technical skills 0.043 0.013 (0.025) (0.024) Complex processing skills 0.132*** 0.156*** (0.031) (0.030) Interaction skills 0.031 0.010 (0.027) (0.025) Presentation skills 0.147*** 0.067* (0.030) (0.030) Mathematical skills -0.008 0.026 (0.020) (0.020) Constant 6.917*** 5.992*** 5.900*** 6.032*** 5.956*** (0.021) (0.037) (0.045) (0.033) (0.039) σ2u (occupations) 0.151*** 0.047*** 0.028*** 0.019*** 0.015*** (0.012) (0.002) (0.001) (0.001) (0.001) σ2e 0.228*** 0.127*** 0.127*** 0.127*** 0.127*** (0.001) (0.000) (0.000) (0.000) (0.000) ICC (occupations) 0.398 0.272 0.183 0.130 0.108 -2LL 104,232 59,853 59,516 59,398 59,334 N (occupations) 344 344 344 344 344 N (individuals) 75,681 75,681 75,681 75,681 75,681
SOURCE. – Author’s calculations using the Quarterly Labor Force Survey, all quarters of 2006 and 2007. NOTE. – Dependent variable is the natural logarithm of monthly earnings. Standard errors are listed in brackets
under coefficients. All coefficients in model 1, 2, 3, and 4 are controlled for all individual level variables. These individual level estimates are not shown but can be found in Appendix B1.
* p<0.05 ** p<0.01 *** p<0.001
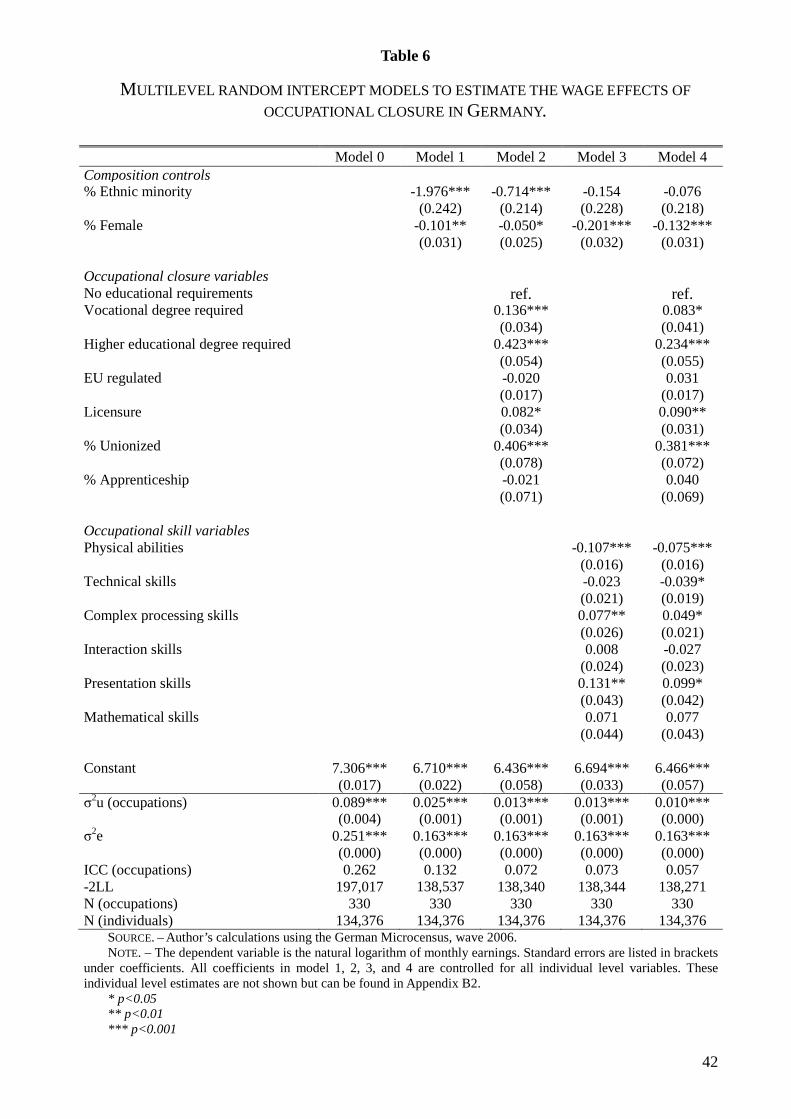
42
Table 6
MULTILEVEL RANDOM INTERCEPT MODELS TO ESTIMATE THE WAGE EFFECTS OF OCCUPATIONAL CLOSURE IN GERMANY.
Model 0 Model 1 Model 2 Model 3 Model 4 Composition controls % Ethnic minority -1.976*** -0.714*** -0.154 -0.076 (0.242) (0.214) (0.228) (0.218) % Female -0.101** -0.050* -0.201*** -0.132*** (0.031) (0.025) (0.032) (0.031) Occupational closure variables No educational requirements ref. ref. Vocational degree required 0.136*** 0.083* (0.034) (0.041) Higher educational degree required 0.423*** 0.234*** (0.054) (0.055) EU regulated -0.020 0.031 (0.017) (0.017) Licensure 0.082* 0.090** (0.034) (0.031) % Unionized 0.406*** 0.381*** (0.078) (0.072) % Apprenticeship -0.021 0.040 (0.071) (0.069) Occupational skill variables Physical abilities -0.107*** -0.075*** (0.016) (0.016) Technical skills -0.023 -0.039* (0.021) (0.019) Complex processing skills 0.077** 0.049* (0.026) (0.021) Interaction skills 0.008 -0.027 (0.024) (0.023) Presentation skills 0.131** 0.099* (0.043) (0.042) Mathematical skills 0.071 0.077 (0.044) (0.043) Constant 7.306*** 6.710*** 6.436*** 6.694*** 6.466*** (0.017) (0.022) (0.058) (0.033) (0.057) σ2u (occupations) 0.089*** 0.025*** 0.013*** 0.013*** 0.010*** (0.004) (0.001) (0.001) (0.001) (0.000) σ2e 0.251*** 0.163*** 0.163*** 0.163*** 0.163*** (0.000) (0.000) (0.000) (0.000) (0.000) ICC (occupations) 0.262 0.132 0.072 0.073 0.057 -2LL 197,017 138,537 138,340 138,344 138,271 N (occupations) 330 330 330 330 330 N (individuals) 134,376 134,376 134,376 134,376 134,376
SOURCE. – Author’s calculations using the German Microcensus, wave 2006. NOTE. – The dependent variable is the natural logarithm of monthly earnings. Standard errors are listed in brackets
under coefficients. All coefficients in model 1, 2, 3, and 4 are controlled for all individual level variables. These individual level estimates are not shown but can be found in Appendix B2.
* p<0.05 ** p<0.01 *** p<0.001

43
Appendix A
OVERVIEW OF SKILL MEASURES
United Kingdom Germany
Physical ability
How important is… (0=not at all important, 1=not very important, 2=fairly important, 3=very important, 4= essential)
1) Physical strength (for example, to carry, push or pull heavy objects). 2) Physical stamina (to work for long periods on physical activities).
Eigenvalue: 1.38 Cronbach’s α: 0.86
How often appear the following condition to you (0= never, 1= rarely, 2=sometimes, 3=frequently)
1) Work standing up. 2) Carry heavy stocks of more than 20kg (men), 10 kg (women). 3) Working crouched down, kneed, reclined, overarm.
Eigenvalue: 1.33 Cronbach’s α: 0.75
Technical skills
How important is… (0=not at all important, 1=not very important, 2=fairly important, 3=very important, 4= essential)
1) Skill or accuracy in using your hands or fingers (for example to mend, repair, assemble, construct or adjust things).
2) Knowledge of how to use or operate tools, equipment or machinery.
Eigenvalue: 0.94 Cronbach’s α: 0.74
Do you require the following skills in your job (0=no, 1=basic skills, 2= specialized skills)
1) Manual/craft skills. 2) Technical skills.
How often does the following task appear in your job?(0=never, 1=sometimes, 2=often)
3) Operating, controlling machines
Eigenvalue: 1.20 Cronbach’s α: 0.70
Complex mental processing
How important is… (0=not at all important, 1=not very important, 2=fairly important, 3=very important, 4= essential)
1) Working out the cause of problems or faults. 2) Thinking of solutions to problems. 3) Analysing complex problems in depth. 4) Planning the activities of others. 5) Thinking ahead.
Eigenvalue: 2.37 Cronbach’s α: 0.81
How often appear the following tasks to you (0= never, 1= rarely, 2=sometimes, 3=frequently)
1) You are confronted with new problems that remain to be understood.
2) Process optimization or trying out new things 3) You are asked to do things you haven’t learned yet or aren’t
proficient in. 4) There are diverse processes and job tasks which you have to
keep an eye on simultaneously. How often does the following job characteristics appear in your job?(0=never, 1=sometimes, 2=often)
5) Having to react to and solving unforeseeable problems. 6) Recognizing and closing own knowledge gaps.
Eigenvalue: 2.34 Cronbach’s α: 0.77

44
Interaction skills
How important is… (0=not at all important, 1=not very important, 2=fairly important, 3=very important, 4= essential)
1) Dealing with people. 2) Instructing, training or teaching people, individually or in groups. 3) Persuading or influencing others. 4) Counselling, advising or caring for customers or clients. 5) Listening carefully to colleagues. 6) Working with a team of people.
Eigenvalue: 2.10 Cronbach’s α: 0.72
How often does the following job characteristics appear in your job?(0=never, 1=sometimes, 2=often)
1) Having contact to customers, clients, patients. 2) Notifying /communicating difficult issues in an intelligible to
all way. How often does it appear that (0=never, 1=sometimes, 2=often)
3) You feel being part of a team.
Eigenvalue: 1.19 Cronbach’s α: 0.61
Presentation skills
How important is… (0=not at all important, 1=not very important, 2=fairly important, 3=very important, 4= essential)
1) Writing short documents. 2) Writing long documents with correct spelling and grammar. 3) Making speeches or presentations.
Eigenvalue: 1.51 Cronbach’s α: 0.81
Do you require the following skills in your job (0=no, 1=basic skills, 2= specialized skills)
1) German language skills, writing, spelling
How often does the following job characteristics appear in your job?(0=never, 1=sometimes, 2=often)
2) Speechmaking, giving talks.
Eigenvalue: 0.88 Cronbach’s α: 0.46
Basic mathematical skills
How important is… (0=not at all important, 1=not very important, 2=fairly important, 3=very important, 4= essential)
1) Adding, subtracting, multiplying or dividing numbers. 2) Calculations using decimals, percentages or fractions.
Eigenvalue: 1.38 Cronbach’s α: 0.87
Do you require the following skills in your job (0=no, 0.5=basic skills, 1= specialized skills)
1) Mathematical, statistical skills As there is only one variable the average score per occupation was taken.
SOURCE. – The British Skills surveys of 2001 and 2006 (the UK, N=12,257) and the BIBB-BAuA Employment Survey of 2006 (Germany, N = 20,000). NOTE. – Over all items a factor analysis was performed and the factor scores were saved as regression coefficients. All individual factor scores were then aggregated to
the occupational level.

45
Appendix B1 INDIVIDUAL LEVEL COVARIATES OF MULTILEVEL REGRESSIONS FOR THE UK
Model 1 Model 2 Model 3 Model 4 b se b se b se b se Female -0.775*** (0.028) -0.792*** (0.021) -0.793*** (0.021) -0.793*** (0.021) Married 0.060*** (0.005) 0.059*** (0.005) 0.059*** (0.005) 0.059*** (0.005) Children in home 0.023*** (0.005) 0.023*** (0.005) 0.023*** (0.005) 0.023*** (0.005) Ethnic minority -0.040*** (0.007) -0.038*** (0.007) -0.038*** (0.007) -0.038*** (0.007) Country of residence
England ref ref. ref. ref. Scotland -0.014* (0.007) -0.014* (0.007) -0.013* (0.007) -0.013* (0.007) Wales -0.067*** (0.009) -0.067*** (0.009) -0.067*** (0.009) -0.067*** (0.009) Northern Ireland -0.044*** (0.012) -0.043*** (0.012) -0.043*** (0.012) -0.043*** (0.012)
Highest level of education
No qualification ref ref. ref. ref. Other qualifications 0.061* (0.027) 0.057* (0.027) 0.056* (0.027) 0.056* (0.027) Below NVQ level 2 -0.033 (0.025) -0.036 (0.025) -0.037 (0.025) -0.037 (0.025) NVQ level 2 -0.019 (0.024) -0.022 (0.024) -0.024 (0.024) -0.024 (0.024) Trade apprenticeships 0.061 (0.035) 0.059 (0.035) 0.057 (0.035) 0.058 (0.035) NVQ level 3 -0.017 (0.023) -0.019 (0.023) -0.022 (0.023) -0.022 (0.023) NVQ level 4 and above -0.009 (0.022) -0.011 (0.022) -0.015 (0.022) -0.015 (0.022)
Years of schooling 0.020*** (0.001) 0.019*** (0.001) 0.019*** (0.001) 0.019*** (0.001) Experience 0.017*** (0.002) 0.017*** (0.002) 0.017*** (0.002) 0.017*** (0.002) Experience squared -0.000*** (0.000) -0.000*** (0.000) -0.000*** (0.000) -0.000*** (0.000) Normal hours in workweek 0.013*** (0.000) 0.013*** (0.000) 0.013*** (0.000) 0.013*** (0.000) Part time -0.518*** (0.010) -0.517*** (0.010) -0.517*** (0.010) -0.516*** (0.010) Experience * Highest level education
Experience * No qualification ref ref. ref. ref. Experience * Other qualification -0.001 (0.002) -0.001 (0.002) -0.001 (0.002) -0.001 (0.002) Experience * Below NVQ level 2 0.006** (0.002) 0.006** (0.002) 0.006** (0.002) 0.006** (0.002) Experience * NVQ level 2 0.006*** (0.002) 0.006*** (0.002) 0.006*** (0.002) 0.007*** (0.002) Experience * Trade apprenticeships 0.004 (0.003) 0.004 (0.003) 0.004 (0.003) 0.004 (0.003) Experience * NVQ level 3 0.011*** (0.002) 0.011*** (0.002) 0.011*** (0.002) 0.011*** (0.002) Experience * NVQ level 4 and above 0.017*** (0.002) 0.017*** (0.002) 0.017*** (0.002) 0.017*** (0.002)
Experience sq.* Highest level education
Experience sq. * No qualification ref ref. ref. ref. Experience sq. * Other qualification 0.000 (0.000) 0.000 (0.000) 0.000 (0.000) 0.000 (0.000) Experience sq. * Below NVQ level 2 -0.000** (0.000) -0.000** (0.000) -0.000** (0.000) -0.000** (0.000) Experience sq. * NVQ level 2 -0.000** (0.000) -0.000** (0.000) -0.000** (0.000) -0.000** (0.000) Experience sq. * Trade apprenticeships -0.000 (0.000) -0.000 (0.000) -0.000 (0.000) -0.000 (0.000) Experience sq. * NVQ level 3 -0.000*** (0.000) -0.000*** (0.000) -0.000*** (0.000) -0.000*** (0.000) Experience sq. * NVQ level 4 and above -0.000*** (0.000) -0.000*** (0.000) -0.000*** (0.000) -0.000*** (0.000)
Female * Country of residence
Female * England ref ref. ref. ref. Female * Scotland 0.024** (0.009) 0.024** (0.009) 0.024** (0.009) 0.024** (0.009) Female * Wales 0.052*** (0.012) 0.052*** (0.012) 0.052*** (0.012) 0.052*** (0.012) Female * Northern Ireland 0.052** (0.016) 0.051** (0.016) 0.050** (0.016) 0.051** (0.016)
Female * Highest level education
Female * No qualification ref ref. ref. ref. Female * Other qualification -0.010 (0.014) -0.010 (0.013) -0.010 (0.013) -0.010 (0.013) Female * Below NVQ level 2 -0.002 (0.012) -0.002 (0.012) -0.002 (0.012) -0.002 (0.012) Female * NVQ level 2 -0.002 (0.012) -0.002 (0.012) -0.001 (0.012) -0.001 (0.012) Female * Trade apprenticeships -0.049** (0.018) -0.049** (0.018) -0.049** (0.018) -0.049** (0.018) Female * NVQ level 3 -0.015 (0.012) -0.016 (0.012) -0.014 (0.012) -0.015 (0.012) Female * NVQ level 4 and above 0.006 (0.012) 0.001 (0.011) 0.004 (0.011) 0.003 (0.011)
Female * Married -0.059*** (0.006) -0.059*** (0.006) -0.059*** (0.006) -0.059*** (0.006) Female * Children in home -0.041*** (0.006) -0.041*** (0.006) -0.042*** (0.006) -0.042*** (0.006) Female * Ethnic minority 0.033*** (0.010) 0.031** (0.009) 0.031** (0.009) 0.031** (0.009) Female * Years of education -0.001 (0.001) -0.001 (0.001) -0.001 (0.001) -0.001 (0.001) Female * Normal hours in workweek 0.021*** (0.000) 0.021*** (0.000) 0.021*** (0.000) 0.021*** (0.000) Female * Part time 0.482*** (0.012) 0.481*** (0.012) 0.480*** (0.012) 0.480*** (0.012) Female * Experience -0.007*** (0.001) -0.006*** (0.001) -0.006*** (0.001) -0.006*** (0.001) Female * Experience sq. 0.000*** (0.000) 0.000*** (0.000) 0.000*** (0.000) 0.000*** (0.000)
* p<0.05, ** p<0.01, *** p<0.001

46
Appendix B2 INDIVIDUAL LEVEL COVARIATES OF MULTILEVEL REGRESSIONS FOR GERMANY
Model 1 Model 2 Model 3 Model 4 b se b se b se b se Female -0.517*** (0.019) -0.518*** (0.019) -0.519*** (0.019) -0.519*** (0.019) Married 0.156*** (0.004) 0.156*** (0.004) 0.156*** (0.004) 0.156*** (0.004) Children in home 0.059*** (0.003) 0.059*** (0.003) 0.059*** (0.003) 0.059*** (0.003) Ethnic minority -0.083*** (0.010) -0.082*** (0.010) -0.083*** (0.010) -0.083*** (0.010) Former East Germany -0.310*** (0.004) -0.310*** (0.004) -0.310*** (0.004) -0.310*** (0.004) Highest level of education
CASMIN 1abc ref. ref. ref. ref. CASMIN 2ab 0.025** (0.010) 0.025** (0.010) 0.025** (0.010) 0.025** (0.010) CASMIN 2c 0.029* (0.012) 0.028* (0.012) 0.027* (0.012) 0.027* (0.012) CASMIN 3a 0.141*** (0.014) 0.136*** (0.014) 0.137*** (0.014) 0.136*** (0.014) CASMIN 3b 0.105*** (0.012) 0.099*** (0.012) 0.100*** (0.012) 0.098*** (0.012)
Years of schooling 0.008*** (0.000) 0.008*** (0.000) 0.008*** (0.000) 0.008*** (0.000) Experience 0.019*** (0.001) 0.019*** (0.001) 0.019*** (0.001) 0.019*** (0.001) Experience squared -0.000*** (0.000) -0.000*** (0.000) -0.000*** (0.000) -0.000*** (0.000) Normal hours in workweek 0.010*** (0.000) 0.010*** (0.000) 0.010*** (0.000) 0.010*** (0.000) Part time -0.267*** (0.009) -0.268*** (0.009) -0.269*** (0.009) -0.269*** (0.009) Experience * Highest level education
Experience * CASMIN 1abc ref. ref. ref. ref. Experience * CASMIN 2ab 0.002* (0.001) 0.002* (0.001) 0.002* (0.001) 0.002* (0.001) Experience * CASMIN 2c 0.007*** (0.001) 0.007*** (0.001) 0.007*** (0.001) 0.007*** (0.001) Experience * CASMIN 3a 0.006*** (0.002) 0.006*** (0.002) 0.006*** (0.002) 0.006*** (0.002) Experience * CASMIN 3b 0.017*** (0.001) 0.018*** (0.001) 0.018*** (0.001) 0.018*** (0.001)
Experience sq. * Highest level education Experience sq. * CASMIN 1abc ref. ref. ref. ref. Experience sq. * CASMIN 2ab -0.000*** (0.000) -0.000*** (0.000) -0.000*** (0.000) -0.000*** (0.000) Experience sq. * CASMIN 2c -0.000*** (0.000) -0.000*** (0.000) -0.000*** (0.000) -0.000*** (0.000) Experience sq. * CASMIN 3a -0.000*** (0.000) -0.000*** (0.000) -0.000*** (0.000) -0.000*** (0.000) Experience sq. * CASMIN 3b -0.000*** (0.000) -0.000*** (0.000) -0.000*** (0.000) -0.000*** (0.000)
Female * Highest level education
Female * CASMIN 1abc ref. ref. ref. ref. Female * CASMIN 2ab 0.015* (0.006) 0.015* (0.006) 0.015* (0.006) 0.015* (0.006) Female * CASMIN 2c 0.023** (0.009) 0.024** (0.009) 0.024** (0.009) 0.024** (0.009) Female * CASMIN 3a -0.006 (0.011) -0.005 (0.011) -0.005 (0.011) -0.005 (0.011) Female * CASMIN 3b 0.003 (0.009) 0.004 (0.009) 0.004 (0.009) 0.004 (0.009)
Female * Married -0.300*** (0.005) -0.300*** (0.005) -0.300*** (0.005) -0.300*** (0.005) Female * Children in home -0.075*** (0.005) -0.075*** (0.005) -0.075*** (0.005) -0.075*** (0.005) Female * Ethnic minority 0.058*** (0.016) 0.058*** (0.016) 0.059*** (0.016) 0.059*** (0.016) Female * Former East Germany 0.168*** (0.006) 0.168*** (0.006) 0.168*** (0.006) 0.168*** (0.006) Female * Years of education 0.002* (0.001) 0.002* (0.001) 0.002** (0.001) 0.002* (0.001) Female * Normal hours in workweek 0.010*** (0.000) 0.010*** (0.000) 0.010*** (0.000) 0.010*** (0.000) Female * Part time 0.192*** (0.011) 0.193*** (0.011) 0.194*** (0.011) 0.194*** (0.011) Female * Experience -0.001 (0.001) -0.001 (0.001) -0.001 (0.001) -0.001 (0.001) Female * Experience sq. 0.000 (0.000) 0.000 (0.000) 0.000 (0.000) 0.000 (0.000)
* p<0.05, ** p<0.01, *** p<0.001

47
Appendices C1 and C2 are available from the first author on request