occupational disease in connecticut, 2019 · approximately 1,700 cases of occupational diseases...
TRANSCRIPT

1
Occupational Disease in Connecticut, 2019
This report covers data for 2017 and was prepared under contract for the
State of Connecticut Workers’ Compensation Commission, Stephen M. Morelli, Chairman,
As part of the Occupational Disease Surveillance Program, in cooperation with the Connecticut Department of Labor and the Connecticut
Department of Public Health
By
Tim Morse, PhD, Professor Emeritus Division of Occupational and Environmental Medicine
and Department of Community Medicine UConn Health
Farmington, CT 06030 [email protected]
September 2019

2
Table of Contents List of Tables ........................................................................................................................... 3 List of Figures ......................................................................................................................... 4 A. Executive Summary ........................................................................................................... 5 Map of rates of illness by town…………………………………………………………...7 B. Summary of Diseases ......................................................................................................... 8 C. Bureau of Labor Statistics/Connecticut OSHA Surveys ............................................... 11 Occupational Illnesses in 2017.........................................................................................11 Illnesses by Industry.........................................................................................................13 Lost-Time Illnesses...........................................................................................................14 D. Workers’ Compensation First Report of Injury Data .................................................. .16 Illnesses by Town/Municipality ................................................................................... 20 Musculoskeletal Disorders ........................................................................................... 22 Infectious Diseases ...................................................................................................... 24 Respiratory Illness and Poisonings ............................................................................... 25 Chronic Lung Conditions ............................................................................................. 25 Skin Conditions ........................................................................................................... 26 Stress and Heart Conditions ......................................................................................... 27 Other Occupational Diseases ....................................................................................... 28 E. Occupational Illness Surveillance System: Physicians’ Reports .................................... 29 Musculoskeletal Disorders ........................................................................................... 32 Skin Conditions ........................................................................................................... 34 Lung/Respiratory Diseases and Poisonings .................................................................. 34 Lead Poisoning ............................................................................................................ 35 Infectious and Other Diseases ...................................................................................... 36 F. Appendix 1: Databases and Methods ............................................................................. 38 G. Appendix 2: Occupational Disease Detail by Type and Year ........................................ 40 H. Appendix 3: Internet Resources for Job Safety and Health .......................................... 42 I. Appendix 4: Who’s Who: Resources in Connecticut on Job Safety and Health ........... 45

3
Tables Table A-1 Summary of Occupational Diseases Reported by Systems, 2015 - 2017 ................. 5 Table B-1 Matched, Unique, and Estimated Total Cases of Occupational Illness, CT, 2017 .... 9 Table C-1 Occupational Disease by Type, BLS/CTDOL 2016 - 2017 ................................... 11 Table C-2 Illness Rates per 10,000 Workers by Industry and Type of Illness, CT, 2017 ........ 13 Table C-3 Illnesses involving Repetitive Motion by Type 2016 - 2017 ................................. 16 Table D-1 Occupational Disease by Type, WCC, 2016 - 2017 .............................................. 16 Table D-2 Occupational Illness by Age, 2017 ....................................................................... 17 Table D-3 Cases of Occupational Disease by Major Industry Sector, WCC, 2017 ................. 18 Table D-4 Type of Disease by Industry Sector, WCC, 2017 .................................................. 18 Table D-5 Specific Industry Sectors with over 25 Cases of Occupational Disease, 2017 ....... 19 Table D-6 Illnesses by Town/Municipality, WCC, 2017 ....................................................... 20 Table D-7 Musculoskeletal Disorders by Type, WCC, 2016 - 2017 ...................................... 22 Table D-8 Musculoskeletal Disorders by Part of Body, WCC, 2017 ..................................... 23 Table D-9 Musculoskeletal Disorders (MSD) with Identified Cause, WCC, 2017 ................. 23 Table D-10 Infectious Disease and Exposures by Type, WCC, 2016 - 2017 ........................... 24 Table D-11 Respiratory Conditions and Poisonings by Cause, WCC, 2016-17 ....................... 25 Table D-12 Chronic Lung Diseases by Type, WCC, 2016 - 2017 ........................................... 26 Table D-13 Skin Diseases by Cause, WCC, 2016 - 2017 ........................................................ 26 Table D-14 Heart, Hypertension and Stress Conditions by Type, WCC, 2016 - 2017............. 27 Table D-15 Stress Conditions by Cause, WCC, 2016-2017..................................................... 27 Table D-16 Other Occupational Illnesses, WCC, 2016 - 2017 ................................................ 28 Table E-1 Occupational Disease Case Reports by Type, OIISS and ABLES, 2008-2017 ...... 29 Table E-2 Type of Illness by Industry Sector (NAICS), OIISS, 2017 .................................... 31 Table E-3 Musculoskeletal Disorders by Type, OIISS, 2016- 2017 ...................................... 32 Table E-4 Common Causes of MSD, OIISS, 2017................................................................ 33 Table E-5 Skin Conditions by Type, OIISS, 2016- 2017 ....................................................... 34 Table E-6 Respiratory Diseases and Poisonings by Type, OIISS, 2016- 2017 ....................... 34 Table E-7 Lead Cases by Level of Blood Lead, CT ABLES, 2016-2017............................... 35 Table E-8 Infectious and Other Illnesses, 2016- 2017 ........................................................... 36 Table G-1 Cases of Occupational Disease, by Type, BLS/CTDOL, 1979 - 2017 ................... 40 Table G-2 Rate per 10,000 Workers of Occupational Disease, by Type, BLS/CTDOL, 1979 - 2017 .................................................................................... 41

4
Figures Figure A-1 Map of Occupational Illness Rates by Town, 2017 ................................................ 7 Figure B-1 Summary of Diseases Reported by System, 2017 ................................................... 8 Figure B-2 Trend in Occupational Disease Reports by Reporting System, 1997-2017 ............. 9 Figure C-1 Rates of Occupational Illness by Type, US and CT, 2017 .................................... 12 Figure C-2 Rates of Occupational Disease by Type and Year, CT, 2002 - 2017 .................... 12 Figure C-3 Rates of Musculoskeletal Disorders, CT and US, 2004 - 2017 ............................ 14 Figure C-4 Rates of Lost-time Carpal Tunnel (CTS) and Tendonitis, US & CT, 2017 ........... 15 Figure D-1 Percent of Women by Disease Type, WCC, 2017 ................................................. 16 Figure D-2 Occupational Illness Cases by Industry, WCC, 2017 ........................................... 17 Figure D-3 Rate per 10,000 Employees (20 cases or more), by Town .................................... 22 Figure E-1 Occupational Disease Case Reports by Type, OIISS and ABLES, 1998-2017 ...... 29 Figure E-2 Occupational Disease by Age, OIISS, 2017 ......................................................... 30 Figure E-3 Occupational Disease by Industry Sector, OIISS, 2017 ........................................ 31 Figure E-4 Musculoskeletal Disorders by Industry Sector, OIISS, 2017 ................................ 33 Figure E-5 Lead Cases 2003-2017 ......................................................................................... 35

5
A. Executive Summary This report focuses on occupational disease reports for 2017 and recent trends in reported cases. It does not address traumatic occupational injuries; data for Connecticut injuries can be found at the national Bureau of Labor Statistics at https://www.bls.gov/iif/oshstate.htm. Occupational diseases are typically harder to detect than injuries, since they often occur over longer periods of time, and can have multiple (including non-occupational) risks. Therefore, this report uses data from three primary sources as a way of establishing a more complete picture of occupational disease: Workers’ Compensation First Report of Injury cases (WCC), physicians’ reports under the Occupational Illnesses and Injury Surveillance System (OIISS), and the Bureau of Labor Statistics/Connecticut Dept. of Labor Annual Survey (BLS/CTDOL). Table A-1: Summary of Diseases Reported by Systems, 2015-2017
Type of Disease BLS/CTDOL WCC OIISS (Physicians) Unique Cases* 2015 2016 2017 2015 2016 2017 2015 2016 2017 2015 2016 2017 Lung & poisonings 200 200 100 364 315 301 178 133 155 511 431 431 Lead ** 425 330 292 425 330 292 Skin 400 500 400 178 193 222 166 158 168 310 313 348 Musculoskeletal*** *** *** *** 2,831 2,916 2,501 734 633 562 3,403 3,430 2,918 Infectious 1,045 1,155 1,398 1390 1513 1365 2,262 2,408 2,384 Hearing loss 200 300 200 84 105 103 17 12 12 99 115 111 Other*** 1,500 1,300 900 788 770 810 178 238 208 940 978 973 Total 2,300 2,300 1,700 5,290 5,454 5,335 3,088 3,017 2,762 7,525 8,005 7,457
Sources: BLS: Bureau of Labor Statistics/CTDOL survey; WCC: CT Workers’ Compensation Commission (First Report of Injury) OIISS: Occupational Illnesses and Injury Surveillance System (physician reports) *Unique cases are the combined total of workers’ compensation cases and physician reports, adjusted for cases reported to both systems **Laboratory reports of adult blood lead levels are from the Connecticut Adult Blood Lead Epidemiology and Surveillance program *** Musculoskeletal Disorders (MSD) definitions vary somewhat between systems. MSD is included in the “other” category for BLS/CTDOL data Table A-1 summarizes the data from the three different sources for the last 3 years. The BLS/CTDOL survey rounds to the nearest 100, so the subcategories do not always sum exactly to the total and yearly changes should be viewed with caution. The OIISS draws from physician reports for known or suspected occupational illnesses and are required of all physicians but in practice are mostly from the network of occupational health clinics (and therefore are likely to over-represent illnesses from those hospitals). Approximately 1,700 cases of occupational diseases were reported under the BLS/CTDOL survey, 5,335 through the workers’ compensation first report of injuries and 2,762 for OIISS (including lead reports) for 2017. The number of reports in 2017 dropped 26% from 2016 in the BLS system, decreased by 2% for workers’ compensation, and decreased 8% for physicians’ reports. Reports from workers’ compensation and physicians combined (adjusting for matching cases reported to both systems) totaled 7,457 unique reports (including the 292 lead poisoning cases from laboratory reporting), a decrease of 7% from the previous year. Statistically adjusting for estimated unreported cases produces an estimate of approximately 20,600 cases of occupational illnesses in Connecticut for 2017 (Table B1). Musculoskeletal disorders (MSD) such as Carpal Tunnel Syndrome and tendonitis dominated the workers’ compensation reports, accounting for 47% of reports (23% of the physician reports). MSD has not been broken out by BLS since 2002, but MSD cases are presumed to be the main portion of the “other illness” category, which is by far the largest BLS category. Respiratory diseases and poisonings, which include respiratory conditions and lung disease such as asthma, as well as poisonings such as from carbon monoxide and lead, accounted for 6% of cases for workers’ compensation and 6% of physician reports. Infectious diseases, which

6
include bloodborne diseases such as HIV and hepatitis, Tb, scabies, Lyme disease (and including exposures as well as diagnosed disease) accounted for 21% in workers’ compensation but 55% of physician reports (infectious disease is categorized under “other disease” in BLS; also, needlesticks and other bloodborne exposures with lost time are counted under injuries rather than illness in BLS). “Other diseases”, which includes infectious diseases and MSD in BLS, physical hazards such as heat and cold exposures, allergies, cancer, and others in Workers’ Compensation and physician reports, accounted for 17% (WC) and 9% (physicians). Skin conditions accounted for 4% (WC) and 7% (physicians). Lead poisoning is tracked separately and is based on laboratory reports to the Connecticut Department of Public Health; very few of those cases are reported to the other systems. There was an overall illness rate of 12.9 cases per 10,000 workers based on the BLS survey, 26% lower than the previous year. The CT rate was 14% lower than the average national rate of 15.0. The highest specific sector rate was for Utilities at 85.8 cases per 10,000 workers, although the number of cases was too low to be reportable, making this rate difficult to evaluate. Local government had an overall rate of 31.4, followed by manufacturing of 24.0 and health care at 23.6. Overall (based on Workers’ Compensation reports), 49% of reports were for women, but this varied by type of case, with a higher proportion than average for infectious diseases (65% women) but lower for all other types of illness. Based on workers’ compensation reports, occupational illnesses occurred more in older workers, with almost half (48%) involving workers between 40 and 59 years old, with 20% involving workers in their 30’s, and 18% in their 20’s. Based on physician reports where race and ethnicity were known, 18% of cases were black and 11% Hispanic. The most common specific diagnoses for musculoskeletal disorders were epicondylitis (tennis elbow) with 22% of the cases, carpal tunnel syndrome (15%), tenosynovitis (12%), and strains and sprains (10%). The most common specific causes (aside from the commonly used terms “repetition” or “cumulative”) for MSD in workers’ compensation reports were lifting and carrying, pushing or pulling, tool use (including vibration exposure), and computing and clerical tasks. Nonspecific respiratory illnesses were the most common type of physician-reported lung condition, with 26% of reports, followed by asthma or reactive airways dysfunction syndrome (RADS) with 22% and asbestos disease or exposures (12%). Exposures associated with respiratory conditions included fumes (including gas, carbon monoxide, and lead), chemicals (including solvents, cleaning chemicals, paint, and oil), mold or indoor air quality, and smoke. Infectious disease and exposures, based on workers’ compensation reports, included 1,029 reports of potential exposure to bloodborne pathogens (including reports of exposure to HIV/AIDS and Hepatitis C), including 378 needlesticks or sharps exposures, accounting for 74% of all infectious disease reports. There were 75 reports of exposure to meningitis in health care settings. There were 86 reports of tick bites, rashes from tick bites and/or a diagnosis of Lyme disease attributed to occupational exposures. There were 194 cases of tuberculosis infection, usually determined by PPD conversion (which is a skin test based on immune response) or based on exposure to patients or clients with TB. Rates of illness varied widely by municipality based on workers’ compensation reports. Often the highest rates appear to be related to having large employers in high rate industries. The overall state mean (average) was 33.3 cases per 10,000 employees. There were 59 towns and cities with at least 25 cases of occupational disease reported to workers’ compensation, and the overall state mean (average) was 32.0 cases per 10,000 employees. For towns with at least 25 cases, Cromwell had the highest rate at 109 cases per 10,000 employees, over 3 times higher than the average rate of 32. Cromwell was followed by Vernon (67), Killingly (66), Stonington (59), Groton (55), New Milford (54), East Haven (54), Stratford (53), South Windsor (50), and Middletown (50).

7
Occupational Health Indicator data for 2015 (see summary of diseases, below) found 149 hospital discharges for asbestosis with 14 fatalities; there were also 40 fatalities from mesothelioma (a rare cancer caused almost only by asbestos). There were 23 work-related pesticide poisonings reported by Connecticut Poison Control Centers. There were an estimated 90,000 Connecticut workers employed in high hazard industries and 182,000 workers employed in high risk occupations. Figure A-1, a map of the rates by town is below, with rates listed in Table D-6. The map is based on 25 or more cases (prepared by Connie Cox Cantor at the Center for Population Health of UConn Health). Figure A-1: Map of Occupational Illness Rates by Town, 2017 (map prepared by Connie Cox Cantor, Center for Population Health, UConn Health)

8
B. Summary of Diseases Figure B-1 shows the totals by disease category for 2017 for three reporting systems: the Bureau of Labor Statistics/CT Dept. of Labor (BLS) survey; Workers’ Compensation (WC) First Reports of Injury; and the Occupational Illnesses and Injury Surveillance System (OIISS) which are physician reports. Categories have been combined to make comparisons as close as possible; however, differences in the three systems’ definitions make comparisons incomplete. For example, Workers’ Compensation only requires reporting for lost-time or restricted duty cases, while the other two reporting systems require all occupational illnesses to be reported, although the BLS data is based on a sample of employers. Although all physicians are legally required to report occupational disease, only a small minority report, usually from the occupational health clinic network. Lead reports from the laboratory reporting system are combined into “lung and poisoning” for the OIISS. The BLS/CTDOL system discontinued collecting “repetitive trauma” as a category in 2002, so MSD has been estimated based on the proportion of “other illness” in the 2001 dataset, which was 85%. See Appendix 1 for a complete description of methods. Figure B-1: Summary of Diseases Reported by System, 2017
Notes: BLS=Bureau of Labor Statistics/ConnOSHA survey; WC=Workers’ Compensation First Report of Injury Database; OIISS= Physicians reports from the Occupational Illnesses and Injury Surveillance System combined with laboratory reports of lead poisoning. MSD for the BLS database was estimated using prior proportions from “other” (85%) since they are no longer broken out by BLS. The Workers’ Compensation database showed the highest number of cases, with 5,335 cases reported, followed by the physicians’ reporting/laboratory database with 2,762 cases, and by the BLS survey with 1,700. There is a low amount of overlap between these systems, so total cases are higher than these figures might indicate (see section below on case matching estimates). Longer term trends in number of reports are complex (Figure B2), with BLS trends generally declining; Workers’ Compensation data generally declining since 2008 (the Workers’ Compensation database appears incomplete in 2003 and 2005-2007); and physician reports (OIISS) fluctuating but generally increasing since 2010 with a peak in 2014. Case Matching and Total of Unique and Estimated Cases of Occupational Illness There is a fairly low number of cases that are reported to both workers’ compensation and by physicians. In order to get a better estimate of the total number of cases of occupational illness in Connecticut, cases were
100
400
765
135301 222
1,398
2,501
913
447
168
1,365
562
220
0
500
1,000
1,500
2,000
2,500
3,000
Lung & Poisoning Skin Infectious MSD Other
BLS
WC
OIISS

9
matched by name, employer, and type of illness for the WC and OIISS reports (Table B-1). This allows a sum of unique cases that were reported to at least one of the two systems and an estimate of cases that were not reported to either. Individual level BLS/ConnOSHA data from their survey was not available for matching, and lab-based lead reports did not have enough detail to match, so BLS and lead reports are not included. Table B-1: Matched, Unique, and Estimated Total Cases of Occupational Illness, CT, 2017
Illness Type Matched OIISS Only
WC Only
Unique Cases
Estimated Unreported
Estimated Total
Infectious 379 986 1,019 2,384 2,651 5,035 Lung 25 130 276 431 1,435 1,866 MSD 145 417 2,356 2,918 6,776 9,694 Other 45 163 765 973 2,771 3,744 Skin 42 126 180 348 540 888 Hearing loss 4 8 99 111 198 309 Total* 640 1,830 4,695 7,165 13,425 20,590
*Total is different than the sum of the categories due to rounding errors in estimating subcategories There was a total of 640 cases that were reported to both workers’ compensation (WC) and by physicians; 1,830 cases were reported only to the physician report system, and an additional 4,695 cases were reported only to the workers’ compensation system. This gives a total of 7,165 unique cases that were reported to at least one of the two systems, with approximately 2,400 infectious cases, 400 lung cases, 3,000 musculoskeletal (MSD) cases, 350 skin conditions, 100 hearing loss cases, and 1,000 “other” cases. Using a statistical method called “capture-recapture” analysis, an estimate was made of the unreported cases (cases not reported to either workers’ compensation nor by physicians), which was about 13,000 cases. When combined with the unique cases, this provides an estimate of approximately 20,500 occupational illness cases in Connecticut for 2017. Figure B-2: Trend in Occupational Disease Reports by Reporting System, 1997-2017
Notes: BLS= Bureau of Labor Statistics/CTDOL survey; WCC= Workers’ Compensation First Report of Injury; OIISS= Occupational Illness and Injury Surveillance System (physician reports). *Notes: BLS figures starting in 2002 not comparable to prior years due to changes in data collection. WCC data was not complete for 2003 and 2005-2007. OIISS was not complete for 2010 and did not include most bloodborne infectious diseases/exposures in 2011. The Connecticut Dept. of Public Health participates in a national program in partnership with the National Institute for Occupational Safety and Health (NIOSH) and the Council of State and Territorial Epidemiologists
0
1,000
2,000
3,000
4,000
5,000
6,000
7,000
19971998
19992000
20012002
20032004
20052006
20072008
20092010
20112012
20132014
20152016
2017
BLS*
WCC
OIISS

10
(CSTE) to track key indicators in occupational safety and health (https://www.cste.org/page/OHIndicators or https://data.ct.gov/Health-and-Human-Services/Occupational-Health-Indicators/rjrv-6g8e/data). The data is only available to 2015, so this data is two years older than the rest of the data tracked in this report, but this standardized data can be compared to other states and also viewed historically back to the year 2000 for most indicators. Some data is published elsewhere in this report (for example in the Bureau of Labor Statistics data), but other data is from other sources such as hospital discharge data that is available to the Dept. of Public Health and is detailed below. Pneumoconioses are a set of disabling lung diseases that have a number of occupational causes, including asbestos (asbestosis), silica (silicosis) and coal dust (coal workers’ pneumoconiosis or CWP). In Connecticut, there were 163 hospital discharges for pneumoconiosis, including 149 cases of asbestosis, 7 CWP, and a small number of silicosis cases (too small to publish). There were 15 deaths from Pneumoconiosis, including 14 fatalities from asbestosis. There were also 40 fatalities reported by the CT Tumor Registry from mesothelioma, a cancer caused almost exclusively by exposure to asbestos, typically occupational. Poison Control Centers in Connecticut reported 23 work-related pesticide poisoning cases in Connecticut for 2015. There were approximately 90,000 Connecticut workers employed in 2015 in the 54 specific high-risk industries (industries with double the national injury and illness rate based on historical Bureau of Labor Statistics data). Industries can be viewed on the CSTE website (https://www.cste.org/page/OHIndicators). This is approximately 6% of the Connecticut workforce. There were approximately 182,000 Connecticut workers (13.7% of the workforce) employed in the 49 high risk occupations that had at least double the national average rate. Based on survey data from the national Asthma Call-Back Survey (ACBS) for 2015, there were an estimated 142,000 adults in Connecticut who report that their asthma was caused or made worse by exposures at work, which was 46.6% of adults with asthma.

11
C. Bureau of Labor Statistics/Connecticut Dept. of Labor Surveys In cooperation with the U.S. Bureau of Labor Statistics (BLS), the Connecticut Department of Labor’s (CTDOL) Office of Research conducts an annual survey of employers for job-related injuries and illnesses; data on injuries in Connecticut can be accessed through the national Bureau of Labor Statistics website at https://www.bls.gov/iif/oshstate.htm. Our report focuses on illnesses and includes data from CTDOL that is not published in that report. Since these statistics are based on a survey rather than a census, numbers and rates are estimated and rounded. The Connecticut Department of Labor acknowledges that the BLS/CTDOL survey under-counts occupational diseases, particularly chronic diseases, since these are frequently not recognized nor reported. Occupational Illnesses in 2017 There were approximately 1,700 reported cases of occupational illnesses in 2017 (Table C-1 and Figure C-1) with an overall rate of 12.9 per 10,000 workers, a 26% decrease from the prior year. Table C-1: Occupational Disease by Type, BLS/CTDOL 2016-2017
2016 2017 % Change in Rate Cases Rates Cases Rates
Respiratory 200 1.3 100 1.1 -15% Skin 500 3.9 400 2.9 -26% Hearing Loss 300 2.2 200 1.9 -14% Poisonings 0.4 Other* 1,300 10.0 900 6.7 -33% Total 2,300 17.4 1,700 12.9 -26%
Source: BLS/CTDOL; Rates are per 10,000 workers, adjusted for hours worked. The data includes public sector. Blanks indicate numbers that are too small or unreliable to publish. Total Illnesses may differ from sum due to rounding errors. *Musculoskeletal disorders (MSD) is categorized under the “Other” category by BLS. Overall rates for Connecticut in 2017 were lower than the U.S., driven primarily by lower rates of Other Illnesses, which includes repetitive trauma (Figure C-1). The overall Connecticut rate (12.9 cases per 10,000 workers) was 14% lower than the U.S. rate of 15.0. Rates decreased in 2017 for both Connecticut and the U.S. Connecticut’s illness rate of 12.9 cases per 10,000 workers ranked 27th highest out of 43 states with publishable data (26 states had higher rates and 16 had lower rates). Alaska had the highest rate of 35.3 and the District of Columbia had the lowest at 7.6. Private sector rates for occupational illness were 11.3 in Connecticut and 12.8 nationally. Connecticut’s public sector rate was 26.4; the U.S. public sector rate was 30.0. In Connecticut, the rate of illnesses increased slightly from 2002-2005, then generally decreased through 2017 with the exception of 2011 (Figure C-2).

12
Figure C-1: Rates of Occupational Illness by Type, US and CT, 2017
Source: BLS and CTDOL. Rates per 10,000 workers, adjusted for hours worked. Figure C-2: Rates of Occupational Disease by Type and Year, CT, 2002-2017
Source: BLS and CTDOL. Rates per 10,000 workers, adjusted for hours worked.
0
2
4
6
8
10
12
14
16
Skin Poisonings Respiratory Hearing loss OtherIllnesses
Total
2.2
0.21.3 1.4
9.9
15
2.9
0.41.1
1.9
6.7
12.9
US
CT
0
5
10
15
20
25
30
35
40
2002 2003 2004 2005 2006 2007 2008 2009 2010 2011 2012 2013 2014 2015 2016 2017
6.2 6.9 6.4 6.3 4.3 4.7 5.1 4.7 5.1 6.3 4.6 3.5 3.4 3.0 3.9 3
2.43.8 2.7 3.6
1.8 2.7 2.2 2.3 2.12.0
2.62.0 1.9 1.5 1.3
1.1
0.60.2
0.3
0.30.2 1.0
0.2 0.2 0.4
3.6 2.8
3.33.4 2.7 3.5 2.5
2.5 2.62.2 2.1 1.7 2.2 1.9
23.724.0
22.1 23.3
18.8 18.215.4 15.0
13.1
16.8
12.012.4
11.0 11.3 10.0
6.7
Skin Respir Poison Hearing Other

13
Illnesses by Industry Numbers and rates by industry sector for 2017 are presented in Table C-2. Overall, the adjusted rate was 12.9 cases of occupational illness per 10,000 CT workers, 26% lower than the 2016 rate of 17.4 (the number of cases also decreased 26% to 1,700). The overall private sector rate was 11.3, with a government rate of 26.4 (more than double the private sector rate). Table C-2: Illness Rates per 10,000 Workers by Industry and Type of Illness, CT, 2017
Total Skin Respiratory Poison Hearing Other Rate No. Rate No. Rate No. Rate No. Rate No. Rate No. All industries including state and local government 12.9 1.7 2.9 0.4 1.1 0.1 0.4 -- 1.9 0.2 6.7 0.9 Private industry 11.3 1.3 2.0 0.2 1.0 0.1 0.4 -- 2.0 0.2 5.9 0.7 Goods-producing 18.9 0.4 1.8 -- -- -- -- -- 9.2 0.2 6.7 0.1 Manufacturing 24.0 0.4 2.0 -- -- -- -- -- 12.4 0.2 8.5 0.1 Service-providing 9.5 0.9 2.1 0.2 1.1 0.1 0.4 -- 0.4 -- 5.7 0.5 Trade, transportation, and utilities 11.0 0.3 2.0 -- 1.9 -- -- -- -- -- 5.9 0.1 Wholesale trade 11.3 0.1 -- -- -- -- -- -- -- -- 4.3 -- Retail trade 5.9 0.1 -- -- -- -- -- -- -- -- 3.7 -- Transportation and warehousing 17.3 0.1 -- -- -- -- -- -- -- -- 10.5 -- Utilities 85.8 -- 30.4 -- -- -- -- -- -- -- 45.4 -- Information -- -- -- -- -- -- -- -- -- -- -- -- Finance, insurance, and real estate 2.5 -- -- -- -- -- -- -- -- -- 1.7 -- Finance and insurance 2.9 -- -- -- -- -- -- -- -- -- 2.0 -- Professional and business services 5.2 0.1 -- -- -- -- -- -- -- -- -- -- Educational and health services 19.2 0.5 5.2 0.1 2.2 0.1 -- -- -- -- 11.5 0.3 Health care and social assistance 23.6 0.5 6.5 0.1 2.4 -- -- -- -- -- 14.2 0.3 Leisure, entertainment, and hospitality 2.4 -- -- -- -- -- -- -- -- -- -- -- State and local government 26.4 0.4 10.3 0.1 2.0 -- -- -- -- -- 13.4 0.2 State government 17.1 0.1 10.1 0.1 -- -- -- -- -- -- 4.7 -- Local government 31.4 0.3 10.4 0.1 2.0 -- -- -- -- -- 18.0 0.2
Source: CTDOL; Rates are adjusted for hours worked and are per 10,000 full-time workers. Number of cases are in thousands (i.e 0.2 means 200 cases). Blanks indicate too little data for reliable estimates. Detailed subcategories with no publishable data are omitted. The highest specific sector rate was for Utilities at 85.8 cases per 10,000 workers, although the number of cases was too low to be reportable, making this rate difficult to evaluate. Local Government had an overall rate of 31.4, followed by Manufacturing of 24.0 and Health Care at 23.6. Skin conditions were most common at Utilities (30.4), respiratory in Health Care (2.4), hearing loss in Manufacturing (12.4), and “other conditions” (including repetitive trauma) in Utilities (45.4).

14
Lost-Time Illnesses BLS obtains additional data for the subset of cases that result in lost worktime and provides additional detail on specific conditions and causes. The following draws from this data for conditions that are more chronic in nature (usually classified as occupational illness). Restricted work cases are not included in this data, which is about half again the number of lost worktime cases. Musculoskeletal Conditions The rate of musculoskeletal disorders (MSD) with lost time was 2% lower than the previous year at 48.9 cases per 10,000 workers (Figure C-3). The Connecticut rate is 60% higher than the national MSD rate of 30.5. MSD rates in Connecticut have generally decreased over the last seven years. National rates for all private and public employees have only been available since 2008. Musculoskeletal conditions are the most common category of specific injury and illness conditions and is a category that includes both chronic conditions and sprains and strains from overexertion. BLS defines this fairly complex category as “includes cases where the nature of the injury or illness is pinched nerve; herniated disc; meniscus tear; sprains, strains, tears; hernia (traumatic and non-traumatic); pain, swelling, and numbness; carpal or tarsal tunnel syndrome; Raynaud's syndrome or phenomenon; musculoskeletal system and connective tissue diseases and disorders, when the event or exposure leading to the injury or illness is overexertion and bodily reaction, unspecified; overexertion involving outside sources; repetitive motion involving microtasks; other and multiple exertions or bodily reactions; and rubbed, abraded, or jarred by vibration.” Figure C-3: Rates of Musculoskeletal Disorders, CT and US, 2004-2017
Source: U.S. Bureau of Labor Statistics (Customized Tables); http://data.bls.gov Rates are cases per 10,000 full time employees, public and private Carpal Tunnel Syndrome (CTS) was the most common specific illness in CT, with a rate of 1.0 cases per 10,000 workers in 2017 (Figure C-4), and 0.3 cases per 10,000 of tendonitis. The rate of CTS in CT was 67% higher than the national rate, but 50% lower for tendonitis. CTS had a very high number of lost work days, with a median of 20 days of lost time per case (compared to 8 days for all cases of injury and illness) in CT. Tendonitis (and related soft-tissue disorders) was also high at 27 days.
0
10
20
30
40
50
60
70
2004 2005 2006 2007 2008 2009 2010 2011 2012 2013 2014 2015 2016 2017
60.154.9 56.6 56.2 53.9
47.651.6
55.4 54.657.9
51.1 50.6 50 48.9
35 33 34.338.5 37.8 35.8 33.8 32.2 31.2 30.5 CT
US

15
Figure C-4: Rates of Lost-time Carpal Tunnel (CTS) and Tendonitis, US & CT, 2017
Source: BLS Website http://www.bls.gov customized tables, private and public, cases per 10,000 full time employees. Connecticut lost time cases coded as “repetitive motion” for cause decreased to 2.7 cases per 10,000 workers from 3.3 in the previous year. Computer tasks was the largest specific cause of repetitive motion (Table C-3). The CT rate was 17% higher than the national rate of 2.3. Repetitive motion lost time cases in CT had a median of 20 days away from work. Table C-3: Illnesses involving Repetitive Motion by Type, 2016-2017 Repetitive Motion Injuries 2016 2017 Microtasks (unspecified) 1.1 0.7 Typing and computer 0.7 0.9 Tools 0.4 0.5 Grasping, placing, moving 0.6 0.5 Hand use (not tools) 0.1 0.1 Multiple types of repetitive motions 0.2 Other microtasks All repetitive with microtasks (total) 3.3 2.7
0.00.10.20.30.40.50.60.70.80.91.0
CT US CT US
CTS Tendonitis & Related
1.0
0.6
0.3
0.6

16
D. Workers’ Compensation First Report of Injury Data There was a total of 5,335 reports in the Workers’ Compensation First Report of Injury Database for 2017 (Table D-1), a 2% decrease from 2016, with a 21% increase in infectious diseases, a 15% increase in skin disorders, a 4% decrease in lung disorders, a 14% decrease in musculoskeletal disorders (MSD) and a 4% increase in “other illnesses”. Approximately half (47%) of the reports were due to chronic musculoskeletal disorders (MSD) such as carpal tunnel syndrome and tendonitis. Infectious diseases accounted for 21% of the cases, lung diseases (including nonspecific respiratory illness and chronic lung conditions such as asthma and asbestos-related illnesses and exposures) 6%, skin disorders 4%, and “Other Illnesses” (which includes heart conditions, stress cases, noise-induced hearing loss, and other conditions), 17%. Table D-1: Occupational Disease by Type, WCC, 2016-2017
Illness type 2016
Cases 2017
Cases % of Total % Change
Musculoskeletal Disorders (MSD) 2,916 2,501 47% -14% Infectious Disease 1,155 1,398 26% 21% Lung Disorders 315 301 6% -4% Skin Disorders 193 222 4% 15% Other Illnesses 875 913 17% 4% Total 5,454 5,335 100% -2%
Overall, 49% of reports were for women, but this varied by type of case, with a higher proportion than average for infectious diseases (65% women) but lower for all other types of illness (Figure D-1). Figure D-1: Percent of Women by Disease Type, WCC, 2017
Reported occupational illnesses occurred more in older workers, with almost half (48%) involving workers between 40 and 59 years old (Table D-2), with 20% involving workers in their 30’s, and 18% in their 20’s. Numbers and rates of occupational illnesses by industry sector are presented by major North American Industry Classification System (NAICS) classifications in Figure D-2 and Table D-3. Ninety-eight percent (98%) of
0%
10%
20%
30%
40%
50%
60%
70%
Infectious Lung MSD Other Skin Total
65%
42%47%
36% 34%
49%

17
reported cases were able to be coded for major industry sector. The largest sectors in terms of overall numbers were Government (34%), Manufacturing (13%), Education/Health (17% of all cases; there are also health and education cases classified under government, such as employees in public schools), and Trade (14%). Table D-2: Occupational Illness by Age, 2017 Age Range Cases Percent Under 20 63 1% 20-29 942 18% 30-39 1,042 20% 40-49 1,162 22% 50-59 1,394 26% 60-69 646 12% 70+ 78 1% Unknown 8 -- Total 5,335 100%
Figure D-2: Occupational Illness Cases by Industry, WCC, CT, 2017
The number of illnesses by industry may be compared to the size of employment in those industries to understand which industries are at higher risk for illness. Table D-3 shows these figures, excluding cases where the industry was unknown. Overall, the rate of illness is 32.0 cases per 10,000 workers, a decrease of 2% from the 32.7 cases per 10,000 in 2016. The highest rates by industry sector were for Government (79.6, 149% higher than the overall rate) and Manufacturing (43.3 or 35% higher), with all other sectors below the average rate. Table D-4 provides the detail of industry sector by type of condition. Patterns of illness by industry differed by the type of illness, although Government was relatively high in all categories. Table D-4 is based on numbers
Construction/Agriculture/Mining, 2%
Manufacturing, 13%
Trade, 14%
Transportation/Utilities, 2%
Information Services, 1%
Finance/Insurance/Real Estate, 2%
Business Services,
7%Education/Health, 17%Leisure/Other Services, 5%
Government, 34%

18
of cases and not rates, so they are not adjusted for employment size in the different sectors (rates are shown in Tables D-3 and D-5). Table D-3: Cases of Occupational Disease by Major Industry Sector, WCC, 2017
NAICS Sector Cases % Employment % Rate Construction/Agriculture/Mining 131 2% 63,616 4% 20.6 Manufacturing 687 13% 158,810 10% 43.3 Trade 761 14% 246,054 15% 30.9 Transportation/Utilities 133 2% 51,345 3% 25.9 Information Services 40 1% 31,513 2% 12.7 Finance/Insurance/Real Estate 120 2% 126,071 8% 9.5 Business Services 366 7% 218,370 13% 16.8 Education/Health 910 17% 325,450 19% 28.0 Leisure/Other Services 270 5% 220,804 13% 12.2 Government* 1,809 34% 227,238 14% 79.6 Unknown 108 2% 498
Total 5,335 100% 1,669,766 100% 32.0 Notes: Employment is adjusted for hours worked. A small number of reports that could not be coded for industry are categorized as unknown. Rates are illnesses per 10,000 workers. Total employment and percent do not equal the sum of components due to rounding errors. *Government sector includes cases that could alternately be classified under health and education (i.e. public schools). NAICS is the North American Industry Classification System. Government had a high number of cases in all categories of illnesses. Infectious diseases were concentrated in Government (50%) and Education/Health (37%). Lung diseases were concentrated in Government (48%), Manufacturing (13%), and Trade (11%). Musculoskeletal disorders (MSD) were spread across Trade (22%), Government (21%), Manufacturing (21%), and Education/Health (12%). Skin disorders were spread across Government (43%), Education/Health (14%), and Business Services (11%). “Other” illnesses, including heart conditions and hypertension, stress, and hearing loss cases (see below) were most common in Government (41%), Trade (18%) and Manufacturing (13%). Table D-4: Type of Disease by Industry Sector, WCC, 2017
Other Lung Infectious MSD Skin Total Construction/Agric/Mining 25 3% 5 2% 11 1% 84 3% 6 3% 131 3% Manufacturing 120 13% 39 13% 5 0% 505 21% 18 8% 687 13% Trade 158 18% 32 11% 17 1% 534 22% 20 9% 761 15% Transport/Utilities 17 2% 6 2% 10 1% 98 4% 2 1% 133 3% Information Services 9 1% 3 1% 1 0% 27 1% 0% 40 1% Finance/Insurance/RE 23 3% 13 4% 4 0% 74 3% 6 3% 120 2% Business Services 61 7% 19 6% 117 8% 145 6% 24 11% 366 7% Education/Health 57 6% 27 9% 514 37% 282 12% 30 14% 910 17% Leisure/Other Services 64 7% 9 3% 15 1% 164 7% 18 8% 270 5% Government 364 41% 141 48% 693 50% 518 21% 93 43% 1,809 35% Subtotal 898 100% 294 100% 1,387 100% 2,431 100% 217 100% 5,227 100% Unknown 15 7 11 70 5 108
Total 913 301 1,398 2,501 222 5,335

19
Table D-5: Specific Industry Sectors with over 25 Cases of Occupational Disease, WCC, 2017 Specific Industry Sector Cases Employment Rate 2016 Change
from 2016 Computer and Electronic Product Manufacturing 121 11,236 107.7 153 -21% State Government 590 61,481 96.0 658 -10% Local Government 1,220 147,734 82.6 1,202 1% Electric Power Generation 37 5,333 69.4 24 54% Hospitals 387 58,876 65.7 268 44% Food and Beverage Stores 272 43,892 62.0 139 96% Electrical Equip, Appliance, Component Manufactg. 42 7,993 52.5 47 -11% Transportation Equipment Manufacturing 224 43,975 50.9 248 -10% Fabricated Metal Product Manufacturing 127 29,413 43.2 142 -11% Merchant Wholesalers, Nondurable Goods 76 20,149 37.7 70 9% Food Products 30 8,128 36.9 35 -14% Couriers and Messengers 28 7,587 36.9 28 0% Chemical Manufacturing 28 7,795 35.9 33 -15% Administrative and Support Services 276 83,745 33.0 284 -3% Accommodation 36 11,895 30.3 33 9% Nursing and Residential Care Facilities 179 61,645 29.0 181 -1% General Merchandise Stores 82 28,428 28.8 97 -15% Non-residential Construction 29 10,865 26.7 27 7% Merchant Wholesalers, Durable Goods 79 29,972 26.4 100 -21% General Purpose Machinery Manufacturing 34 13,402 25.4 39 -13% Repair and Maintenance 33 13,576 24.3 23 43% Motor Vehicle Dealers 50 21,517 23.2 74 -32% Hardware Stores 33 15,124 21.8 23 43% Residential Building Leasing 32 14,814 21.6 21 52% Educational Services 121 57,860 20.9 59 105% Clothing and clothing accessories 35 17,248 20.3 35 0% Health and Personal Care Stores 27 13,675 19.7 58 -53% Specialty Trade Contractors 79 40,504 19.5 91 -13% Physician Offices 175 90,605 19.3 204 -14% Amusement, Gambling, and Recreation 33 21,468 15.4 29 14% Credit Intermediation and Related Activities (Banks) 37 24,337 15.2 36 3% Personal and Laundry Services 26 21,883 11.9 26 0% Social Assistance 47 56,465 8.3 53 -11% Food Services and Drinking Places 96 116,341 8.3 112 -14% Professional, Scientific, and Technical Services 66 96,354 6.8 99 -33% Insurance Carriers and Related Activities 36 58,375 6.2 32 13%

20
Table D-5 shows those specific industry (3-digit NAICS code) sectors that reported 25 or more cases of occupational illness in 2017, ordered by the highest rate of illness. Local Government and State Government do not show detailed sector (such as Education or Health) since the data did not provide reliable detail. The highest rates were in Computer and Electronic Product Manufacturing (107.7 cases per 10,000 workers), State government (96.0), Local Government (82.6), Electric Power Generation (69.4), Hospitals (65.7), Food and Beverage Stores (62.0), Electrical Equipment, Appliance, and Component Manufacturing (52.5), Transportation Equipment Manufacturing (50.9), Fabricated Metal Product Manufacturing (43.2), Merchant Wholesalers of Nondurable Goods (37.7), Food Products (36.9), Couriers and Messengers (36.9), Chemical Manufacturing (35.9), and Administrative and Support Services (33.0). Although all of the specific sectors in the table had over 25 cases reported, the other 23 categories were at or below the average overall state rate of 32.0 per 10,000 workers (primarily because they are sectors that employ relatively large numbers of workers). Illnesses by Town/Municipality Occupational illnesses were coded by the town where the illness occurred (typically the town where the employer is located). Table D-6 and Figure A-1 show the rates of illness per 10,000 employees per town (based on total employment by town of employment, provided by the CT Dept. of Labor) for all towns and municipalities with at least 25 cases of occupational illness reported in 2017. The table is ordered by rates, with the highest rates first. Rates of illness varied widely by municipality; often high rate towns appear to be related to large employers in high rate industries. The overall state average was 32.0 cases per 10,000 employees. For towns with at least 25 cases, Cromwell had the highest rate at 109 cases per 10,000 employees, over 3 times higher than the average rate of 32. Cromwell was followed by Vernon (67), Killingly (66), Stonington (59), Groton (55), New Milford (54), East Haven (54), Stratford (53), South Windsor (50), and Middletown (50). Table D-6: Illnesses by Town/Municipality, 25 or more cases, WCC, 2017
Town Cases Employment Rate per 10,000 Rank Cromwell 82 7,518 109 1 Vernon 56 8,336 67 2 Killingly 59 8,989 66 3 Stonington 46 7,737 59 4 Groton 152 27,520 55 5 New Milford 44 8,128 54 6 East Haven 32 5,952 54 7 Stratford 135 25,404 53 8 South Windsor 68 13,551 50 9 Middletown 136 27,294 50 10 Farmington 157 32,223 49 11 Guilford 39 8,081 48 12 Cheshire 72 16,254 44 13 Mansfield 50 11,431 44 14 Southington 72 16,601 43 15 Waterbury 166 39,205 42 16 Manchester 116 27,481 42 17 Hartford 467 111,319 42 18 Putnam 25 6,106 41 19 Torrington 60 14,759 41 20

21
Waterford 43 11,242 38 21 New Haven 308 82,438 37 22 Danbury 155 44,128 35 23 Newington 58 16,559 35 24 Trumbull 53 15,434 34 25 New London 48 14,117 34 26 Glastonbury 58 17,113 34 27 Westport 48 14,992 32 28 Simsbury 27 8,437 32 29 Plainville 31 9,898 31 30 Windsor 81 25,980 31 31 Newtown 26 8,469 31 32 Rocky Hill 53 17,346 31 33 Wethersfield 29 9,778 30 34 Bridgeport 125 42,178 30 35 Windham 29 10,225 28 36 Bristol 63 22,317 28 37 Orange 30 10,650 28 38 Milford 76 27,779 27 39 West Hartford 79 28,899 27 40 Montville 35 12,836 27 41 Berlin 31 11,413 27 42 Meriden 61 22,682 27 43 Norwich 45 17,221 26 44 Windsor Locks 32 12,886 25 45 West Haven 38 15,441 25 46 Enfield 46 18,793 24 47 Bloomfield 45 18,791 24 48 Wilton 29 12,608 23 49 Norwalk 97 44,680 22 50 Wallingford 61 28,297 22 51 East Hartford 68 32,027 21 52 Greenwich 72 34,780 21 53 New Britain 49 24,583 20 54 North Haven 33 18,157 18 55 Hamden 32 20,372 16 56 Fairfield 39 25,159 16 57 Shelton 36 23,774 15 58 Stamford 57 76,052 7 59 Connecticut 5,342 1,669,921 32
*Lower rank indicates higher rates of illness (i.e. the town ranked first has the highest rate of illness). Ranks are based on the towns with at least 25 cases of illness reported for the year. Employment figures are based on the town of employment. The Connecticut rate is the average of all towns, not just those with 25 or more cases.

22
Musculoskeletal Disorders (MSD) “Musculoskeletal disorders” is the currently-used term for conditions also known as cumulative trauma disorders or repetitive strain injuries. There were 2,501 cases of MSD reported to Workers’ Compensation in 2017, a 14% decrease from 2016 (Table D-7). MSD accounted for just under half (47%) of the reported occupational diseases to Workers’ Compensation. MSD do not include cases for conditions determined to be injuries caused from sudden events (this is a different definition than that used by BLS/CTDOL for lost time MSD, which includes some acute injuries). Most cases for the lower back are not included (since the descriptions of back conditions are typically insufficient to be able to distinguish between acute injuries and cumulative back injuries) unless they specifically noted that they were due to repetitive exposures. Strains and sprains (which do not include acute strains or sprains such as those from single events/accidents) was the most common category of MSD, with 70% of reports (Table D-7) coded for that general category. Carpal Tunnel Syndrome (CTS), which is a very debilitating pinching of the median nerve at the wrist, accounted for 10% of total MSD reports. Other nerve-related problems (with descriptions of numbness or tingling) accounted for an additional 4% of cases. Tendon-related problems including tendonitis and tenosynovitis, epicondylitis (“tennis elbow” or “golfer’s elbow”), trigger finger, and rotator cuff accounted for 3% of cases. A large number of cases did not have a specific description other than inflammation, swelling, pain or no specific description. Table D-7: Musculoskeletal Disorders (MSD) by Type, WCC, 2016-2017
2016 2017 MSD Type Cases Cases % Change
Sprain/strain 2,140 1,755 70% -18% Carpal Tunnel Syndrome 260 262 10% 1% Numbness 112 91 4% -19% Tendonitis/tenosynovitis 38 38 2% 0% Trigger finger 29 29 1% 0% Ganglion cyst 17 16 1% -6% Epicondylitis 16 13 1% -19% Rotator cuff 11 7 0% -36% Arthritis/bursitis 6 11 0% 83% Other/Unknown 287 279 11% -3% Total 2,916 2,501 100% -14%
Over two-thirds (70%) of the cases of MSD were in the upper limbs of the body such as hands, arms, elbows, and shoulders (Table D-8). Another 15% were for the lower extremity (legs, knees and feet), and 7% for the neck, upper back, and torso (note that lower back cases were excluded from these figures unless they explicitly indicated they were due to cumulative exposures). Causes of conditions were often incomplete, overlapping, and not consistently coded nor described. Approximately 80% of MSD cases had enough description to show some cause. Of the MSD that could be classified (Table D-9), the most frequently mentioned cause was the broad category of “repetitive” (26% of cases). This term is often used as a general description to describe any chronic musculoskeletal problem. Repetitive motion was followed by lifting and carrying (18.6%), pushing or pulling (13.6%), tool use (including references specifically to pneumatic tools or vibration exposure; 10.2%), and computing and clerical tasks (8.3%).

23
Table D-8: Musculoskeletal Disorders by Part of Body, WCC, 2017 Part of body Cases Percent
Lower Arm, Wrist, Hand 1,042 42% Upper Arm, Shoulder, Upper Extremity 521 21% Legs, Knees, and Feet 375 15% Elbow 176 7% Neck and Upper Back 114 5% Trunk 54 2% Multiple 201 8% Other/Unknown 18 1% 2,501 100%
Table D-9: Musculoskeletal Disorders (MSD) with Identified Cause, WCC, 2017
Cause of MSD Reports % Repetitive 525 25.7% Lifting/carrying 380 18.6% Push/pull 279 13.6% Tools/vibration 209 10.2% Computer/clerical 170 8.3% Reaching 88 4.3% Bending/kneeling/crawling 65 3.2% Assembly 43 2.1% Climbing 39 1.9% Twisting 36 1.8% Machine 33 1.6% Cleaning/mopping/sweeping 29 1.4% Walking/running/moving 28 1.4% Grasping/gripping/squeezing 25 1.2% Patient care 19 0.9% Sitting/standing 16 0.8% Selecting/sorting/inspecting/packing 16 0.8% Shoveling 15 0.7% Driving 13 0.6% Scanning/cashier 13 0.6% Overhead 5 0.2% Sub-Total 2,046 100.0% Unknown/other 455 Total 2,501

24
Infectious Diseases There were 1,398 reports of infectious diseases or exposures in the database for 2017 (Table D-10), a 21% increase from the previous year. Infectious disease reports include both actual disease and exposure to infectious agents. There were 1,029 reports of exposure to bloodborne pathogens (including reports of exposure to HIV/AIDS and Hepatitis C), accounting for 74% of all infectious disease reports and an 17% increase from the previous year. These included 378 needlestick injuries or cuts from sharps or surgical instruments that may have resulted in exposure to a patient’s blood, 459 reports of exposures to human bites (cases were excluded if they specifically indicated the skin was not broken), and 192 reports of skin or eye exposure to blood or bodily fluids. There were additional reports of exposure to “spit” or “sputum” that are not reported here, since risks tend to be extremely low from such exposures. Diseases that can be contracted through blood and body fluid exposures include hepatitis B and C and HIV. Human bites are considered to be relatively low risk exposures in terms of bloodborne disease transmission. Exposure to blood and fluids are somewhat higher risk (especially if the worker has open wounds or sores). Sharps (i.e. scalpels) and needlesticks are considered the highest risk (especially if they are deep cuts or injections). Incidents concerning prisoners or clients (including special needs students) accounted for the vast majority of human bites as well as some of the other bloodborne exposures. The data does not have consistent information on whether the source patient is known to be infected with a bloodborne illness such as HIV or hepatitis, so many of these reported incidents will have little or no actual risk of disease transmission. However, preventive efforts focus on universal precautions, so it is important to reduce these incidents regardless of whether patients/clients are known to be infected. Table D-10: Infectious Diseases and Exposures by Type, WCC, 2016-2017
2016 2017 Illness Cases % Cases % Change
Bloodborne: Human bite 406 35% 459 33% 13% Bloodborne: Sharp and needlestick exposures 290 25% 378 27% 30% Bloodborne: Blood/body fluids 176 15% 192 14% 9% TB, PPD conversion or TB exposure 47 4% 194 14% 313% Lyme Disease/tick bite 57 5% 86 6% 51% Other infectious 45 4% 43 3% -4% Scabies/lice 20 2% 17 1% -15% Rabies 12 1% 12 1% 0% MRSA/staph/strep 20 2% 8 1% -60% Meningitis exposure 75 6% 7 1% -91% Chicken pox, measles, whooping cough 7 1% 2 0% -71% Total 1,155 100% 1,398 100% 21%
There were 194 cases of tuberculosis infection (usually determined by PPD conversion, a skin test based on immune response to TB) or exposure to clients with TB; this was an increase of 313% from 2016. There were 86 reports of tick bites, rashes from tick bites and/or a diagnosis of Lyme disease attributed to occupational exposures, a 51% increase. In addition, there were 17 cases of scabies or lice exposures/illnesses, 12 cases of exposure to rabies, 8 reports of exposure or cases of MRSA (Methicillin-resistant Staphylococcus aureus, or staph infection that responds poorly to antibiotics) or other staph or strep infections, 7 reports of meningitis exposure or illness, and 2 cases of chicken pox, measles or whooping cough. Court decisions have broadened the definition of compensable disease under Workers’ Compensation to include exposures, particularly where exposure requires medical treatment such as prophylactic treatments for tuberculosis (TB) and AIDS (HIV) exposures. It is often difficult to determine whether the first report of injury was actual disease or only exposure (for example, actual Lyme disease or only a report of a tick bite).

25
Respiratory Illness and Poisonings There were 183 cases of respiratory illnesses (mostly nonspecific respiratory illness from relatively acute chemical or biological exposures) for 2017 (Table D-11), a 15% increase from 2016. There were 16 cases of poisonings from carbon monoxide, other gases, mercury, or lead, a 16% decrease from the previous year. In addition, chronic lung disease such as asbestos-related illnesses, asthma, and lung cancer are addressed in the following section. Chemical exposures were the most common cause of respiratory illness, (33% of cases) followed by smoke or fire (20%), general indoor air quality (IAQ) or mold (9%), and dust or fumes (21%). There were 15 cases of poisoning from exposure to carbon monoxide or other gases and fumes, and no Workers’ Compensation reports of lead and 1 mercury poisoning or exposure in 2017. In addition to the more general categories of smoke and mold, specific substances were reported as connected to the respiratory cases: Acetone (2), acid, bleach (4), cleaning chemicals (5), fire extinguisher (2), Freon, glycol (11), police inadvertent exposure to narcotic drugs (3), paint (4), perfume (2), and welding fumes. Table D-11: Respiratory Conditions and Poisonings by Cause, WCC, 2016-2017
Cause 2016 2017 Respiratory Cases % Cases % Change
Chemical exposure 66 42% 60 33% -9% Smoke or fire 37 23% 36 20% -3% IAQ/mold/odor 21 13% 17 9% -19% Dust/fumes 14 9% 38 21% 171% Other respiratory 21 13% 32 17% 52% Respiratory subtotal 159 100% 183 100% 15%
Poisoning Carbon monoxide/gas 17 81% 15 94% -12% Lead 0 0% 0 0% Other poisoning 4 19% 1 6% -75% Poisoning subtotal 21 100% 16 100% -24% Total Respiratory and Poisoning 180 100% 199 100% 11%
Chronic Lung Conditions There were 102 cases of chronic lung conditions in 2017, a 24% decrease from the previous year (Table D-12). These included asbestos-related diseases and exposures, occupational asthma, and other chronic lung diseases. Acute respiratory illnesses are classified under respiratory conditions and poisonings (above). Asbestos There were 14 reports of asbestos-related disease or exposures in 2017. The descriptions of the cases often make it difficult to determine whether the cases are actual disease or current exposure to asbestos; the notations may be either describing historic exposures that contributed to current disease, or current exposures that raise the risk of future disease. Cancers, including those caused by asbestos, are noted below (under “other illnesses”). See also separate data from the Occupational Health Indicators project in relation to asbestosis and mesothelioma deaths in the Summary of Disease section above.

26
Asbestos exposure is known to increase the risk of lung disease and cancer. If disease occurs as a result, it often appears between 10-40 years after exposure. Asbestos disease may be under-reported by traditional surveillance sources such as Workers’ Compensation. Table D-12: Chronic Lung Diseases by Type, WCC, 2016-17
Illness 2016 2017 Change Asthma/bronchitis 33 20 -39% Asbestos-related 33 14 -58% Allergies 13 4 -69% Other chronic lung 56 64 14% Total 135 102 -24%
Other Chronic Lung Conditions There were 20 occupational asthma cases reported in 2017 (a 39% decrease from the previous year), 4 lung-related allergies, and 64 other chronic lung conditions. The causes mentioned for asthma and other chronic lung conditions were paint (2), construction, exertion, mold (2), smoke, and dust. Skin Conditions There were 222 skin conditions in the database in 2017 (Table D-13), an increase of 15% over the previous year. These included 79 cases of contact dermatitis from poison ivy or other plants (35% of all skin cases). There were 42 cases of skin conditions caused by chemicals, as well as 24 additional cases attributed specifically to cleaning chemicals. There were 10 cases caused by allergic reactions to clothing, gloves, or latex, and 19 other allergic skin conditions. There were 48 cases of poorly defined skin conditions, frequently just described as rashes. In addition to cleaning chemicals and latex, specific substances associated with skin conditions included acid (5 cases), animal sources (such as dander or bug bites; 9 cases), oil or oil mist (8 cases), dust (2 cases), food, paint, sewage, solvents (3 cases), “wet patch mix”, radiation, caustics, Arcall, NBMA, gasoline, shampoo, oven cleaner, boiler chemicals, “Adhesive 926”, alcohol, acetone, de-limer, corrosion inhibitor, metal hydroxide, wet ceiling tiles, foam insulation, peanut wrap, and mold. Table D-13: Skin Diseases by Cause, WCC, 2016-2017
Category 2016 2017 % Change Poison Ivy/plants 70 79 36% 13% Chemical 30 42 19% 40% Soap/cleaning products 15 24 11% 60% Allergic 13 19 9% 46% Gloves/latex/clothing 9 10 5% 11% Rash/other/unknown 56 48 22% -14% Total 193 222 100% 15%

27
Stress and Heart Conditions Heart and Hypertension There were 301 cases involving heart conditions, stroke, chest pain, hypertension, or stress in the database for 2017 (Table D-14), a 14% increase from the previous year. Reports noted 149 cases of heart attacks, myocardial infarctions or acute heart events and 15 reported strokes or blood clots, often associated with emergency care at a hospital. There were 27 cases that described the condition as hypertension or “heart and hypertension” (the usual legal term for heart or hypertension cases that are covered under workers’ compensation for police and fire fighters). Approximately one-half of the heart cases appeared to involve police or firefighters or other municipal and state employees who are frequently covered under heart and hypertension laws that presume those conditions to be work-related for Workers’ Compensation purposes. Though not generally well described, causes of the heart cases included exertion (including climbing, shoveling, exercise, or lifting, approximately 20 cases), firefighting, and stress (4). Table D-14: Heart, Hypertension and Stress Conditions by Type, WCC, 2016-2017
Category 2016 2017 Percent Change Heart attack/severe symptoms 144 149 50% 3% Hypertension 17 27 9% 59% Stroke/clots 12 15 5% 25% Stress/anxiety/depression 90 110 37% 22% Total 263 301 100% 14%
Mental Stress There was a total of 110 stress-related claims in the database in 2017, a 22% increase over the previous year. Approximately one third (30%) of the cases where cause was noted referred to violence or post-traumatic stress disorders after violence (Table D-15), 19 cited either harassment or a hostile work environment, and 11 noted conflicts with supervisors, co-workers, or customers. Table D-15: Stress Conditions by Cause, WCC, 2016-2017
Sources of Stress Conditions 2017 % 2016 Violence/robbery/trauma 33 30% 31 Harassment/hostile work environment 19 17% 9
Supervisor/co-worker/customer 11 10% 7 Excessive work demands 6 5% 5
Unknown/other 41 37% 38 Total 110 100% 90
Stress cases included intervening in conflicts between students, conflicts with an insubordinate worker, harassment from an intoxicated co-worker, verbal abuse from taxpayers, long hours and mandatory weekend work, arguments over discipline and termination, racially motivated email, bullying, an aggressive airport screening, inappropriate touching, verbal abuse, sexual assault, PTSD from experiencing trauma as a paramedic, being chased and trapped by a student, getting trapped inside a machine, exposure to blood, motor vehicle accidents, driving long distances, police involved in shooting incidents, and assaults.

28
Stress-related claims that are not also associated with a physical injury are typically not compensable under the Workers’ Compensation statute, so it is likely that there are additional unreported (non-compensable) cases. It should be noted that this report is based on First Reports of Injury for compensation, and the number of cases that were ultimately awarded compensation was not determined. Other Occupational Diseases Hearing Loss There were 103 reports of hearing loss in 2017 (Table D-16), approximately the same as the previous year. Of these cases, 18 appeared to be caused by acute (single incident) noises or injuries such as an indoor pile driving machine, loud shouts close to the ear, gun fire, a metal elevator, a helium machine, fire sirens, fire alarms, a tire explosion, a milling tool, and an explosion in a welding shop. Of all the hearing loss cases, most were from manufacturing (64 cases), in particular transportation equipment manufacturing (49 cases), as well as schools/police/firefighting/government (24 cases). Table D-16: Other Occupational Illnesses, WCC, 2016-2017 Type of illness 2016 2017 % Change
Chemicals in eye 97 78 13% -20%
Hearing loss 105 103 17% -2%
Dizziness/fainting/seizure 122 142 23% 16%
Cold/heat related conditions 65 65 11% 0%
Allergic 47 73 12% 55%
Cancer 10 13 2% 30%
Other conditions 163 138 23% -15% Total 609 612 100% 0%
Other Disease Conditions There were 142 reports of workers becoming dizzy, fainting, or seizures, a 16% increase. Some of these are likely from pre-existing conditions that occurred while at work (such as epilepsy or diabetes) and some of these were accompanied by an injury from a fall. Some may reflect more serious conditions such as heart attacks but are just described based on initial symptoms. There were 78 reports of chemical exposures to the eyes (this does not include other physical acute eye injuries such as particles or dust), a 20% decrease. There were 65 reports of temperature-related problems from heat or cold, the same as the previous year. There were 73 cases of allergic reactions reported in addition to those noted above under respiratory and skin conditions, a 55% increase. There were 13 cases of cancer reported, which included asbestos-related cancers. There were 138 “other” conditions that were difficult to classify, usually due to incomplete information.

29
E. Occupational Illnesses and Injury Surveillance System (OIISS) Physicians are required to report known and suspected occupational disease to the Occupational Illnesses and Injury Surveillance System (OIISS) that is maintained by the Department of Public Health. Although all physicians are required to report, most reports are from Connecticut’s occupational health clinics and industrial medicine programs. Information on blood lead level laboratory reports is received from the Connecticut Adult Blood Lead Epidemiology and Surveillance (ABLES) program. Data for lead and infectious diseases were incomplete for certain years prior to 2012 (as noted in the table and figure below), so comparisons for total disease with earlier years should be made cautiously. Table E-1: Occupational Disease Case Reports by Type, OIISS and ABLES, 2008-2017
Category 2008 2009 2010 2011 2012 2013 2014 2015 2016 2017 %
change 2016-
17 MSD 827 411 208 616 580 666 774 734 633 562 -11% Skin 302 193 102 183 180 174 140 166 158 168 6% Lung 142 140 56 101 146 120 171 178 133 155 17% Other 31 59 33 96 164 159 184 195 250 220 -12% Infectious* 66 939 347 103 443 973 1500 1390 1,513 1,365 -10% Sub-total 1,368 1,742 746 1,099 1,513 2,092 2,769 2,663 2,687 2,470 -8% Lead (Lab) 364 304 443 345 283 327 379 425 330 292 -12% Total 1,732 2,046 1,189 1,444 1,796 2,419 3,148 3,088 3,017 2,762 -8%
*Infectious did not include most bloodborne pathogen exposures in 2008 and 2011
Figure E-1: Occupational Disease Case Reports by Type, OIISS and ABLES, 1998-2017
*Infectious category did not include most bloodborne pathogen exposures up to 2008, and again in 2011. ** Lead values for 1998-99 did not include cases in the blood lead level range of 10-19 micrograms per deciliter (ug/dl).
0
500
1000
1500
2000
2500
3000
3500
1998 1999 2000 2001 2002 2003 2004 2005 2006 2007 2008 2009 2010 2011 2012 2013 2014 2015 2016 2017
Cum
ulat
ive
Tota
l Cas
es
MSD Skin Lung Other Infectious* Lead (Lab)**

30
There were 2,470 occupational illness reports received from physicians for 2017 (Table E-1). Physician reports decreased 8% in 2017 compared to the prior year. Infectious disease (such as bloodborne diseases and exposures) was the largest category of reports, accounting for 55% of the reports, followed by musculoskeletal conditions (MSD) such as tendonitis and carpal tunnel syndrome (23%). Skin disorders (including poison ivy and chemicals as causes) accounted for 7% and lung conditions (including respiratory conditions, asthma, and other lung diseases) comprised 6% of the physician reports. “Other” conditions (including heart disease, stress, and noise-induced hearing loss) accounted for 9%. There were 292 laboratory-reported adult blood lead levels of 10 micrograms per deciliter (ug/dl) or greater (a 12% decrease from the prior year), giving a total of 2,762 occupational illnesses reported by physicians or laboratories in 2017. In 2017, 94 physicians from 13 clinics (at 17 locations) reported at least one case of occupational illness to the OIISS. Twenty-six of the physicians reported 20 or more cases, accounting for 86% of the reports; seven reported 100 or more cases and accounted for 48% of reports. Seven clinics reported 100 or more cases and contributed 88% of the cases. Many workers with occupationally-related illness seek care from their primary care providers. Although it is a state law that known and suspected occupational diseases diagnosed by any physician in the state must be reported to CT Departments of Labor and Public Health (CGS § 31-40a), the majority of reporters are from the academic occupational health clinics and auxiliary occupational health clinics that are funded under the state occupational disease surveillance network. Therefore, these reports should be viewed as a small portion of physician-diagnosed occupational diseases in Connecticut. Where certainty was reported, 80% of the cases were classed as “high certainty” for being an occupationally-related disease, 14% were “moderate certainty,” and 5% “low certainty”. There was a fairly low amount of reporting on whether exposure was continuing or if others are likely to be exposed, but 14% of those reported that the exposure that caused the illness was continuing, and 6% reported other workers were likely to be exposed to the same hazard. Of the 1,422 reports where race was known, 262 (18%) were identified as black, and 189 (of 1,725 or 11%) were identified as Hispanic (where ethnicity was known). Figure E-2: Occupational Disease by Age, OIISS, 2017
0
100
200
300
400
500
600
700
<20 20-29 30-39 40-49 50-59 60+
13
549612
492 519
274

31
Figure E-2 shows the age distribution of reported cases (where data was available). There were similar proportions (between 20%-25%) for workers in their 20’s, 30’s, 40’s and 50’s. Only 11% were 60 or older, and only 13 cases were reported in workers less than 20 years of age. The Education and Health sector had the most cases (55%), followed by State and Local Government (22%), Manufacturing (9%), and Trade (5%); see Figure E-3 and Table E-2. It should be noted that the Education and Health sector workplaces that were also government workers (such as public schools or hospitals) were counted as government.
Figure E-3: Occupational Disease by Industry Sector, OIISS, 2017
Table E-2: Type of Illness by Industry Sector (NAICS*), OIISS, 2017
Industry All Infectious Lung MSD Other Skin Cases % Cases % Cases % Cases % Cases % Cases % Construction/ Agriculture 17 1% 3 0% 6 4% 5 1% 2 1% 1 1%
Manufacturing 216 9% 4 0% 26 17% 118 21% 35 16% 33 20%
Trade 132 5% 10 1% 10 6% 88 16% 17 8% 7 4%
Transport/Utilities 55 2% 11 1% 5 3% 22 4% 13 6% 4 2%
Information Services 2 0% 0 0% 0 0% 2 0% 0 0% 0 0%
Finance/Insur/Real Estate 11 0% 1 0% 2 1% 7 1% 1 0% 0 0%
Business Service 76 3% 35 3% 7 5% 18 3% 6 3% 10 6%
Education/Health 1,351 55% 1,041 76% 28 18% 146 26% 82 37% 54 32% Other Services 43 2% 12 1% 4 3% 16 3% 4 2% 7 4% Local Govt 437 18% 199 15% 52 34% 91 16% 46 21% 49 29% State Govt 105 4% 45 3% 7 5% 42 7% 10 5% 1 1% Unknown 25 1% 4 0% 8 5% 7 1% 4 2% 2 1% Total 2,470 100% 1,365 100% 155 100% 562 100% 220 100% 168 100%
* North American Industry Classification System
Const, Agric., 1%
Manuf, 9%
Trade, 5% Trans/Utility, 2%
Info, 0%
Fin/Insur/RE, 0%Business Serv, 3%
Educ/Health, 55%
Service , 2%
Local Govt, 18%
State Govt, 4%

32
Industry distribution was somewhat different by condition (Table E-2), although Education and Health was prominent in all the categories of illness. Infectious disease was highly concentrated in Education and Health (76%), with Government contributing another 18%. MSD were primarily from Education and Health (26%), Government (24%), Manufacturing (21%), and Trade (16%). Dermatitis (skin disorders) was primarily from Education and Health (32%), Government (30%), and Manufacturing (20%). Respiratory cases (“Lung”) were primarily from Government (38%), Education and Health (18%), and Manufacturing (17%). “Other” illnesses were from Education and Health (37%), Government (25%). And Manufacturing (16%). Musculoskeletal Disorders (MSD) There was a total of 562 reports of musculoskeletal disorders (MSD) in 2017, a decrease of 11% from the previous year (Table E-3). This table does not include MSD caused by acute incidents such as falls or individual lifts and also excludes all lower back diagnoses unless specifically defined as caused by cumulative strain. The most common specific diagnoses for musculoskeletal disorders were epicondylitis (tennis elbow) with 22% of the cases, carpal tunnel syndrome (15%), tenosynovitis (12%), and strains and sprains (10%). Table E-3: Musculoskeletal Disorders (MSD) by Type, OIISS, 2016-2017
Illness 2016 2017 Percent Change Epicondylitis 108 122 22% 13% Carpal Tunnel Syndrome (CTS) 76 85 15% 12% Tenosynovitis (including deQuervain's) 89 69 12% -22% Strain/Sprain 13 59 10% 354% Other Neuropathy & Radiculopathy (nerve disorder) 37 50 9% 35% Bursitis/Arthritis 46 27 5% -41% Tendonitis 47 25 4% -47% Trigger Finger 18 22 4% 22% Plantar fasciitis 10 17 3% 70% Ganglion Cyst 15 13 2% -13% Rotator Cuff 5 5 1% 0% Other MSD 169 68 12% -60% Total 633 562 100% -11%
Musculoskeletal disorders (also referred to as cumulative trauma disorders or repetitive strain injuries) include tendon-related conditions, nerve problems, circulatory, as well as combined conditions. Tendon Disorders • Tendonitis: swelling of the tendons • Epicondylitis: tendon irritation in the elbow area, including “golfer’s elbow” and “tennis elbow” • Rotator Cuff Syndrome: tendonitis in the shoulder area • Tenosynovitis: inflammation of the tendon sheaths, lubricated covers that surround the tendons, particularly
in the hand • deQuervain’s Syndrome: tendon sheath disorder of side of wrist and base of thumb • Trigger Finger: a bump on the tendon that catches on the tendon sheath that makes the finger or thumb
difficult to move • Ganglion Cysts: swelling of the tendon sheaths from excess lubricating fluid • Bursitis: inflammation of the fluid-filled sacs around ligaments and tendons

33
Nerve Disorders • Carpal Tunnel Syndrome: pinching of the median nerve in the wrist, usually by swollen tendons that pass
through the carpal tunnel (median and ulnar nerves can also be pinched in the elbow, shoulder, or neck)
Circulatory/Combined/Other • Thoracic Outlet Syndrome: pinching of the nerves and blood vessels in the neck/ shoulder area
Figure E-4: Musculoskeletal Disorders by Industry Sector, OIISS, 2017
Note: Government includes education and health care facilities such as schools and state hospitals Table E-4: Common causes of MSD, OIISS, 2017
Cause Cases Lifting 42 Computer/clerical 32 Push/pull 27 Repetitive 26 Gripping/grasping 17 Patient-related 14 Tools & Vibration 13 Standing/walking/running 11 Climbing 7 Assembly 5 Kneeling 3 Other 19 Total 216 Unknown 346
Construction/ Agric1%
Manufacturing21%
Trade16%
Transport/Utilities4%
Information Services
1%Finance/Insur/Real
Estate1%
Business Service3%
Educ/Health26%
Other Services3%
Government24%

34
The largest number of MSD’s were in Education and Health (146), followed by Government (133), Manufacturing (118), and Trade (88); see Figure E-4 and Table E-2. Causes for MSD are difficult to classify since they are frequently described differently by the various people recording the case, and most case reports do not describe cause. The most common specific cause noted for MSD (Table E-4) was lifting (42 cases) and followed by computer use and data entry (32), and pushing or pulling (27). Twenty-six (26) additional cases were attributed to the general description of “repetitive”. Skin Conditions There were 168 reports of skin disorders in 2017 (Table E-5), a 6% increase from the previous year. The largest single cause was poison ivy or other plant exposures (32% of all cases). Other causes of dermatitis or other skin conditions included chemicals (28 cases), cleaning or cleaning chemicals (5 cases), and latex or clothing (4 cases). Table E-5: Skin Conditions by Type, OIISS, 2016-2017
Illness 2016 2017 Percent Change Dermatitis 86 86 51% 0% Poison ivy & other plants 54 53 32% -2% Other skin conditions 18 29 17% 61% Total 158 168 100% 6%
Skin conditions in 2017 occurred most commonly in Education and Health (33%), State and Local Government (30%), and Manufacturing (20%). Lung/Respiratory Diseases and Poisonings There were 155 cases of respiratory and other lung diseases and poisonings reported by physicians in 2017 (Table E-6), an increase of 17% from the previous year. Nonspecific respiratory illnesses were the most common type of condition, with 26% of reports, followed by asthma or reactive airways dysfunction syndrome (RADS) with 22% and asbestos disease or exposures (12%). In addition to asbestos (some of the asbestos cases appeared to be reports of asbestos exposures rather than asbestos-related disease) exposures associated with respiratory conditions included fumes (23 cases, including gas, carbon monoxide, and lead), chemicals (including solvents, cleaning chemicals, paint, and oil; 23), mold or indoor air quality (9), and smoke (7). Table E-6: Respiratory Diseases and Poisoning by Type, OIISS, 2016-2017 Illness 2016 2017 Percent Change Respiratory 71 40 26% -44% Asthma/RADS 14 34 22% 143% Asbestos exposure/disease 4 18 12% 350% Poisoning 24 7 5% -71% Rhinitis/ Sinusitis 4 5 3% 25% Bronchitis 0 4 3% -- Other Lung 16 47 30% 194% Total 133 155 100% 17%
Respiratory disease and poisoning cases in 2017 occurred mainly in Government (38% of cases), Education and Health (18%), and Manufacturing (17%).

35
Lead Poisoning (Laboratory Reports) Connecticut requires laboratories to report all blood lead tests of 10 micrograms per deciliter (ug/dl) of whole blood or greater to the Connecticut Department of Public Health (CGS § 19a-110). These cases are classified into childhood (less than 16 years of age) and adult cases (only adult cases are reported here), with the majority of adult cases being attributed to an individual’s occupation (although some cases occur in individuals engaged in activities such as home paint removal or target shooting). Up to a third or more of cases in recent years are related to the use of indoor shooting ranges. The numbers are based on the highest level measured for each individual during the calendar year; they do not include multiple tests on the same individual. OSHA medical removal protections apply at the level of 50 ug/dl of whole blood or above (and require a reduction to 40 ug/dl before return to work). Lead can have neurological, reproductive and other negative effects on health at much lower levels of exposure. The 292 lead poisoning reports in 2017 decreased 12% from the previous year. The lowest category (10-24 ug/dl) of recorded elevated lead levels accounted for 79% of all cases (Table E-7). There was a decrease in all categories of lead levels except the over 60 ug/dl group. Almost all of the reported lead poisoning cases (93% of cases) occurred in men; there were only 19 reports for women. Thirty-three percent (33%) were under 40 years old, 39% were between 40 and 59, and 29% were age 60 or older. Table E-7: Lead Cases by Level of Blood Lead, CT ABLES, 2016-2017
Blood lead level* 2016 2017 Percent Change 10-24 257 230 79% -11% 25-39 56 50 17% -11% 40-49 9 5 2% -44% 50-59 7 3 1% -57% >=60 1 4 1% 300% Total 330 292 100% -12%
Source: Connecticut Adult Blood Lead Epidemiology and Surveillance (ABLES program), CT Dept. of Public Health * Micrograms per deciliter (ug/dl) of whole blood. Number of individuals with elevated lead levels (multiple tests for individuals were eliminated.) Figure E-5: Lead Cases 2003-2017
NIOSH (The National Institute of Occupational Safety and Health) has lead level data for 26 states for 2016 (most recent year available; https://www.cdc.gov/niosh/topics/ables/data.html). Connecticut is the 9th highest among those states for the rate of lead levels above 10 ug/dl, with a rate of 1.83 per 10,000 employed adults
0
50
100
150
200
250
300
350
400
450
500
2003 2004 2005 2006 2007 2008 2009 2010 2011 2012 2013 2014 2015 2016 2017
40+
Total cases

36
(compared to the average of 1.58 for the 26 states as a whole). Connecticut was 6th highest for rates of lead levels above 25 ug/dl, with a rate of 0.40 compared to the overall average of 0.28. Lead cases have fluctuated since 2003, from 400 in 2003 to 292 in 2017, with a high of 465 cases in 2006 and a low of 283 cases in 2012. Cases at or above the OSHA level of 40 ug/dl have stayed relatively constant at 15 to 20 cases since 2004 (Figure E-5), but dropped to 12 in 2017. Fluctuations in the past have been observed due to lead screening programs and special bridge maintenance projects involving the removal of lead paint. Infectious and Other Diseases Infectious diseases decreased 10% to 1,365 cases in 2017. Bloodborne pathogen exposures (to needlesticks, blood, body fluids or human bites) or diseases (such as HIV or Hepatitis) were the most common infectious diseases reported, with 1,074 reports in 2017, a 12% decrease over 2016. Bloodborne exposures are of most concern when there is a needlestick or other sharp injury, particularly if there is an injection of blood into the caregiver’s body. These reports do not generally specify whether the source patient/client was infected with a bloodborne illness such as HIV or Hepatitis B or C. Table E-8: Infectious and Other Illnesses, 2016-2017
Illness 2016 2017 % Change Bloodborne 1,226 1,074 -12% TB/PPD 63 172 173% Scabies 41 32 -22% Lyme/tick bite 21 26 24% Meningitis 93 16 -83% Rabies 5 4 -20% MRSA 2 4 Measles/chickenpox 4 2 -50% Brucella 15 3 -100% Other infectious 43 32 -26% Total Infectious 1,513 1,365 -10%
Other Illnesses 2016 2017 % Change
Chemicals in eyes 75 49 -35% Headache/dizzy 25 20 -20% Allergic 22 15 -32% Stress/heart 18 20 11% Hearing loss 12 12 0% Heat/cold 10 12 20% Other 88 92 5% Total Other Illnesses 250 220 -12%
Of the bloodborne exposures where cause was noted, 47% were due to a needlestick or sharps injury, despite OSHA regulations that require safe needle devices where available. Thirty-six percent (36%) of the reports were due to blood or body fluid exposures, 15% were from a human bite and 2% were not described. Bites often do not have a description on whether these bites penetrated the skin. Exposure to saliva is not included in these numbers, since the risk of disease transmission is very low in those cases.

37
There was a large increase in reports of potential exposure to tuberculosis (TB) or positive PPD tests for TB, with 172 cases in 2017 compared to 63 cases reported in 2016. In addition to bloodborne disease/exposures and TB exposures, there were 32 cases of scabies, 26 cases of Lyme disease or tick bites, and 16 reports related to meningitis reported (the last a sharp drop from 2016). Most of the “Other Infectious” cases were not well-defined in the database and may include some of the more common reports (such as bloodborne or TB). In addition to the infectious diseases, there were 220 other occupational illnesses reported by physicians in 2017 (Table E-8), a decrease of 12%. This included 49 cases of chemical exposures to the eyes, 20 cases of headache, dizziness, or similar symptoms, 15 cases of allergic reactions to substances or foods, 20 cases of either heart or stress-related conditions, 12 cases of hearing loss and 12 cases of over-exposures to heat or cold.

38
F. Appendix 1: Databases and Methods Determining the incidence of occupational illness is difficult. The problem is two-fold: 1) occupationally-related illness is not consistently recognized as work-related; and 2) the cases reported to either the Department of Labor and/or the Occupational Health Surveillance Division of the Department of Public Health are not complete. Consequently, this assessment of occupational disease reviews a number of sources of information: the Workers’ Compensation Commission’s First Report of Injury database (WCC), the Bureau of Labor Statistics/Connecticut Dept. of Labor Survey of Occupational Injuries and Illnesses (BLS), the Occupational Illnesses and Injury Surveillance System (OIISS), and the Connecticut Adult Blood Level Epidemiology Surveillance Program (ABLES). The Workers’ Compensation database was provided in electronic form from the CT Workers’ Compensation Commission and the physicians’ reports from the CT Department of Public Health. The BLS survey data was provided in table form from the Connecticut Department of Labor and derived from the U.S. BLS website at https://www.bls.gov/iif/#data.
Assumptions and Conventions The Workers’ Compensation Commission’s First Reports of Injury database and the Occupational Illnesses and Injury Surveillance System (OIISS, referred to as Physicians’ Reports) were reviewed in depth. A rationale for the data review was developed to differentiate occupational illnesses from acute traumatic injuries and to classify the workplace reports by nature and cause of the illness. Each entry was reviewed for internal consistency and reasonableness. Specifically, the process employed the following steps:
1) Clear acute injuries were eliminated. In assessing the Workers’ Compensation First Reports of Injury, a line by line review of injury descriptions, nature descriptions and codes, listed causes, and part of body were used to differentiate whether an injury vs. illness was described. The determination relied most heavily on the text description and then on the other data fields in the order listed above.
The Physicians’ Reports are organized differently. Numerical “Nature of Injury or Illness” codes from the Bureau of Labor Statistics Occupational Injury and Illness Classification System (ANSI Z16.2-1995, American National Standard for Information Management for Occupational Safety and Health) were used as the primary indicator to evaluate the records. Cause, certainty, diagnosis, ICD codes, suspected agent and symptom fields were also reviewed in determining illness or injury. Categories that were eliminated included all burns, eye problems such as conjunctivitis or objects in the eye, lower back problems (including sciatica) unless clearly and specifically labeled as a cumulative injury, hernias, infected wounds or burns, insect and animal bites (with the exception of tick bites because of the relationship with Lyme disease), and electrical shocks.
2) Validity of remaining records was determined. Records were reviewed to be sure that the coding
of types of disease was consistent with other information in the record. In addition, diseases were categorized by type of disease. Several approaches were utilized to eliminate duplicate records such as line by line review and matching on first and last name, date of birth and employer (to identify reports with misspellings or reversed first and last names), etc.
3) Fields were either revised or added to the databases: Illness Type and Nature of Illness. The
Nature of Illness was based on the information in the databases, research, and general information about the illnesses. Then each entry was categorized by Illness Type. The specific nature categories were grouped into broader categories to support graphic representation. For the Workers’ Compensation database, the description of injury was used as the key description of the illness if it disagreed with the coding for other variables. This coding was categorized into illness types (i.e.

39
skin, lung, infectious, MSD, other), specific illness (i.e. Carpal Tunnel Syndrome, heart conditions, asthma), and cause (i.e. chemical exposure, computer use, needlesticks).
4) Employers were coded for industry utilizing a comprehensive list of Connecticut employers from
the CT Department of Labor and coded based on the NAICS (North American Industry Classification System) for the BLS and workers’ compensation data. Employers who could not be found from previous datasets from the Dept. of Labor were coded based on an internet search using such databases as Manta or naics.com. Physician reports were coded by the Connecticut Dept. of Labor. Rates were calculated using employment figures from the U.S. Bureau of Labor Statistics based on Connecticut Dept. of Labor figures.
5) Data was cleaned, tabulated and put into presentation form using Microsoft Excel and Word
software.
6) The report is reviewed and approved by the Connecticut Workers’ Compensation Commission prior to publication.

40
G. Appendix 2: Occupational Disease Detail by Type and Year Table G-1: Cases of Occupational Disease, by Type, Bureau of Labor Statistics/CT Dept. of Labor, 1979 – 2017
Employ.* All Ill Skin MSD Lung-dust Respir. Poison Physical Other
1979 1,358 3,322 1,716 471 25 317 175 250 368 1980 1,394 3,066 1,586 513 88 214 66 199 400 1981 1,409 3,214 1,509 701 38 290 89 192 395 1982 1,400 2,549 1,130 580 31 223 31 216 323 1983 1,419 2,930 1,236 665 20 154 152 176 519 1984 1,490 2,735 1,109 665 24 273 65 162 432 1985 1,528 2,809 928 727 44 233 51 130 693 1986 1,567 2,719 808 761 39 274 65 235 538 1987 1,607 4,643 1,352 1,430 31 300 62 704 754 1988 1,637 4,364 1,257 405 35 332 56 405 733 1989 1,634 5,844 1,248 2,629 57 277 74 468 1,087 1990 1,593 5,307 1,032 2,535 93 457 54 496 641 1991 1,518 6,094 946 3,454 62 422 113 501 591 1992 1,483 6,458 1,084 3,852 37 471 53 349 612 1993 1,487 8369 965 5526 52 512 166 346 802 1994 1,502 7,319 957 4,482 74 410 97 313 986 1995 1,520 6,787 884 4,220 80 323 35 349 896 1996 1,538 6,021 827 3,711 40 418 34 235 756 1997 1,570 5,419 620 3,335 21 287 70 150 936 1998 1,597 5,510 989 3,398 10 459 45 92 517 1999 1,630 5,513 793 3,306 20 386 71 265 671 2000 1,653 6,396 897 3,827 65 438 29 137 1,003 2001 1,572 5,514 916 3,220 10 630 29 118 591
Employ.* All Ill Skin Respir. Poison Hearing Other 2002 1,602 4,387 831 320 78 3,159 2003 1,605 4,559 903 490 32 3,132 2004 1,603 4,572 832 354 35 466 2,886 2005 1,614 4,850 848 480 8 381 3,134 2006 1,636 3,787 575 235 38 439 2,500 2007 1,667 3,904 624 358 22 457 2,443 2008 1,675 3,562 690 293 130 360 2,088 2009 1,629 3,400 600 300 -- 500 2,000 2010 1,629 3,000 700 300 -- 300 1,700 2011 1,578 3,500 800 300 -- 300 2,100 2012 1,628 2,800 600 300 -- 300 1,500 2013 1,640 2,600 500 300 -- 300 1,600 2014 1,653 2,400 400 200 -- 300 1,400 2015 1,663 2,300 400 200 -- 200 1,500 2016 1,667 2,300 500 200 -- 300 1,300 2017 1,670 1,700 400 100 200 900
Source: U.S. Bureau of Labor Statistics (BLS) and the Connecticut Dept. of Labor, Office of Research. Data collection methods and categories changed in 2002 and are not comparable to prior years. Employment in thousands. Since this data is based on a weighted survey, some of these numbers (particularly the smaller numbers) are not reliable.
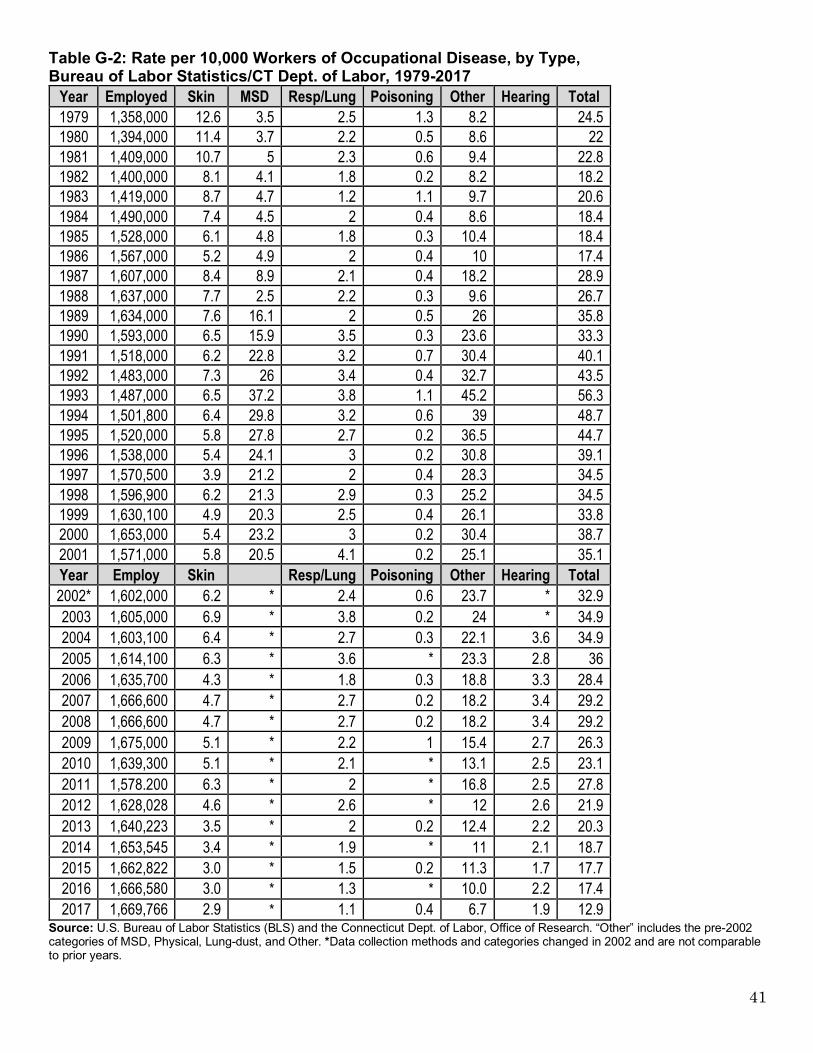
41
Table G-2: Rate per 10,000 Workers of Occupational Disease, by Type, Bureau of Labor Statistics/CT Dept. of Labor, 1979-2017
Year Employed Skin MSD Resp/Lung Poisoning Other Hearing Total 1979 1,358,000 12.6 3.5 2.5 1.3 8.2 24.5 1980 1,394,000 11.4 3.7 2.2 0.5 8.6 22 1981 1,409,000 10.7 5 2.3 0.6 9.4 22.8 1982 1,400,000 8.1 4.1 1.8 0.2 8.2 18.2 1983 1,419,000 8.7 4.7 1.2 1.1 9.7 20.6 1984 1,490,000 7.4 4.5 2 0.4 8.6 18.4 1985 1,528,000 6.1 4.8 1.8 0.3 10.4 18.4 1986 1,567,000 5.2 4.9 2 0.4 10 17.4 1987 1,607,000 8.4 8.9 2.1 0.4 18.2 28.9 1988 1,637,000 7.7 2.5 2.2 0.3 9.6 26.7 1989 1,634,000 7.6 16.1 2 0.5 26 35.8 1990 1,593,000 6.5 15.9 3.5 0.3 23.6 33.3 1991 1,518,000 6.2 22.8 3.2 0.7 30.4 40.1 1992 1,483,000 7.3 26 3.4 0.4 32.7 43.5 1993 1,487,000 6.5 37.2 3.8 1.1 45.2 56.3 1994 1,501,800 6.4 29.8 3.2 0.6 39 48.7 1995 1,520,000 5.8 27.8 2.7 0.2 36.5 44.7 1996 1,538,000 5.4 24.1 3 0.2 30.8 39.1 1997 1,570,500 3.9 21.2 2 0.4 28.3 34.5 1998 1,596,900 6.2 21.3 2.9 0.3 25.2 34.5 1999 1,630,100 4.9 20.3 2.5 0.4 26.1 33.8 2000 1,653,000 5.4 23.2 3 0.2 30.4 38.7 2001 1,571,000 5.8 20.5 4.1 0.2 25.1 35.1 Year Employ Skin Resp/Lung Poisoning Other Hearing Total 2002* 1,602,000 6.2 * 2.4 0.6 23.7 * 32.9 2003 1,605,000 6.9 * 3.8 0.2 24 * 34.9 2004 1,603,100 6.4 * 2.7 0.3 22.1 3.6 34.9 2005 1,614,100 6.3 * 3.6 * 23.3 2.8 36 2006 1,635,700 4.3 * 1.8 0.3 18.8 3.3 28.4 2007 1,666,600 4.7 * 2.7 0.2 18.2 3.4 29.2 2008 1,666,600 4.7 * 2.7 0.2 18.2 3.4 29.2 2009 1,675,000 5.1 * 2.2 1 15.4 2.7 26.3 2010 1,639,300 5.1 * 2.1 * 13.1 2.5 23.1 2011 1,578.200 6.3 * 2 * 16.8 2.5 27.8 2012 1,628,028 4.6 * 2.6 * 12 2.6 21.9 2013 1,640,223 3.5 * 2 0.2 12.4 2.2 20.3 2014 1,653,545 3.4 * 1.9 * 11 2.1 18.7 2015 1,662,822 3.0 * 1.5 0.2 11.3 1.7 17.7 2016 1,666,580 3.0 * 1.3 * 10.0 2.2 17.4 2017 1,669,766 2.9 * 1.1 0.4 6.7 1.9 12.9
Source: U.S. Bureau of Labor Statistics (BLS) and the Connecticut Dept. of Labor, Office of Research. “Other” includes the pre-2002 categories of MSD, Physical, Lung-dust, and Other. *Data collection methods and categories changed in 2002 and are not comparable to prior years.

42
H. Appendix 3: Internet Resources for Job Safety and Health; 2016 General Health and Safety Sites One of the best sources of information for job health and safety on the internet is the OSHA (Occupational Safety and Health Administration) homepage, which includes an ergonomics homepage, a searchable index of standards, and many other resources. http://www.osha.gov To look up OSHA citations by company or industry: http://www.osha.gov/pls/imis/establishment.html OSHA funds a number of training programs for workers, community groups and managers across the U.S. through their Susan Harwood Training grants at https://www.osha.gov/dte/sharwood. OSHA has a resource page for medical clinicians at https://www.osha.gov/dts/oom/clinicians/index.html American Family Physician also has a number of articles for clinicians at https://www.aafp.org/afp/topicModules/viewTopicModule.htm?topicModuleId=89. The Bureau of Labor Statistics tracks occupational injuries and illnesses https://www.bls.gov/iif. NIOSH (the National Institute for Occupational Safety and Health) is another good general source. A searchable section on diseases and injuries briefly describes conditions with updates on current research and guidance on prevention. http://www.cdc.gov/niosh/homepage.html http://www.cdc.gov/niosh/topics/diseases.html NIOSH supports a large number of Education and Research Centers (ERCs) based at universities across the US. Expert centers also include agriculture, construction, and total worker health centers (for example, see the link for the UConn CPH-NEW program below). ERCs primary purpose is to train health and safety professionals, so the various ERCs host a broad array of training programs for safety experts, industrial hygienists, ergonomists, occupational physicians and nurses and other professionals. In addition, the programs provide extensive in-service training programs for professionals already in the field as well as occasional programs for workers, health and safety committee members, and managers. They are also home to extensive research programs and consultation programs. The list of ERC’s and related centers can be found at https://www.cdc.gov/niosh/oep/ercportfolio.html. NIOSH has a workplace health promotion website at https://www.cdc.gov/workplacehealthpromotion/initiatives/resource-center/index.html EPA (the Environmental Protection Agency) has a number of sites relevant to occupational health on indoor air quality, office and school environments, and other topics. www.epa.gov www.epa.gov/iaq/ The Veterans Administration (VA) occupational health department has resources on safe patient handling, wellness, and workplace violence prevention. https://www.publichealth.va.gov/about/occhealth/index.asp The Council of State and Territorial Epidemiologists (CSTE) has links to reports, contacts and resources in occupational health https://www.cste.org/group/OHResources. The Canadian Centre for Occupational Health and Safety has hundreds of resources on their health and safety internet resource list. http://www.ccohs.ca

43
New Jersey Department of Health has 1,600 excellent chemical hazard factsheets that are free, independently researched, and clearly written (900 in Spanish) on hundreds of substances. http://web.doh.state.nj.us/rtkhsfs/indexfs.aspx Vermont Safety Information Resources, Inc. has a database of material safety data sheets (MSDS) from a large number of chemical companies. http://hazard.com Several safety organizations have useful websites:
www.nsc.org The National Safety Council www.aiha.org The American Industrial Hygiene Association www.asse.org American Society of Safety Professionals www.nfpa.org National Fire Protection Association www.safetycentral.org International Safety Equipment Association
For a labor perspective, the national AFL-CIO includes a health and safety page. http://www.aflcio.org/Issues/Job-Safety, COSH (Coalitions for Occupational Safety and Health) are labor-oriented nonprofit groups based in many states, including Connecticut, with information on a variety of hazards. They can all be accessed through the National Coalition for Occupational Safety and Health http://www.coshnetwork.org The Connecticut Business and Industry Association has a health and safety page that helps businesses understand what OSHA laws apply to them and provides information on upcoming conferences and events. https://www.cbia.com/resources/category/hr-safety The Environmental Defense Fund has a “pollution information site” called Scorecard with information about 11,200 chemicals and their recognized and suspected health effects. The site offers information with interactive data based on the 2002 Toxics Release Inventory and is currently working on providing an update. http://www.scorecard.org/ The Cal-OSHA Reporter (California OSHA) carries current stories on job health and safety. http://www.cal-osha.com. Some blogs carry job health and safety news and commentary.
Jordan Barab has a labor perspective on OSHA and job health and safety http://jordanbarab.com/confinedspace The USMWF United Support and Memorial for Workplace Fatalities posts current stories about workers who have been killed on the job and their families https://www.facebook.com/USMWF or www.usmwf.org
The Pump Handle connects to Facebook and Twitter, written by Liz Borkowski and Celeste Monforton http://www.thepumphandle.org. Workers’ compensation issues are covered at http://workerscompinsider.com. The Toxic Use Reduction Institute at UMass Lowell has extensive resources on safer alternatives to toxic substances, including a database on alternatives to solvents. http://www.turi.org. UMass-Lowell’s Center for Sustainable Production has information on changing chemical policies. http://www.sustainableproduction.org/ The Health and Safety Executive of Great Britain has extensive information on the European Union’s REACH (Registration, Evaluation, and Authorization of Chemicals).

44
http://www.hse.gov.uk/reach/index.htm http://www.hse.gov.uk/index.htm OSHA has a discussion of the US program that responds to the International Globally Harmonized System for Hazard Communication. http://www.osha.gov/dsg/hazcom/global.html. State of Connecticut and Select Other Resources The Connecticut Workers’ Compensation Commission has an excellent website, including information on the locations of offices, a searchable version of the workers’ compensation statutes, new decisions, and other information. http://wcc.state.ct.us The Connecticut (CT) website allows access to all branches of state government including agencies. https://portal.ct.gov The CT Department of Public Health includes a site for the occupational health program, including database access, health alerts and fact sheets on a wide variety of occupational health topics. http://www.ct.gov/dph/occupationalhealth The CT Department of Labor includes an occupational health services site, which includes information on their free consultation program and a great set of links to other health and safety sites including regulations, training, and Spanish publications. CTDOL offers a variety of consulting services to both public and private employers in Connecticut, available at no charge. http://www.ctdol.state.ct.us/osha/osha.htm The Connecticut General Assembly website lets you search for any bill being considered or get information about relevant committees such as Labor and Public Employees or Public Health. http://www.cga.ct.gov You can track national bills on the National Library of Congress site. https://www.congress.gov/ You can search the medical literature at US National Library of Medicine PubMed. http://www.ncbi.nlm.nih.gov/pubmed/ You can search general academic literature through Google Scholar. http://scholar.google.com/schhp?tab=ws . UConn Health’s Division of Occupational and Environmental Medicine has information and links on job health and safety. http://health.uconn.edu/occupational-environmental The Center for the Promotion of Health in the New England Workplace (CPH-NEW) is a research-to-practice initiative led by investigators from the UMass Lowell and UConn Health. http://health.uconn.edu/occupational-environmental/academics-and-research/cph-new/ UConn Health’s Center for Indoor Environments and Health provides guidance on environmental exposures in indoor settings including schools and office buildings http://health.uconn.edu/occupational-environmental/consultation-and-outreach/cieh/

45
I. Appendix 4: Who's Who: Resources in Connecticut on Job Safety and Health Academic Programs and Courses Central Connecticut State University, School of Technology Type of Degree: Certificate Program in Environmental and Occupational Safety Faculty contact: Ravindra Thamma, Department Chair Address: Copernicus Hall - Room 2120900, CCSU, 1615 Stanley Rd., New Britain, CT 06050 Phone: 860-832-3516 e-mail: [email protected] Web: http://www.ccsu.edu/mcm/environmentalOccupationalSafetyOCP.html UConn College of Agriculture, Health and Natural Resources, Department of Allied Health Sciences Type of Degree and Program: Bachelor in Allied Health Sciences with an Occupational and Environmental
Health and Safety Concentration; and an Online Occupational Safety and Health Post-Baccalaureate Certificate Program
Faculty contact: Paul Bureau, MS CIH Address: Koons Hall Room 100-G, 358 Mansfield Road, Unit 1101, Storrs, CT 06269-1101 Phone: (860) 486-0040 e-mail: [email protected] Web: http://osh.uconn.edu UConn Health, Department of Community Medicine Type of Degree: Masters in Public Health program with ergonomic/occupational health courses Director: David Gregorio, PhD Address: UCONN Health, 263 Farmington Ave., Farmington, CT 06030-6325 Phone: (860) 679-5480 Fax: (860) 679-1581 e-mail: [email protected] Web: https://mph.uconn.edu UConn Health, Department of Community Medicine Type of Degree: Ph.D. in Public Health with courses in Occupational and Environmental Health Sciences Faculty Contact: Helen Swede, Ph.D. Address: UCONN Health, 263 Farmington Ave., Farmington, CT 06030-6325 Phone: (860) 679-5568 Fax: (860) 679-1581 e-mail: [email protected] Web: https://phd.publichealth.uconn.edu

46
OSHA Connecticut Department of Labor's Division of Occupational Safety and Health/CTDOL: CONN-OSHA enforces state occupational safety and health regulations as they apply to state and municipal employees, and offers free consultations to public agencies, school districts and private companies. Director: Kenneth C. Tucker III Address: 38 Wolcott Hill Rd., Wethersfield, CT 06109 Phone: (860) 263-6900 Fax: (860) 263-6940 Web: http://www.ctdol.state.ct.us/osha/osha.htm Publications: ConnOSHA Quarterly https://www.ctdol.state.ct.us/osha/Quarterly/coqtrly.htm OSHA (Occupational Safety and Health Administration): Federal OSHA inspects workplaces in the private
sector for violations of standards, and also has information and pamphlets. National Website: https://www.osha.gov
OSHA Bridgeport Office (Fairfield, New Haven, and Middlesex counties). Area Director: Steve Biasi Address: 915 Lafayette Blvd, Room 309, Bridgeport, Connecticut 06604 Phone: (203) 579-5581; National Hotline after hours: (800) 321-OSHA (6742) Fax: (203) 579-5516 e-mail: [email protected] OSHA Hartford Office Area Director: Dale Varney Address: 135 High Street, Suite 361, Hartford, CT 06103 Phone: (860) 240-3152; National Hotline after hours, etc.: (800) 321-OSHA (6742) Fax: (860) 240-3155 e-mail: [email protected]
Academic Occupational Health Clinics UConn Occupational and Environmental Medicine Clinic Clinic Director: George W. Moore, M.D., M.Sc., FACPM, FACOEM Address: UCONN Health, 263 Farmington Ave, Farmington, CT 06032-8077 Clinic address: UCONN Main Building (Hospital Entrance), Room CG228 Phone: (860) 679-2893 Fax: (860) 679-4587 e-mail: [email protected] Web: http://health.uconn.edu/occupational-environmental/clinical-services/ Yale Occupational and Environmental Medicine Program Director: Carrie A Redlich, MD, MPH Address: 367 Cedar Street, ESHA 2nd Floor, New Haven, CT 06510 Clinic address: 135 College St. Rm. 392, New Haven, CT 06510 Phone: (203) 785-4197 Fax: (203) 785-7391 e-mail: [email protected] Web: http://medicine.yale.edu/intmed/occmed/

47
Occupational Health Clinics Concentra Medical Director: David Feinstein, MD Address: 701 Main Street, East Hartford, CT 06108 Phone: (860) 289-5561 Fax: (860) 291-1895 e-mail: [email protected] Web: http://www.concentra.com/employers/occupational-health/ Other Offices: 972 West Main Street, New Britain (860) 827-0745 1080 Day Hill Road, Windsor (860) 298-8442 8 South Commons Rd, Waterbury (203) 759-1229 333 Kennedy Drive, Torrington (860) 482-4552 900 Northrup Rd, Wallingford (203) 949-1534 370 James Street, New Haven (203) 503-0482 60 Watson Blvd, Stratford (203) 380-5945 15 Commerce Road, 3rd Floor, Stamford, (203) 324-9100 10 Connecticut Avenue, Norwich, (860) 859-5100 Connecticut Occupational Medicine Partners, St. Francis Hospital and Medical Center CEO and Administrative Director: Jeff Schlosser Address (corporate): 675 Tower Avenue, Suite 404B, Hartford, CT 06112 Phone: (860) 714-6188 Fax: (860) 714-2775 Web: http://compllc.org/ Clinics: St Francis; 1000 Asylum Ave, Ste 4320, Hartford, 860-714-4270; 1598 East Main St, Torrington,
(860) 482-3467; 100 Deerfield Road, Windsor, 860-714-9444 ECHN Corporate Care; 2800 Tamarack Ave., Suite 001, South Windsor, CT 06074, (860) 647-4796 MedWorks of Bristol Hospital; 975 Farmington Ave. Bristol (860) 589-0114 MedWorks; 375 East Cedar St., Newington (860) 667-4418 Johnson Memorial Medical Center: Director, Clinical Services: Kathy Heim, RN, MSN 155 Hazard Ave., Suite 6. Enfield, CT 06082, (860) 763-7668 Griffin Hospital Occupational Medicine Center Director: Myra Odenwaelder, DPT Address: 10 Progress Drive. Shelton, CT 06484 Phone: (203) 944-3718 Fax: (203) 929-3068 e-mail: [email protected] Web: http://www.griffinhealth.org/locations/shelton/griffin-hospital-occupational-medicine-center Hartford Medical Group—Occupational Medicine Business Development Director: Suzanne Cutter Clinic Address: 445 South Main Street, West Hartford, (860) 696-2200 Phone: (860) 993-4441 e-mail: [email protected] Web: https://hartfordhealthcaremedicalgroup.org/specialties/primary-care/occupational-medicine Other Offices; 80 Norwich-New London Tnpk, Montville, 06353, (860) 898-1297

48
Middlesex Hospital Occupational Medicine Director: Matthew Lundquist, MD, MPH Address: 534 Saybrook Rd., Middletown, CT 06457 Phone: (860) 358-2750 Fax: (860) 348-2757 e-mail: [email protected] Web: https://middlesexhealth.org/occmed Other Office: Essex Medical Building, 252 Westbrook Road, Essex (860) 358-3840 St. Mary’s Hospital Occupational Health and Diagnostic Center Medical Director: Erica Martinucci, MD Address: 1312 West Main Street, Waterbury, CT Phone: (203) 709-3740 Fax: (203) 709-3741 Email: [email protected] Web: http://www.stmh.org/occupational-medicine-2892 Yale-New Haven Health Systems Manager for Clinical Operations (St. Raphael campus): Andrea Santerre, RN Address: 175 Sherman Avenue, New Haven, CT 06511 Phone: (203) 789-6216 Fax: (203) 789-5174 e-mail: [email protected] Web: https://www.ynhh.org/services/occupational-health.aspx Other Offices: 2080 Whitney Ave., Suite 150, Hamden (203) 789-6242 Greenwich Hospital, 5 Perry Ridge Rd, (203) 863-3483 Bridgeport Hospital, (203) 988-2551 20 York St., New Haven, 203-688-4242 Lawrence and Memorial Occupational Health Center Medical Director: Saima Khalid, MD Address: 52 Hazelnut Hill Rd., Groton, CT 06340 Phone: (860) 446-8265 x7074 Fax: (860) 448-6961 Web: https://www.lmhospital.org/services/occupational-health.aspx

49
Organizations American Lung Association (ALA) in Connecticut The ALA is a non-profit association geared towards preventing lung disease, including occupational lung
disease. Director, Health Promotion: Michelle Caul Connecticut Address: 45 Ash St., East Hartford, CT 06108 Phone: (860) 838-4370 e-mail: [email protected] Web: Lung.org Coalition for a Safe and Healthy Connecticut This is a community-based coalition of environmental, public health, and labor organizations providing resources and advocacy for reducing the use of toxic chemicals through substitution of safer alternatives. Coordinator: Anne B. Hulick, RN MS JD Address: c/o Clean Water Action, 2074 Park Street, Suite 308, Hartford, CT, 06106 Phone: (860) 232-6232 Fax: (860) 232-6334 e-mail: [email protected] Web: https://safehealthyct.wordpress.com Connecticut Safety Council/Safety Roundtable The Safety Council is associated with the Connecticut Business and Industry Association and offers seminars, training courses, consulting, and policy discussions on safety and regulations. Contact: Phillip Montgomery Address: 350 Church St. Hartford, CT 06103-1126 Phone: (860) 244-1982 e-mail: [email protected] Web: https://www.cbia.com/resources/hr-safety/hr-safety-councils/safety-health-roundtable ConnectiCOSH (The Connecticut Council for Occupational Safety and Health) CTCOSH is a union-based non-profit organization for education and political action on job safety and health. They have conferences, fact sheets, and speakers. Director: Mike Fitts Address: 683 No. Mountain Rd, Newington, CT 06111 Phone: (860) 953-COSH (2674) Fax: (860) 953-1038 e-mail: [email protected] Web: http://connecticosh.org The Center for the Promotion of Health in the New England Workplace (CPH-NEW) CPH-NEW is a NIOSH-funded center for scientific research and education, based in participatory action research, integrating occupational health and safety with worksite health that is administered jointly by UMass Lowell and UConn Health. Co-Director: Martin Cherniack, MD, MPH Address: 263 Farmington Ave, Farmington, CT 06030-8077 Phone: (860) 679-4916 Fax: (860) 679-1349 e-mail: [email protected] Web: http://health.uconn.edu/occupational-environmental/academics-and-research/cph-new/

50
The Ergonomic Technology Center (ErgoCenter) at UConn Health The ErgoCenter is a center for prevention of repetitive strain injuries based at UCONN Health, which does training, research, and clinical care. Contact: Jennifer Garza, ScD, Ergonomist Address: 263 Farmington Ave, Farmington, CT 06030-8077 Phone: (860) 679-4916 Fax: (860) 679-1349 Phone: 860-679-5418 e-mail: [email protected] Web: https://health.uconn.edu/occupational-environmental/consultation-and-outreach/ergonomics-consultation/ UConn Health- Center for Indoor Environments and Health (CIEH) The CIEH at the University of Connecticut Health Center works with public health agencies, companies, clinics and individuals to promote indoor environments which protect the health of building occupants and provide productive, creative spaces for learning and work. The website on hurricane health (below) provides educational materials on protecting workers from exposures when addressing flooded buildings after severe wet weather. Director: Paula Schenck, MPH Address: 263 Farmington Ave, Farmington, CT 06030-8077 Phone: (860) 679-2368 Fax: (860) 679-1349 e-mail: schenck@ uchc.edu Web: http://health.uconn.edu/occupational-environmental/consultation-and-outreach/cieh/ http://hurricane-weather-health.doem.uconn.edu Professional Associations American Industrial Hygiene Association (AIHA), Connecticut River Valley Section AIHA is a professional association for industrial hygienists. Contact: Kristin Kramer Phone: (203) 675-2821 e-mail: [email protected] Web: http://www.crvaiha.wildapricot.org Connecticut Safety Society This society is a professional association for anyone that promotes occupational safety, health, and accident
prevention in CT. President: Larry French Phone: (860)391-7285 e-mail: [email protected] Web: Facebook Group – Connecticut Safety Society American Society of Safety Professionals (ASSP) American Society of Safety members are dedicated to creating safe work environments by preventing
workplace fatalities, injuries and illnesses. Sound safety practices are both socially responsible and good business, leading to increased productivity, a better reputation and higher employee satisfaction.
Connecticut Valley Chapter President: Ed Zimmer e-mail: [email protected] Web: http://ctvalley.assp.org

51
Air & Waste Management Association (AWMA), Connecticut Chapter AWMA provides training, information, and networking opportunities to environmental professionals. The
Connecticut Chapter, New England Section, provides periodic forums for discussion and sponsors an annual student scholarship.
Chair: David Krochko Phone: (888) 265-8969 e-mail: [email protected] Web: http://awmact.org Connecticut Trial Lawyers Association, Workers' Compensation Committee CTLA is a professional association of attorneys whose mission reads Trial lawyers protecting individual rights
through fair laws and access to justice. The purpose of this section is to ensure that workers who have been injured or suffered illness arising out of and in the course of their employment are provided the benefits to which they are entitled under the Connecticut Workers' Compensation Act.
Executive Director: Joan D. Maloney Workers’ Compensation Section Chair: Ken Katz Address: 150 Trumbull Street, 2nd Floor, Hartford, CT 06103 Phone: (860) 522-4345 Fax: (860) 522-1027 e-mail: [email protected] Web: https://www.cttriallawyers.org Connecticut Bar Association, Workers' Compensation Section This is a professional association of attorneys who concentrate in workers' compensation. Chair: Francis “Bud” Drapeau Phone: (860) 875-7000 E-mail: [email protected] Web: https://www.ctbar.org/members/sections-and-committees/sections/workers'-compensation New England College of Occupational and Environmental Medicine/NECOEM NECOEM is an association for occupational medicine physicians. Executive Director: Dianne Plantamura, MSW Address: 22 Mill Street, Groveland, MA 01834 Phone: (978) 373-5597 e-mail: [email protected] Web: http://www.necoem.org/ Connecticut Association of Occupational Health Nurses (CTOHN) CTAOHN is an association of occupational health nurses, including most of the nurses working in industry. CT President: Richard Sandrib, BSN, MS, APRN Address: 5 Research Pkwy, Wallingford, CT 06492 Phone: (203) 677-6441 e-mail: [email protected] Web: https://ctaohn.nursingnetwork.com

52
Connecticut State Agencies Department of Public Health (DPH), Occupational Health Unit This unit investigates clusters of occupational diseases. Programs for radon, asbestos, AIDS, lead, asthma, CT
Schools Environmental Resource Team, TB control and infectious disease are also at the DPH. Director: Thomas St. Louis, MSPH Address: DPH/ OHP, 410 Capitol Ave, MS #11EOH, PO Box 340308, Hartford, CT 06134-0308 Phone: 860) 509-7740 Fax: (860) 509-7785 e-mail: [email protected] Web: http://www.ct.gov/dph/occupationalhealth State Department of Emergency Services and Public Protection The Department of Emergency Services and Public Protection (DESPP) is comprised of the Commission on
Fire Prevention and Control, the CT State Police, Emergency Management and Homeland Security, the Police Officers Standards and Training Council, Scientific Services, and Statewide Emergency Telecommunications.
Public Information Officer: Scott Devico Phone: (860) 685-8246; (203) 525-6959 (cell) Fax: (860) 685-8902 e-mail: [email protected] Web: https://portal.ct.gov/despp State Emergency Response Commission, Department of Energy and Environmental Protection This commission oversees plans for response to chemical accidents and collects chemical information for the
public under Community Right to Know. Chairman: Gerard P. Goudreau Address: 79 Elm St, Hartford, CT 06106-5127 Phone: (860) 424-3373 Fax: (860) 424-4062 e-mail: [email protected] Web: http://www.ct.gov/serc Connecticut Fire Academy, Commission on Fire Prevention & Control Safety training & standards compliance. Training Director: Bill Higgins Address: 34 Perimeter Road, Windsor Locks, CT 06096-1069 Phone: 860-264-9272 or toll free (877) 5CT-FIRE (only in CT) Fax: (860) 654-1889 e-mail: [email protected] Web: http://www.ct.gov/cfpc/site/default.asp Connecticut Department of Environmental Protection, Radiation Safety Unit Director: Jeff Semancik Phone: (860) 424-3029; (860) 424-3333 24/7 Emergency Fax: (860) 706-5339 e-mail: [email protected] Web: http://www.ct.gov/deep/cwp/view.asp?a=2713&q=324824&deepNav_GID=1639

53
Workers' Compensation Commission Chairman's Office and Compensation Review Board The Workers’ Compensation Commission (WCC) administers the workers’ compensation laws of the State of Connecticut with the ultimate goal of ensuring that workers injured on the job receive prompt payment of lost work time benefits and attendant medical expenses. To this end, the Commission holds hearings on disputed matters, facilitates voluntary agreements, makes findings and awards, hears and rules on appeals, and closes out cases through full and final stipulated settlements. The WCC Safety & Health Services unit assists employers with implementation of the workers’ compensation regulations regarding “Establishment and Administration of Safety and Health Committees at Work Sites.” Chairman: Stephen M. Morelli Address: 21 Oak St., 4th Floor, Hartford, CT 06106-8011 Phone: (860) 493-1500 Information: (800) 223-WORK (9675) Fax: (860) 247-1361 e-mail: [email protected] Web: http://wcc.state.ct.us/ Workers' Compensation District Offices 1. 999 Asylum Ave., Hartford, CT 06105; (860) 566-4154; Fax: (860) 566-6137 2. 55 Main St., Norwich, CT 06360; (860) 823-3900; Fax: (860) 823-1725 3. 700 State St., New Haven, CT 06511; (203) 789-7512; Fax: (203) 789-7168 4. 350 Fairfield Ave., 2nd Floor, Bridgeport, CT 06604; (203) 382-5600; Fax: (203) 335-8760 5. 55 West Main St., Waterbury, CT 06702; (203) 596-4207; Fax: (203) 805-6501 6. 233 Main St., New Britain, CT 06051; (860) 827-7180; Fax: (860) 827-7913 7. 111 High Ridge Rd., Stamford, CT 06905; (203) 325-3881; Fax: (203) 967-7264 8. 90 Court St., Middletown, CT 06457; (860) 344-7453; Fax: (860) 344-7487 The Who’s Who is compiled by Tim Morse, Ph.D., at UConn Health. To update or add a listing, please contact Tim at [email protected].

54
Ergonomic Sites and Links Ergoweb has good factsheets, documents, and news. https://ergoweb.com/ Thomas Bernard’s website at University of South Florida has many of the standards and excellent free electronic ergonomic analysis tools such as the NIOSH lifting equation and heat stress. https://health.usf.edu/publichealth/tbernard. Tom Armstrong at the University of Michigan runs one of the most respected university training programs for ergonomics, and has extensive information, tools, and lectures. http://www-personal.umich.edu/~tja Cornell University’s Alan Hedge has an active ergonomics program, with reports posted on graduate student projects and evaluation of ergonomic products. http://ergo.human.cornell.edu
The University of Virginia has ergonomics training and resources. http://ehs.virginia.edu/Ergonomics.html Human Factors and Ergonomics Society is the main professional association in ergonomics. http://www.hfes.org Since 1994, the National Ergonomics Conference & Ergo Expo has provided a forum on ergonomics, safety and wellness programs. http://www.ergoexpo.com The Typing Injury FAQ has links and information on repetitive strain injuries from user and injured workers groups. http://www.tifaq.org The National Health Service/UK has information about repetitive strain injuries/RSI http://www.nhs.uk/conditions/Repetitive-strain-injury/Pages/Introduction.aspx Paul Landsbergis has a good website on job stress. http://unhealthywork.org/about-us/team/paul-a-landsbergis The European Agency for Health and Safety at Work’s Job Stress Network web page is dedicated to increasing communication among researchers and others interested in job stress and its impact on health https://osha.europa.eu/data/links/795 Internet Resources for Job Safety and Health is compiled by Tim Morse, Ph.D., at UConn Health. To update or add a listing, please contact Tim at [email protected].