occupational endogeneity and gender wage differentials for
TRANSCRIPT
The Economic and Social Review, Vol. 21, No. 3, April, 1990, pp. 311-328
Occupational Endogeneity and Gender Wage Differentials for Young Workers: An Empirical Analysis using Irish Data
B A R R Y R E I L L Y * University of St Andrews, Scotland
Abstract: This paper presents estimates of the unexplained gender wage gap for young workers controlling for occupational endogeneity. Two contrasting econometric techniques are employed to control for occupational endogeneity. One is the Heckman two step procedure while the other is an I V estimator based on the work of Duncan and Leigh (1985). Statistical tests for the endogeneity hypothesis are provided for both estimators and mildly conflicting results are obtained.
I I N T R O D U C T I O N
I n the past estimates of the wage effects of gender discrimination have focused on wage effects treating the occupational levels of males and
females as exogenous. The literature is replete w i t h examples of such studies where the unexplained differential between two reduced form wage equations is assumed to approximate a gender discrimination effect. 1 One of the major l imitat ions of such studies is that the occupational effects are mediated through exogenous shifts in the wage equation. The estimation of separate occupational wage equations represents a clear advance, particularly i f there is a suspicion that the mean discrimination effect conceals the presence of a larger intra-occupational effect.
*The author would like to thank Ben Knight, Wiji Narandranathan, Mark Stewart and Brian Main for comments on an earlier draft. The comments of two referees are gratefully acknowledged. The assistance of the E S R I in providing the data used in this analysis is also acknowledged. However, the usual disclaimer applies.
1. Gunderson (1989) provides a good survey of recent work in this area.
E
However, a major problem posed by the estimation of occupational wage equations relates to the possible existence of some selection process that determines the observed occupational sample. I f the disturbance terms in the occupational wage equations are correlated w i t h t i e disturbance terms in the occupational selection equation, then conventional estimation techniques, like OLS, provide biased and inconsistent parameter estimates. This has clear implications for the estimated discrimination effect. Methods designed to correct for such selectivity bias have been suggested in the literature and applied to the area of labour supply (Heckman (197(5), migration (Robinson and Tomes (1982), and union endogeneity (Lee 1978) and Duncan and Leigh (1980)) . Few studies have analysed the effects of selectivity bias on discrimination estimates placing particular emphasis on the effects of occupational selection. 2
One of the main objectives of this paper is to explore gender and occupat ional wage differentials w i t h i n a dichotomous non-manual/manual framework and to establish the effects, i f any, of occupational sample selectivity on gender discrimination estimates. A second objective is to statistically test the proposi t ion of occupational exogeneity or occupational sample selection bias.
T w o contrasting econometric methods are employed to control and test for the potential endogeneity of occupational status. One is an Instrumental Variable ( I V ) estimator proposed by Dubin and McFadden (1984) and refined for use in the context of union endogeneity by Duncan and Leigh (1985). The other is the widely used Heckman (1976 and 197!)) two-step estimator based on the Mil l ' s ratio. Testing for occupational exogeneity in the former case is effected through the calculation of the Hausman (1978) test and in the latter through Melino's (1982) Lagrange Mult ip l ier (LM) testfor selection bias.
The econometric issues raised by the analysis should not hide important economic policy issues. Foremost among these is the question of whether the magnitude of the unexplained gender wage differential varies markedly across occupational sectors. A second question relates to the age of the sample under consideration in the analysis. Some theoretical models highlight the role played by female labour force interrupt ion and subsequent skill depreciation in providing an explanation for female wage disadvantage. 3 I n the context o f young workers one may be surprised to detect evidence of wage based discrimination in any occupational sector. The detection of such an effect has clear implications for the transition of young female workers into the adult labour market.
2. Dolton, Makepeace and Van der Klaauw (1989) have examined the effects of sample selection on occupational wages in a poly chotomous framework but without explicit reference to gender wage effects.
3. See Mincer and Polachek (1974) and Polachek (1981).
The layout of this paper is as follows: Section I I outlines the econometric methodology employed and Section I I I describes the data set. Section I V discusses the empirical results and Section V concludes.
I I ECONOMETRIC M E T H O D O L O G Y
The model describing the determination o f non-manual and manual occupational attachment and wages is given by the fol lowing set of wel l k n o w n equations:
Y. = K. j + e.
w . = X .0 + 17 . ni nr n 'm
W . = X .0 + T7 . mi m r m 'mi
(1)
(2)
(3)
where i = 1, . . . . , T, T = number of individuals, n and m subscripts refer to non-manual and manual occupational
categories respectively, Y. = the latent dependent variable for the i t h individual capturing
the determinants o f occupational attachment, Wj = the natural log of the i t h individual's hourly wage, K. = a vector of characteristics that determines the i t h individual's i
occupational attachment, X. = a vector of characteristics that determines the i t h individual's i
wage, e., tj . and v . = error terms.
i ' ' m 'mi
The dichotomous realisation of the unobserved latent dependent variable, Yj , is provided by a dummy indicator variable, I , which equals 1 i f the observed individual is non-manual and 0 otherwise . l t wou ld be di f f icul t to portray the model based on Equations (1) to (3) as an occupational choice model. Clearly, many manual workers, given their educational qualifications, may not have a choice in terms o f their occupational attachment; However, i f one wishes to investigate how the gender wage gap varies across manual and non-manual workers the issue of selection bias must be addressed. The endogeneity of an occupation may not be determined by some choice process but through the fact that a sub-sample of either manual or non-manual workers may not represent a random drawing from the populat ion o f workers as a whole. This raises an important econometric issue to which we now turn .
The wage equations of (2) and (3) cannot be validly estimated separately

by OLS since estimation would be on the basis of a truncated sample. The t runcat ion follows f rom the fact that the non-manual wage is unobserved for the. manual worker and vice-versa.4 However, Heckman (1976 and 1979) provides a method for estimation in the presence of such t runcat ion. The regression Equations (2) and (3) may be expressed as:
E K i I \ v Y i > 0) = X n A + E K i I Y i > 0) (2*)
E K i i I X mi> Y i < 0) = X J » » + E ( ^ m i I Y i < 0) (3*)
where all the elements are as defined above w i t h E( ) denoting the expectations' operator. Heckman (1979) points out that the straight application of OLS to the Equations (2) and (3) suffers f rom two sources of misspecification; one due to omit ted variables, the other to heteroscedasticity. He proposes the use of p roxy constructs designed to take into consideration the truncated nature of the error terms in (2*) and (3*) . The regression equations may be re-written as follows:
E(w . | X ., Y. > 0) = X .0 + 0 X . v ni n i ' I ' nr n n m
E(w . | X ., Y. < 0) = X .0 +8 X . \ mi 1 mi' l ' m r m m mi
(4)
(5)
where
x ni * ( K ; 7 ) (6)
and
X . = - y v (7 1 - * ( K . 7 )
(j>( ) and 4>( ) are the density and cumulative dis t r ibut ion functions of a standard normal variable.
The standard approach to estimating the above model is to apply probit analysis to the reduced form criterion function of (1) yielding estimates for y. These estimates are then inserted into (6) and (7) to obtain the proxy constructs designed to control for the truncated nature of the error terms in the wage equations: OLS is then applied to the heteroscedastic regression equations of (4) and ( 5 ) . 5
4. As Duncan (1983) points out if both sectoral wages are observed simultaneously for each individual drawn at random from the population, then the application of OLS with rhe standard set of caveats is valid. Such circumstances rarely, if ever, occur.
5. The appropriate variance-covariance matrix for the wage equations is outlined in Greene (1981).
Olsen (1982) highlights the necessity of imposing some form of structure on the problem of correcting for selectivity bias w i t h particular importance placed on the identif ication of the selectivity effect. I n the context of the empirical union endogeneity literature identif ication creates a clear problem. A l l the variables that influence the wage also influence union attachment and identif icat ion o f the selectivity effect relies on the functional form. Since the Mil l ' s ratio is a non-linear funct ion of the exogenous variables in the reduced form probi t the same set o f regressors can be used in (1) as in (2) and (3) . However, a condi t ion required for identif ication of the selectivity effect in the two-step framework out l ined is the availability of some variable that shifts the probabi l i ty of observing the dependent variable w i thou t shifting the mean o f the dependent variable. For the purposes of this study a set of parental background dummy variables are included designed to shift the probabi l i ty of occupational attachment but do not enter the wage equations. 6
The statistical test for occupational exogeneity in this framework is provided by Melino (1982) who shows that the Heckman test (i.e., the t-statistic on the selection term) is equivalent to a Lagrange mult ipl ier test of the nul l hypothesis o f no sample selection bias. This Lagrange mult ipl ier test is calculated on the basis of the square of the t-statistic on the selection variable (using the uncorrected OLS variance). This test is shown to be distributed as a x 2 variate w i t h one degree of freedom and possesses superior asymptotic properties to those exhibited by the Heckman test.
This two-step procedure has not been free o f cri t icism. I n particular Lee (1982) suggests that the imposed normal i ty assumption on the error term of the cri terion function may have serious implications for the detection of selectivity bias. A failure to detect such bias may be related to a distr ibutional misspecification in the error term. Lee (1983) outlines a correction method based on more general distr ibutional assumptions. However, the problem of having to make some distr ibutional assumption is not avoided. I t is this particular problem that has forced attention to turn towards dis t r ibut ion free estimators. The I V estimator provides one such alternative.
The I V procedure employed here follows closely that proposed by Duncan and Leigh (1985). Retaining the notat ion used above the fu l l sample wage equation may be wr i t t en as:
6. An alternative solution usually adopted is to use non-linearities in the exogenous variables (e.g., squared or interactive terms) in order to identify the relationship. Since an investigator rarely possesses any intuition regarding the appropriate functional form Olsen (1980) dismisses this as relatively unappealing.
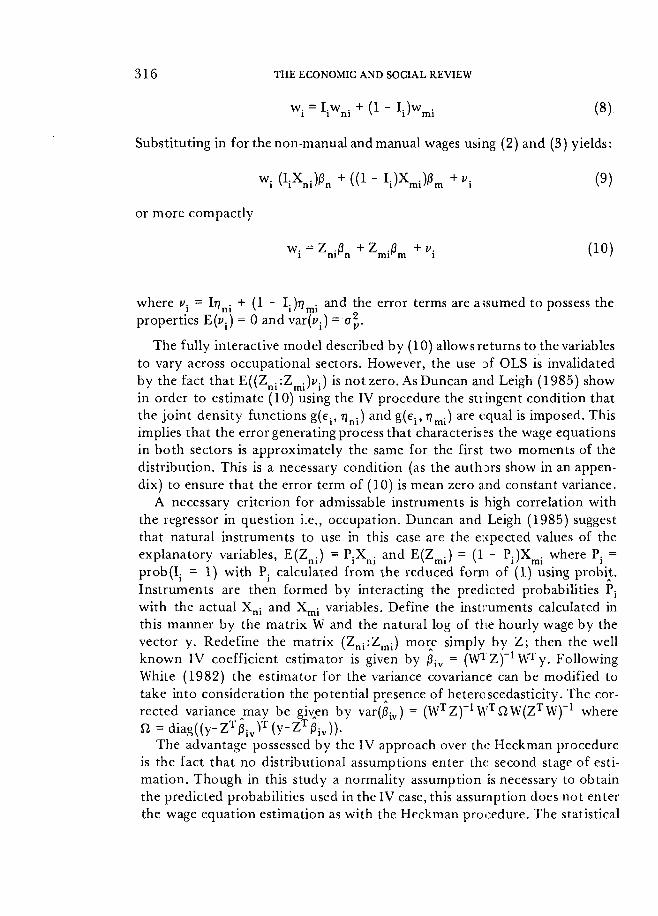
W. = I . W . + (1 - I . )w . (8) I I n i \ i> m i \ >•
Substituting in for the non-manual and manual wages using (2) and (3) yields:
- i W n ^ t l - I i l X A ^ i (9)
or more compactly
w. = Z .0 + Z .0 +v. (10) i n i ' n m r m 1 \ '
where v. — IT? . + (1 - I.)T? . and the error terms are assumed to possess the 1 "ni * 1' 1 mi "
properties E(i> ;) = 0 and var(i> ;) ~ ov-
The ful ly interactive model described by (10) allows returns to the variables to vary across occupational sectors. However, the use of OLS is invalidated by the fact that E ( ( Z n . :Zm .)t>.) is not zero. As Duncan and Leigh (1985) show in order to estimate (10) using the I V procedure the stringent condi t ion that the j o i n t density functions g(e ;, rj •) and g(ej, r ) m i ) are equal is imposed. This implies that the error generating process that characterises the wage equations in bo th sectors is approximately the same for the first two moments of the dis t r ibut ion. This is a necessary condi t ion (as the authors show in an appendix) to ensure that the error term of (10) is mean zero and constant variance.
A necessary cri ter ion for admissable instruments is high correlation w i t h the regressor in question i.e., occupation. Duncan and Leigh (1985) suggest that natural instruments to use in this case are the expected values of the explanatory variables, E ( Z n i ) = P ; X n . and E ( Z m j ) = (1 - P ; ) X m i where P ; = prob( I . = 1) w i t h P. calculated f rom the reduced form of (1) using probi t . Instruments are then formed by interacting the predicted probabilities P ;
w i t h the actual X n i and X m i variables. Define the instruments calculated in this manner by the matr ix W and the natural log of the hourly wage by the vector y. Redefine the matr ix ( Z n i : Z m i ) more simply by Z ; then the wel l k n o w n I V coefficient estimator is given by 0 i v = ( W 1 ' Z ) ~ 1 W T y . Fol lowing White (1982) the estimator for the variance covariance can be modified to take into consideration the potential presence o f heteroscedasticity. The corrected variance may be given by var(0 i v) = ( W T Z ) _ 1 W T £ 2 W ( Z T W ) - 1 where fi=diag((y-ZT0;JT(y-ZT|3iv)).
The advantage possessed by the I V approach over the Heckman procedure is the fact that no distr ibut ional assumptions enter the second stage o f estimat ion. Though in this study a normali ty assumption is necessary to obtain the predicted probabilities used in the I V case, this assumption does not enter the wage equation estimation as w i t h the Heckman procedure. The statistical
test for the occupational endogeneity or occupational sample selection is provided by Hausman (1978) . 7
I I I D A T A
The data used in this study are obtained from an EC commissioned survey carried out by the ESRI in 1982. The target group in the survey were young people in the 15 to 24 age-group who had left full-time education and were either actively engaged in employment or actively searching for work . The sub-sample employed in this analysis is composed of individuals of single mari tal status who defined their main economic activity as either working for payment or prof i t in non-agricultural activities. Only those who classified themselves as full- t ime workers are included. I t could be stated that the use of single individuals raises another selectivity problem, that of part icipation selectivity bias. However, excluding married individuals (both males and females) does not atrophy the sample to any great degree. Furthermore, there is no econometric evidence that the sample used in estimating the wage equations represents a non-random sample. This was confirmed by the estimation o f part icipation equations w i t h wage equations corrected by the Heckman procedure.
The sub-sample was allocated between the broad non-manual/manual occupational category on the basis of the Census of Population Classification of Occupations (1981). The to ta l number of observations for which no missing values were recorded was 2,827. Of these 1,566 were non-manual (of which 568 were male) and 1,261 manual (of which 937 were male) workers.
The variables used in estimation of the wage and occupational equations were:
Wage: Net hour ly wage expressed in logs. Experience: Tota l labour force experience expressed in years. I n the wage
equations this variable is transformed into two linear splines (see Reilly (1987)). Previous Experience: Experience prior to the current job expressed in years. Education: Years in post-compulsory education. This variable was preferred
to an educational qualifications' variable since it proved diff icul t to construct
7. A logit model could have been used to obtain the predicted probabilities. This would have involved estimation of the reduced form of (1) by assuming a logistic distribution for the error term in (1) as opposed to a normal distribution. Since the main difference between these two distributions lies in their tails (the logistic has thicker tails than the probit transformation) one would expect little difference in the predicted probabilities. This is confirmed for this study where a logit model was used to estimate the criterion function of (1). This information was then used to correct the wage equations for selectivity bias using the Lee (1983) procedure. The predicted probabilities obtained from the logit model were also used to construct the instrument set used in the I V procedure. Overall the results reported here are not sensitive to the use of alternative distributional assumptions.
the latter on a comparable basis over the gender and occupational categories employed in the analysis. The exogenous treatment of education is not free of criticism (see Willis and Rosen (1979)). I t could be argued that occupation and education are j o i n t l y and endogenously determined. The econometric model necessary to address this particular issue is of a far more complicated nature than the .one outl ined in this study and such a ;:reatment is avoided here.
Occupation: Coded 1 i f the individual holds a non-manual j o b , 0 otherwise. This variable serves as the dichotomous realisation of the latent dependent variable of Equation (1).
Region of Schooling: A dummy variable adopting a value o f 1 i f the individual's region of schooling is in Dubl in City or county, 0 otherwise. A set o f dummies for type of school (i.e., vocational, secondary, etc.) was also employed bu t to l i t t le effect in the sectoral wage equations and are not reported here.
Establishment Size: A set of three mutual ly exclusive dummy variables capturing the size of the establishment an individual works i n . The two dummies included in estimation are for workers in establishments w i t h between 50 and 400 and greater than 400. The omit ted d u m m y is for less than 50.
Unemployment : The number of months of unemployment since leaving full-time education.
Move Residence: A dummy adopting a value of 1 i f the individual changed residence to take their current j o b .
Father's Occupation: A set o f three dummies capturing the occupational status of an individual's father. The two categories included in estimation are manual and non-manual w i t h agriculture the omit ted category.
Appendix I I contains means, etc., for the variables used in estimation.
I V E M P I R I C A L RESULTS
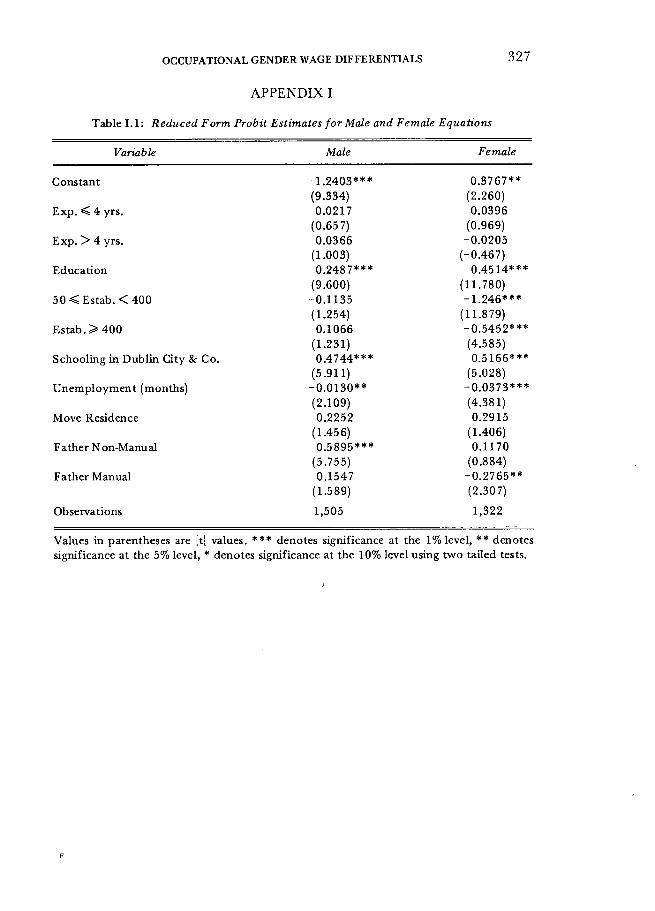
Probit estimates for the reduced form occupational attachment equations are contained in Appendix I and are not commented on here. Tables 1 and 2 contain OLS, I V and Heckman estimates for the male and female wage equation estimates respectively. Across all three estimators the returns to labour force experience are relatively robust and suggest greater returns to labour force experience in the early years of such experience. The private rates of return to education appear more sensitive to the estimator used and especially so for the female manual workers. Rates of 1.5 per cent and 8.5'per cent for the Heckman and I V techniques respectively are recorded for the female manual category as compared to 3.6 per cent for the OLS estimate. I n bo th the I V and the Heckman cases neither estimate is statistically significant at a satisfactory level which is in contrast to the manual male estimates.
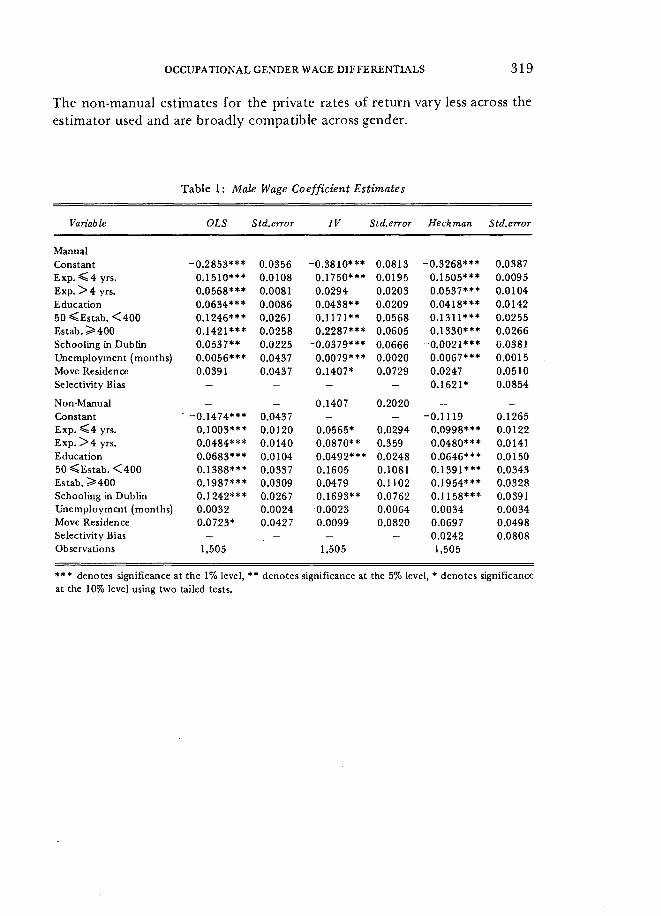
The non-manual estimates for the private rates of return vary less across the estimator used and are broadly compatible across gender.
Table 1: Male Wage Coefficient Estimates
Variab le OLS Std. error IV Std.error Heckman Std.error
Manual Constant -0.2853*** 0.0356 -0.3810*** 0.0813 -0.3268*** 0.0387 Exp. ^ 4 yrs. 0.1510*** 0.0108 0.1750*** 0.0195 0.1505*** 0.0095 Exp. > 4 yrs. 0.0568*** 0.0081 0.0294 0.0203 0.0537*** 0.0104 Education 0.0634*** 0.0086 0.0438** 0.0209 0.0418*** 0.0142 50<Estab . < 4 0 0 0.1246*** 0.0261 0.1171** 0.0568 0.1311*** 0.0255 Estab.>400 0.1421*** 0.0258 0.2287*** 0.0605 0.1330*** 0.0266 Schooling in Dublin 0.0537** 0.0225 -0.0379*** 0.0666 -0.0021*** 0.0381 Unemployment (months) 0.0056*** 0.0437 0.0079*** 0.0020 0.0067*** 0.0015 Move Residence 0.0391 0.0437 0.1407* 0.0729 0.0247 0.0510 Selectivity Bias - - - - 0.1621* 0.0854
Non-Manual — — 0.1407 0.2020 — — Constant " -0.1474*** 0.0437 _ — -0.1119 0.1265 Exp. ^ 4 yrs. 0.1003*** 0.0120 0.0565* 0.0294 0.0998*** 0.0122 Exp. > 4 yrs. 0.0484*** 0.0140 0.0870** 0.359 0.0480*** 0.0141 Education 0.0683*** 0.0104 0.0492*** 0.0248 0.0646*** 0.0150 50<Estab . < 4 0 0 0.1388*** 0.0337 0.1605 0.1081 0.1391*** 0.0343 Estab. > 4 0 0 0.1987*** 0.0309 0.0479 0.1102 0.1954*** 0.0328 Schooling in Dublin 0.1242*** 0.0267 0.1693** 0.0762 0.1158*** 0.0391 Unemployment (months) 0.0032 0.0024 -0.0023 0.0064 0.0034 0.0034 Move Residence 0.0723* 0.0427 0.0099 0.0820 0.0697 0.0498 Selectivity Bias - - - - 0.0242 0.0808 Observations 1,505 1,505 1,505
*** denotes significance at the 1% level, ** denotes significance at the 5% level, * denotes significance at the 10% level using two tailed tests.
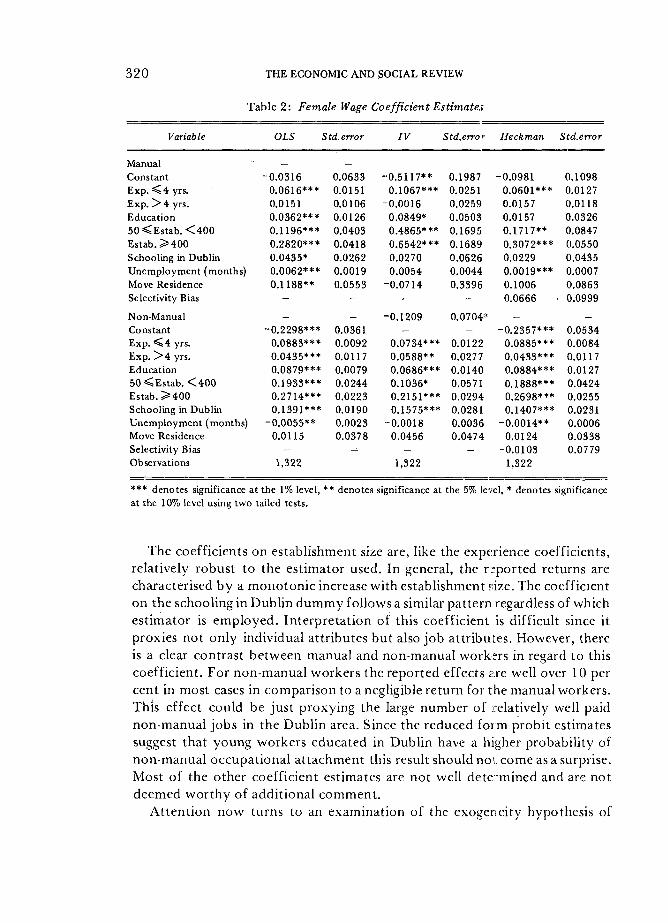
Table 2: Female Wage Coefficient Estimates
Variable OLS Std.error IV Std.error Heckman Std.error
Manual _ _ Constant -0.0316 0.0633 -0.5117** 0.1987 -0.0981 0.1098 Exp. ^ 4 yrs. 0.0616*** 0.0151 0.1067*** 0.0251 0.0601*** 0.0127 Exp. ^>4 yrs. 0.0151 0.0106 -0.0016 0.0259 0.0157 0.0118 Education 0.0362*** 0.0126 0.0849* 0.0503 0.0157 0.0326 50<Estab . < 4 0 0 0.1196*** 0.0403 0.4865*** 0.1695 0.1717** 0.0847 E s t a b . ^ 4 0 0 0.2820*** 0.0418 0.6542*** 0.1689 0.3072*** 0.0550 Schooling in Dublin 0.0435* 0.0262 0.0270 0.0626 0.0229 0.0435 Unemployment (months) 0.0062*** 0.0019 0.0054 0.0044 0.0019*** 0.0007 Move Residence 0.1188** 0.0553 -0.0714 0.3396 0.1006 0.0863 Selectivity Bias - - - - 0.0666 0.0999
Non-Manual - — -0.1209 0.0704* — — Constant -0.2298*** 0.0361 — — -0.2357*** 0.0534 Exp. ^ 4 yrs. 0.0883*** 0.0092 0.0734*** 0.0122 0.0885*** 0.0084 Exp. > 4 yrs. 0.0435*** 0.0117 0.0588** 0.0277 0.0433*** 0.0117 Education 0.0879*** 0.0079 0.0686*** 0.0140 0.0884*** 0.0127 50<Estab . < 4 0 0 0.1933*** 0.0244 0.1036* 0.0571 0.1888*** 0.0424 Estab. > 4 0 0 0.2714*** 0.0223 0.2151*** 0.0294 0.2698*** 0.0255 Schooling in Dublin 0.1391*** 0.0190 0.1575*** 0.0281 0.1407*** 0.0231 Unemployment (months) -0.0055** 0.0023 -0.0018 0.0036 -0.0014** 0.0006 Move Residence 0.0115 0.0378 0.0456 0.0474 0.0124 0.0338 Selectivity Bias - - - - -0.0103 0.0779 Observations 1,322 1,322 1,322
*** denotes significance at the 1% level, ** denotes significance at the 5% level, * denotes significance at the 10% level using two tailed tests.
The coefficients on establishment size are, like the experience coefficients, relatively robust to the estimator used. In general, the reported returns are characterised by a monotonic increase w i t h establishment siize. The coefficient on the schooling in Dub l in dummy follows a similar pattern regardless of which estimator is employed. Interpretation of this coefficient is diff icul t since i t proxies not only individual attributes but also job attributes. However, there is a clear contrast between manual and non-manual workers in regard to this coefficient. For non-manual workers the reported effects £.re well over 10 per cent in most cases in comparison to a negligible return for the manual workers. This effect could be just proxying the large number of relatively well paid non-manual jobs in the Dubl in area. Since the reduced form probi t estimates suggest that young workers educated in Dubl in have a higher probabil i ty of non-manual occupational attachment this result should not. come as a surprise. Most of the other coefficient estimates are not well determined and are not deemed wor thy of addit ional comment.
A t t en t ion now turns to an examination of the exogeneity hypothesis of
the broad occupational categories employed in the analysis. The results based on the Melino (1982) test out l ined in Section I I suggest l i t t l e evidence o f occupational endogeneity for the females. The comparable L M test for the non-manual male category also suggests l i t t le or no evidence of selectivity bias. However, the L M test for the male manual sector suggests a rejection of the nul l of exogeneity. 8 The latter result needs to be interpreted in terms of the direction of the selection bias. Due to the construction of the p roxy variables, out l ined in Section I I , a positive coefficient on the selection terms implies negative selectivity (or negative truncation) i n terms of manual jobs. I n fact, the data suggest that young workers selecting the manual category earn on average 8.5 per cent lower wages than an individual drawn at random from the populat ion w i t h identical observable characteristics would be expected to earn in that sector. A suggestive interpretation for this result may lie in the fact that young workers in the manual sector sacrifice wages for training in return for greater life-cycle earnings. Seventy per cent of workers in the manual category, in this study, belong to the skilled category and this interpretat ion could be viewed as reasonably plausible.
The Hausman test results based on the I V estimates of Tables 1 and 2 are in slight contrast to those obtained using the Melino L M test. 9 The x 2 statistics are 7.82 and 8.88 for the male and female equations respectively. Taking the L M and the Hausman tests together there appears l i t t l e evidence o f occupational endogeneity w i t h the exception of the male manual category.
However, a number o f caveats need to be inserted regarding the rel iabi l i ty of bo th sets o f exogeneity tests. For example, the L M test is contingent on a normally distributed error term in the reduced form probi t of ( l ) . 1 0 Departures f rom normal i ty may lead to erroneous conclusions regarding selectivity bias (see Lee (1982)). On the other hand, the Hausman test possesses its own l imitat ions. I f the instruments used are orthogonal to the regressors being instrumented the power of the test is zero and not rejecting the nu l l when untrue is certain. Therefore, bo th sets of results should be couched in terms of the above provisos and any conclusion regarding occupational exogeneity/ endogeneity must remain relatively neutral.
8. The X 2 statistics for the females are 0.017 and 0.429 for the manual and non-manual sectors respectively. The comparable estimates for the males are 0.088 and 3.482. The latter result is marginally outside the 5 per cent level of significance but well inside the 10 per cent level.
9. The quadratic form of the Hausman (1978) test was employed here rather than the auxiliary regression approach. The resultant test statistic has a X 2 distribution with the number of restrictions under the test given by the number of parameters estimated.
10. Chesher and Irish (1987) provide easily computable diagnostics to test, among other things, the assumption of normality. The X 2 statistics based on their suggested normality tests are 656.6 and 846.5 for the male and female reduced form versions of (1). The decisive rejection of normality brings the validity of the LM test into question but the rejection may also be attributable to the poor finite properties of the tests used.
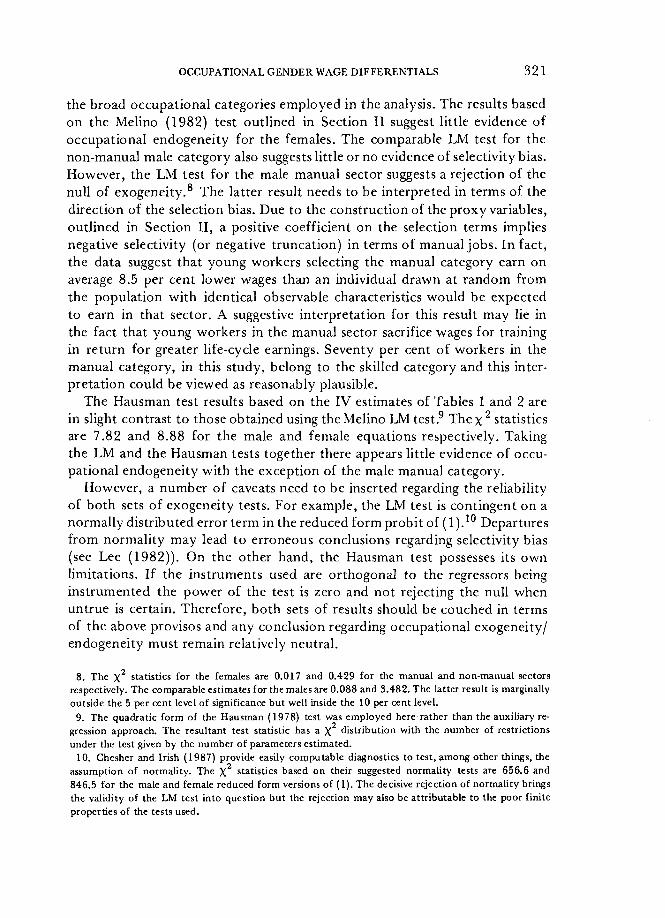
The observed manual differential is relatively small suggesting that on average manual male workers get 1.7 per cent more than female manual workers. I n contrast the non-manual observed differential is considerably larger w i t h males, on average, earning 9.5 per cent more than their female counterparts. Tables 3 to 5 report OLS, I V and Heckman based explained and unexplained differentials in an attempt to establish how much of the gross differential is explained by characteristics and how much by differing coefficients. 1 1 In terms of all three estimators l i t t le evidence of an unexplained gender wage differential exists in the manual sector.
Table 3: OLS Wage Differentials by Occupational Sector
Sector AW AXpm
Non-Manual 0.0904 0.0327*** 0.0576*** (0.0036) (0.0170)
Manual 0.0167 -0.0121 0.0288 (0.0083) (0.0189)
Asymptotic standard errors in parentheses. *** denotes significance at the 1% level, ** denotes significance at the 5% level, * denotes significance at the 10% level using two tailed tests.
Table 4: IV Wage Differentials by Occupational Sector
Sector AW AXQm XfA(3
Non-Manual 0.0904 0.0269** 0.1521 (0.0106) (0.0890)
Manual 0.0167 -0.0040 0.0044 (0.0182) (0.1002)
Asymptotic standard errors in parentheses. *** denotes significance at the 1% level, ** denotes significance at the 5% level, * denotes significance at the 10% level using two tailed tests.
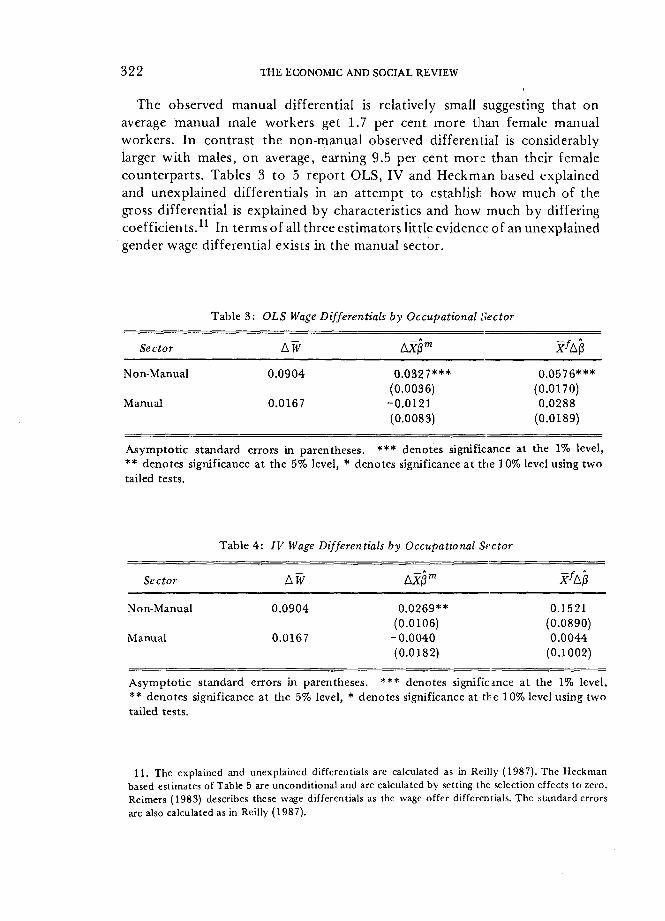
11. The explained and unexplained differentials are calculated as in Reilly (1987). The Heckman based estimates of Table 5 are unconditional and are calculated by setting the selection effects to zero. Reimers (1983) describes these wage differentials as the wage offer differentials. The standard errors arc also calculated as in Reilly (1987).
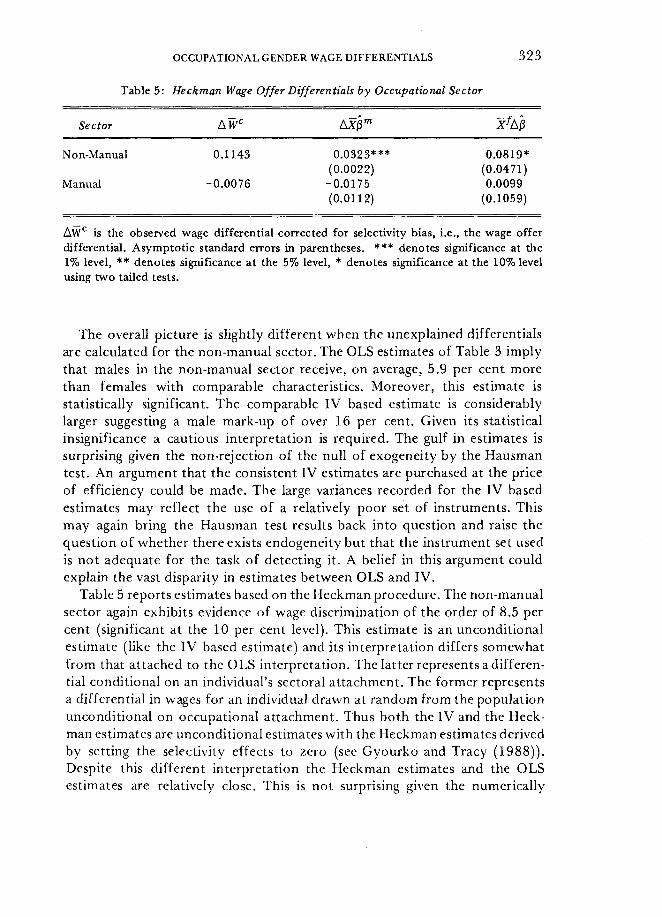
Table 5: Heckman Wage Offer Differentials by Occupational Sector
Sector Xft&
Non-Manual 0.1143 0.0323*** 0.0819* (0.0022) (0.0471)
Manual -0.0076 -0.0175 0.0099 (0.0112) (0.1059)
AW C is the observed wage differential corrected for selectivity bias, i.e., the wage offer differential. Asymptotic standard errors in parentheses. *** denotes significance at the 1% level, ** denotes significance at the 5% level, * denotes significance at the 10% level using two tailed tests.
The overall picture is slightly different when the unexplained differentials are calculated for the non-manual sector. The OLS estimates of Table 3 imply that males in the non-manual sector receive, on average, 5.9 per cent more than females w i t h comparable characteristics. Moreover, this estimate is statistically significant. The comparable I V based estimate is considerably larger suggesting a male mark-up o f over 16 per cent. Given its statistical insignificance a cautious interpretation is required. The gulf i n estimates is surprising given the non-rejection o f the nul l o f exogeneity by the Hausman test. A n argument that the consistent I V estimates are purchased at the price of efficiency could be made. The large variances recorded for the I V based estimates may reflect the use o f a relatively poor set of instruments. This may again bring the Hausman test results back into question and raise the question of whether there exists endogeneity but that the instrument set used is not adequate for the task o f detecting i t . A belief in this argument could explain the vast disparity in estimates between OLS and I V .
Table 5 reports estimates based on the Heckman procedure. The non-manual sector again exhibits evidence of wage discrimination of the order of 8.5 per cent (significant at the 10 per cent level). This estimate is an uncondit ional estimate (like the I V based estimate) and its interpretation differs somewhat from that attached to the OLS interpretat ion. The latter represents a different ial condit ional on an individual's sectoral attachment. The former represents a differential in wages for an individual drawn at random from the populat ion uncondit ional on occupational attachment. Thus bo th the I V and the Heckman estimates are uncondit ional estimates w i t h the Heckman estimates derived by setting the selectivity effects to zero (see Gyourko and Tracy (1988)) . Despite this different interpretation the Heckman estimates and the OLS estimates are relatively close. This is not surprising given the numerically
small and statistically insignificant coefficients reported for the female select iv i ty coefficients in particular.
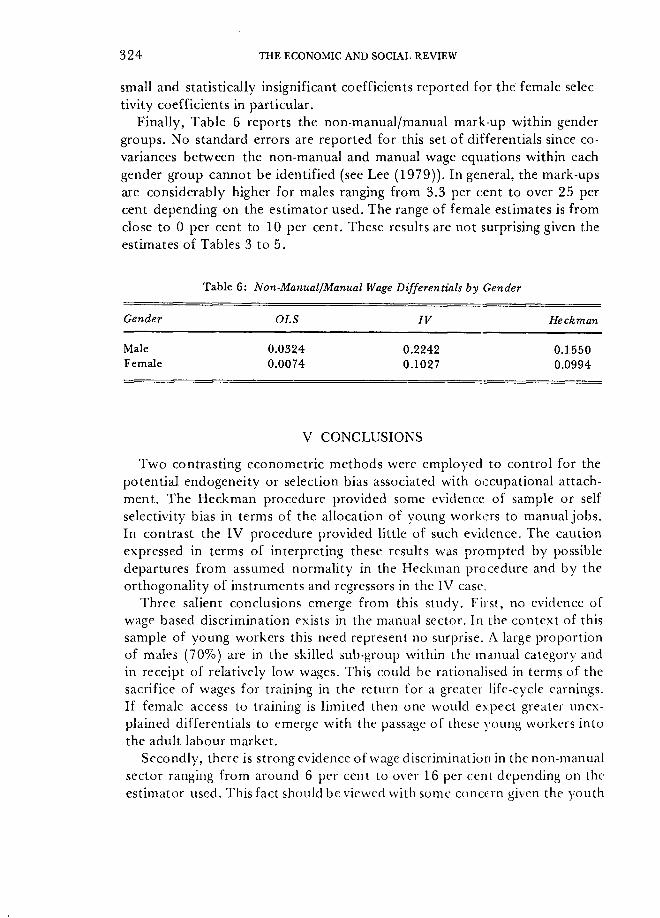
Final ly , Table 6 reports the non-manual/manual mark-up w i t h i n gender groups. No standard errors are reported for this set of differentials since co-variances between the non-manual and manual wage equations w i t h i n each gender group cannot be identified (see Lee (1979)). I n general, the mark-ups are considerably higher for males ranging from 3.3 per cent to over 25 per cent depending on the estimator used. The range of female estimates is f rom close to 0 per cent to 10 per cent. These results are not surprising given the estimates of Tables 3 to 5.
Table 6: Non-Manual/Manual Wage Differentials by Gender
Gender OLS IV Heckman
Male 0.0324 0.2242 0.1550 Female 0.0074 0.1027 0.0994
V CONCLUSIONS
Two contrasting econometric methods were employed to control for the potential endogeneity or selection bias associated w i t h occupational attachment. The Heckman procedure provided some evidence of sample or self selectivity bias in terms of the allocation of young workers to manual jobs. I n contrast the I V procedure provided l i t t le of such evidence. The caution expressed in terms of interpreting these results was prompted by possible departures f rom assumed normali ty in the Heckman procedure and by the orthogonali ty of instruments and regressors in the I V case.
Three salient conclusions emerge from this study. First, no evidence of wage based discrimination exists in the manual sector. I n the context of this sample of young workers this need represent no surprise. A large propor t ion of males (70%) are in the skilled sub-group wi th in the manual category and in receipt of relatively low wages. This could be rationalised in terms of the sacrifice of wages for training in the return for a greater life-cycle earnings. I f female access to training is l imi ted then one would expect greater unexplained differentials to emerge w i t h the passage o f these young workers into the adult labour market.
Secondly, there is strong evidence of wage discrimination in the non-manual sector ranging from around 6 per cent to over 16 per cent depending on the estimator used. This fact should be viewed w i t h some concern given the youth
o f the workers and the fact that 75 per cent o f female workers, in this study, are in the non-manual category.
Th i rd ly , the low observed aggregate gender wage differential of 2.8 per cent provides a misleading figure and disguises vaster gender differences in wages by occupational sectors. Invoking the non-manual/manual framework allowed a more wor thwhi le insight into the detection o f unexplained gender wage differentials. This in itself may be interpreted as a vindication of the exercise undertaken.
REFERENCES
C H E S H E R , A. , and M. I R I S H , 1987. "Residual Analysis in the Grouped and Censored Normal Linear Model", Journal of Econometrics, Vol. 34, pp. 33-61.
D O L T O N , P., G. M A K E P E A C E , and W. V A N D E R K L A A U W , 1989. "Occupational Choice and Earnings' Determination: The Role of Sample Selection and Non-Pecuniary Factors", Oxford Economic Papers, Vol. 41, pp. 5 73-594.
D U B I N . J . , and D. McFADDEN, 1984. "An Econometric Analysis of Residential Electrical Appliance Holdings and Consumption", Econometrica, Vol. 52, pp. 345-362.
DUNCAN, G. , 1983. "Sample Selectivity as a Proxy Variable Problem: On the Use and Misuse of Gaussian Selectivity Corrections", in J . Reid (ed.), New Approaches to Labor Unions, Research in Labor Economics, Suppl. 2 , J A I Press.
DUNCAN, G., and D. L E I G H , 1980. "Wage Determination in the Union and Nonunion Sectors; A Sample Selectivity Approach", Industrial and Labor Relations Review, Vol. 34, pp. 24-34.
DUNCAN, G. , and D. L E I G H , 1985. "The Endogeneity of Union Status: An Empirical Test", Journal of Labor Economics, Vol. 3, pp. 385-402.
G R E E N E , W., 1981. "Sample Selection Bias as a Specification Error", Econometrica, Vol. 49, pp. 795-798.
G U N D E R S O N , M., 1989. "Male-Female Wage Differentials and Policy Responses", Journal of Economic Literature, Vol. 27, pp. 46-72.
G Y O U R K O , J . , and J . T R A C Y , 1988. "An Analysis of Public- and Private-sector Wages Allowing for Endogenous Choices of Both Government and Union Status", Journal of Labor Economics, Vol. 6, pp. 229-253.
HAUSMAN, J . , 1978. "Specification Tests in Econometrics", Econometrica, Vol. 46, pp. 1251-1271.
H E C K M A N , J . , 1976. "The Common Structure of Statistical Models of Truncation, Self-Selection and Limited Dependent Variables and a Simple Estimator for Such Models", Annals of Economic and Social Measurement, Vol. 5, pp. 475-492.
H E C K M A N , J . , 1979. "Sample Selection Bias as a Specification Error", Econometrica, Vol. 47, pp. 153-161.
L E E , L - F . , 1978. "Unionism and Wage Rates: A Simultaneous Equations Model with Qualitative and Limited Dependent Variables", International Economic Review, Vol. 19, pp. 415-433.
L E E , L - F . , 1979. "Identification and Estimation in Binary Choice Models with Limited (Censored) Dependent Variables", Econometrica, Vol. 47, pp. 977-996.
L E E , L - F . , 1982. "Some Approaches to the Correction of Selectivity Bias", Review of Economic Studies, Vol. 49, pp. 355-372.
L E E , L - F . , 1983. "Generalised Models with Selectivity", Econometrica, Vol. 51, pp. 507-512.
MELINO, A., 1982. "Testing for Sample Selection Bias", Review of Economic Studies, Vol. 49, pp. 151-153.
MINCER, J . , and S. P O L A C H E K , 1974. "Family Investments in Human Capital: Earnings of Women", Journal of Political Economy, Vol. 82, pp. s76-sl08.
O L S E N , R. , 1980. "A Least Squares Correction for Selectivity Bias", Econometrica, Vol. 48, pp. 1815-1820.
O L S E N , R. , 1982. "Distributional Tests for Selectivity Bias and a More Robust Likelihood Estimator", International Economic Review, Vol. 23, pp. 223-240.
P O L A C H E K , S., 1981. "Occupational Self-Selection: A Human Capital Approach to Sex Differences in Occupational Structure", Review of Economics and Statistics, Vol. 63, pp. 60-69.
R E I L L Y , B., 1987. "Wages, Sex Discrimination and the Irish Labour Market for Young Workers", The Economic and Social Review, Vol. 18, pp. 271-305.
R E I M E R S , C , 1983. "Labor Market Discrimination Against Hispanic and Black Men", Review of Economics and Statistics, Vol. 45, pp. 570-579.
ROBINSON, C , and N. TOMES, 1982. "Self-selection and Inter-Provincial Migration in Canada", Canadian Journal of Economics, Vol. 15, pp. 474-502.
WHITE, H. , 1982. "Instrumental Variables Regression with Independent Observations", Econometrica, Vol. 50, pp. 483-499.
W I L L I S , R. , and S. R O S E N , 1979. "Education and Self-Selection", Journal of Political Economy, Vol. 87, pp. s7-s36.
A P P E N D I X I
Table 1.1: Reduced Form Probit Estimates for Male and Female Equations
Variable Male Female
Constant -1.2403*** 0.3767** (9.334) (2.260)
Exp. < 4 yrs. 0.0217 0.0396 (0.65 7) (0.969)
Exp. > 4 yrs. 0.0366 -0.0205 (1.003) (-0.467)
Education 0.2487*** 0.4514*** (9.600) (11.780)
5 0 < E s t a b . < 4 0 0 -0.1135 -1.246*** (1.254) (11.879)
Es tab .>400 0.1066 -0.5452*** (1.231) (4.585)
Schooling in Dublin City & Co. 0,4744*** 0.5166*** (5.911) (5.028)
Unemployment (months) -0.0130** -0.0373*** (2.109) (4.381)
Move Residence 0.2252 0.2915 (1.456) (1.406)
Father Non-Manual 0.5895*** 0.1170 (5.755) (0.884)
Father Manual 0.1547 -0.2765** (1.589) (2.307)
Observations 1,505 1,322
Values in parentheses are [t| values. *** denotes significance at the 1% level, ** denotes significance at the 5% level, * denotes significance at the 10% level using two tailed tests.
F
APPENDIX I I
Data Appendix
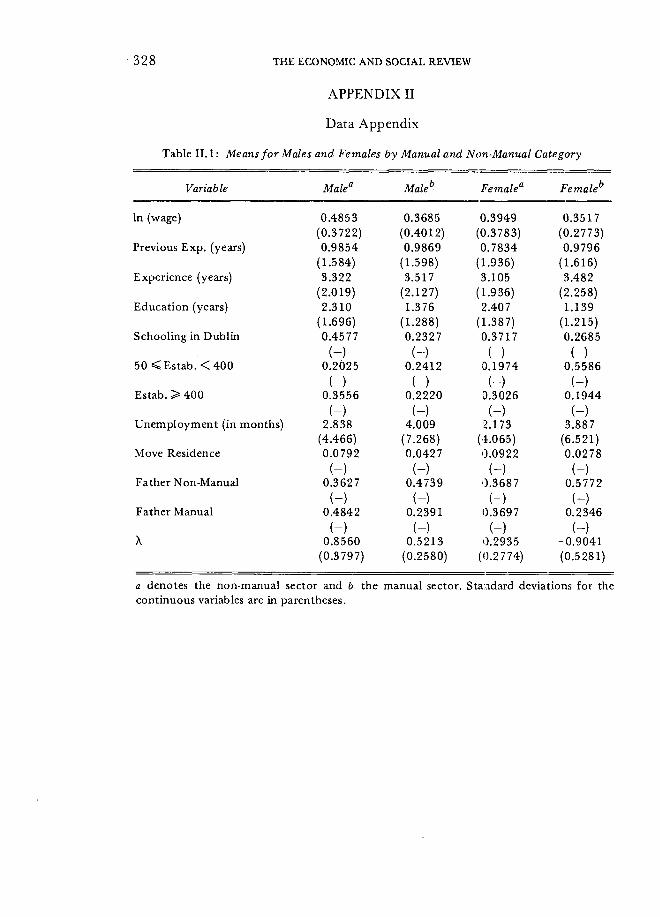
Table II . 1: Means for Males and Females by Manual and Non-Manual Category
Variable Male" Maleb Female0 Female**
In (wage) 0.4853 0.3685 0.3949 0.3517 (0.3722) (0.4012) (0.3783) (0.2773)
Previous Exp. (years) 0.9854 0.9869 0.7834 0.9796 (1.584) (1.598) (1.936) (1.616)
Experience (years) 3.322 3.517 3.105 3.482 (2.019) (2.127) (1.936) (2.258)
Education (years) 2.310 1.376 2.407 1.139 (1.696) (1.288) (1.387) (1.215)
Schooling in Dublin 0.4577 0.2327 0.3717 0.2685 ( - ) ( - ) ( - ) ( - )
5 0 < E s t a b . < 4 0 0 0.2025 0.2412 0.1974 0.5586 ( - ) ( - ) ( - ) ( - )
Estab. > 400 0.3556 0.2220 0.3026 0.1944 ( - ) ( - ) ( - ) ( - )
Unemployment (in months) 2.838 4.009 2.173 3.887 (4.466) (7.268) (4.065) (6.521)
Move Residence 0.0792 0.0427 0.0922 0.0278 ( - ) ( - ) ( - ) ( - )
Father Non-Manual 0.3627 0.4739 0.3687 0.5772 ( - ) ( - ) ( - ) ( - )
Father Manual 0.4842 0.2391 0.3697 0.2346 ( - ) ( - ) ( - ) ( - )
X 0.8560 -0.5213 0.2935 -0.9041 (0.3797) (0.2580) (0.2774) (0.5281)
a denotes the non-manual sector and b the manual sector. Standard deviations for the continuous variables are in parentheses.