occupational exposure in polish paint and lacquer …
TRANSCRIPT

International Journal of Occupational Medicine and Environmental Health, Vol. 10, No 1, 79 — 88, 1997
OCCUPATIONAL EXPOSURE IN PO LISH PA IN T AND LACQUER INDUSTRY
WIKTOR WESOŁOWSKI and JAN P. GROMIEC
Department of Chemical and Dust Hazards The Nofer Institute of Occupational Medicine Łódź, Poland
Key words: Occupational exposure, Evaluation, Solvent, Work environment monitoring, Gas chromatography, Paint and lacquer industry
Abstract. Evaluation of occupational exposure to solvent vapours in the production of paints and lacquers is presented. The measurements were carried out in 5 paint and lacquer producing plants of the varied level of technical and technological advancement. Evaluation of exposure was based on determination of all substances identified in the work environment. Analysis was performed by gas chromatography with MSD and FID . Standard mixtures composed of 40 substances were used for calibration. The determined levels of exposure were directly dependent on technical conditions and modernisation status in factories investigated.Measurements were carried out in the uniform analytical system, which assures comparability of the data from all the factories under study.
INTRODUCTIONPaint and lacquer solvents are complex mixtures of substances representing
numerous groups of chemicals. The composition of solvents is frequently changed due to the development of new products and technologies. Consequently, monitoring of hazards induced by those chemicals is associated with numerous analytical and methodological problems. For some years already, the practice of the assessment of occupational exposure during the paint and lacquer production has been subject to much criticism. First of all laboratories responsible for measurements differ considerably in their technical and human capabilities and, the reliability of data presented by them is often disputable. The knowledge of contaminants present in the occupational environment is essential for their successful determinations, and the selection of suitable analytical methods plays a key role.
Address reprint requests to W. Wesołowski M.D., Departm ent of Chemical and Dust Hazards, The Nofer Institute of Occupational Medicine, P.O. Box 199, 90-950 Łódź, Poland.

80 W. Wesołowski and J.P. Gromiec
A comprehensive monitoring system capable of meeting the requirements of measurement compatibility, similar to those used in the USA or West Europe (6,8), has not as yet been implemented in Poland. Such a system is a prerequisite for making the data obtained from individual industrial plants comparable and averaged for general analyses to be presented as reports on exposure in individual industries and sectors (4).
The purpose of this work was to identify, using modern analytical methods, toxic compounds in the work environment of paint and lacquer plants, representative for this branch of industry in Poland, and to evaluate workers1 exposure to substances identified.
ID EN TIFIC A TIO N O F TH E W ORK ENVIRONM ENT POLLUTANTS
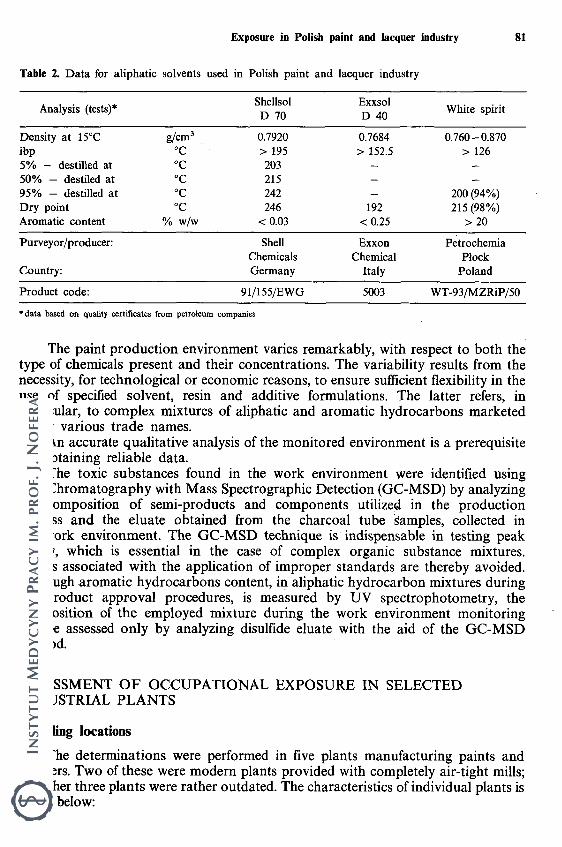
Solvent mixtures used in the paint and lacquer industry contain, for example, such chemicals as acetic acid esters, glycols and their alkyl derivatives, glycol acetates and their ethyl and methyl derivatives, styrene, aliphatic alcohols, aliphatic hydrocarbons (components of extraction and painter’s naphtha or white spirit). The popular C-9 and C-10 aromatic hydrocarbons, like alkyl derivatives of benzene with nine or ten carbon atoms in the molecule, known under the trade names: Farbasol, Solvesso-100, Solvesso-150 etc., may be also present (Table 1). They also constitute aromatic contamination of white spirit. Unlike in other countries, no limitations for aromatic hydrocarbon content of white spirit are specified in Poland (9). The hygiene-related problems to be considered in the assessment of the occupational exposure, encountered when Polish-made white spirit containing high amounts of aromatic hydrocarbons is used, are quite different if its Western analogues, such as EXXSOL D 40 (Table 2), substantially free of aromatic hydrocarbons, are employed. As a result, interpretation of measurement results becomes more difficult because hygiene standards specifying admissible levels for aromatic hydrocarbon-free replacements of Polish white spirit are not available.
Table 1. D ata for aromatic solvents used in Polish paint and lacquer industry
Jolasol Shellsol Farbasol SolvessoAnalysis (tests)*
1000 SOLV A AB 100 150 200
Density at 15°C g/cm3 0.8700 0.8759 0.8930 0.8680 0.8776 0.8988 0.9973ibp °C 145 165 182 153 163 186.5 231.55% destiled at °C — - - - 166 187.5 23650% destiled at °C — - — - - 190.5 245.595% destiled at °c — - - 160 175 200.5 279Dry point °c 190 181 211 - 179 204 290Aromatic content % w/w 98 100 99 99 99 99
Purveyor/producer J.L.C Shell Nederland Petroche Exxon ChemicalChemie Chemie B.V. mia Płock Belgium
Country: Austria The Netherlands Poland Belgium
Producet code: 2085/3500700 Q7391 Q7493 351007 352005 353003
* data based on quality certificates from petroleum companies
Exposure in Polish paint and lacquer industry 81
Table 2. D ata for aliphatic solvents used in Polish paint and lacquer industry
Analysis (tests)*Shellsol D 70
Exxsol D 40 White spirit
Density a t 15°C g/cm3 0.7920 0.7684 0.760-0.870ibp °C > 195 > 152.5 > 1265% — destilled at °C 203 — —
50% — destiled at °c 215 — —
95% — destilled a t °c 242 — 200 (94%)Dry point ° c 246 192 215 (98%)Aromatic content % w/w < 0.03 <0.25 > 2 0
Purveyor/producer:
Country:
ShellChemicalsGermany
ExxonChemical
Italy
PetrochemiaPłock
Poland
Product code: 91/155/EWG 5003 W T-93/MZRiP/50
• d a ta based on quality certificates from petroleum companies
The paint production environment varies remarkably, with respect to both the type of chemicals present and their concentrations. The variability results from the necessity, for technological or economic reasons, to ensure sufficient flexibility in the use of specified solvent, resin and additive formulations. The latter refers, in particular, to complex mixtures of aliphatic and aromatic hydrocarbons marketed under various trade names.
An accurate qualitative analysis of the monitored environment is a prerequisite for obtaining reliable data.
The toxic substances found in the work environment were identified using Gas Chromatography with Mass Spectrographic Detection (GC-MSD) by analyzing the composition of semi-products and components utilized in the production process and the eluate obtained from the charcoal tube samples, collected in the work environment. The GC-M SD technique is indispensable in testing peak purity, which is essential in the case of complex organic substance mixtures. Errors associated with the application of improper standards are thereby avoided. Although aromatic hydrocarbons content, in aliphatic hydrocarbon mixtures during the product approval procedures, is measured by UV spectrophotometry, the composition of the employed mixture during the work environment monitoring can be assessed only by analyzing disulfide eluate with the aid of the GC-M SD method.
ASSESSMENT O F OCCUPATIONAL EXPOSURE IN SELECTED INDUSTRIAL PLANTS
Sampling locations
The determinations were performed in five plants manufacturing paints and lacquers. Two of these were modern plants provided with completely air-tight mills; the other three plants were rather outdated. The characteristics of individual plants is given below:

82 W. Wesołowski and J.P. Gromiec
No 1 — smali plant with rather limited production space, outdated mills, manufacturing small range of products,
N o 2 — big, modern, multi-department plant with its own resin manufacturing facility, provided with air-tight mills,
N o 3 — small a two-department plant, provided chiefly with ball mills, with outdated resin preparation facility,
N o 4 — relatively modern plant, provided with non-air-tight mills and very primitive solvent handling facility,
No 5 — very modern, a multi-department plant provided with its own resin manufacturing facilities, high production volume.
SAM PLING AND ANALYTICAL M ETHOD
Air sampling strategy
Individual dosimetry method was used for air sampling in all plants. The workers were provided with personal pumps which they carried during all daily routine operations. The duration of the sampling period was always close to the nominal working time, not shorter than 80% of an eight-hour working shift, in accordance with the adopted uniform criteria for the work environment monitoring (7). Workers performing all basic operations associated with the normal production process of a specified production department were represented in the survey. Individual groups of the subjects included people working in direct contact with solvent vapours as well as those performing auxiliary jobs, such as department locksmiths, laboratory employees, transport workers etc.
Air was sampled by passing a known volume of air through charcoal tubes using SKC personal pumps. The absorbed substances were desorbed with carbon disulfide. The eluate was analyzed by gas chromatography.
APPARATUS AND ANALYTICAL M ETHODS
Apparatus
Two measuring sets, each including a Hewlett Packard Type HP-589011 Chrom atograph provided with a HP-MSD-5972 M ass Detector, and a Hewlett- Packard Gas Chrom atograph with a Flame-Ionising Detector were used. Both sets were provided with split/splitless injectors, autom atic HP-GC-SFC-7673 samplers and identical H P-PO N A columns.
Chromatographic conditionsBest conditions of chromatographic separation of the toxic substances present
in the work environment air were obtained on a 50 m long 0.2 mm dia. H P-PO NA column with 0.5 mm stationary phase film using programmable temperature and pressure values at the column outlet. The values were selected so as to obtain as symmetrical chromatograms as possible on both measuring sets described above.

Exposure in Polish paint and lacquer industry 83
RESULTSThe chromatographic identification of the desorbed substances was performed
using the calibration table comprising 40 most common constituents of paint and lacquer solvents. The identified substances were analysed and their concentrations determined. For commercial aromatic hydrocarbon mixtures (Farbasol, Solvesso etc.) individual component concentrations were determined, since no combined occupational exposure limits (OEL) for these mixtures are established. White spirit concentration was determined from n-alkane peaks, which are easy to identify in the multiple — peak chromatograms. The percentage of n-alkanes in bulk white spirit was determined prior to the analysis of the work environment samples. The n-alkanes content in solvents is presented in Table 3.
Table 3. Concentrations of n-alkanes in white spirits (WS) from different paint shops (% w/w)
Compound WS-1 WS-2 WS-3 WS-4 WS-5 WS-6 WS-7 WS-8
n-HEPTANE 0.06 0.00 0.04 0.04 0.13 0.06 0.07 0.22n-OCTANE 0.32 0.93 0.29 0.29 0.34 0.10 0.87 1.97n-NONANE 1.96 5.90 1.84 1.93 2.27 12.10 9.28 8.43n-DEKANE 11.82 13.40 11.80 11.96 10.47 8.07 8.54 11.85n-UNDEKANE 8.46 11.12 8.47 8.66 9.69 2.18 5.66 8.15
31.4 30.6SUM (%) = > 22.6 22.4 22.9 22.9 22.5 24.4
ULTIPLICATOR = > 4.43.2
4.5 4.4 4.4 ' 4.4 4.13.3
Concentrations of the main toxic substances found in the work environment in five plants manufacturing paint and lacquer products are presented in Table 4. The table specifies the values for: substance concentration geometric mean, its percentage in total exposure and coefficient of additive exposure (calculated as sum of fraction of respective OEL values). The data for the whole population of the measurement results in all five plants, supplemented with geometric (GM) and arithmetic mean (AM) values are also presented in the table. The detection limit of the analytical method was 0.04 mg/m3 for each of the analysed substances. However, concentrations lower than 0.05 mg/m3 were reported as “0” in the table, to simplify the presentation.
Synthetic data for the total exposure in the individual plants are given in Table 5. D ata in Table 5 were calculated as sums of quotients of concentrations of individual compounds by respective OEL values. Geometric and arithmetic means from all time weighted average concentrations are presented as well as maximum and minimum values determined in particular plants.
D ata on total exposure to organic solvents of different occupational groups or during different work tasks are presented in Table 6.

84 W. Wesołowski and J.P. Gromiec
n 179
179
179
104
104
179
179
179
179
179
179
179
104
179
179
179
104
179 7
GM
% 0.6 0.4
0.3 0.2 0.2 0.2 1.7 0.1 0.2 1.3 0.1 0.3 0.2 0.2 5.8
2.4
0.5 0.2 0.4
mg/
m3
0.2 0.1 0.1 0.1 0.1 0.1 0.5 0.0 0.1 0.4 0.0 0.1 0.1 0.1 1.7
0.7 0.2 0.1 0.1
All
shop
s
MIN
A
M
mg/
m3
mg/
m3
0.0
0.3
0.0
0.7
0.0 0.
2
0.0 0.
20.0
0.1
0.0 0.
20.0
7.
40.0
0.1
0.0
0.5
0.0
1.5
0.0 0.
0
0.0 0.
20.0
0.1
0.0
0.4
0.0
4.7
0.0
3.1
0.0
0.4
0.0 0.
1
0.0
3.8
MA
X
mg/
m3
3.9
27.7 5.3
4.2 0.6 2.9
182
0,5
21.8
29.1 0.0 2.9
0.9
14.7
88.2 127
4.5
0.9
25.7
5
GM
ng/m
3 %
0.2 0.
80.2
0.8
0.1 0.
2
nd nd
nd nd
0.1
0.3
5.8
19.7
0.0 0.
1
0.1
0.3
1.4
4.7
0.0 0.
1
0.1
0.4
0.0 0.
1
0.0 0.
01.4
4.
60.6
1.
90.0
nd
0.1 0.
2
nd nd
% i
0.2 0.1 0.2 0.1 0.1 0.1 0.1 0.1 0.1 0.2 0.1 0.1 0.1 0.2 11.6 4.7
0.7 0.2 nd
4
GM
ng/m
3
0.1 0.0 0.1 0.1 0.0 0.0 0.1 0.0 0.1 0.1 0.0 0.1 0.1 0.1 5.2
2.1 0.3
0.1 nd
%
i
0.5
0.3
0.5 0.6 0.2 0.2' 2.2 0.2 0.2 1.0 0.2 0.5 0.2 2.7
7.9
3.7
0.5
0.3
nd
3
GM
mg/
m3
0.1 0.1 0.1 0.2 0.1 0.0 0.6 0.0 0.1 0.3 0.0 0.1 0.0 0.7 2.0 1.0 0.1 0.1 nd
% :
1.1 0.4 0.8 0.4
0.5
0.3 0.2 0.3
0.4 2.6 0.2 0.6 0.3
0.4
2.4
0.4
0.5
0.3 0.6
2
GM
mg/
m3
0.2 0.1 0.2 0.1 0.1 0.1 0.0 0.1 0.1 0.5 0.0 0.1 0.1 0.1 0.5 0.1 0.1 0.1 0.1
% :
0.2 0.2 0.2 0.1 0.1 0.1 0.1 0.1 0.1 0.1 0.1 0.1 0.1 0.1 3.8
3.0 0.2 0.1 nd
1
GM
mg/
m3
0.1 0.1 0.2 0.0 0.1 0.1 0.0 0.0 0.1 0.1 0.0 0.1 0.1 0.1 2.8 2.3 0.1 0.0 nd
-1 -5 -1 -0 -0 -3 -6 -3 -1 -3 -2 -5 -5 -1 -3 -4 -9 -6 -6
\S -56-
-17-
-64-
-63-
-66-
-93-
-78-
-54-
-83-
-36-
-43-
-80-
-82-
-10-
-88-
-86-
-65-
-49-
-65-
Ci
67-
64-
67-
67-
109- 78
-14
1 -
110- 78
-71
-71
-
110-
142-
108-
108-
123-
111-
110-
108-
Pain
t an
d la
cque
r sh
op
= >
No
Nam
e
1 M
etha
nol
2 E
than
ol3
Ace
tne
4 Is
opro
pano
l (2
-pro
-pa
nol)
5 n-
Pent
ane
6 M
ethy
l et
hyl
keto
ne(2
-But
anon
e)7
Ethy
l ac
etat
e8
n-H
exan
e9
Isob
utan
ol(2
-Met
hyl-
l-Pr
opa-
nol)
10 n-
But
anol
11 B
enze
ne12
2-E
thox
yeth
anol
(Cel
loso
lve)
13 n-
Hep
tane
14 Is
obut
yl
met
hyl
keto
ne
(4-M
ethy
l-2-
-pen
tan)
15 T
olue
ne16
n-B
utyl
ac
etat
e17
n-O
ctan
e18
2-M
etho
xyet
hyl
ace
tate
(Met
hylc
ello
-so
lve
19 2-
Met
hoxy
prop
ylac
etat
e (D
ovan
ol)
Tabl
e 4.
Solv
ent
vapo
ur
conc
entra
tion
mea
sure
d in
pain
t sh
ops

Exposure in Polish paint and lacquer industry 85
% —
perc
ent
of all
m
easu
rem
ents
GM
—
Geo
met
ric
mea
n nd
— no
t de
term
inat
ed
AM
— A
rithe
met
ic
mea
n
179
179
179 6
179
179
179
104
179
104
179
104
179
179
179
179
179
104
104
104
179
179
179
10.9
23.6 0.4
1.3 0.6 1.0 0.9 2.0 3.2
2.4 2.1 1.9
4.1 1.4 1.2 0.4 0.8 0.6 0.2 0.3
16.6
15.2
3.2
11.2 0.1 0.4 0.2 0.3
0.3 0.6 0.9
0.7 0.6 0.6 1.2 0.4
0.4 0.1 0.2 0.2 0.1 0.1 4.9
4.5
0.47
7.0
21.6 0.3 1.7
0.5 1.1 0.5 1.5 2.6 2.0 1.4
1.4 3.2
1.7 1.0 0.3
0.5 1.0 0.4 0.2 11.9
16.9 0.65
0.1 0.4 0.0 0.0 0.0 0.0 0.0 0.0 0.0 0.0 0.0 0.0 0.0 0.0 0.0 0.0 0.0 0.0 0.0 0.0 0.2 0.15 0.1
95.1
314.
1
16.3 5.3
6.9
16.4 5.3
14.3
40.1
18.8
17.7
13.8
54.3
35.6
16.4 5.4
8.9
17.1
11.4 3.9
174
274
4.94
8.4
25.1 0.3
nd 0.3 0.6 0.4
0.7 1.9 1.3
0.9
0.5
2.4 0.8 0.8 0.2 0.7
0.5
nd nd 12.7 8.0
2.5
11.4 0.1 nd 0.1 0.2 0.1 0.2 0.6 0.4
0.3 0.1 0.7 0.2 0.2 0.1 0.2 0.1 nd nd 3.7
2.4
0.43
6.6 15.6 0.3
nd 0.8 2.2 0.6 1.4
2.9 1.8 2.2 1.7
4.1
2.9
1.4
0.4 0.6 1.3 0.2 0.3
16.7
33.4
2.9
10.4 0.1 nd 0.3 1.0 0.3 0.6 1.3 0.8 1.0 0.7 1.8 1.3 0.6 0.2 0.3 0.6 0.1 0.1 7.4
14.9 0.61
11.6
21.2 0.4
nd 0.9
1.3 0.8 1.1 1.4 1.2 1.2 0.8 2.1 2.1 1.2 0.6 0.9
0.7
0.3
0.5
11.5
22.5
3.0 8.2 0.1 nd 0.2 0.3 0.2 0.3
0.4
0.3
0.3 0.2 0.5 0.6 0.3 0.2 0.2 0.2 0.1 0.1 3.0
5.8
0.47
11.8
21.1 1.3 2.1 1.4
1.9
0.7 1.1 1.2 1.2 1.5
1.4 2.1 2.3 1.6 0.4 0.6 0.6 0.3
0.3
12.0
26.8
2.2 6.0 0.3
0.4
0.3
0.4 0.1 0.2 0.2 0.2 0.3
0.3
0.4
0.4
0.3 0.1 0.1 0.1 0.1 0.1 2.3
5.1
0.34
14.4
20.3 0.1 nd 0.5 0.6 1.5
3.4
7.9
4.5
3.2
2.7 8.8 0.8 1.4
0.5 0.6 0.1 0.0 0.1 33
.5 7.8
10.7
25.9 0.1 nd 0.4
0.5 1.1 2.5
5.9
3.4
2.4 2.0 6.6 0.6 1.1 0.4
0.4 0.1 0.0 0.0 25
.0 5.8
0.77
-4 -7 -9 -5 -2 -2 -8 -1 -4 -8 -8 -3 -6 -5 -8 -5 -5 -4 -2 -7
-41-
-20-
-15-
-42-
-76-
-84-
-82-
-65-
-14-
-96-
-67-
-14-
-63-
-18-
-73-
-93-
-05-
-21-
-93-
-53-
Ethy
lobe
nzen
e 10
0-m
,o,p
-Xyl
en
1330
-2-
Etho
xyet
hyl
acet
ate
(Cel
loso
lve
acet
ate)
11
1-St
yren
e(V
inyl
benz
ene)
10
0-2-
But
oxye
than
ol(B
utyl
gl
ycol
) 11
1-n-
Non
ane
111-
Isop
ropy
lben
zene
(Cum
ene)
•
98 -
n-Pr
opyl
benz
ene
103
-3-
Ethy
ltolu
ene
620-
4-Et
hylto
luen
e 62
2 -
1,3,
5-T
rim
ethy
lben
-ze
ne
(Mes
ityle
ne)
108-
2-Et
hylto
luen
e 61
1 -
1,2,4-
T ri
met
hylb
en-
zene
(P
seud
ocum
ene)
95
-n-
Dec
ane
124-
1,2,3
-T
rim
ethy
lben
-ze
ne
(Hem
ellit
ol)
526
-1,
3-D
ieth
ylbe
nzen
e 14
1 -
1,4-
Die
thyl
benz
ene
105
-n-
Und
ecan
e 11
20-
1,2,
4,5-
Tet
ram
ethy
l-be
nzen
e (D
uren
e)
95 -
1,2,
3,5-
Tet
ram
ethy
l-be
nzen
e (I
zodu
rene
) 52
7 -
Aro
mat
ic
hydr
ocar
-bo
ns
C-9
Whi
te
spir
it
Tota
l ex
posu
re
20 21 22 23 24 25 26 27 28 29 30 31 32 33 34 35 36 37 38 39 40 41 43

86 W. Wesołowski and J.P. Gromiec
Table 5. Mean exposure to sum of organic solvents* during all operations in five Polish lacquer and paint plants (by ascending geometric mean)
Number of ship Max Min AM GM n
2 0.82 0.10 0.49 0.34 235 1.63 0.12 0.53 0.43 753 2.51 0.10 0.69 0.47 264 4.94 0.12 1.00 0.61 271 1.89 0.32 0.86 0.77 28
All shops: 4.94 0.1 0.65 0.47 179
G M — Geometric mean AM — Arithmetic mean
* — calculated as the sum of the quotient of invidual component concentrations by corresponding values
Table 6. Values of total exposure to chemicals measured during different work tasks
Occupational groups Max Min AM GM n
Resin synthesis workers 0.90 0.11 0.31 0.26 14Foremen 1.28 0.10 0.49 0.33 11D ry components mixer workers 1.60 0.13 0.53 0.43 19Packers of final products 3.50 0.11 0.64 0.47 65Laboratory workers 0.99 0.19 0.54 ..0.48 11Mill operators 3.22 0.20 0.78 0.58 35Colorists 1.63 0.31 0.77 0.69 13
DISCUSSIONMeasurements for exposure evaluation were m ade in five plants, typical for the
paint and lacquer industry in Poland. The plants and operations varied in the advancement of manufacturing techniques. The measurements were performed during a relatively short test period, from April to October, during the most intense operation of the plants due to increased demand for their products. The use of the same analytical instruments and methods as well as the performance of chrom atographic analysis of all collected air samples under identical conditions with an automatic sampler and the same standard mixtures facilitated the comparison of the results, without any doubt as to their compatibility. Possible analytical errors are identical for samples collected in each of the plants. Therefore, the comparison procedure and the comparison of the results itself, with all the measurement data population remain unaffected.
As shown in Table 4, workers in all 5 plants were exposed to as many as almost 40 organic solvents, the most significant exposure may be attributed to ethylbenzene, xylenes and C-9 aromatic hydrocarbons (trimethylbenzenes, ethyltoluenes). Since all of the determined solvents exhibit similar toxicological effects (narcotic action), the counting of additive effects as the sum of quotients of concentrations and corresponding OEL values is justified. Additive exposure values (Tables 4 and 5) indicate that geometric means (calculated from all individual time weighted average concentrations) fall below 1 in all 5 plants. The coefficients of additive exposure in the modern plants (No 2 and No 5) are lower than the average for all test plants.

Exposure in Polish paint and lacquer industry 87
In plant No 1, where production equipment is outdated and production space limited, the results are poorest in terms of exposure.
Where the job function is concerned (Table 6), employees of the resin synthesis department belong to the group of the lowest occupational exposure to organic solvent vapours. The highest exposure levels were detected in the colorists and mill operators and this is inherently associated with their job. Quite surprising is high exposure of the laboratory workers and packers of final products, which can be explained only by their reluctance to observe fundamental health and safety rules.
Excessive exposure (coefficient of total exposure to organic solvent vapours exceeding 1) was found in 13.4% of workers, the highest percentage (25%) being determined in plant No 1.
The observation of working conditions in the plants resulted in a conclusion that skin absorption of solvents should be rather excluded as a possible route of entry. It should be, however, confirmed by biological monitoring although only limited number of quantitative exposure tests for all organic solvents used is available.
In Poland paints and lacquers are produced in 12 plants employing about 5,200 workers, 50% of them being exposed to organic solvents. The results of measurements in 5 plants employing 1,700 workers (over 1,000 exposed to solvents) may therefore be considered as representative for the paint and lacquer industry in Poland.
CONCLUSIONSOn the basis of the measurement results from 5 plants, representative for the
paint and lacquer industry in Poland, the following conclusions can be drawn:1. Approximately 40 organic solvents were identified in the workroom atm o
sphere;2. Among identified solvents ethylbenzene, xylenes and C-9 aromatic hydrocar
bons were predominant;3. Similar toxicological effects of identified substances justify the calculation of
coefficients of total workers’ exposure to organic solvent vapours. The geometric mean exposure to organic solvents, calculated from individual exposure data in all5 plants, was 0.47;
4. Significant differences resulting from varied advancement of the employed manufacturing techniques were detected between the individual plants;
5. About 13.4% of workers were employed under conditions of excessive exposure, the most exposed groups being colorists and dispensor operators;
6. The complexity of solvents in the paint and lacquer industry indicates the necessity to use gas chromatography with mass detection for qualitative and quantitative assessment of work environment;
7. Although dermal exposure to organic solvents seemed to be not significant, biological monitoring of workers in paint and lacquer producing plants is recommended.
A CKNOW LEDGEM ENTS
This study was performed under the Project No SPR II.4.1. “Evaluation of credilibity of occupational exposure data”.

88 W. Wesołowski and J.P. Gromiec
REFERENCES
1. Angerer J, Lichterbeck E, Begerow J et al. Occupational chronic exposure to organic solvents. XIII. Glycolether exposure during the production of varnishes. Int Arch Occup Environ Health 2: 123 —126, 1990.
2. Angerer J, Wulf H. Occupational exposure to organic solvents. XI. Alkylbenzene exposure of varnish workers: effects on hematopoetic system. Int Arch Occup Environ Health 11: 307 — 321, 1985.
3. Ford DP, Schwarts BS, Powell S et al. Quantitative approach to the characterisation of cumulative and average solvent exposure in paint manufacturing plants. Am Ind Hyg Assoc J 6: 226 — 234, 1991
4. Krom hout H, Oostendorp Y, Heederik D, Boleij JSM. Agreement between qualitative exposure estimates and quantitative exposure measurement. Am J Ind Med 5: 551 — 562, 1987.
5. de-Medinilla J, Espigares M. Contamination by organic solvents in auto paint shops. Ann Occup Hyg 4: 509-513 , 1988.
6. Michalik-Rabek J. Periodontal disease in workers of the paint and lacquer industry. Zahn M und Kieferheilkunde 7: 688-698 , 1978.
7. PN-89/Z-04008.07 (Polish Standard). Air purity protection. Air sampling. Principles of air sample collection in work environment and interpretation of results, 1989 (in Polish).
8. Vongrungsemon P. Industrial Hygiene Report in Depth Survey of Paint Print Process. Inc. 438 Q. NIOSH, Division of Surveillance, Hazard Evaluation and Field Studies, Industrial wide Studies Branch, Industrial Hygiene Section, Cincinnati, Ohio, 1980.
9. WT-93 MZRiP/50. Solvent naphta, 1993 (in Polish).
Received for publication: May 8, 1996Approved for publication: January 6, 1997