occupational injuries and illnesses in osha region...
TRANSCRIPT
Occupational Injuries and Illnesses in OSHA Region 10:
Safety and Health Surveillance Indicators 2000-2005
University of Washington Department of Environmental and Occupational Health Sciences
Northwest Center for Occupational Health and Safety
Bert Stover, PhD., Noah Seixas, PhD.
In collaboration with NIOSH Supported in part by NIOSH grant number 5 T42 OH008433
March 2009
Region 10: Safety and Health Surveillance Indicators 2000-2005 2
Occupational Injuries and Illnesses in OSHA Region 10:
Safety and Health Surveillance Indicators 2000-2005 Abstract
The burden of work-related injury and illness is large and persistent in the United States. Unlike
surveillance systems for work-related fatalities, accurate systems for monitoring work-related
injury and illness have not been implemented. The Council of State and Territorial
Epidemiologists (CSTE), in collaboration with NIOSH, support state-based surveillance efforts
to address this need. This report describes Occupational Health Indicators data for Alaska, Idaho,
Oregon, and Washington. Indicators data are presented as defined by CSTE / NIOSH in
Occupational Health Indicators: A Guide for Tracking Occupational Health Conditions and
Their Determinants. When data as defined by CSTE were unavailable, alternative information
sources are used for some indicators. Nine indicators could not be completed for Idaho, and two
for Alaska, following the CSTE guidelines. Eight indicators showed a decline in trends from
2000 to 2005, while 11 indicators did not indicate a clear change.
Region 10: Safety and Health Surveillance Indicators 2000-2005 3
Table of Contents Background..................................................................................................................................... 4 Methods........................................................................................................................................... 6 Employment Demographics Profiles .............................................................................................. 8
P1. Percentage of Civilian Workforce Unemployed.................................................................................................8 P2. Percentage of Civilian Employment Self-Employed ..........................................................................................9 P3. Percentage of Civilian Employment Employed Part-Time.................................................................................9 P4. Percentage of Civilian Employment by Number of Hours Worked .................................................................10 P5. Percentage of Civilian Employment by Sex .....................................................................................................11 P6. Percentage of Civilian Employment by Age Group .........................................................................................11 P7. Percentage of Civilian Employment by Race ...................................................................................................12 P8. Percentage of Civilian Employment by Hispanic Origin..................................................................................13 P9. Percentage of Civilian Employment by Industry..............................................................................................14 P10. Percentage of Civilian Employment by Occupation.......................................................................................15
Occupational Health and Safety Indicators................................................................................... 16 1. Non-fatal Work-Related Injuries and Illnesses Reported by Employers ............................................................16 2. Work-Related Hospitalization.............................................................................................................................18 3. Fatal Work-Related Injuries................................................................................................................................19 4. Work-Related Amputations with Days Away From Work Reported by Employers ..........................................20 5. State Workers' Compensation Claims for Amputations with Lost Work-Time..................................................21 6. Hospitalization for Work-Related Burns ............................................................................................................22 7. Work-Related Musculoskeletal Disorders with Days Away from Work Reported by Employers .....................23 8. Carpal Tunnel Syndrome Cases Filed with the State Workers' Compensation Systems Involving Days Away from Work ..............................................................................................................................................................26 9. Hospitalization from or with Pneumoconiosis ....................................................................................................28 10. Mortality from or with Pneumoconiosis ...........................................................................................................29 11. Acute Work-Related Pesticide-Associated Illness and Injury Reported To Poison Control Centers ...............30 12. Incidence of Malignant Mesothelioma..............................................................................................................31 13. Elevated Blood Lead Levels Among Adults.....................................................................................................32 14. Percentage of Workers Employed In Industries at High Risk for Occupational Morbidity..............................33 15. Percentage of Workers Employed in Occupations at High Risk for Occupational Morbidity..........................34 16. Percentage of Workers in Industries and Occupations at High Risk for Occupational Mortality.....................34 17. Occupational Safety and Health Professionals .................................................................................................36 18. OSHA Enforcement Activities..........................................................................................................................39 19. Workers' Compensation Awards.......................................................................................................................40
Discussion..................................................................................................................................... 41 Abbreviations:............................................................................................................................... 45 References..................................................................................................................................... 46 Appendix Data Tables................................................................................................................... 47
Table 1 Employment Demographic Profile, Unemployment, Part Time Employment, Sex, Age .....................47 Table 2 Employment Demographic Profile, Age, Race, Ethnicity.....................................................................48 Table 3 Employment Demographic Profile, Industry ........................................................................................49 Table 4 Employment Demographic Profile, Occupation ...................................................................................50 Table 5 Injuries and Illnesses.............................................................................................................................51 Table 6 Amputations, Burns ..............................................................................................................................52 Table 7 Musculoskeletal Disorders, Carpal Tunnel Syndrome..........................................................................53 Table 8 Pneumoconiosis ....................................................................................................................................54 Table 9 Pesticide Poisonings, Malignant Mesothelioma, Blood Lead Levels....................................................55 Table 10 High Risk Industries and Occupations ................................................................................................56 Table 11 Occupational Safety and Health Professionals....................................................................................57 Table 12 OSHA Enforcement, Workers’ Compensation Awards......................................................................58
Region 10: Safety and Health Surveillance Indicators 2000-2005 4
Background
The burden of workplace injury and illness is substantial, resulting in work disability for 10% of
the U.S. population at any time 1. Additionally, 2.7 million disabling work-related injuries
qualified for workers’ compensation indemnity benefits in 1992 2. A first step in addressing
occupational injury and illness through the public health model is problem identification and
prioritization through surveillance 3, 4. A comprehensive occupational injury and illness
surveillance program is essential to develop and evaluate prevention interventions, to guide
policy, to set research agendas, to provide accurate statistics for public education, and to estimate
demand for health and safety professionals and training. Due to the lack of adequate work-
related injury and illness data at the national level, a state-based system is encouraged to build
infrastructure. The National Institute for Occupational Safety and Health (NIOSH) has developed
a strategic plan for surveillance, which aims to strengthen state surveillance efforts 4, 5.
Accurate estimates of occupational injuries and illnesses are needed to stimulate prevention
efforts and to further the Occupational Safety and Health Administration’s (OSHA) mandate to
ensure a safe and healthy working environment. Tracking occupational injury and illness rates
has been a goal of NIOSH since its inception in 1970 and is a current National Occupational
Research Agenda (NORA) priority 6. However, occupational injury and illness surveillance
systems remain inadequate, even though 36 years have passed since NIOSH’s inception.. It is
generally accepted that many workplace injuries and illnesses are not reported or are outside the
scope of Bureau of Labor Statistics (BLS) Survey of Occupational Injury and Illness (SOII) 7, 8.
NIOSH and the Council of State and Territorial Epidemiologists (CSTE) have developed 19
Occupational Health Indicators (OHI) and a guide to access consistent data for each indicator 9.
The OHIs were developed to provide easier access to state-wide data, to promote the importance
to public health, and to provide guidelines for workplace interventions to improve worker safety
and health. However, some states do not have an established infrastructure for tracking this
information, or they use different methods or coding systems in data collection. Thus, results are
not consistent across states. Despite these difficulties, occupational health indicators can provide
data for trends analysis and comparison of occupational health and risk status. They can also help
Region 10: Safety and Health Surveillance Indicators 2000-2005 5
build state surveillance capacity and raise awareness of the burden of occupational injuries and
illnesses. Estimates of other similar indicators are also useful for purposes of assessing the needs
for training safety and health professionals and estimating future staffing demands..
As a needs assessment and planning document, this project provides the Northwest Center for
Occupational Health and Safety an estimation of occupational disease and injury patterns and
available professional services in Region 10 (Alaska, Idaho, Oregon, and Washington).
Additionally, the project builds on methods outlined by NIOSH and CSTE for state level
surveillance efforts. Through NIOSH funded projects, these 19 occupational health indicators
have been reported for Oregon, Washington and several other states. We collected data for
Washington and Oregon from CSTE for 2000-2003 and from OHI researchers for 2004-2005.
We collected information directly from state contacts in Alaska and Idaho, with additional data
obtained from national datasets and from NIOSH for 2000-2005. This information was compiled
into a single dataset to present trends and summary statistics.
Limitations of Key Data Sources CSTE has described many of the important limitations of these data sources in previous reports 9,
and in Putting Data to Work: Occupational Health Indicators from Thirteen Pilot States for 2000 10 (available at http://www.cste.org/pdffiles/newpdffiles/CSTE_OHI.pdf).
BLS SOII
It is generally accepted that the Annual Survey of Occupational Injury and Illness (SOII)
significantly underestimates the actual burden of illness and injury 8. In addition to under-
reporting within its defined scope, the SOII excludes the self-employed, federal employers,
public sector workers, workers on farms with fewer than 11 employees, and others. As a result,
more than 20% of the US workforce is excluded from the SOII 7. Idaho does not participate in
the SOII while the other three states do. However, the Idaho Industrial Commission (IIC) tracks
workers’ compensation claims and we have provided IIC data for indicators using SOII data. The
IIC maintains files on workers’ compensation claims from first report of work-related injury or
illness to claim resolution for cases that involve medical attention or lost work time.
Region 10: Safety and Health Surveillance Indicators 2000-2005 6
Workers’ Compensation
There are several factors that make direct comparison of state workers’ compensation data
inappropriate. These include differences in statute of limitations for claim filing, employer-
assigned or worker-selected initial physician seen, exclusion of industry or occupation (e.g.,
fisherman in Alaska), exclusion of self-insured employers, exclusion by employer size, specific
injury or illness covered by state system, different injury, and illness coding systems (e.g.,
ANSIz-16, OIICS, IAIABC, NCCIs Detailed Claim Information). For example, the length of
time a worker is unable to work before an indemnity claim may be filed varies across states.
Alaska, Oregon, and Washington require three lost work days before a claim for lost wages can
be filed. In comparison, Idaho requires five days. In Idaho, employers designate the initial
physician and referral chain while in the other three states the worker does. There is no exclusion
for minimum employer size for workers’ compensation coverage in Idaho. However, several
types of workers are exempt from coverage in Idaho, including domestic service, casual
employment, employer’s family members, owners, real estate salesmen, and others. Alaska,
Oregon, and Washington have state OSHA programs while Idaho relies on the federal program
to inspect workplaces. The Idaho Industrial Commission tracks all workers’ compensation claims
that include accident details, lost work days, diagnosis, and costs.
Methods For demographic descriptors, counts and rates have been derived from the 19 indicators,
following methods outlined by CSTE where data was available. These data were compiled on a
Microsoft Excel spreadsheet. When specific data sources outlined by CSTE were not available,
methods for using existing data to derive estimates or alternative indicators were developed and
described. For example, information provided by employers in the annual BLS Survey of
Occupational Injury and Illness (SOII) data was not collected for Idaho. Alternative indicators
are presented for indicators (I 1) injury and illnesses with days away from work, (I 4) work-
related amputations with days away from work, and (I 7) work-related musculoskeletal disorders
(MSDs). Details of the data sources and limitations are described with the specific indicator.
We present the data from Washington and Oregon for 2000-2005. Additionally, we use existing
federal and state data resources to determine the 19 Occupational Health Indicators and
demographic profiles of the Idaho and Alaska workforce for 2000-2005 where data are available.
Region 10: Safety and Health Surveillance Indicators 2000-2005 7
Oregon and Washington data for 2000-2003 are from CSTE with clarification from state
representatives. Oregon data for 2004 and 2005 was provided by the Oregon Worker Illness and
Injury Prevention Program, Oregon Public Health Division, Department of Human Services.
Washington data for 2004 and 2005 was provided by the Safety and Health Assessment and
Research for Prevention Program (SHARP) at the Washington State Department of Labor and
Industries.
Data from states, Region 10, and the U.S. are graphed together for efficient display. However,
comparison across states and regions is not supported due to differences in reporting systems and
other factors. Comparison between states, or between regions, should only be done with caution
and with consideration of the many differences in the methods that influence the definition,
diagnosis, and reporting of the indicators.
‘Data Resources’ sections for each indicator are included to describe the methods used, as
presented by the CSTE 9.
Region 10: Safety and Health Surveillance Indicators 2000-2005 8
Employment Demographics Profiles Some variation in injury and illness rates across states can be explained by workforce
characteristics, including age, gender, ethnicity, employment rate as well as other data. Also, the
size of the state population provides information concerning the relative importance of state
trends. Therefore, we first provide some state demographics following the CSTE guidelines.
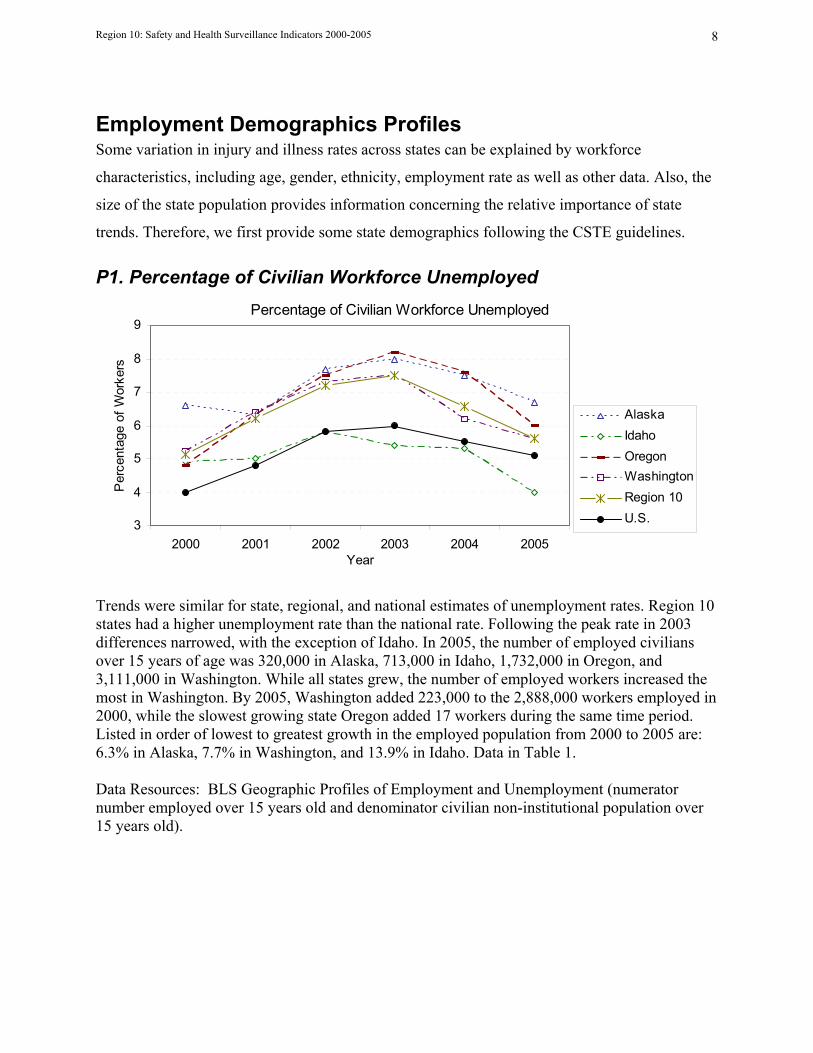
P1. Percentage of Civilian Workforce Unemployed Percentage of Civilian Workforce Unemployed
3
4
5
6
7
8
9
2000 2001 2002 2003 2004 2005Year
Per
cent
age
of W
orke
rs
AlaskaIdahoOregonWashingtonRegion 10U.S.
Trends were similar for state, regional, and national estimates of unemployment rates. Region 10 states had a higher unemployment rate than the national rate. Following the peak rate in 2003 differences narrowed, with the exception of Idaho. In 2005, the number of employed civilians over 15 years of age was 320,000 in Alaska, 713,000 in Idaho, 1,732,000 in Oregon, and 3,111,000 in Washington. While all states grew, the number of employed workers increased the most in Washington. By 2005, Washington added 223,000 to the 2,888,000 workers employed in 2000, while the slowest growing state Oregon added 17 workers during the same time period. Listed in order of lowest to greatest growth in the employed population from 2000 to 2005 are: 6.3% in Alaska, 7.7% in Washington, and 13.9% in Idaho. Data in Table 1. Data Resources: BLS Geographic Profiles of Employment and Unemployment (numerator number employed over 15 years old and denominator civilian non-institutional population over 15 years old).
Region 10: Safety and Health Surveillance Indicators 2000-2005 9
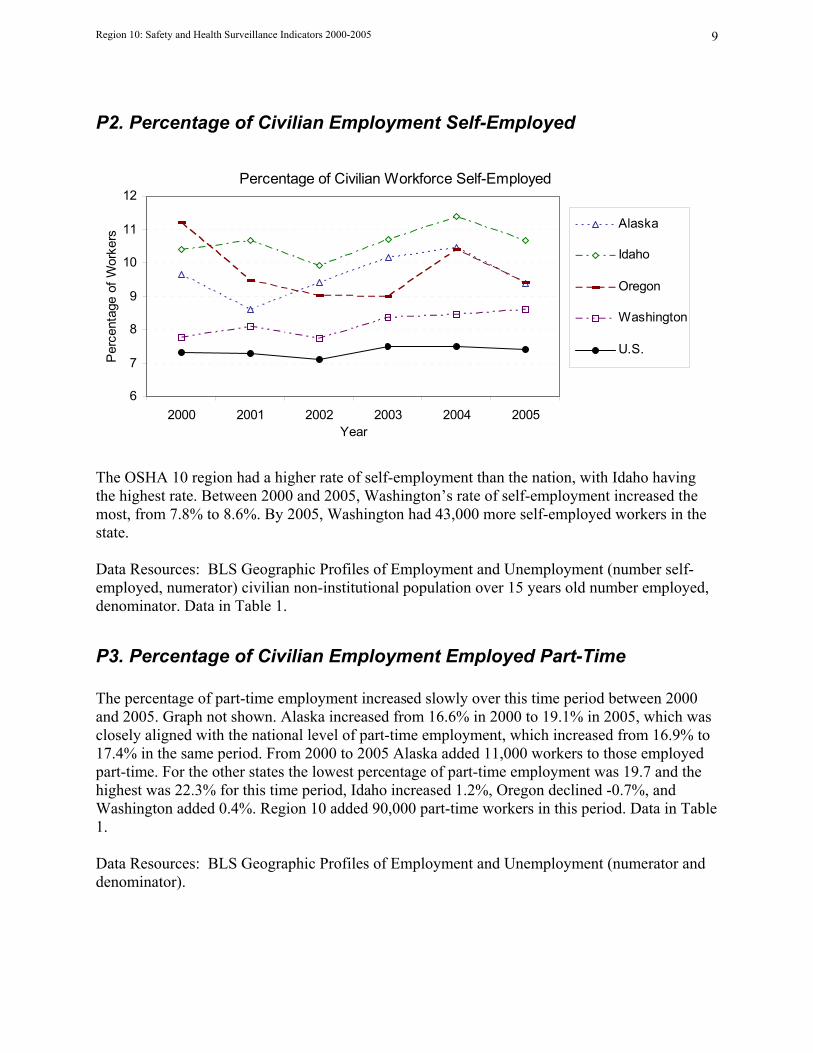
P2. Percentage of Civilian Employment Self-Employed
Percentage of Civilian Workforce Self-Employed
6
7
8
9
10
11
12
2000 2001 2002 2003 2004 2005Year
Per
cent
age
of W
orke
rs
Alaska
Idaho
Oregon
Washington
U.S.
The OSHA 10 region had a higher rate of self-employment than the nation, with Idaho having the highest rate. Between 2000 and 2005, Washington’s rate of self-employment increased the most, from 7.8% to 8.6%. By 2005, Washington had 43,000 more self-employed workers in the state. Data Resources: BLS Geographic Profiles of Employment and Unemployment (number self-employed, numerator) civilian non-institutional population over 15 years old number employed, denominator. Data in Table 1.
P3. Percentage of Civilian Employment Employed Part-Time The percentage of part-time employment increased slowly over this time period between 2000 and 2005. Graph not shown. Alaska increased from 16.6% in 2000 to 19.1% in 2005, which was closely aligned with the national level of part-time employment, which increased from 16.9% to 17.4% in the same period. From 2000 to 2005 Alaska added 11,000 workers to those employed part-time. For the other states the lowest percentage of part-time employment was 19.7 and the highest was 22.3% for this time period, Idaho increased 1.2%, Oregon declined -0.7%, and Washington added 0.4%. Region 10 added 90,000 part-time workers in this period. Data in Table 1. Data Resources: BLS Geographic Profiles of Employment and Unemployment (numerator and denominator).
Region 10: Safety and Health Surveillance Indicators 2000-2005 10
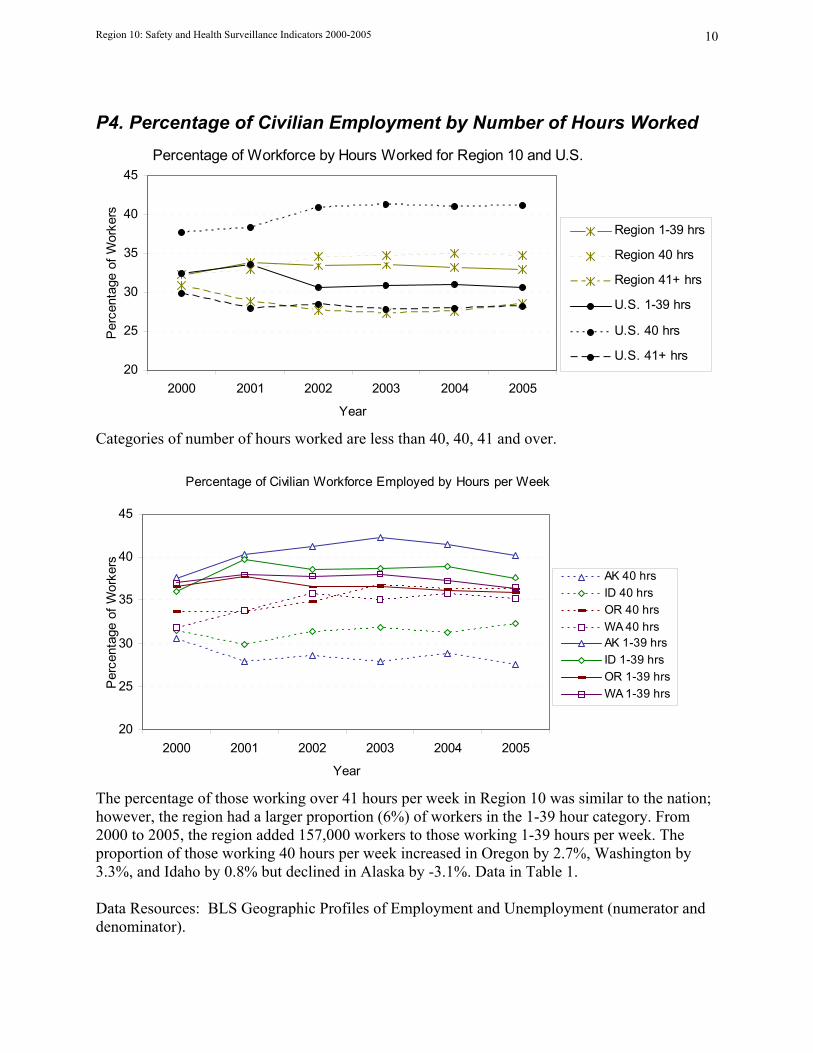
P4. Percentage of Civilian Employment by Number of Hours Worked Percentage of Workforce by Hours Worked for Region 10 and U.S.
20
25
30
35
40
45
2000 2001 2002 2003 2004 2005
Year
Per
cent
age
of W
orke
rs
Region 1-39 hrs
Region 40 hrs
Region 41+ hrs
U.S. 1-39 hrs
U.S. 40 hrs
U.S. 41+ hrs
Categories of number of hours worked are less than 40, 40, 41 and over.
Percentage of Civilian Workforce Employed by Hours per Week
20
25
30
35
40
45
2000 2001 2002 2003 2004 2005
Year
Per
cent
age
of W
orke
rs
AK 40 hrsID 40 hrsOR 40 hrsWA 40 hrsAK 1-39 hrsID 1-39 hrsOR 1-39 hrsWA 1-39 hrs
The percentage of those working over 41 hours per week in Region 10 was similar to the nation; however, the region had a larger proportion (6%) of workers in the 1-39 hour category. From 2000 to 2005, the region added 157,000 workers to those working 1-39 hours per week. The proportion of those working 40 hours per week increased in Oregon by 2.7%, Washington by 3.3%, and Idaho by 0.8% but declined in Alaska by -3.1%. Data in Table 1. Data Resources: BLS Geographic Profiles of Employment and Unemployment (numerator and denominator).
Region 10: Safety and Health Surveillance Indicators 2000-2005 11
P5. Percentage of Civilian Employment by Sex Percent of employment by sex remained relatively steady over this time. Graph not shown. For Region 10, men comprised 53% of the civilian non-institutional working population in 2002 and 54% in 2005. There was also little variation of employment by sex across states with the low in 2003 for men in Alaska (52.5%) and a high in 2000 for men in Idaho (54.5%). Data in Table 1. Data Resources: BLS Geographic Profiles of Employment and Unemployment (numerator and denominator).
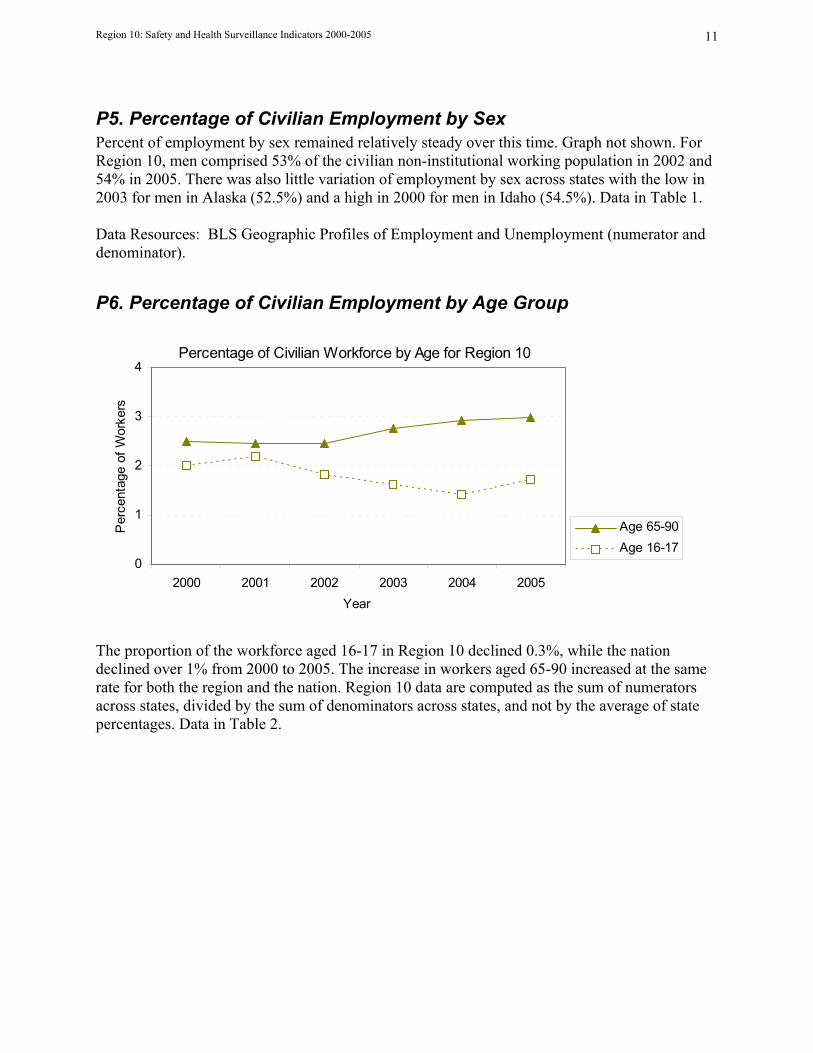
P6. Percentage of Civilian Employment by Age Group
Percentage of Civilian Workforce by Age for Region 10
0
1
2
3
4
2000 2001 2002 2003 2004 2005Year
Per
cent
age
of W
orke
rs
Age 65-90Age 16-17
The proportion of the workforce aged 16-17 in Region 10 declined 0.3%, while the nation declined over 1% from 2000 to 2005. The increase in workers aged 65-90 increased at the same rate for both the region and the nation. Region 10 data are computed as the sum of numerators across states, divided by the sum of denominators across states, and not by the average of state percentages. Data in Table 2.
Region 10: Safety and Health Surveillance Indicators 2000-2005 12
Avarage Age by Year
37
38
39
40
41
42
2000 2001 2002 2003 2004 2005Year
Ave
rage
Age AK
ID
OR
WA
Region 10
US
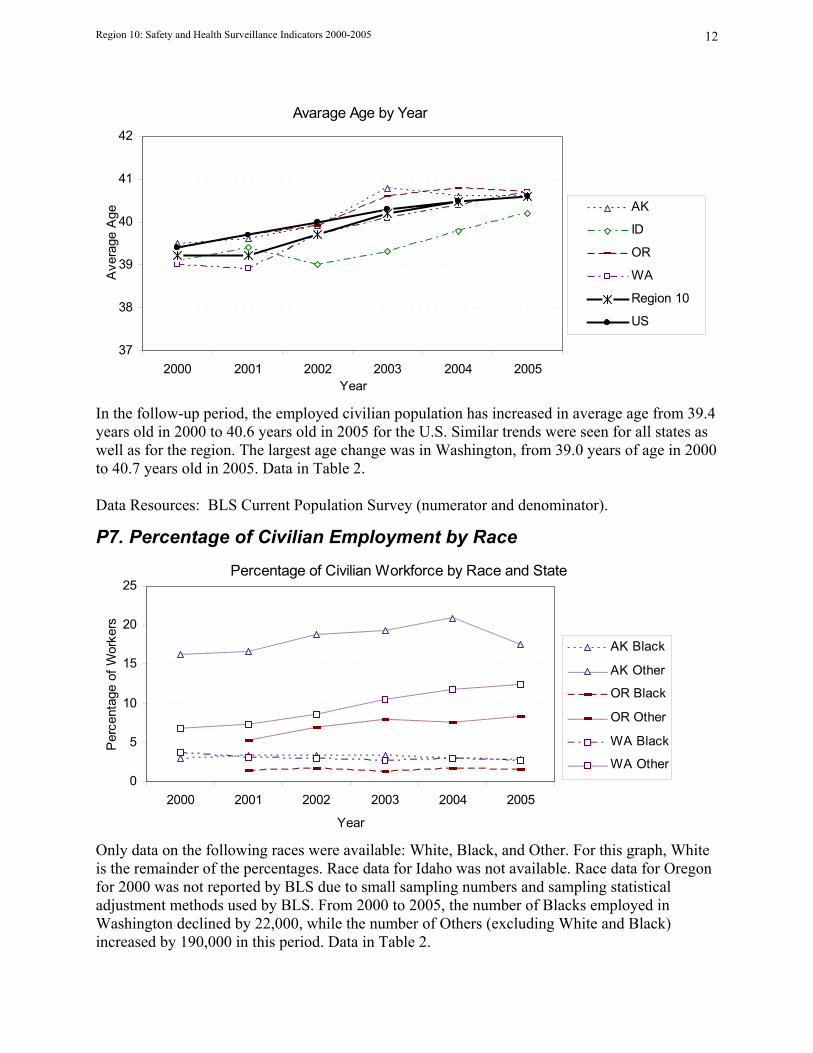
In the follow-up period, the employed civilian population has increased in average age from 39.4 years old in 2000 to 40.6 years old in 2005 for the U.S. Similar trends were seen for all states as well as for the region. The largest age change was in Washington, from 39.0 years of age in 2000 to 40.7 years old in 2005. Data in Table 2. Data Resources: BLS Current Population Survey (numerator and denominator).
P7. Percentage of Civilian Employment by Race
Percentage of Civilian Workforce by Race and State
0
5
10
15
20
25
2000 2001 2002 2003 2004 2005
Year
Per
cent
age
of W
orke
rs
AK Black
AK Other
OR Black
OR Other
WA Black
WA Other
Only data on the following races were available: White, Black, and Other. For this graph, White is the remainder of the percentages. Race data for Idaho was not available. Race data for Oregon for 2000 was not reported by BLS due to small sampling numbers and sampling statistical adjustment methods used by BLS. From 2000 to 2005, the number of Blacks employed in Washington declined by 22,000, while the number of Others (excluding White and Black) increased by 190,000 in this period. Data in Table 2.
Region 10: Safety and Health Surveillance Indicators 2000-2005 13
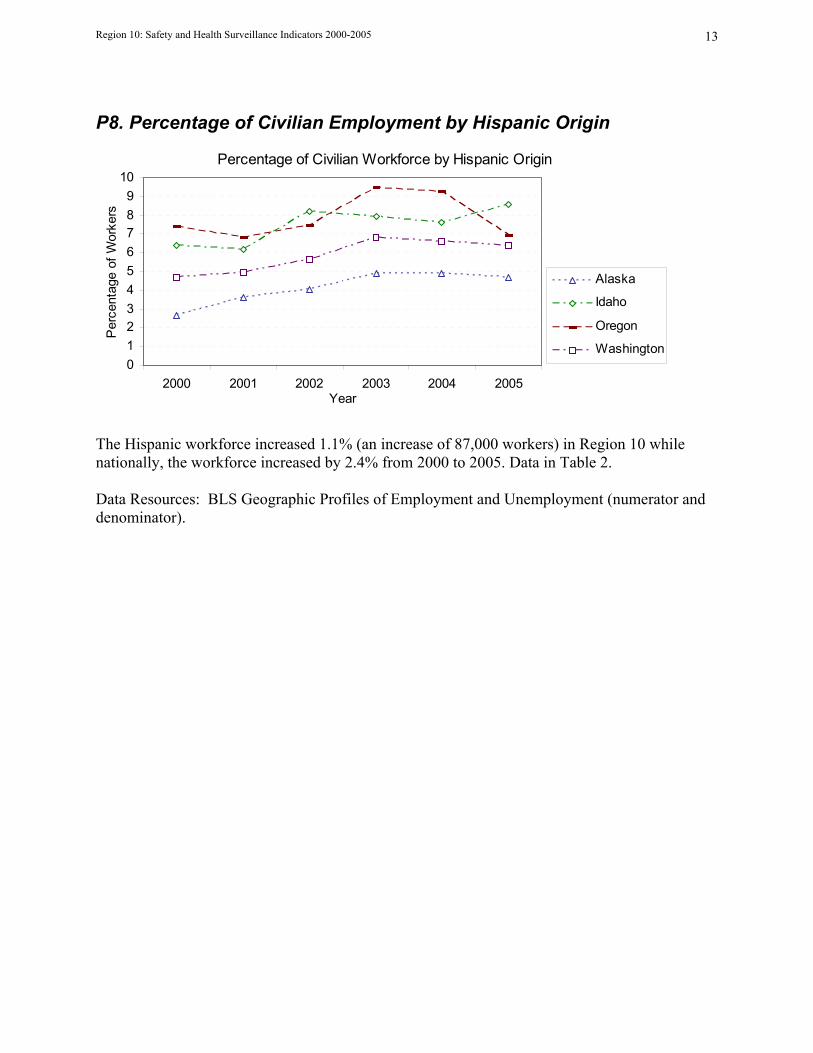
P8. Percentage of Civilian Employment by Hispanic Origin
Percentage of Civilian Workforce by Hispanic Origin
0123456789
10
2000 2001 2002 2003 2004 2005Year
Per
cent
age
of W
orke
rs
Alaska
Idaho
Oregon
Washington
The Hispanic workforce increased 1.1% (an increase of 87,000 workers) in Region 10 while nationally, the workforce increased by 2.4% from 2000 to 2005. Data in Table 2. Data Resources: BLS Geographic Profiles of Employment and Unemployment (numerator and denominator).
Region 10: Safety and Health Surveillance Indicators 2000-2005 14
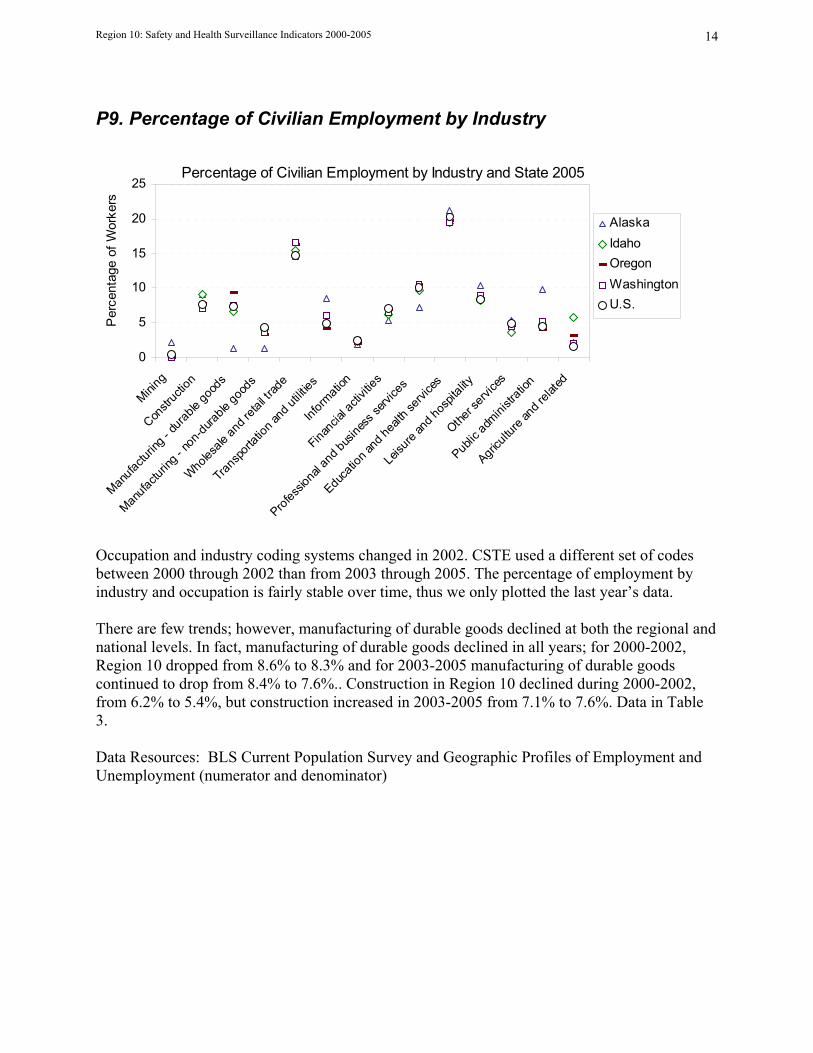
P9. Percentage of Civilian Employment by Industry
Percentage of Civilian Employment by Industry and State 2005
0
5
10
15
20
25
Mining
Constr
uctio
n
Manufa
cturin
g - du
rable
good
s
Manufa
cturin
g - no
n-dura
ble go
ods
Wholes
ale an
d reta
il trad
e
Trans
porta
tion a
nd ut
ilities
Inform
ation
Finan
cial a
ctivit
ies
Profes
siona
l and
busin
ess s
ervice
s
Educa
tion a
nd he
alth s
ervice
s
Leisu
re an
d hos
pitali
ty
Other s
ervice
s
Public
admini
strati
on
Agricu
lture
and r
elated
Per
cent
age
of W
orke
rs
AlaskaIdahoOregonWashingtonU.S.
Occupation and industry coding systems changed in 2002. CSTE used a different set of codes between 2000 through 2002 than from 2003 through 2005. The percentage of employment by industry and occupation is fairly stable over time, thus we only plotted the last year’s data. There are few trends; however, manufacturing of durable goods declined at both the regional and national levels. In fact, manufacturing of durable goods declined in all years; for 2000-2002, Region 10 dropped from 8.6% to 8.3% and for 2003-2005 manufacturing of durable goods continued to drop from 8.4% to 7.6%.. Construction in Region 10 declined during 2000-2002, from 6.2% to 5.4%, but construction increased in 2003-2005 from 7.1% to 7.6%. Data in Table 3. Data Resources: BLS Current Population Survey and Geographic Profiles of Employment and Unemployment (numerator and denominator)
Region 10: Safety and Health Surveillance Indicators 2000-2005 15
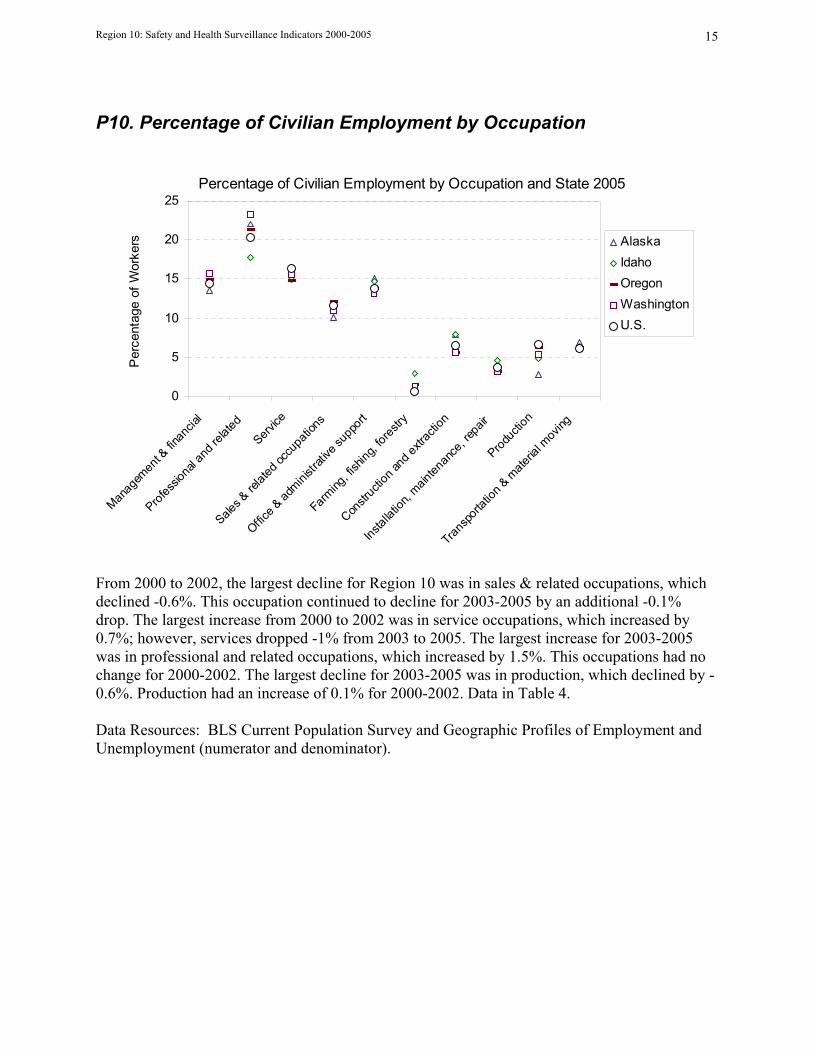
P10. Percentage of Civilian Employment by Occupation
Percentage of Civilian Employment by Occupation and State 2005
0
5
10
15
20
25
Manag
emen
t & fin
ancia
l
Profes
siona
l and
relat
ed
Service
Sales &
relat
ed oc
cupa
tions
Office &
admini
strati
ve su
pport
Farm
ing, fi
shing
, fores
try
Constr
uctio
n and
extra
ction
Instal
lation
, main
tenan
ce, re
pair
Produc
tion
Trans
porta
tion &
mate
rial m
oving
Per
cent
age
of W
orke
rs AlaskaIdahoOregonWashingtonU.S.
From 2000 to 2002, the largest decline for Region 10 was in sales & related occupations, which declined -0.6%. This occupation continued to decline for 2003-2005 by an additional -0.1% drop. The largest increase from 2000 to 2002 was in service occupations, which increased by 0.7%; however, services dropped -1% from 2003 to 2005. The largest increase for 2003-2005 was in professional and related occupations, which increased by 1.5%. This occupations had no change for 2000-2002. The largest decline for 2003-2005 was in production, which declined by -0.6%. Production had an increase of 0.1% for 2000-2002. Data in Table 4. Data Resources: BLS Current Population Survey and Geographic Profiles of Employment and Unemployment (numerator and denominator).
Region 10: Safety and Health Surveillance Indicators 2000-2005 16
Occupational Health and Safety Indicators
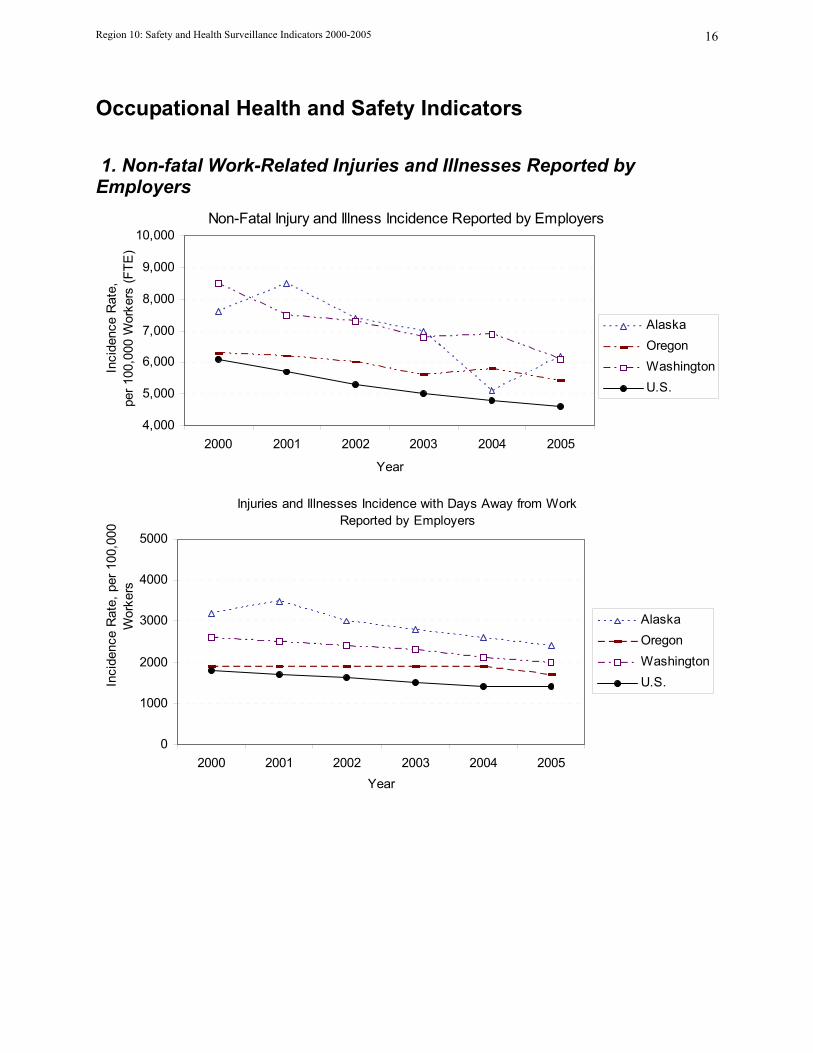
1. Non-fatal Work-Related Injuries and Illnesses Reported by Employers
Non-Fatal Injury and Illness Incidence Reported by Employers
4,000
5,000
6,000
7,000
8,000
9,000
10,000
2000 2001 2002 2003 2004 2005
Year
Inci
denc
e R
ate,
pe
r 100
,000
Wor
kers
(FTE
)
AlaskaOregonWashingtonU.S.
Injuries and Illnesses Incidence with Days Away from Work
Reported by Employers
0
1000
2000
3000
4000
5000
2000 2001 2002 2003 2004 2005Year
Inci
denc
e R
ate,
per
100
,000
W
orke
rs
AlaskaOregonWashingtonU.S.
Region 10: Safety and Health Surveillance Indicators 2000-2005 17
01,0002,0003,0004,0005,0006,0007,0008,0009,000
10,000
2000 2001 2002 2003 2004 2005
Year
Rat
e pe
r 100
,000
FTE
s
Rate of Injury and Illness Rate Involving Days Aw ay from Work
Non-Fatal Work Related Injury and Illness, Idaho Industrial Commission
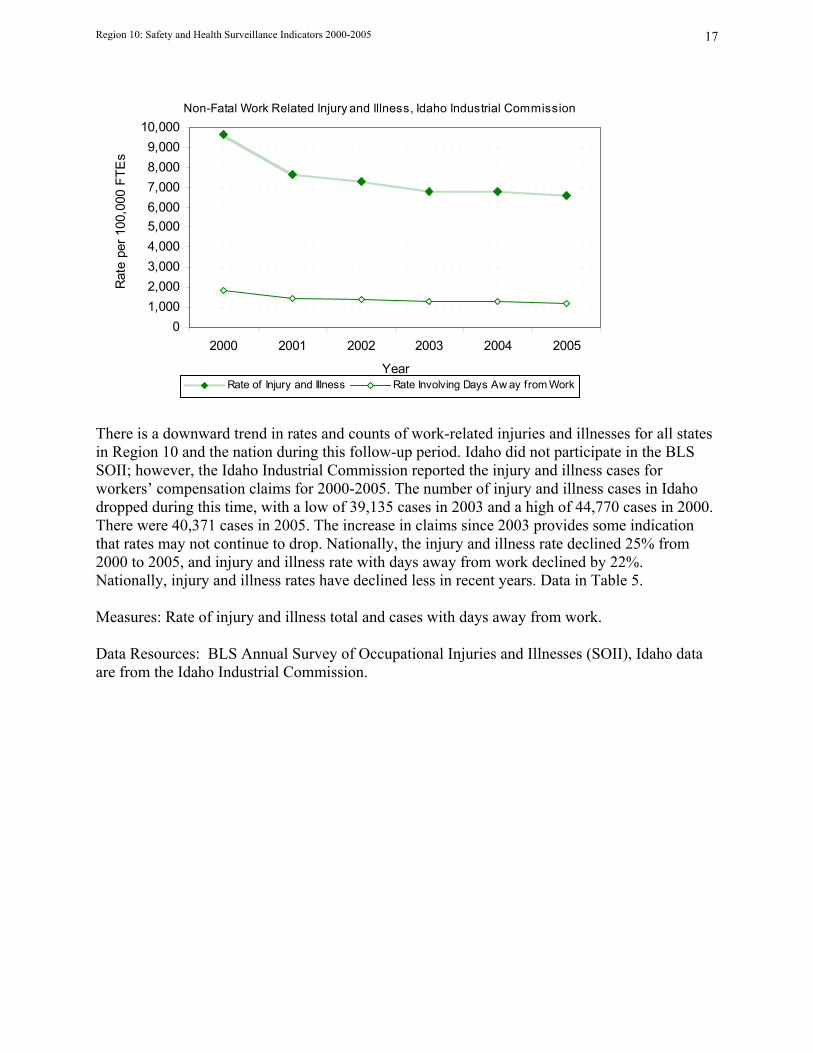
There is a downward trend in rates and counts of work-related injuries and illnesses for all states in Region 10 and the nation during this follow-up period. Idaho did not participate in the BLS SOII; however, the Idaho Industrial Commission reported the injury and illness cases for workers’ compensation claims for 2000-2005. The number of injury and illness cases in Idaho dropped during this time, with a low of 39,135 cases in 2003 and a high of 44,770 cases in 2000. There were 40,371 cases in 2005. The increase in claims since 2003 provides some indication that rates may not continue to drop. Nationally, the injury and illness rate declined 25% from 2000 to 2005, and injury and illness rate with days away from work declined by 22%. Nationally, injury and illness rates have declined less in recent years. Data in Table 5. Measures: Rate of injury and illness total and cases with days away from work. Data Resources: BLS Annual Survey of Occupational Injuries and Illnesses (SOII), Idaho data are from the Idaho Industrial Commission.
Region 10: Safety and Health Surveillance Indicators 2000-2005 18
2. Work-Related Hospitalization
Work-Related Hospitalization Incidence for Injury and Illness
0
50
100
150
200
250
2000 2001 2002 2003 2004 2005Year
Rat
e pe
r 100
,000
Wor
kers
Alaska
Oregon
Washington
U.S.
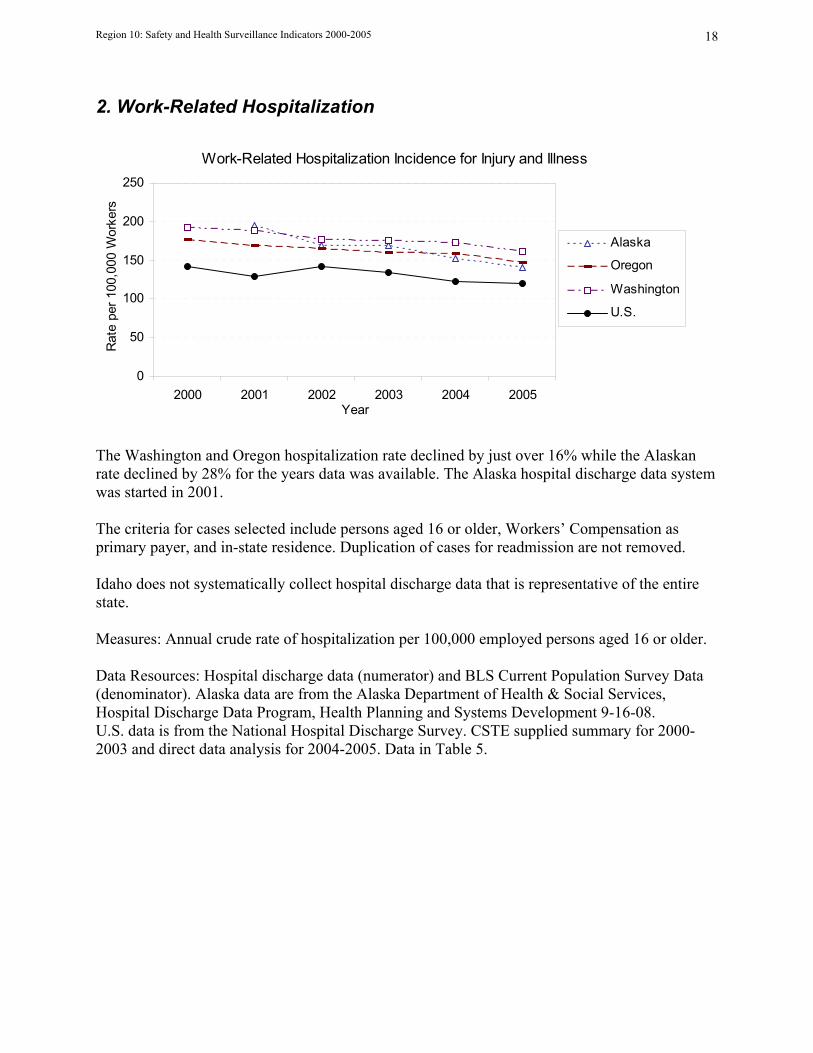
The Washington and Oregon hospitalization rate declined by just over 16% while the Alaskan rate declined by 28% for the years data was available. The Alaska hospital discharge data system was started in 2001. The criteria for cases selected include persons aged 16 or older, Workers’ Compensation as primary payer, and in-state residence. Duplication of cases for readmission are not removed. Idaho does not systematically collect hospital discharge data that is representative of the entire state. Measures: Annual crude rate of hospitalization per 100,000 employed persons aged 16 or older. Data Resources: Hospital discharge data (numerator) and BLS Current Population Survey Data (denominator). Alaska data are from the Alaska Department of Health & Social Services, Hospital Discharge Data Program, Health Planning and Systems Development 9-16-08. U.S. data is from the National Hospital Discharge Survey. CSTE supplied summary for 2000-2003 and direct data analysis for 2004-2005. Data in Table 5.
Region 10: Safety and Health Surveillance Indicators 2000-2005 19
3. Fatal Work-Related Injuries
Annual Work-Related Injury Fatality Rate
02468
10121416182022
2000 2001 2002 2003 2004 2005Year
Fata
lity
Rat
e pe
r 100
,000
w
orke
rs
AlaskaIdahoOregon
WashingtonU.S.
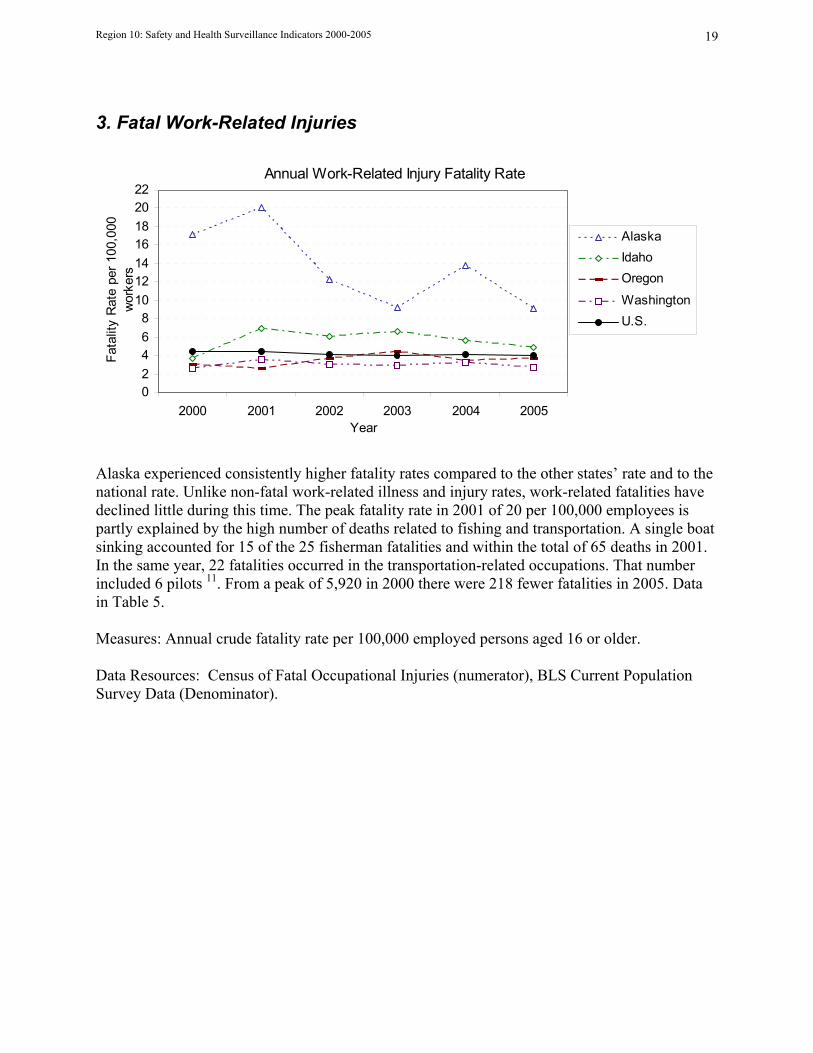
Alaska experienced consistently higher fatality rates compared to the other states’ rate and to the national rate. Unlike non-fatal work-related illness and injury rates, work-related fatalities have declined little during this time. The peak fatality rate in 2001 of 20 per 100,000 employees is partly explained by the high number of deaths related to fishing and transportation. A single boat sinking accounted for 15 of the 25 fisherman fatalities and within the total of 65 deaths in 2001. In the same year, 22 fatalities occurred in the transportation-related occupations. That number included 6 pilots 11. From a peak of 5,920 in 2000 there were 218 fewer fatalities in 2005. Data in Table 5. Measures: Annual crude fatality rate per 100,000 employed persons aged 16 or older. Data Resources: Census of Fatal Occupational Injuries (numerator), BLS Current Population Survey Data (Denominator).
Region 10: Safety and Health Surveillance Indicators 2000-2005 20
4. Work-Related Amputations with Days Away From Work Reported by Employers
Amputations Involving Days Away from Work
02468
10121416182022
2000 2001 2002 2003 2004 2005Year
Inci
denc
e R
ate
per 1
00,0
00
wor
kers
Alaska
Oregon
Washington
U.S.
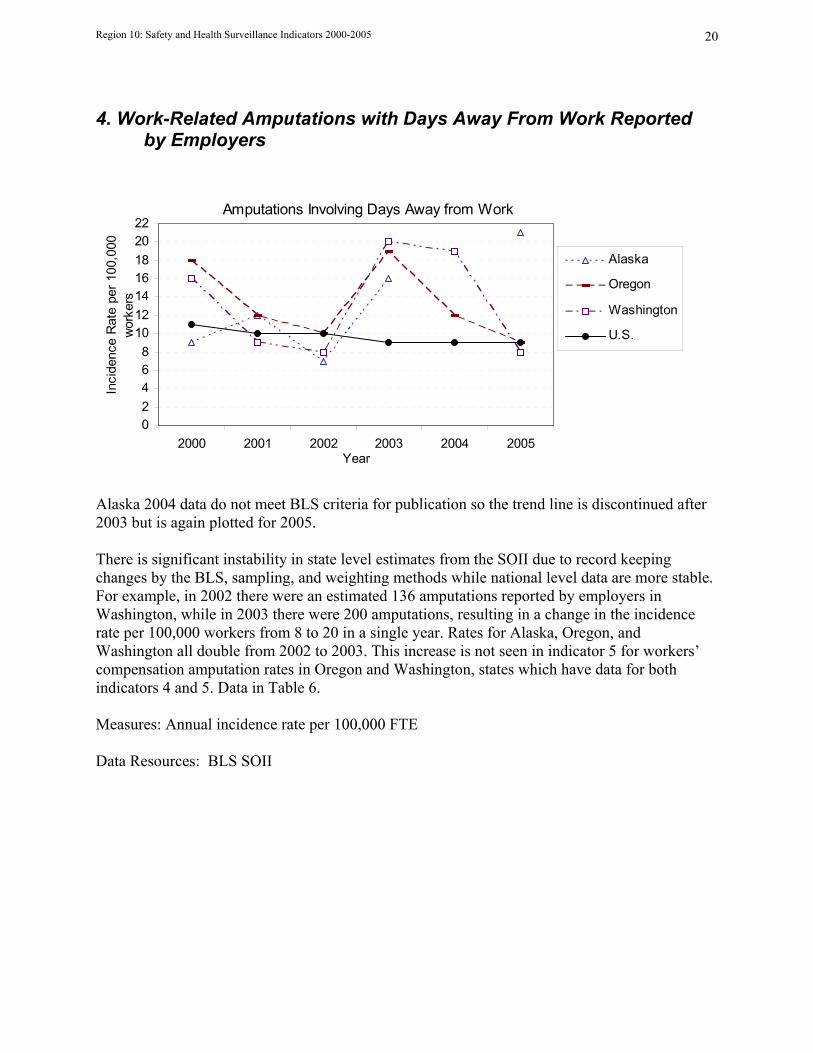
Alaska 2004 data do not meet BLS criteria for publication so the trend line is discontinued after 2003 but is again plotted for 2005. There is significant instability in state level estimates from the SOII due to record keeping changes by the BLS, sampling, and weighting methods while national level data are more stable. For example, in 2002 there were an estimated 136 amputations reported by employers in Washington, while in 2003 there were 200 amputations, resulting in a change in the incidence rate per 100,000 workers from 8 to 20 in a single year. Rates for Alaska, Oregon, and Washington all double from 2002 to 2003. This increase is not seen in indicator 5 for workers’ compensation amputation rates in Oregon and Washington, states which have data for both indicators 4 and 5. Data in Table 6. Measures: Annual incidence rate per 100,000 FTE Data Resources: BLS SOII
Region 10: Safety and Health Surveillance Indicators 2000-2005 21
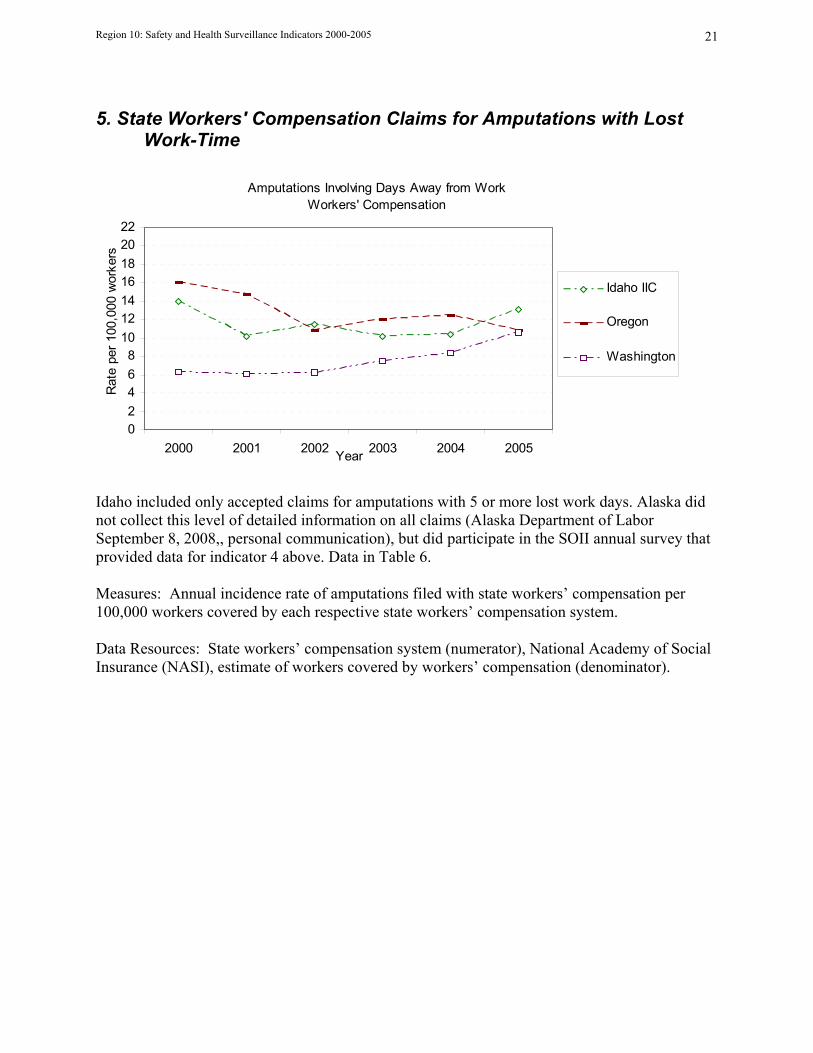
5. State Workers' Compensation Claims for Amputations with Lost Work-Time
Amputations Involving Days Away from Work
Workers' Compensation
02468
10121416182022
2000 2001 2002 2003 2004 2005Year
Rat
e pe
r 100
,000
wor
kers
Idaho IIC
Oregon
Washington
Idaho included only accepted claims for amputations with 5 or more lost work days. Alaska did not collect this level of detailed information on all claims (Alaska Department of Labor September 8, 2008,, personal communication), but did participate in the SOII annual survey that provided data for indicator 4 above. Data in Table 6. Measures: Annual incidence rate of amputations filed with state workers’ compensation per 100,000 workers covered by each respective state workers’ compensation system. Data Resources: State workers’ compensation system (numerator), National Academy of Social Insurance (NASI), estimate of workers covered by workers’ compensation (denominator).
Region 10: Safety and Health Surveillance Indicators 2000-2005 22
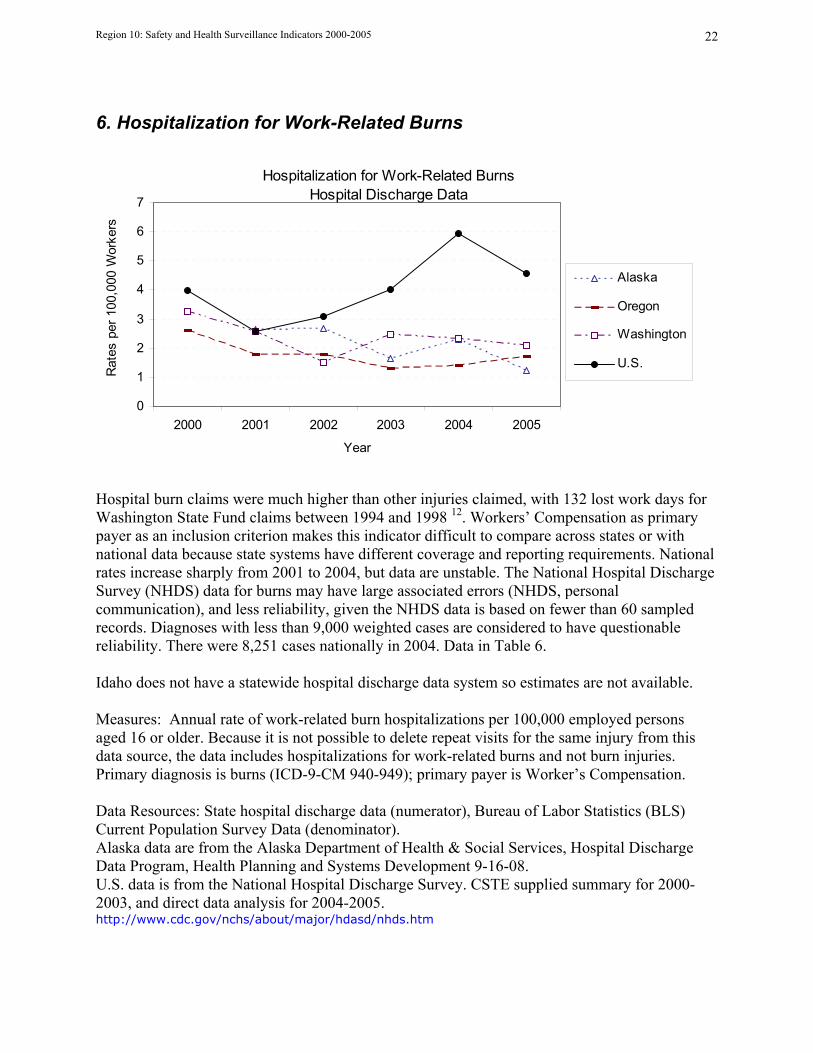
6. Hospitalization for Work-Related Burns
Hospitalization for Work-Related Burns Hospital Discharge Data
0
1
2
3
4
5
6
7
2000 2001 2002 2003 2004 2005
Year
Rat
es p
er 1
00,0
00 W
orke
rs
Alaska
Oregon
Washington
U.S.
Hospital burn claims were much higher than other injuries claimed, with 132 lost work days for Washington State Fund claims between 1994 and 1998 12. Workers’ Compensation as primary payer as an inclusion criterion makes this indicator difficult to compare across states or with national data because state systems have different coverage and reporting requirements. National rates increase sharply from 2001 to 2004, but data are unstable. The National Hospital Discharge Survey (NHDS) data for burns may have large associated errors (NHDS, personal communication), and less reliability, given the NHDS data is based on fewer than 60 sampled records. Diagnoses with less than 9,000 weighted cases are considered to have questionable reliability. There were 8,251 cases nationally in 2004. Data in Table 6. Idaho does not have a statewide hospital discharge data system so estimates are not available. Measures: Annual rate of work-related burn hospitalizations per 100,000 employed persons aged 16 or older. Because it is not possible to delete repeat visits for the same injury from this data source, the data includes hospitalizations for work-related burns and not burn injuries. Primary diagnosis is burns (ICD-9-CM 940-949); primary payer is Worker’s Compensation. Data Resources: State hospital discharge data (numerator), Bureau of Labor Statistics (BLS) Current Population Survey Data (denominator). Alaska data are from the Alaska Department of Health & Social Services, Hospital Discharge Data Program, Health Planning and Systems Development 9-16-08. U.S. data is from the National Hospital Discharge Survey. CSTE supplied summary for 2000-2003, and direct data analysis for 2004-2005. http://www.cdc.gov/nchs/about/major/hdasd/nhds.htm
Region 10: Safety and Health Surveillance Indicators 2000-2005 23
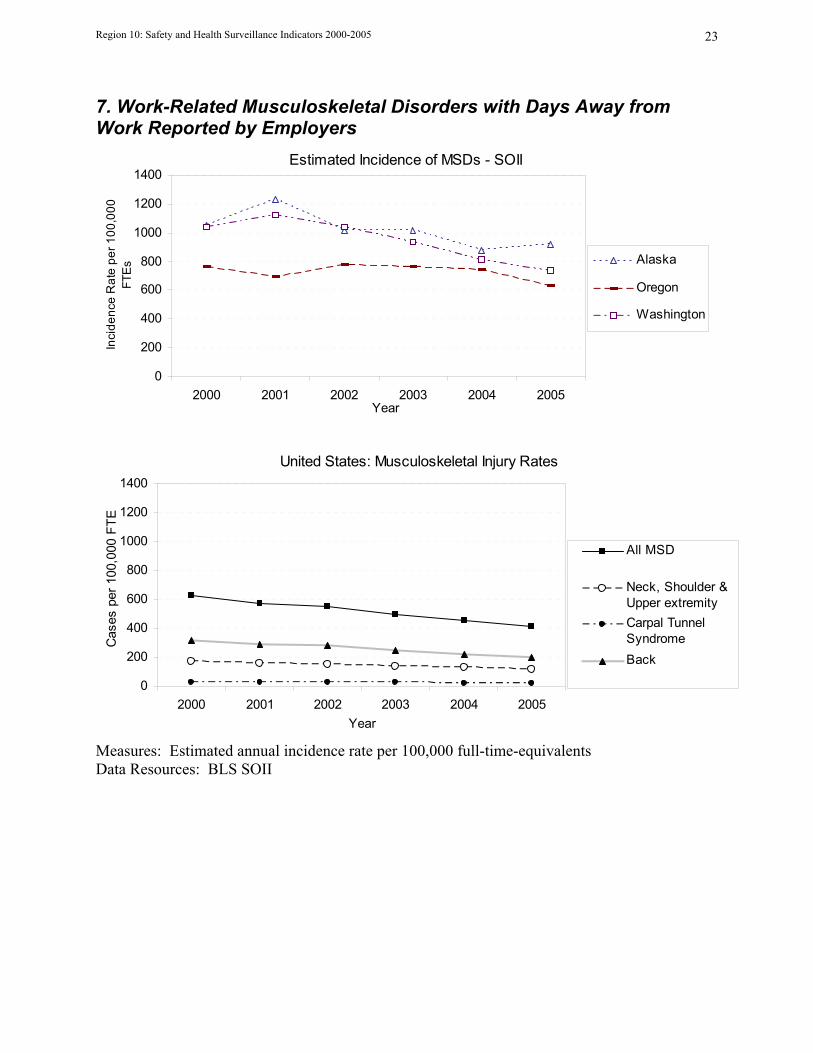
7. Work-Related Musculoskeletal Disorders with Days Away from Work Reported by Employers
Estimated Incidence of MSDs - SOII
0
200
400
600
800
1000
1200
1400
2000 2001 2002 2003 2004 2005Year
Inci
denc
e R
ate
per 1
00,0
00
FTE
s Alaska
Oregon
Washington
United States: Musculoskeletal Injury Rates
0
200
400
600
800
1000
1200
1400
2000 2001 2002 2003 2004 2005Year
Cas
es p
er 1
00,0
00 F
TE
All MSD
Neck, Shoulder &Upper extremityCarpal TunnelSyndromeBack
Measures: Estimated annual incidence rate per 100,000 full-time-equivalents Data Resources: BLS SOII
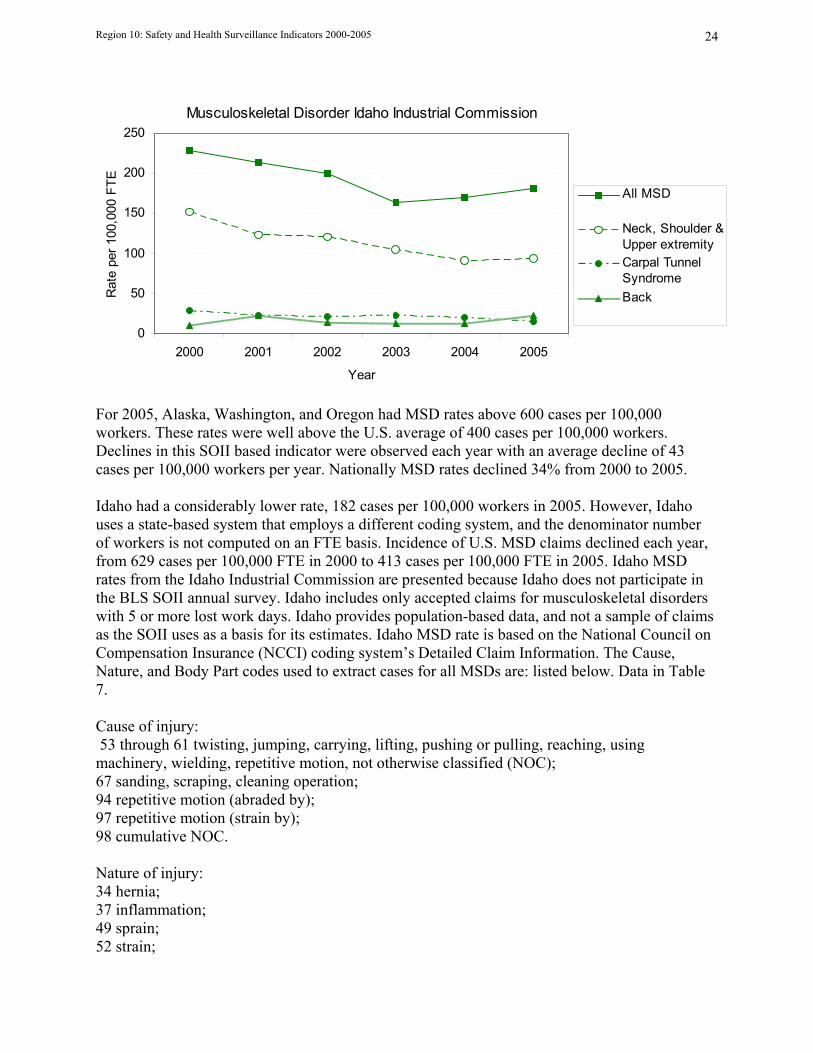
Region 10: Safety and Health Surveillance Indicators 2000-2005 24
Musculoskeletal Disorder Idaho Industrial Commission
0
50
100
150
200
250
2000 2001 2002 2003 2004 2005
Year
Rat
e pe
r 100
,000
FTE
All MSD
Neck, Shoulder &Upper extremityCarpal TunnelSyndromeBack
For 2005, Alaska, Washington, and Oregon had MSD rates above 600 cases per 100,000 workers. These rates were well above the U.S. average of 400 cases per 100,000 workers. Declines in this SOII based indicator were observed each year with an average decline of 43 cases per 100,000 workers per year. Nationally MSD rates declined 34% from 2000 to 2005. Idaho had a considerably lower rate, 182 cases per 100,000 workers in 2005. However, Idaho uses a state-based system that employs a different coding system, and the denominator number of workers is not computed on an FTE basis. Incidence of U.S. MSD claims declined each year, from 629 cases per 100,000 FTE in 2000 to 413 cases per 100,000 FTE in 2005. Idaho MSD rates from the Idaho Industrial Commission are presented because Idaho does not participate in the BLS SOII annual survey. Idaho includes only accepted claims for musculoskeletal disorders with 5 or more lost work days. Idaho provides population-based data, and not a sample of claims as the SOII uses as a basis for its estimates. Idaho MSD rate is based on the National Council on Compensation Insurance (NCCI) coding system’s Detailed Claim Information. The Cause, Nature, and Body Part codes used to extract cases for all MSDs are: listed below. Data in Table 7. Cause of injury: 53 through 61 twisting, jumping, carrying, lifting, pushing or pulling, reaching, using machinery, wielding, repetitive motion, not otherwise classified (NOC); 67 sanding, scraping, cleaning operation; 94 repetitive motion (abraded by); 97 repetitive motion (strain by); 98 cumulative NOC. Nature of injury: 34 hernia; 37 inflammation; 49 sprain; 52 strain;

Region 10: Safety and Health Surveillance Indicators 2000-2005 25
76 video display terminal-related diseases; 78 carpal tunnel syndrome (CTS); 80 all other cumulative injuries NOC. Part of body: 25 soft tissue (neck); 30 through 39 upper extremities; 40 through 42upper and lower back; 50 through 56 lower extremities. For extracting claims for neck, shoulder, and upper extremity, cause and nature codes above were used along with the part of body affected, which is 25 soft tissue (neck); and 30 through 39 upper extremities. For extracting claims for Back, cause and nature codes above were used along with the part of body: 40 through 42 upper and lower back.
Region 10: Safety and Health Surveillance Indicators 2000-2005 26
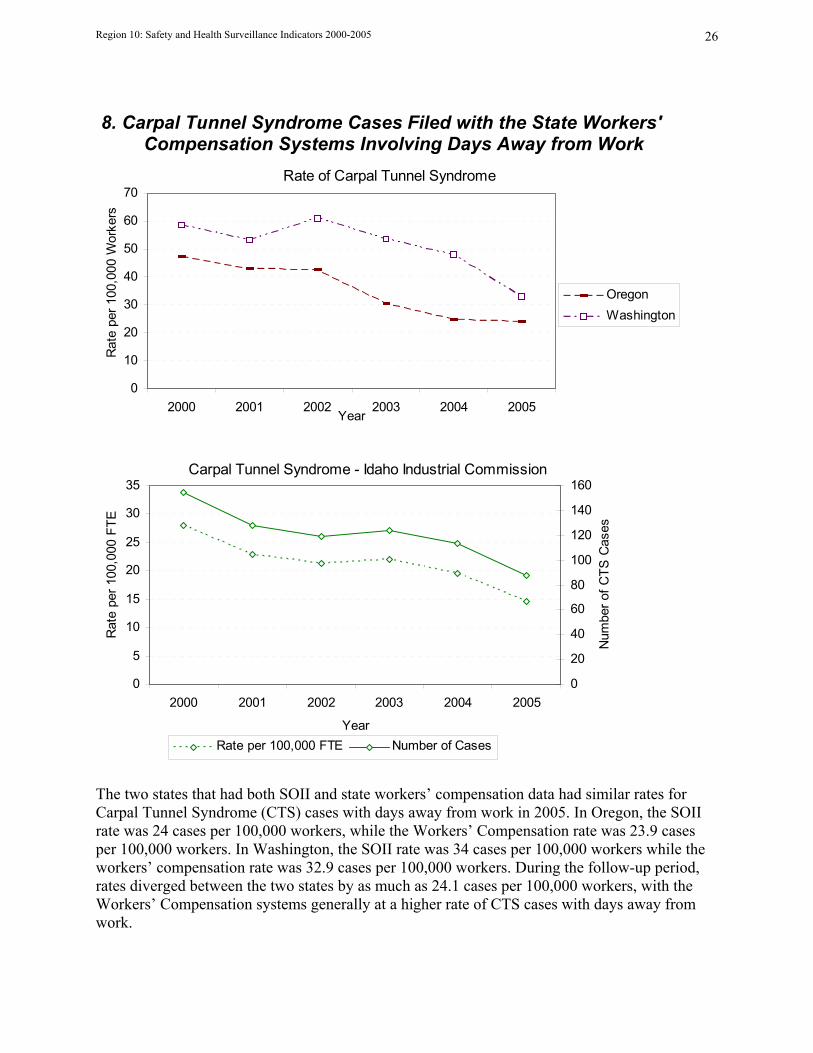
8. Carpal Tunnel Syndrome Cases Filed with the State Workers' Compensation Systems Involving Days Away from Work
Rate of Carpal Tunnel Syndrome
0
10
20
30
40
50
60
70
2000 2001 2002 2003 2004 2005Year
Rat
e pe
r 100
,000
Wor
kers
OregonWashington
Carpal Tunnel Syndrome - Idaho Industrial Commission
0
5
10
15
20
25
30
35
2000 2001 2002 2003 2004 2005
Year
Rat
e pe
r 100
,000
FTE
0
20
40
60
80
100
120
140
160
Num
ber o
f CTS
Cas
es
Rate per 100,000 FTE Number of Cases
The two states that had both SOII and state workers’ compensation data had similar rates for Carpal Tunnel Syndrome (CTS) cases with days away from work in 2005. In Oregon, the SOII rate was 24 cases per 100,000 workers, while the Workers’ Compensation rate was 23.9 cases per 100,000 workers. In Washington, the SOII rate was 34 cases per 100,000 workers while the workers’ compensation rate was 32.9 cases per 100,000 workers. During the follow-up period, rates diverged between the two states by as much as 24.1 cases per 100,000 workers, with the Workers’ Compensation systems generally at a higher rate of CTS cases with days away from work.
Region 10: Safety and Health Surveillance Indicators 2000-2005 27
Alaska Workers’ Compensation data were not tracked with sufficient detail to report this indicator, so we provide rates for MSDs categories as estimated by SOII. Idaho is not an OSHA “State Plan” state, but the Idaho Industrial Commission provided rates for this indicator. In Idaho, the number of cases was reported by IIC (numerator). CTS cases were identified using Detailed Claim Information code of 78 carpal tunnel syndrome from the National Council on Compensation Insurance (NCCI). The count includes only accepted time-loss claims. All ages and out-of-state residents are included. Data in Table 7. Measures: Annual incidence rate and number of cases of carpal tunnel syndrome filed with state workers’ compensation per 100,000 workers covered by state workers’ compensation system. Data Resources: state Workers’ compensation system (numerator) National Academy of Social Insurance (NASI) estimate of workers covered by workers' compensation (denominator).
Region 10: Safety and Health Surveillance Indicators 2000-2005 28
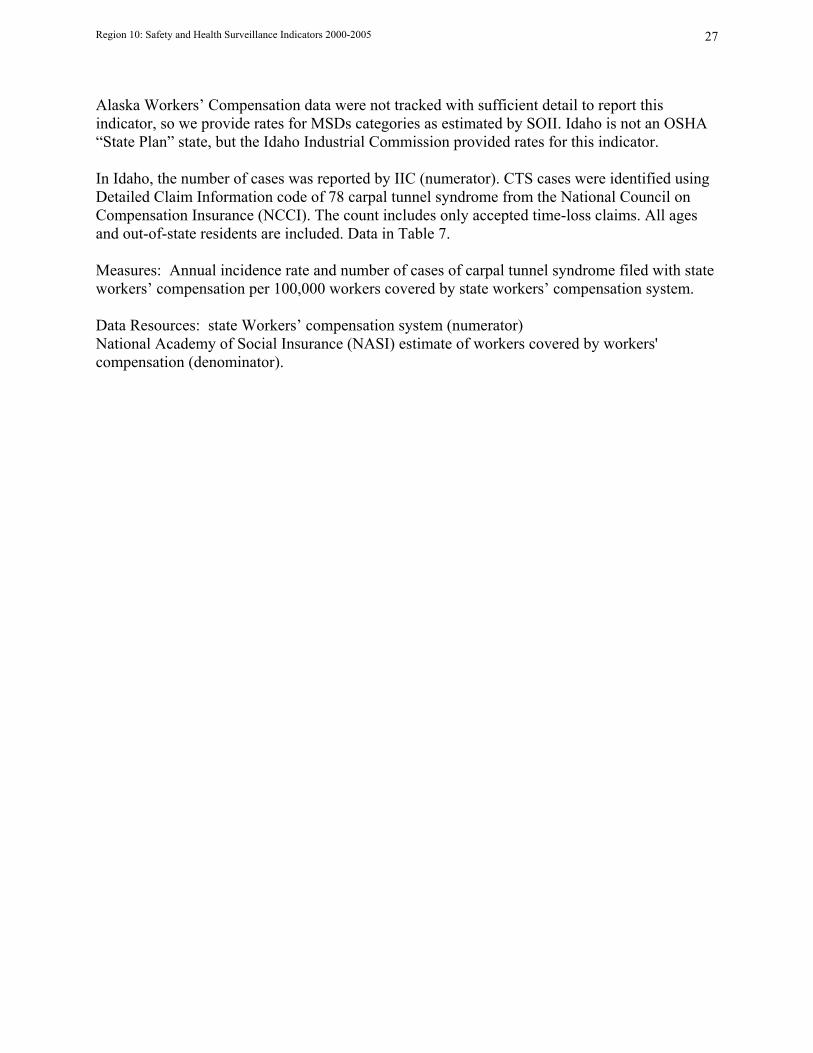
9. Hospitalization from or with Pneumoconiosis
Pneumoconiosis Hospitalizations, Hospital Discharge Data
0
20
40
60
80
100
120
140
160
180
2000 2001 2002 2003 2004 2005Year
Age
Sta
ndar
rdiz
ed R
ate
per
Mill
ion
Res
iden
ts
AlaskaOregonWashingtonU.S.
Asbestosis Hospitalizations, Hospital Discharge Data
020406080
100120140160180
2000 2001 2002 2003 2004 2005Year
Age
Sta
ndar
rdiz
ed R
ate
per
Mill
ion
Res
iden
ts
AlaskaOregonWashingtonU.S.
Alaska data were not available for 2000, and hospital discharge data were not systematically collected statewide in Idaho. The U.S. data were based on the National Hospital Discharge Survey for the numerator and U.S. Census Bureau Population Statistics for rate calculation 10. Pneumoconiosis includes diagnosis of ICD-99-CM of 500 through 505 (including asbestosis); asbestosis is diagnosis 501 only. Data in Table 8. Measures: Annual number of cases, aged 15 and older, age-standardized to U.S. 2000 Standard population, rate of hospitalization per million residents. Data Resources: Hospital discharge data, no exclusions were made for readmissions or deaths (numerator). State population estimates from the U.S. Bureau of the Census (denominator), Year 2000 U.S. Standard population (for age-standardization). Alaska data are from the Alaska Department of Health & Social Services, Hospital Discharge Data Program, Health Planning and Systems Development, September 16, 2008.
Region 10: Safety and Health Surveillance Indicators 2000-2005 29
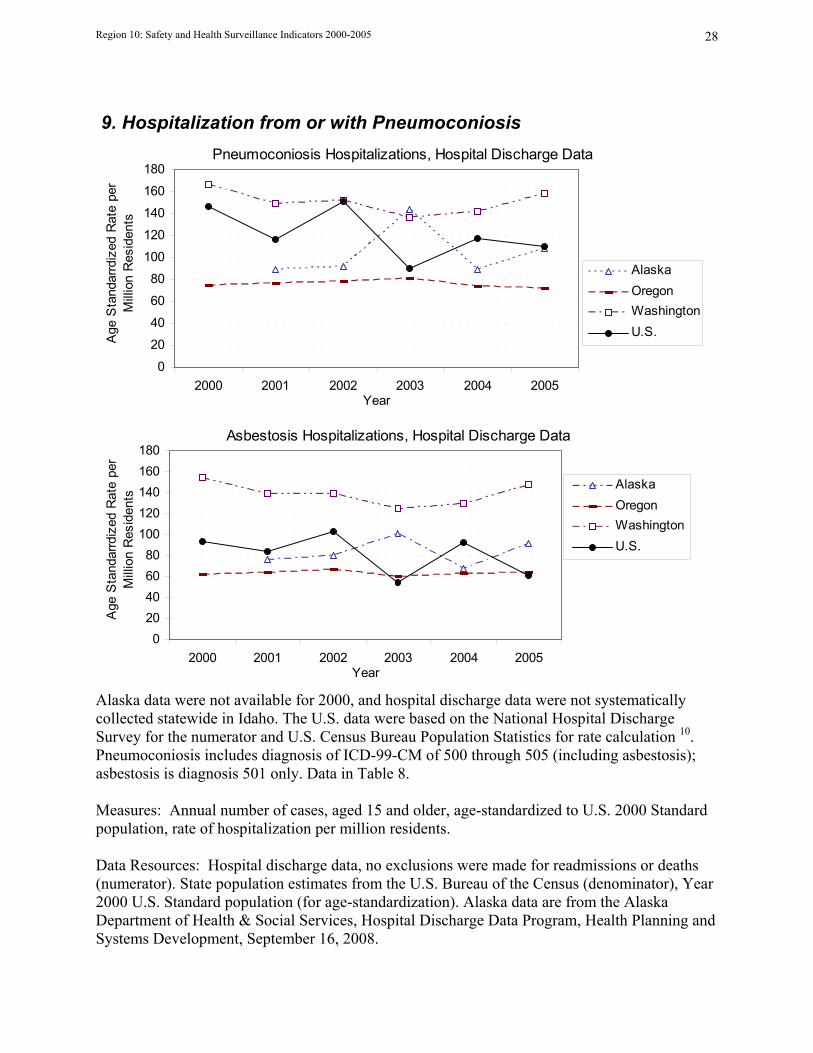
10. Mortality from or with Pneumoconiosis Pneumoconiosis Deaths
02468
101214161820
2000 2001 2002 2003 2004 2005Year
Age
-Sta
ndar
dize
d R
ate
per M
illio
n R
esid
ents
IdahoOregonWashingtonU.S.
Number of Pneumoconiosis Deaths
0
10
20
30
40
50
60
70
80
2000 2001 2002 2003 2004 2005Year
Tota
l Cou
nt
Alaska
Idaho
Oregon
Washington
Counts of pneumoconiosis are small and do not allow for reliable computation of rates in Alaska; however, the counts are available and are presented. Measures: Annual age-standardized death rate per million residents. Data Resources: Death certificate records from vital statistics agency (numerator), state population estimates from the U.S. Bureau of the Census (denominator). Alaska data are from the Alaska Bureau of Vital Statistics, April 7, 2008. Data for Idaho was provided by Bureau of Vital Records and Health Statistics April 10, 2008. U.S. numerator data is from National Center for Health Statistics multiple causes of death file. Data in Table 8.
Region 10: Safety and Health Surveillance Indicators 2000-2005 30
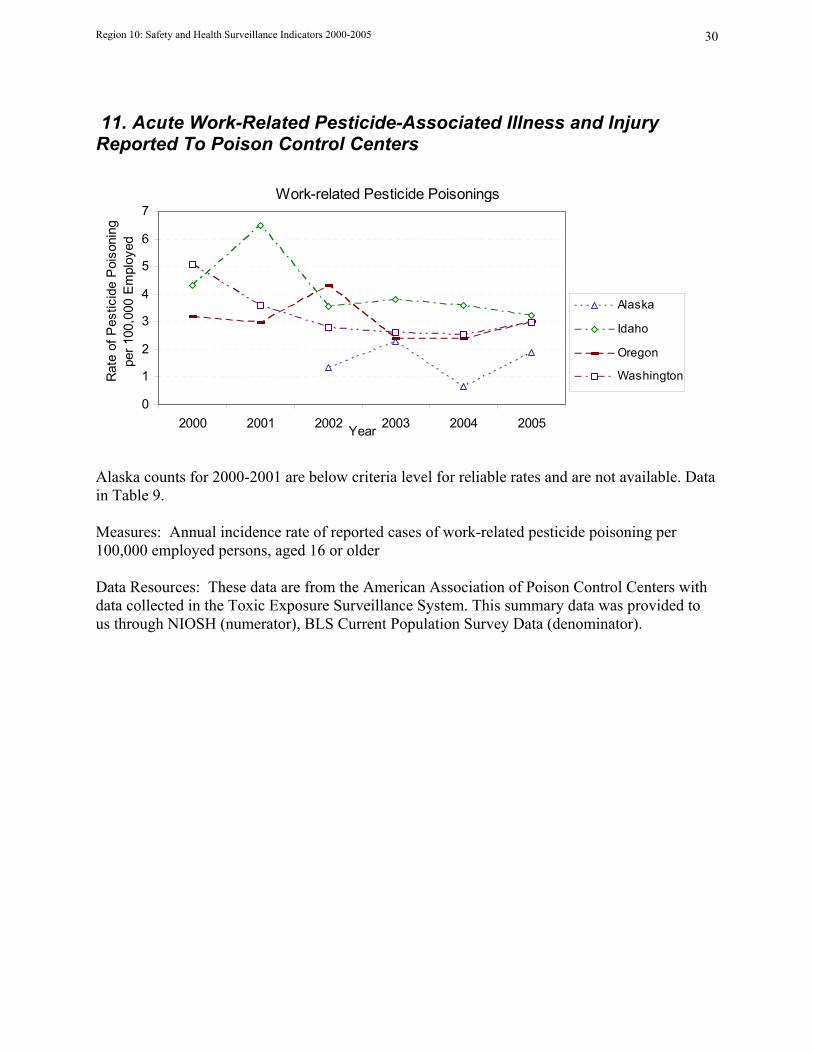
11. Acute Work-Related Pesticide-Associated Illness and Injury Reported To Poison Control Centers
Work-related Pesticide Poisonings
0
1
2
3
4
5
6
7
2000 2001 2002 2003 2004 2005Year
Rat
e of
Pes
ticid
e P
oiso
ning
pe
r 100
,000
Em
ploy
ed
Alaska
Idaho
Oregon
Washington
Alaska counts for 2000-2001 are below criteria level for reliable rates and are not available. Data in Table 9. Measures: Annual incidence rate of reported cases of work-related pesticide poisoning per 100,000 employed persons, aged 16 or older Data Resources: These data are from the American Association of Poison Control Centers with data collected in the Toxic Exposure Surveillance System. This summary data was provided to us through NIOSH (numerator), BLS Current Population Survey Data (denominator).
Region 10: Safety and Health Surveillance Indicators 2000-2005 31
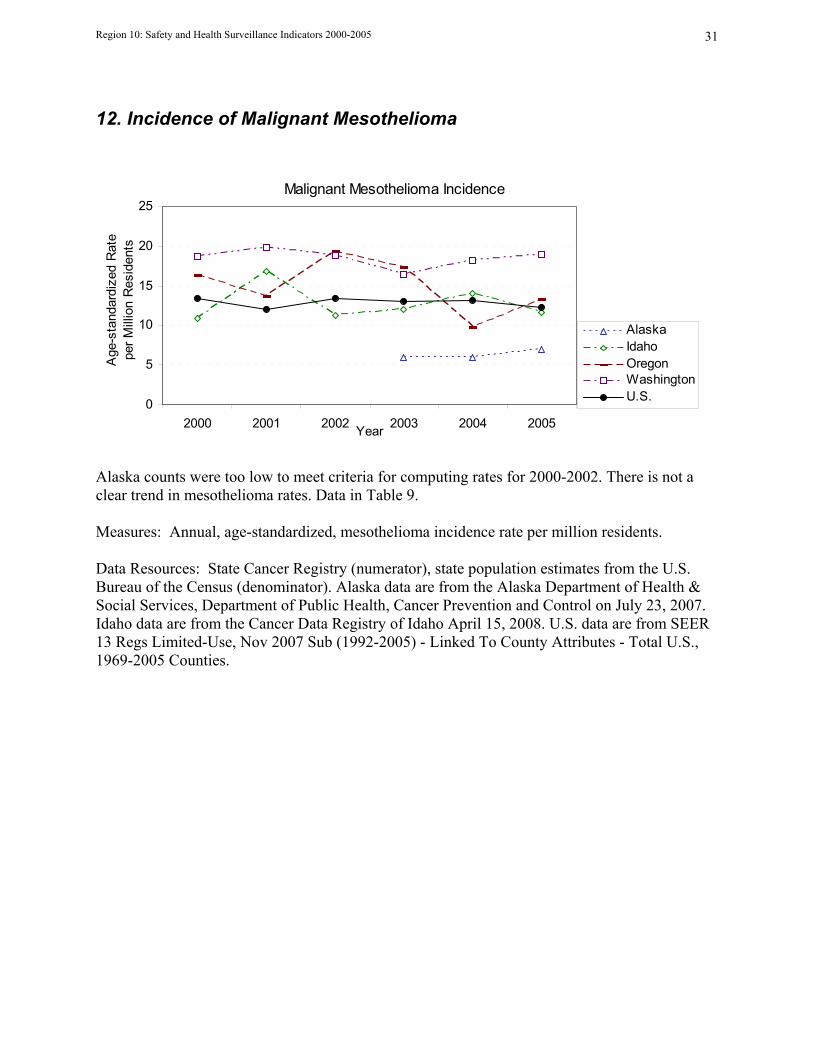
12. Incidence of Malignant Mesothelioma
Malignant Mesothelioma Incidence
0
5
10
15
20
25
2000 2001 2002 2003 2004 2005Year
Age
-sta
ndar
dize
d R
ate
per M
illio
n R
esid
ents
AlaskaIdahoOregonWashingtonU.S.
Alaska counts were too low to meet criteria for computing rates for 2000-2002. There is not a clear trend in mesothelioma rates. Data in Table 9. Measures: Annual, age-standardized, mesothelioma incidence rate per million residents. Data Resources: State Cancer Registry (numerator), state population estimates from the U.S. Bureau of the Census (denominator). Alaska data are from the Alaska Department of Health & Social Services, Department of Public Health, Cancer Prevention and Control on July 23, 2007. Idaho data are from the Cancer Data Registry of Idaho April 15, 2008. U.S. data are from SEER 13 Regs Limited-Use, Nov 2007 Sub (1992-2005) - Linked To County Attributes - Total U.S., 1969-2005 Counties.
Region 10: Safety and Health Surveillance Indicators 2000-2005 32
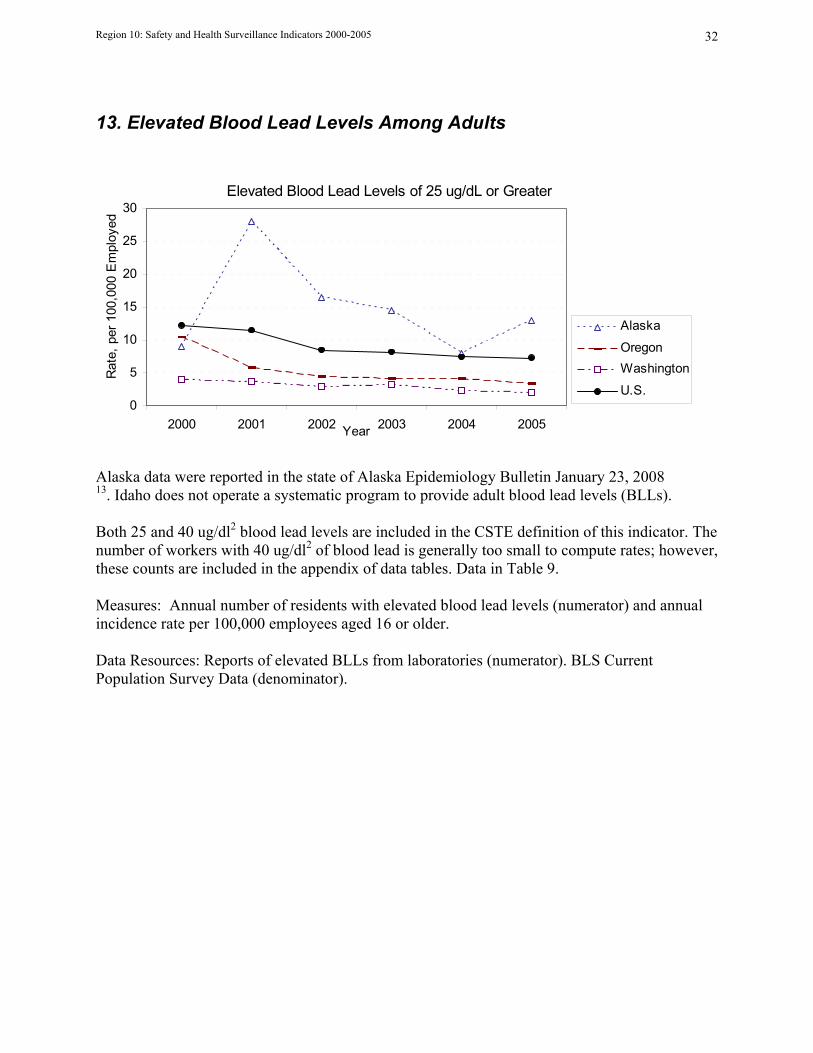
13. Elevated Blood Lead Levels Among Adults
Elevated Blood Lead Levels of 25 ug/dL or Greater
0
5
10
15
20
25
30
2000 2001 2002 2003 2004 2005Year
Rat
e, p
er 1
00,0
00 E
mpl
oyed
Alaska
OregonWashington
U.S.
Alaska data were reported in the state of Alaska Epidemiology Bulletin January 23, 2008 13. Idaho does not operate a systematic program to provide adult blood lead levels (BLLs). Both 25 and 40 ug/dl2 blood lead levels are included in the CSTE definition of this indicator. The number of workers with 40 ug/dl2 of blood lead is generally too small to compute rates; however, these counts are included in the appendix of data tables. Data in Table 9. Measures: Annual number of residents with elevated blood lead levels (numerator) and annual incidence rate per 100,000 employees aged 16 or older. Data Resources: Reports of elevated BLLs from laboratories (numerator). BLS Current Population Survey Data (denominator).
Region 10: Safety and Health Surveillance Indicators 2000-2005 33
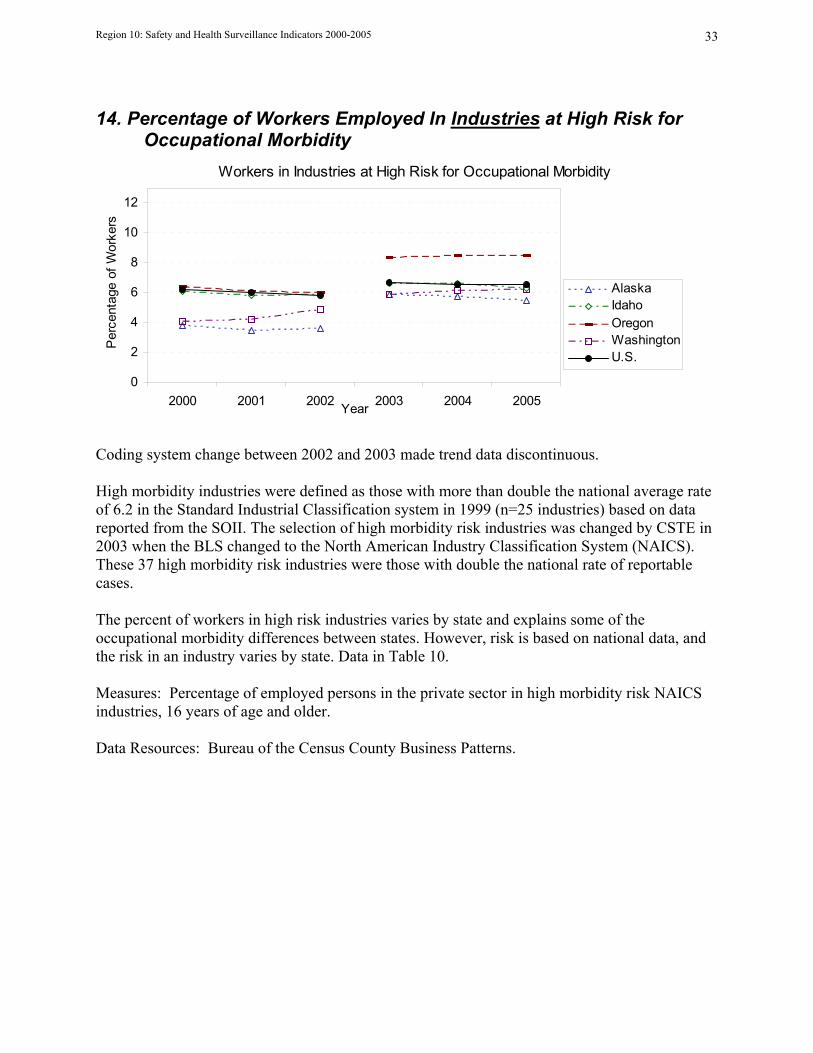
14. Percentage of Workers Employed In Industries at High Risk for Occupational Morbidity
Workers in Industries at High Risk for Occupational Morbidity
0
2
4
6
8
10
12
2000 2001 2002 2003 2004 2005Year
Per
cent
age
of W
orke
rs
AlaskaIdahoOregonWashingtonU.S.
Coding system change between 2002 and 2003 made trend data discontinuous. High morbidity industries were defined as those with more than double the national average rate of 6.2 in the Standard Industrial Classification system in 1999 (n=25 industries) based on data reported from the SOII. The selection of high morbidity risk industries was changed by CSTE in 2003 when the BLS changed to the North American Industry Classification System (NAICS). These 37 high morbidity risk industries were those with double the national rate of reportable cases. The percent of workers in high risk industries varies by state and explains some of the occupational morbidity differences between states. However, risk is based on national data, and the risk in an industry varies by state. Data in Table 10. Measures: Percentage of employed persons in the private sector in high morbidity risk NAICS industries, 16 years of age and older. Data Resources: Bureau of the Census County Business Patterns.
Region 10: Safety and Health Surveillance Indicators 2000-2005 34
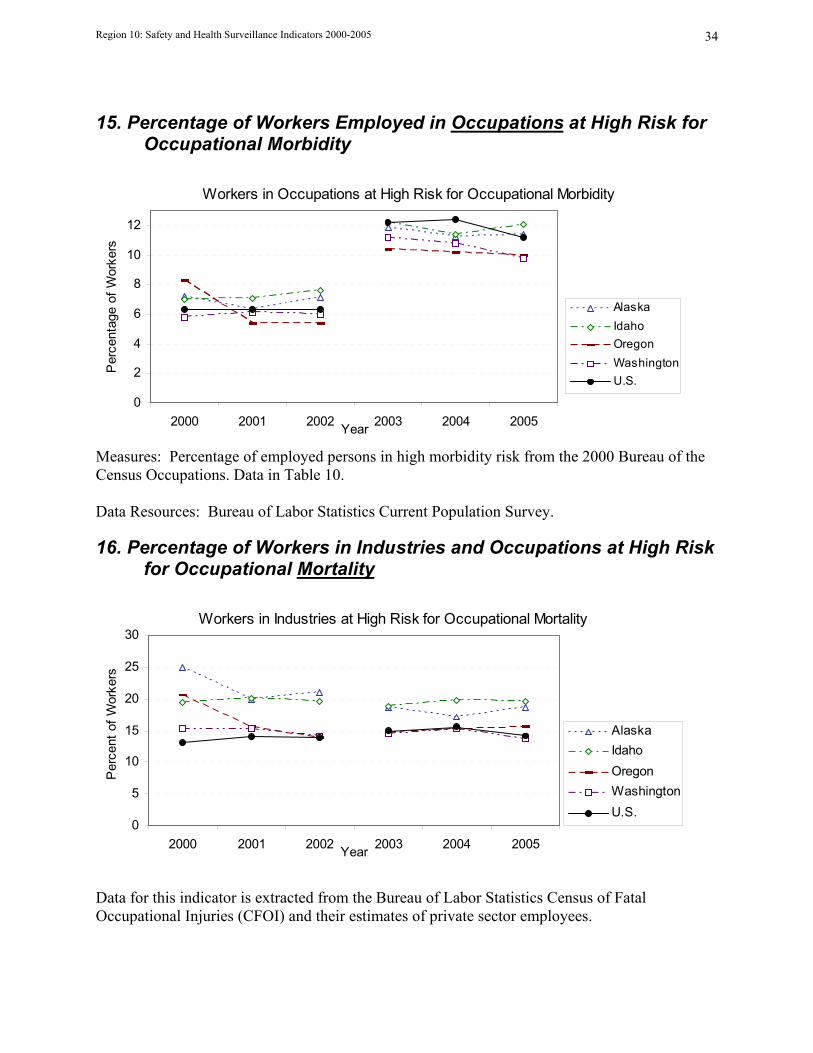
15. Percentage of Workers Employed in Occupations at High Risk for Occupational Morbidity
Workers in Occupations at High Risk for Occupational Morbidity
0
2
4
6
8
10
12
2000 2001 2002 2003 2004 2005Year
Per
cent
age
of W
orke
rs
AlaskaIdahoOregonWashingtonU.S.
Measures: Percentage of employed persons in high morbidity risk from the 2000 Bureau of the Census Occupations. Data in Table 10. Data Resources: Bureau of Labor Statistics Current Population Survey.
16. Percentage of Workers in Industries and Occupations at High Risk for Occupational Mortality
Workers in Industries at High Risk for Occupational Mortality
0
5
10
15
20
25
30
2000 2001 2002 2003 2004 2005Year
Per
cent
of W
orke
rs
AlaskaIdahoOregonWashingtonU.S.
Data for this indicator is extracted from the Bureau of Labor Statistics Census of Fatal Occupational Injuries (CFOI) and their estimates of private sector employees.
Region 10: Safety and Health Surveillance Indicators 2000-2005 35
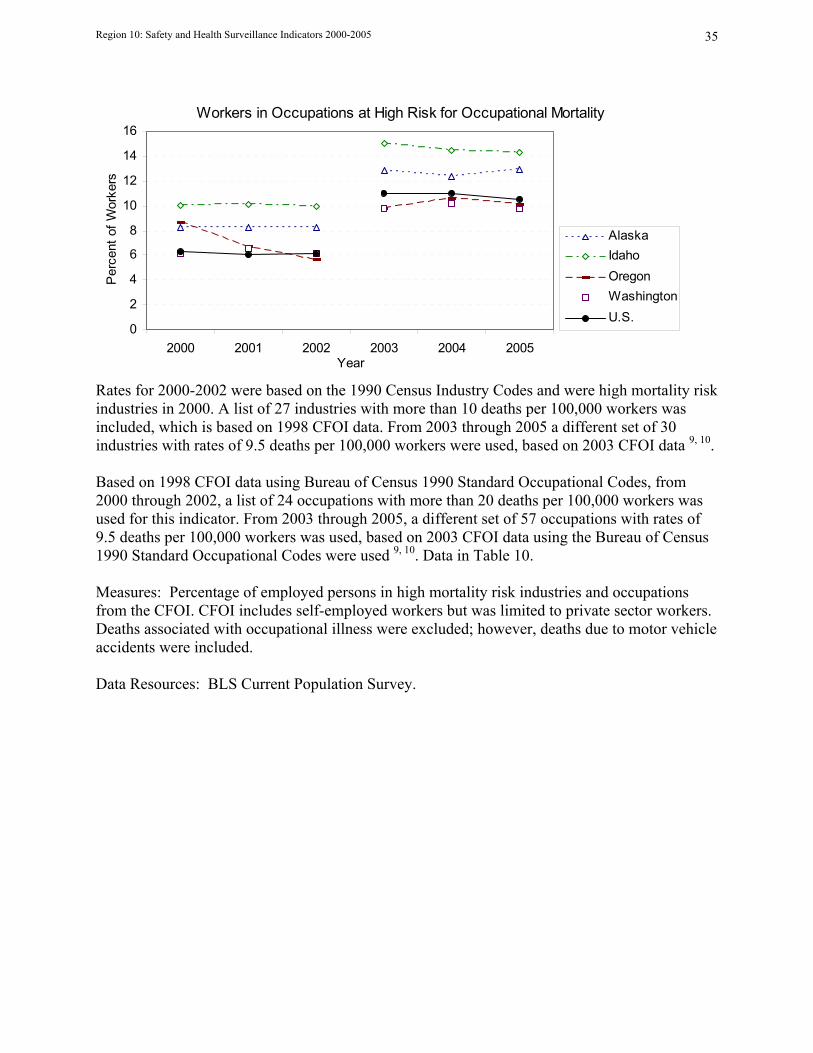
Workers in Occupations at High Risk for Occupational Mortality
0
2
4
6
8
10
12
14
16
2000 2001 2002 2003 2004 2005Year
Per
cent
of W
orke
rs
AlaskaIdahoOregonWashingtonU.S.
Rates for 2000-2002 were based on the 1990 Census Industry Codes and were high mortality risk industries in 2000. A list of 27 industries with more than 10 deaths per 100,000 workers was included, which is based on 1998 CFOI data. From 2003 through 2005 a different set of 30 industries with rates of 9.5 deaths per 100,000 workers were used, based on 2003 CFOI data 9, 10. Based on 1998 CFOI data using Bureau of Census 1990 Standard Occupational Codes, from 2000 through 2002, a list of 24 occupations with more than 20 deaths per 100,000 workers was used for this indicator. From 2003 through 2005, a different set of 57 occupations with rates of 9.5 deaths per 100,000 workers was used, based on 2003 CFOI data using the Bureau of Census 1990 Standard Occupational Codes were used 9, 10. Data in Table 10. Measures: Percentage of employed persons in high mortality risk industries and occupations from the CFOI. CFOI includes self-employed workers but was limited to private sector workers. Deaths associated with occupational illness were excluded; however, deaths due to motor vehicle accidents were included. Data Resources: BLS Current Population Survey.
Region 10: Safety and Health Surveillance Indicators 2000-2005 36
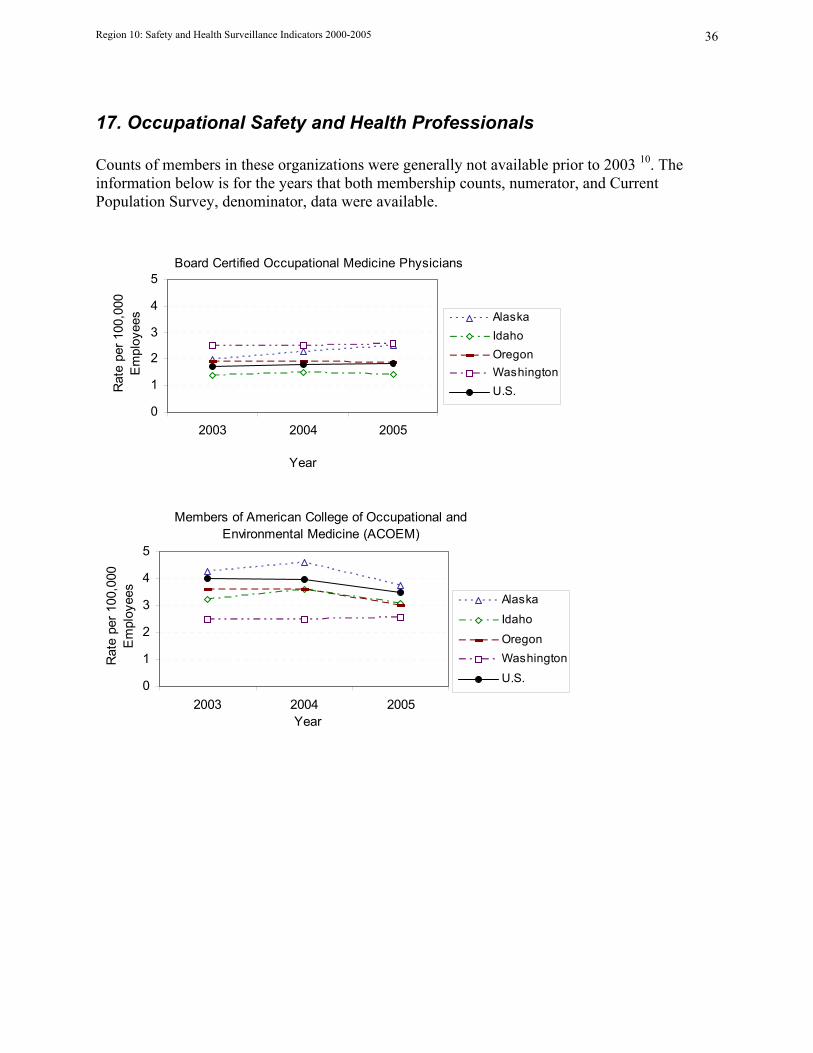
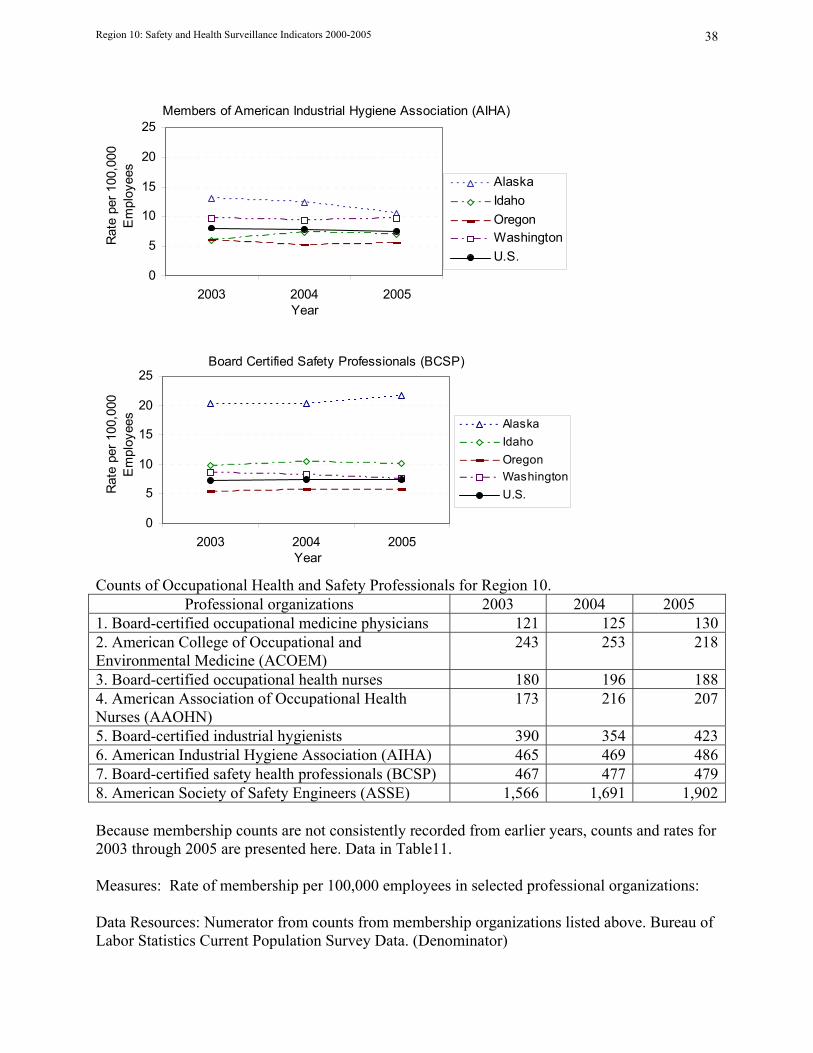
17. Occupational Safety and Health Professionals Counts of members in these organizations were generally not available prior to 2003 10. The information below is for the years that both membership counts, numerator, and Current Population Survey, denominator, data were available.
Board Certified Occupational Medicine Physicians
0
1
2
3
4
5
2003 2004 2005
Year
Rat
e pe
r 100
,000
E
mpl
oyee
s AlaskaIdahoOregonWashingtonU.S.
Members of American College of Occupational and Environmental Medicine (ACOEM)
0
1
2
3
4
5
2003 2004 2005Year
Rat
e pe
r 100
,000
E
mpl
oyee
s
Alaska
Idaho
OregonWashington
U.S.
Region 10: Safety and Health Surveillance Indicators 2000-2005 37
Board Certified Occupational Health Nurses
0
1
2
3
4
5
2003 2004 2005
Year
Rat
e pe
r 100
,000
E
mpl
oyee
s
AlaskaIdahoOregonWashingtonU.S.
Members of American Association of Occupational Health Nurses (AAOHN)
0
2
4
6
8
10
2003 2004 2005Year
Rat
e pe
r 100
,000
E
mpl
oyee
s AlaskaIdahoOregonWashingtonU.S.
Board Certified Industrial Hygienists
0
2
4
6
8
10
2003 2004 2005
Year
Rat
e pe
r 100
,000
E
mpl
oyee
s Alaska
Idaho
Oregon
Washington
U.S.
Region 10: Safety and Health Surveillance Indicators 2000-2005 38
Members of American Industrial Hygiene Association (AIHA)
0
5
10
15
20
25
2003 2004 2005Year
Rat
e pe
r 100
,000
E
mpl
oyee
s
AlaskaIdahoOregonWashingtonU.S.
Board Certified Safety Professionals (BCSP)
0
5
10
15
20
25
2003 2004 2005Year
Rat
e pe
r 100
,000
E
mpl
oyee
s
AlaskaIdahoOregonWashingtonU.S.
Counts of Occupational Health and Safety Professionals for Region 10.
Professional organizations 2003 2004 2005 1. Board-certified occupational medicine physicians 121 125 1302. American College of Occupational and Environmental Medicine (ACOEM)
243 253 218
3. Board-certified occupational health nurses 180 196 1884. American Association of Occupational Health Nurses (AAOHN)
173 216 207
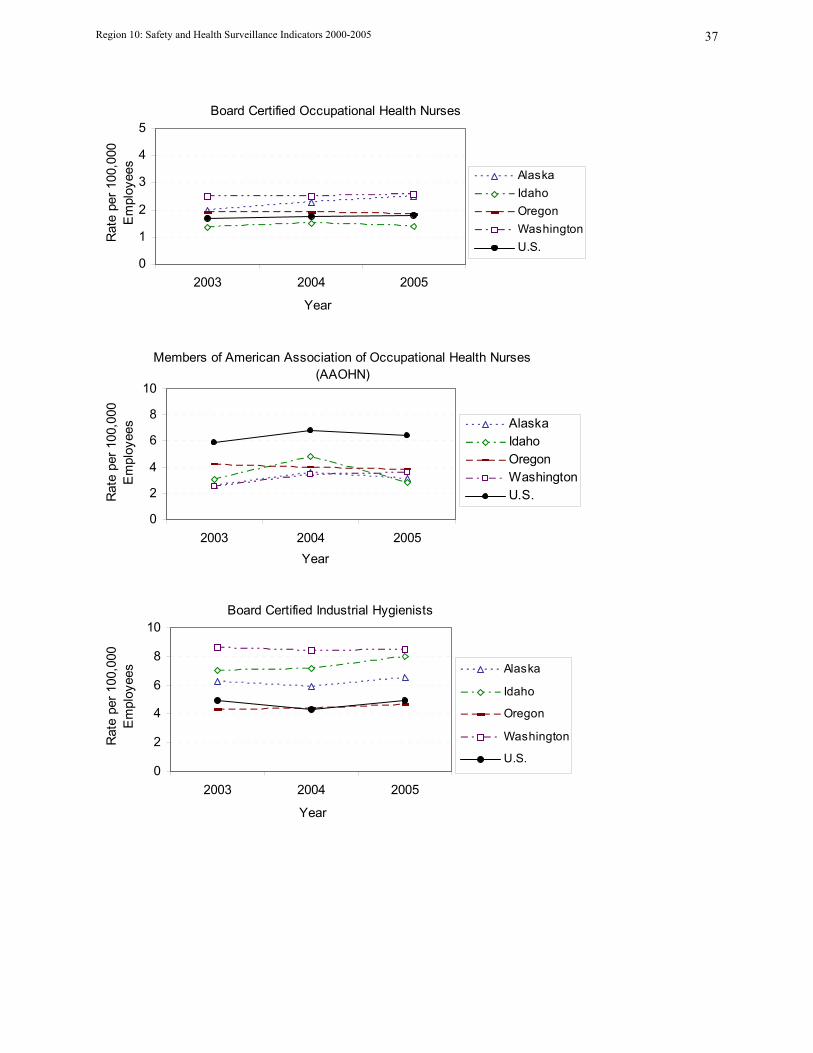
5. Board-certified industrial hygienists 390 354 4236. American Industrial Hygiene Association (AIHA) 465 469 4867. Board-certified safety health professionals (BCSP) 467 477 4798. American Society of Safety Engineers (ASSE) 1,566 1,691 1,902 Because membership counts are not consistently recorded from earlier years, counts and rates for 2003 through 2005 are presented here. Data in Table11. Measures: Rate of membership per 100,000 employees in selected professional organizations: Data Resources: Numerator from counts from membership organizations listed above. Bureau of Labor Statistics Current Population Survey Data. (Denominator)
Region 10: Safety and Health Surveillance Indicators 2000-2005 39
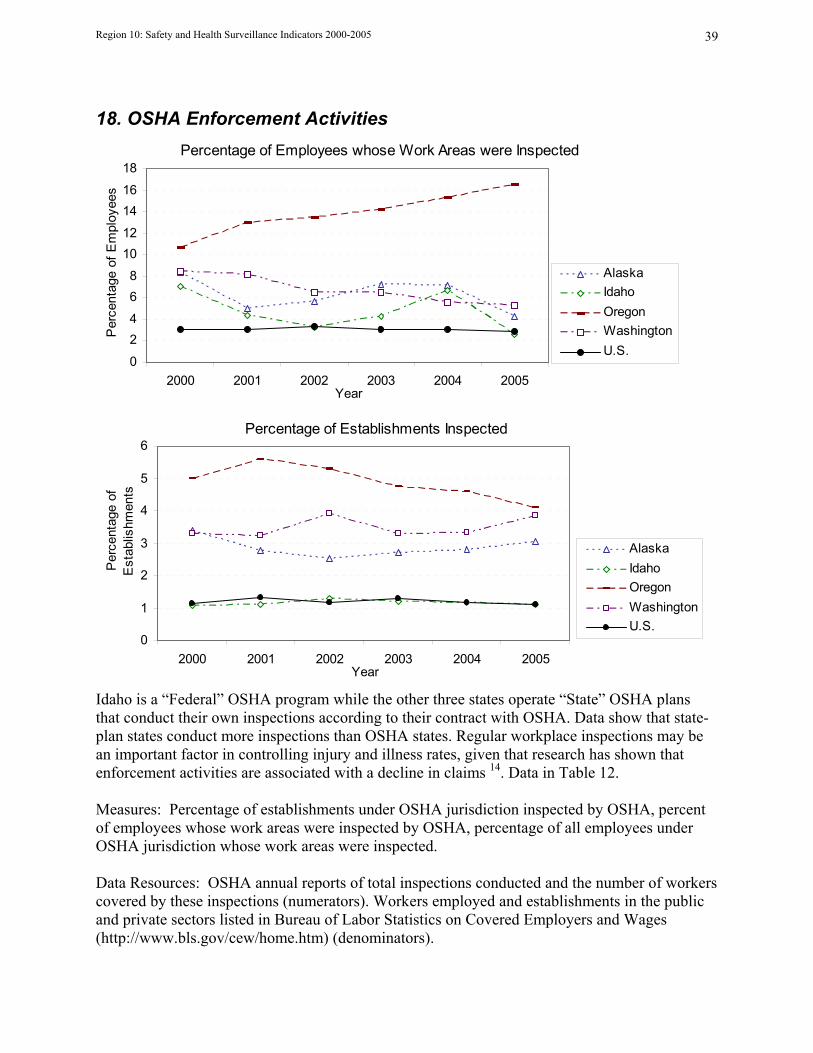
18. OSHA Enforcement Activities
Percentage of Employees whose Work Areas were Inspected
0
24
68
1012
1416
18
2000 2001 2002 2003 2004 2005Year
Per
cent
age
of E
mpl
oyee
s
AlaskaIdahoOregonWashingtonU.S.
Percentage of Establishments Inspected
0
1
2
3
4
5
6
2000 2001 2002 2003 2004 2005Year
Per
cent
age
of
Est
ablis
hmen
ts
AlaskaIdahoOregonWashingtonU.S.
Idaho is a “Federal” OSHA program while the other three states operate “State” OSHA plans that conduct their own inspections according to their contract with OSHA. Data show that state-plan states conduct more inspections than OSHA states. Regular workplace inspections may be an important factor in controlling injury and illness rates, given that research has shown that enforcement activities are associated with a decline in claims 14. Data in Table 12. Measures: Percentage of establishments under OSHA jurisdiction inspected by OSHA, percent of employees whose work areas were inspected by OSHA, percentage of all employees under OSHA jurisdiction whose work areas were inspected. Data Resources: OSHA annual reports of total inspections conducted and the number of workers covered by these inspections (numerators). Workers employed and establishments in the public and private sectors listed in Bureau of Labor Statistics on Covered Employers and Wages (http://www.bls.gov/cew/home.htm) (denominators).
Region 10: Safety and Health Surveillance Indicators 2000-2005 40
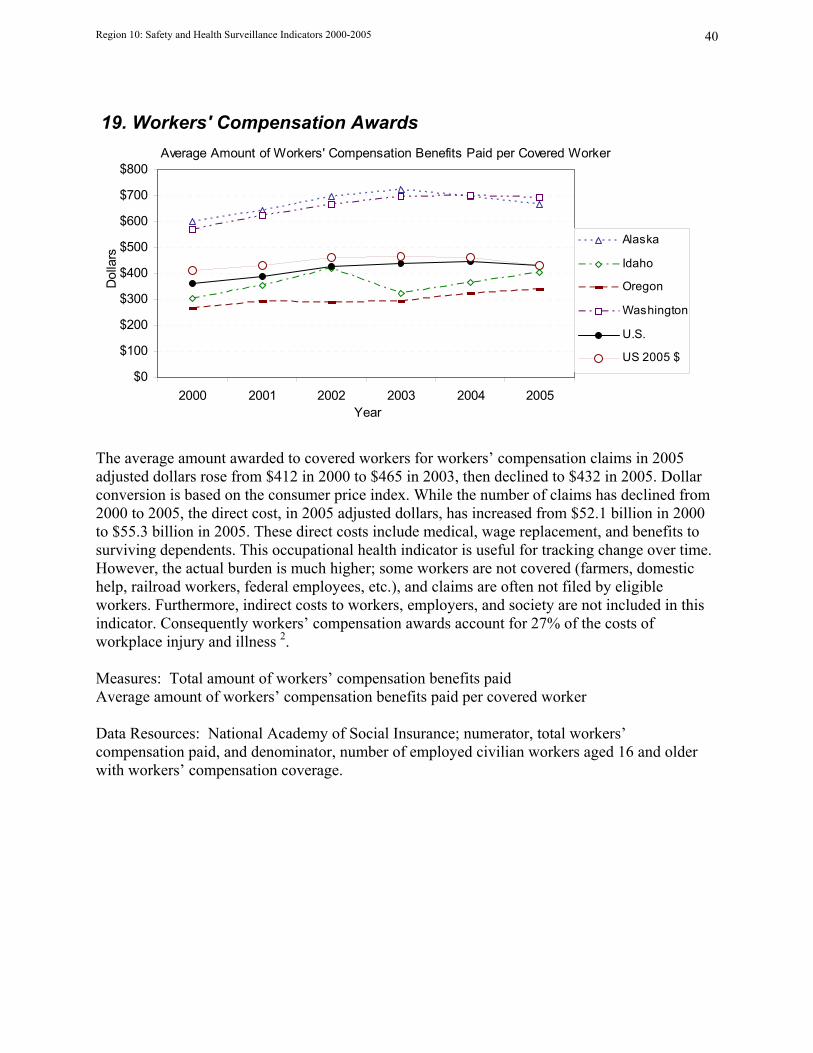
19. Workers' Compensation Awards Average Amount of Workers' Compensation Benefits Paid per Covered Worker
$0
$100
$200
$300
$400
$500
$600
$700
$800
2000 2001 2002 2003 2004 2005Year
Dol
lars
Alaska
Idaho
Oregon
Washington
U.S.
US 2005 $
The average amount awarded to covered workers for workers’ compensation claims in 2005 adjusted dollars rose from $412 in 2000 to $465 in 2003, then declined to $432 in 2005. Dollar conversion is based on the consumer price index. While the number of claims has declined from 2000 to 2005, the direct cost, in 2005 adjusted dollars, has increased from $52.1 billion in 2000 to $55.3 billion in 2005. These direct costs include medical, wage replacement, and benefits to surviving dependents. This occupational health indicator is useful for tracking change over time. However, the actual burden is much higher; some workers are not covered (farmers, domestic help, railroad workers, federal employees, etc.), and claims are often not filed by eligible workers. Furthermore, indirect costs to workers, employers, and society are not included in this indicator. Consequently workers’ compensation awards account for 27% of the costs of workplace injury and illness 2. Measures: Total amount of workers’ compensation benefits paid Average amount of workers’ compensation benefits paid per covered worker Data Resources: National Academy of Social Insurance; numerator, total workers’ compensation paid, and denominator, number of employed civilian workers aged 16 and older with workers’ compensation coverage.
Region 10: Safety and Health Surveillance Indicators 2000-2005 41
Discussion Available Indicators
For OSHA Region 10, state based occupational injury and illness surveillance programs exist in
only Washington and Oregon. This project, in part, assessed the feasibility of conducting the
CSTE occupational health indicators in Idaho and Alaska. Data for some indicators were not
available in Idaho and Alaska. Following the CSTE guidelines, there were nine indicators that
could not be completed for Idaho, and two for Alaska. Surrogates were used to estimate data for
four of these missing indicators in Idaho. Because Idaho does not participate in the annual SOII
employer-reported data, the following indicators were not available: (I 1) non-fatal work-related
injuries and illness, (I 4) amputations with days away from work, and (I 7) musculoskeletal
disorders with days away from work. Indicators (I 5) and (I 8) required workers’ compensation
system data, indicators (I 2), (I 6), and (I 9) required hospital discharge data. Idaho does not
operate a statewide hospital discharge data system, and estimates from other sources were not
available for indicators (I 2) work-related hospitalizations, (I 6) work-related burns, and (I 9)
hospitalization from or with pneumoconiosis. Workers’ compensation data for indicators (I 5)
amputations with lost work time and (I 8) carpal tunnel syndrome with lost work time were not
available for Alaska or Idaho. Similar data were available through the Idaho Industrial
Commission, which tracks statewide work-related illness and injury claims. These indicators
could not be completed for Alaska following the guidelines due to lack of detailed injury or
illness claims data in the workers’ compensation system. Indicator (I 13) adult blood lead levels
requires ABLES data, but Idaho does not participate in the ABLES program. It may be possible
to collect adult blood lead data from local health districts. However, this alternative data is not
currently available.
Comparison Across States
Comparison of data across states needs to be done with caution as many factors influence the
counts and rates of occupational injury and illness. Differences in state workers’ compensation
programs, number of days of lost work before a claim is eligible, eligible conditions, state or
federal OSHA plan, participation in ABLES, SOII, and other systematic differences limit
comparison across states. Limitations of the source data for the 19 indicators are described in
more detail by CSTE 9.
Region 10: Safety and Health Surveillance Indicators 2000-2005 42
Workforce
There were considerable differences in the size of the workforces across states. Alaska had one
tenth the number of workers compared to Washington, which had 3.1 million workers in 2005,
the largest workforce in the region. Idaho’s workforce was one quarter the size of the
Washington workforce and Oregon’s was twothirds as large.
The employed civilian population over 15 years old in Region 10 increased 6% in the follow-up
period, from 5,530,000 to 5,876,000 workers. The employed civilian population over 15 years
old increased by 1.4 years in age from 2000 to 2005 (see P 6: Percentage of Civilian
Employment by Age Group). From 2000 to 2005, the number of workers in part-time jobs
increased by 8% regionally, which represents an additional 90,000 workers to the 1.1 million
part-time workers in 2000 (see P 3: Percentage of Civilian Employment Employed Part-Time).
Education and health services industries represented 20% of the workforce for Region 10 states,
which was the industry with the highest proportion of workers, followed by wholesale and retail
trade, which represented 15% of the total workforce. For all years between 2000 and 2005,
manufacturing of durable goods declined slightly at both the national and regional levels, in
states where consistent coding systems were used. Among occupations, professional and related
occupations dominated the workforce, making up over 20% of all workers in the region. That
industry was followed by service occupations, which made up 15% of the total workforce (see
P9: Percentage of Civilian Employment by Industry and P10: Percentage of Civilian
Employment by Occupation ).
Injury and Illness
Washington and Alaska non-fatal rates reported by the SOII have fallen faster than the national
rate, which dropped 25% during the follow-up period. Oregon’s non-fatal rates were only
slightly less than the national trend (see I 1). The national rate of work-related hospitalizations
dropped 11.6% from 2000 to 2005. Similar trends for hospitalizations were observed for Alaska,
Oregon, and Washington (see I 2).
Region 10: Safety and Health Surveillance Indicators 2000-2005 43
Nationally, work-related fatalities declined 9% during this time. This percentage represents 218
fewer fatalities in 2000 compared to those in 2005. Average fatality rates for Oregon and
Washington were below the national rates, Alaska rates were twice as high, and Idaho rates
declined to match the national rates by 2005 (see I 3).
Nationally, rates of carpal tunnel syndrome decreased 40%, from a peak of 30 cases per 100,000
workers during the follow-up period. SOII CTS rates diverged by as much as 24.1% from the
rates recorded in state-based workers’ compensation systems; state rates of carpal tunnel
syndrome cases were generally higher (see I 7 and I 8).
Trends
Many of these indicators did not have a clear trend or change during the follow-up period. These
indicators include: (I 5) workers’ compensation system amputations, (I 6) hospitalizations for
burns, (I 9) hospitalization for pneumoconiosis, (I 11) acute pesticide illness, (I 12)
mesothelioma incidence, (I 14-I 16) proportion of workforce in occupations and industries at
high risk for morbidity and mortality, (I 17) safety professionals, (I 18) inspections, (I 19)
workers’ compensation awards. A trend indicating a decline in injury and illness rates include all
SOII indicators: (I 1) non-fatal injuries and illnesses, (I 4) amputations with days away from
work, and (I 7) MSDs with days away from work. Other indicators with declining trends were: (I
2) work-related hospitalizations, (I 3) work-related fatalities, (I 8) workers’ compensation MSDs,
(I 10) age adjusted pneumoconiosis, and (I 13) elevated blood lead.
Inspections
Less than half as many workplaces were inspected in Idaho (a federal OSHA state) compared to
the other ‘State Plan’ states in this study (see I 18).
National Surveillance, SOII
Nationally injury and illness rates have declined every year of this study; however, rates have
declined less in 2005, according to SOII counts. There are some limitations of the SOII annual
survey. For example, the SOII excludes many workers, relies on inaccurate employer reporting,
and extrapolates estimates from a sample. There are also many barriers to work-related claims
Region 10: Safety and Health Surveillance Indicators 2000-2005 44
being filed. The current SOII survey results in a significant undercount of non-fatal work-related
conditions. For example, approximately half of the cases that involve the most common and
disabling injuries, such as musculoskeletal disorders, are not reported 15, 16. The OSHA log
sampling method used for the survey also results in unstable estimates of infrequent conditions
(e.g., I 4 amputations). The decline in rates of claims during this follow-up period may have been
influenced more by regulation than improvement in workplace safety. Researchers have found
that most (83%) of the decline in occupational injury and illness rates in the decade following the
1995 implementation of the OMB Paperwork Reduction Act can be attributed to OSHA
regulatory changes in recordkeeping 17. Many of the indicators derived in this study do not
parallel the declines observed in the SOII rates. Furthermore, other data sources, including the
National Electronic Injury Surveillance System occupational supplement, show rates of non-fatal
injuries treated in hospital emergency departments has not declined in recent years 18.
An accurate national surveillance system of occupational injury and illness is needed to
overcome these problems. The current employer-based reporting system excludes many injury
and illness occurrences and would be more complete if supplemental data sources were included.
A public health model which includes accurate data for understanding occupational injury and
illness is needed to direct policy, to appropriately distribute resources, and to develop and
evaluate critical interventions.
Region 10: Safety and Health Surveillance Indicators 2000-2005 45
Abbreviations:
ABLES – Adult Blood Lead Epidemiology Surveillance
ACOEM - American College of Occupational and Environmental Medicine
ANSI Z-16.2 – American National Standards Institute injury codes
BLS - Bureau of Labor Statistics
CSTE – Council of State and Territorial Epidemiologists
CTS – Carpal Tunnel Syndrome
FTE – full time equivalent
IAIABC – International Association of Industrial Accident Boards and Commissions
ICD-9-CM – International Classification of Diseases, Ninth Revision, Clinical Modification
IIC – Idaho Industrial Commission
CFOI – BLS Census of Fatal Occupational Injuries
SOII - BLS Annual Survey of Occupational Illnesses and Injuries
MSD – Musculoskeletal Disorder
NASI – National Academy of Social Insurance
NCCI – National Council on Compensation Insurance
OIICS – Occupational Injury and Illness Classification System
WC – Workers’ Compensation
Region 10: Safety and Health Surveillance Indicators 2000-2005 46
References 1 Weil D. Valuing The Economic Consequences Of Work Injury And Illness: A Comparison Of Methods And Findings. Am J Ind Med. 2001; 40:418-437. 2 Leigh JP, et al. Costs of Occupational Injuries and Illnesses. 2000, Ann Arbor, Michigan: The University of Michigan Press. 3 Smith, G.S., Public health approaches to occupational injury prevention: do they work? Inj Prev. 2001; 7:i3-10. 4 NIOSH, Tracking Occupational Injuries, Illnesses, and Hazards: The NIOSH Surveillance Strategic Plan. 2001, National Institute for Occupational Safety and Health: Cincinnati Ohio. p. 29. 5 NIOSH, The Role of the States in a Nationwide, Comprehensive Surveillance System for Work-Related Diseases, Injuries, and Hazards. 2001, National Institute for Occupational Safety and Health. 6 NIOSH, 10 Years NORA, The Team Document. 2006, National Institute for Occupational Safety and Health: Cincinnati OH. p. 177. 7 Leigh JP, Marcin JP, and Miller TR. An estimate of the US government's undercount of nonfatal occupational injuries. J Occup Environ Med. 2004; 46(1):10-18. 8 Rosenman KD, et al. How Much Work-Related Injury and Illness Is Missed by the Current National Surveillance System? J Occup Environ Med. 2006;48(4): 357-365. 9 CSTE and NIOSH, Occupational Health Indicators: A Guide for Tracking Occupational Health Conditions and Their Determinants 2006. 2006, Council of State and Territorial Epidemiologists, National Institute for Occupational Safety and Health. p. 1-96. 10 CSTE and NIOSH, Putting Data to Work: Occupational Health Indicators from Thirteen Pilot States for 2000. 2005. 11 Hull-Jilly D. Occupational Fatalities in Alaska -- 2001, in State of Alaska Epidemiology Bulletin, Middaugh J, Editor. 2002, DHSS State of Alaska Epidemiology: Anchorage. 12 Baggs J, Curwick C, and Silverstein B. Work-Related Burns in Washington State, 1994 to 1998. J Occup Environ Med. 2002;44(7): 692-699. 13 Wenzel S. Adult Blood Lead Epidemiology and Surveillance: Occupational Exposures --Alaska, 1995-2006. State of Alaska Epidemiology Bulletin, 2008. Vol. 02. 14 Baggs J, Silverstein B, and Foley M. Workplace health and safety regulations: Impact of enforcement and consultation on workers' compensation claims rates in Washington State. Am J Indust Med; 2003;43(5):483-494. 15 Morse T, et al. Trends in Work-Related Musculoskeletal Disorder Reports by Year, Type, and Industrial Sector: a Capture-Recapture Analysis. Am J Indust Med. 2005; 48(1):40-49. 16 Rosenman KD, et al. Why Most Workers With Occupational Repetitive Trauma Do Not File for Workers' Compensation. J Occup Environ Med. 2000; 42(1):25-34. 17 Friedman LS, and Frost L. The Impact of OSHA Recordkeeping Regulation Changes on Occupational Injury and Illness Trends In The U.S.: A Time-Series Analysis. Occ Environ Med. 2007; 64:454-460. 18 Derk SJ, Marsh SM, and Jackson LL. Nonfatal occupational injuries and illnesses - United States, 2004 (Reprinted from MMWR, vol 56, pg 393-397, 2007). J Am Med Assoc. 2007; 298(8):856-858.
Region 10: Safety and Health Surveillance Indicators 2000-2005 47
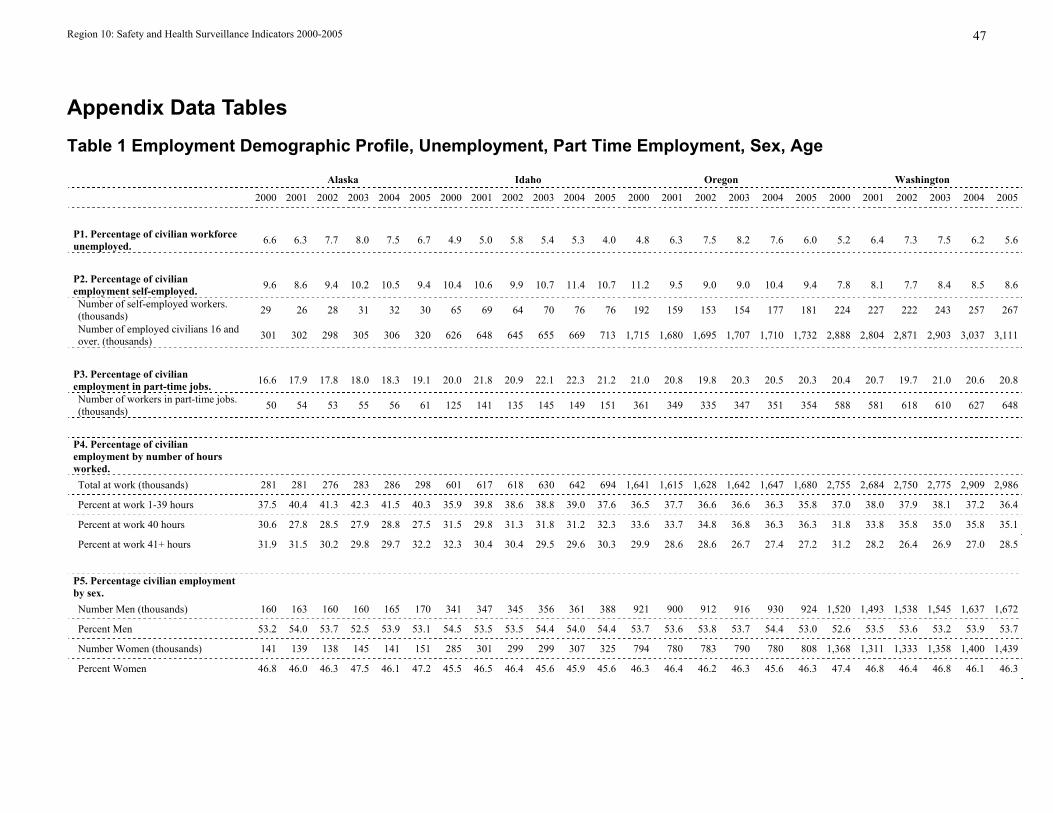
Appendix Data Tables Table 1 Employment Demographic Profile, Unemployment, Part Time Employment, Sex, Age
Alaska Idaho Oregon Washington
2000 2001 2002 2003 2004 2005 2000 2001 2002 2003 2004 2005 2000 2001 2002 2003 2004 2005 2000 2001 2002 2003 2004 2005
P1. Percentage of civilian workforce unemployed. 6.6 6.3 7.7 8.0 7.5 6.7 4.9 5.0 5.8 5.4 5.3 4.0 4.8 6.3 7.5 8.2 7.6 6.0 5.2 6.4 7.3 7.5 6.2 5.6
P2. Percentage of civilian employment self-employed. 9.6 8.6 9.4 10.2 10.5 9.4 10.4 10.6 9.9 10.7 11.4 10.7 11.2 9.5 9.0 9.0 10.4 9.4 7.8 8.1 7.7 8.4 8.5 8.6
Number of self-employed workers. (thousands) 29 26 28 31 32 30 65 69 64 70 76 76 192 159 153 154 177 181 224 227 222 243 257 267
Number of employed civilians 16 and over. (thousands) 301 302 298 305 306 320 626 648 645 655 669 713 1,715 1,680 1,695 1,707 1,710 1,732 2,888 2,804 2,871 2,903 3,037 3,111
P3. Percentage of civilian employment in part-time jobs. 16.6 17.9 17.8 18.0 18.3 19.1 20.0 21.8 20.9 22.1 22.3 21.2 21.0 20.8 19.8 20.3 20.5 20.3 20.4 20.7 19.7 21.0 20.6 20.8
Number of workers in part-time jobs. (thousands) 50 54 53 55 56 61 125 141 135 145 149 151 361 349 335 347 351 354 588 581 618 610 627 648
P4. Percentage of civilian employment by number of hours worked.
Total at work (thousands) 281 281 276 283 286 298 601 617 618 630 642 694 1,641 1,615 1,628 1,642 1,647 1,680 2,755 2,684 2,750 2,775 2,909 2,986
Percent at work 1-39 hours 37.5 40.4 41.3 42.3 41.5 40.3 35.9 39.8 38.6 38.8 39.0 37.6 36.5 37.7 36.6 36.6 36.3 35.8 37.0 38.0 37.9 38.1 37.2 36.4
Percent at work 40 hours 30.6 27.8 28.5 27.9 28.8 27.5 31.5 29.8 31.3 31.8 31.2 32.3 33.6 33.7 34.8 36.8 36.3 36.3 31.8 33.8 35.8 35.0 35.8 35.1
Percent at work 41+ hours 31.9 31.5 30.2 29.8 29.7 32.2 32.3 30.4 30.4 29.5 29.6 30.3 29.9 28.6 28.6 26.7 27.4 27.2 31.2 28.2 26.4 26.9 27.0 28.5
P5. Percentage civilian employment by sex.
Number Men (thousands) 160 163 160 160 165 170 341 347 345 356 361 388 921 900 912 916 930 924 1,520 1,493 1,538 1,545 1,637 1,672
Percent Men 53.2 54.0 53.7 52.5 53.9 53.1 54.5 53.5 53.5 54.4 54.0 54.4 53.7 53.6 53.8 53.7 54.4 53.0 52.6 53.5 53.6 53.2 53.9 53.7
Number Women (thousands) 141 139 138 145 141 151 285 301 299 299 307 325 794 780 783 790 780 808 1,368 1,311 1,333 1,358 1,400 1,439
Percent Women 46.8 46.0 46.3 47.5 46.1 47.2 45.5 46.5 46.4 45.6 45.9 45.6 46.3 46.4 46.2 46.3 45.6 46.3 47.4 46.8 46.4 46.8 46.1 46.3
Region 10: Safety and Health Surveillance Indicators 2000-2005 48
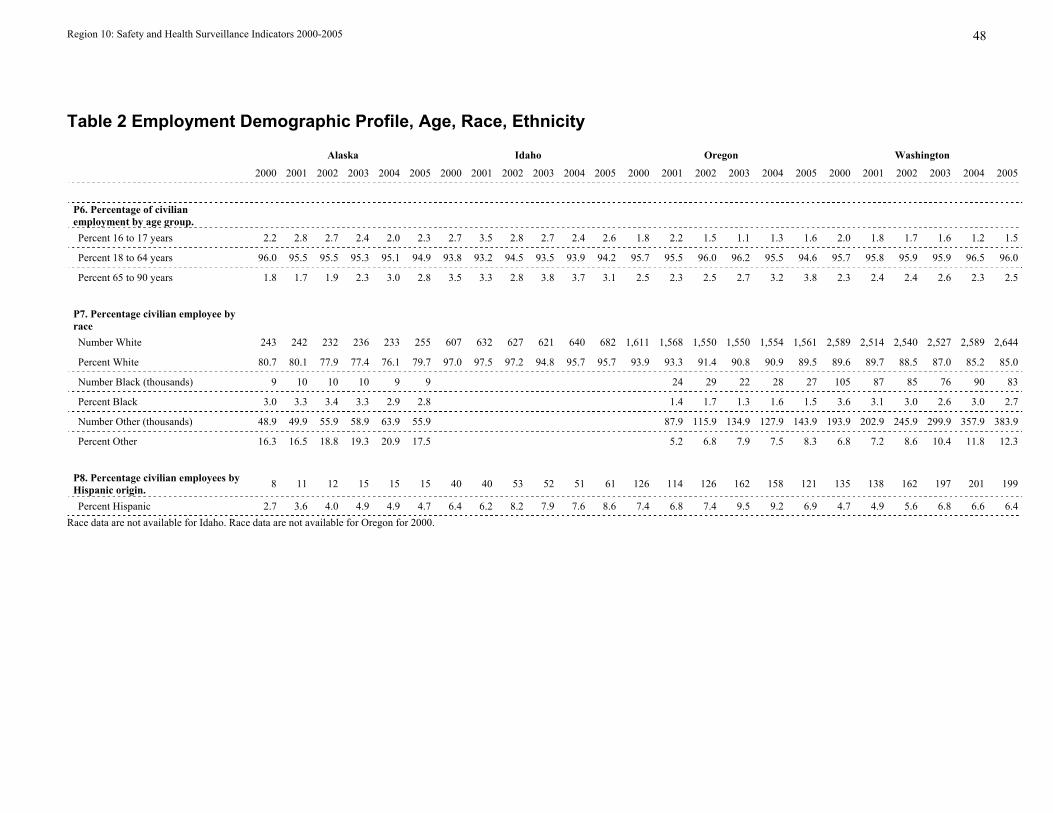
Table 2 Employment Demographic Profile, Age, Race, Ethnicity
Alaska Idaho Oregon Washington
2000 2001 2002 2003 2004 2005 2000 2001 2002 2003 2004 2005 2000 2001 2002 2003 2004 2005 2000 2001 2002 2003 2004 2005
P6. Percentage of civilian employment by age group.
Percent 16 to 17 years 2.2 2.8 2.7 2.4 2.0 2.3 2.7 3.5 2.8 2.7 2.4 2.6 1.8 2.2 1.5 1.1 1.3 1.6 2.0 1.8 1.7 1.6 1.2 1.5
Percent 18 to 64 years 96.0 95.5 95.5 95.3 95.1 94.9 93.8 93.2 94.5 93.5 93.9 94.2 95.7 95.5 96.0 96.2 95.5 94.6 95.7 95.8 95.9 95.9 96.5 96.0
Percent 65 to 90 years 1.8 1.7 1.9 2.3 3.0 2.8 3.5 3.3 2.8 3.8 3.7 3.1 2.5 2.3 2.5 2.7 3.2 3.8 2.3 2.4 2.4 2.6 2.3 2.5
P7. Percentage civilian employee by race
Number White 243 242 232 236 233 255 607 632 627 621 640 682 1,611 1,568 1,550 1,550 1,554 1,561 2,589 2,514 2,540 2,527 2,589 2,644
Percent White 80.7 80.1 77.9 77.4 76.1 79.7 97.0 97.5 97.2 94.8 95.7 95.7 93.9 93.3 91.4 90.8 90.9 89.5 89.6 89.7 88.5 87.0 85.2 85.0
Number Black (thousands) 9 10 10 10 9 9 24 29 22 28 27 105 87 85 76 90 83
Percent Black 3.0 3.3 3.4 3.3 2.9 2.8 1.4 1.7 1.3 1.6 1.5 3.6 3.1 3.0 2.6 3.0 2.7
Number Other (thousands) 48.9 49.9 55.9 58.9 63.9 55.9 87.9 115.9 134.9 127.9 143.9 193.9 202.9 245.9 299.9 357.9 383.9
Percent Other 16.3 16.5 18.8 19.3 20.9 17.5 5.2 6.8 7.9 7.5 8.3 6.8 7.2 8.6 10.4 11.8 12.3
P8. Percentage civilian employees by Hispanic origin. 8 11 12 15 15 15 40 40 53 52 51 61 126 114 126 162 158 121 135 138 162 197 201 199
Percent Hispanic 2.7 3.6 4.0 4.9 4.9 4.7 6.4 6.2 8.2 7.9 7.6 8.6 7.4 6.8 7.4 9.5 9.2 6.9 4.7 4.9 5.6 6.8 6.6 6.4 Race data are not available for Idaho. Race data are not available for Oregon for 2000.
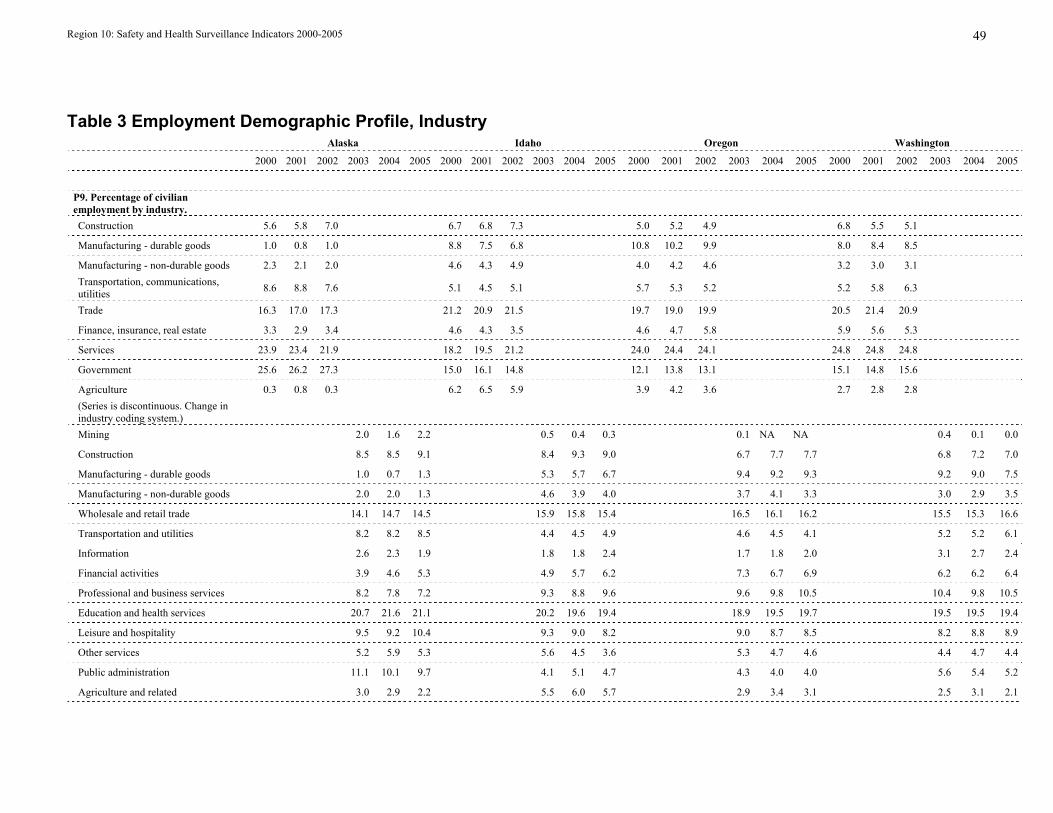
Region 10: Safety and Health Surveillance Indicators 2000-2005 49
Table 3 Employment Demographic Profile, Industry Alaska Idaho Oregon Washington
2000 2001 2002 2003 2004 2005 2000 2001 2002 2003 2004 2005 2000 2001 2002 2003 2004 2005 2000 2001 2002 2003 2004 2005
P9. Percentage of civilian employment by industry.
Construction 5.6 5.8 7.0 6.7 6.8 7.3 5.0 5.2 4.9 6.8 5.5 5.1
Manufacturing - durable goods 1.0 0.8 1.0 8.8 7.5 6.8 10.8 10.2 9.9 8.0 8.4 8.5
Manufacturing - non-durable goods 2.3 2.1 2.0 4.6 4.3 4.9 4.0 4.2 4.6 3.2 3.0 3.1 Transportation, communications, utilities 8.6 8.8 7.6 5.1 4.5 5.1 5.7 5.3 5.2 5.2 5.8 6.3
Trade 16.3 17.0 17.3 21.2 20.9 21.5 19.7 19.0 19.9 20.5 21.4 20.9
Finance, insurance, real estate 3.3 2.9 3.4 4.6 4.3 3.5 4.6 4.7 5.8 5.9 5.6 5.3
Services 23.9 23.4 21.9 18.2 19.5 21.2 24.0 24.4 24.1 24.8 24.8 24.8
Government 25.6 26.2 27.3 15.0 16.1 14.8 12.1 13.8 13.1 15.1 14.8 15.6
Agriculture 0.3 0.8 0.3 6.2 6.5 5.9 3.9 4.2 3.6 2.7 2.8 2.8 (Series is discontinuous. Change in industry coding system.)
Mining 2.0 1.6 2.2 0.5 0.4 0.3 0.1 NA NA 0.4 0.1 0.0
Construction 8.5 8.5 9.1 8.4 9.3 9.0 6.7 7.7 7.7 6.8 7.2 7.0
Manufacturing - durable goods 1.0 0.7 1.3 5.3 5.7 6.7 9.4 9.2 9.3 9.2 9.0 7.5
Manufacturing - non-durable goods 2.0 2.0 1.3 4.6 3.9 4.0 3.7 4.1 3.3 3.0 2.9 3.5
Wholesale and retail trade 14.1 14.7 14.5 15.9 15.8 15.4 16.5 16.1 16.2 15.5 15.3 16.6
Transportation and utilities 8.2 8.2 8.5 4.4 4.5 4.9 4.6 4.5 4.1 5.2 5.2 6.1
Information 2.6 2.3 1.9 1.8 1.8 2.4 1.7 1.8 2.0 3.1 2.7 2.4
Financial activities 3.9 4.6 5.3 4.9 5.7 6.2 7.3 6.7 6.9 6.2 6.2 6.4
Professional and business services 8.2 7.8 7.2 9.3 8.8 9.6 9.6 9.8 10.5 10.4 9.8 10.5
Education and health services 20.7 21.6 21.1 20.2 19.6 19.4 18.9 19.5 19.7 19.5 19.5 19.4
Leisure and hospitality 9.5 9.2 10.4 9.3 9.0 8.2 9.0 8.7 8.5 8.2 8.8 8.9
Other services 5.2 5.9 5.3 5.6 4.5 3.6 5.3 4.7 4.6 4.4 4.7 4.4
Public administration 11.1 10.1 9.7 4.1 5.1 4.7 4.3 4.0 4.0 5.6 5.4 5.2
Agriculture and related 3.0 2.9 2.2 5.5 6.0 5.7 2.9 3.4 3.1 2.5 3.1 2.1
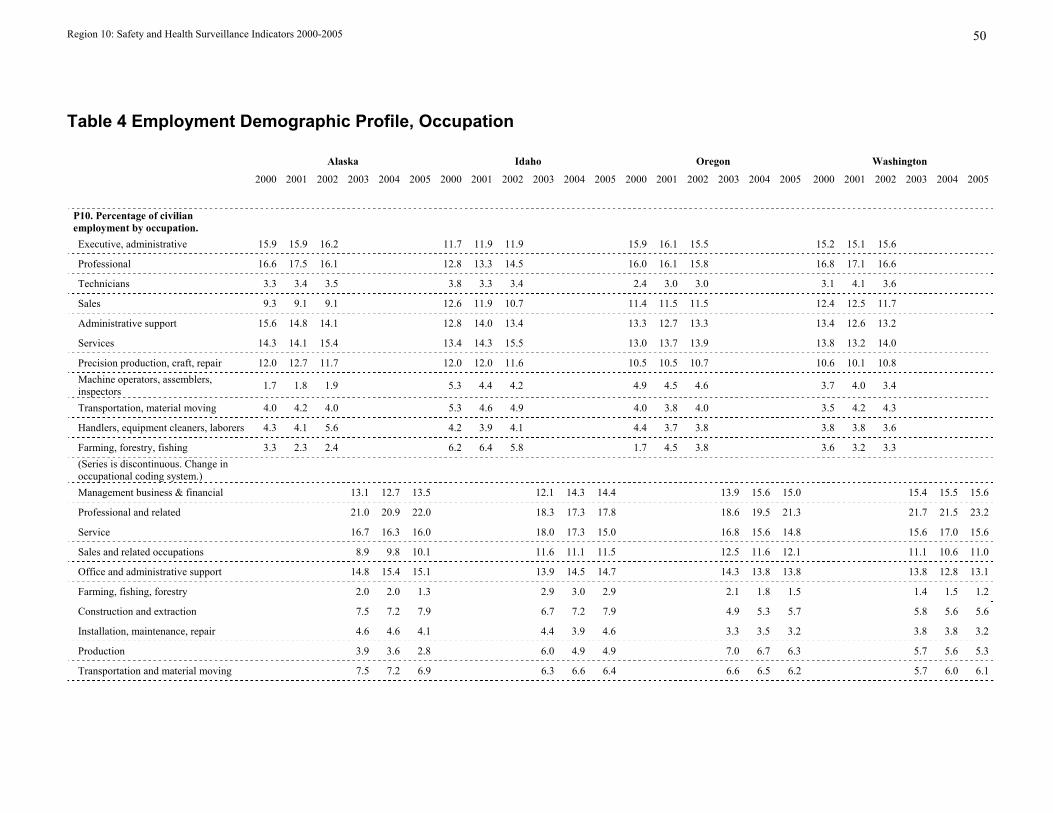
Region 10: Safety and Health Surveillance Indicators 2000-2005 50
Table 4 Employment Demographic Profile, Occupation
Alaska Idaho Oregon Washington
2000 2001 2002 2003 2004 2005 2000 2001 2002 2003 2004 2005 2000 2001 2002 2003 2004 2005 2000 2001 2002 2003 2004 2005
P10. Percentage of civilian employment by occupation.
Executive, administrative 15.9 15.9 16.2 11.7 11.9 11.9 15.9 16.1 15.5 15.2 15.1 15.6
Professional 16.6 17.5 16.1 12.8 13.3 14.5 16.0 16.1 15.8 16.8 17.1 16.6
Technicians 3.3 3.4 3.5 3.8 3.3 3.4 2.4 3.0 3.0 3.1 4.1 3.6
Sales 9.3 9.1 9.1 12.6 11.9 10.7 11.4 11.5 11.5 12.4 12.5 11.7
Administrative support 15.6 14.8 14.1 12.8 14.0 13.4 13.3 12.7 13.3 13.4 12.6 13.2
Services 14.3 14.1 15.4 13.4 14.3 15.5 13.0 13.7 13.9 13.8 13.2 14.0
Precision production, craft, repair 12.0 12.7 11.7 12.0 12.0 11.6 10.5 10.5 10.7 10.6 10.1 10.8 Machine operators, assemblers, inspectors 1.7 1.8 1.9 5.3 4.4 4.2 4.9 4.5 4.6 3.7 4.0 3.4
Transportation, material moving 4.0 4.2 4.0 5.3 4.6 4.9 4.0 3.8 4.0 3.5 4.2 4.3
Handlers, equipment cleaners, laborers 4.3 4.1 5.6 4.2 3.9 4.1 4.4 3.7 3.8 3.8 3.8 3.6
Farming, forestry, fishing 3.3 2.3 2.4 6.2 6.4 5.8 1.7 4.5 3.8 3.6 3.2 3.3 (Series is discontinuous. Change in occupational coding system.)
Management business & financial 13.1 12.7 13.5 12.1 14.3 14.4 13.9 15.6 15.0 15.4 15.5 15.6
Professional and related 21.0 20.9 22.0 18.3 17.3 17.8 18.6 19.5 21.3 21.7 21.5 23.2
Service 16.7 16.3 16.0 18.0 17.3 15.0 16.8 15.6 14.8 15.6 17.0 15.6
Sales and related occupations 8.9 9.8 10.1 11.6 11.1 11.5 12.5 11.6 12.1 11.1 10.6 11.0
Office and administrative support 14.8 15.4 15.1 13.9 14.5 14.7 14.3 13.8 13.8 13.8 12.8 13.1
Farming, fishing, forestry 2.0 2.0 1.3 2.9 3.0 2.9 2.1 1.8 1.5 1.4 1.5 1.2
Construction and extraction 7.5 7.2 7.9 6.7 7.2 7.9 4.9 5.3 5.7 5.8 5.6 5.6
Installation, maintenance, repair 4.6 4.6 4.1 4.4 3.9 4.6 3.3 3.5 3.2 3.8 3.8 3.2
Production 3.9 3.6 2.8 6.0 4.9 4.9 7.0 6.7 6.3 5.7 5.6 5.3
Transportation and material moving 7.5 7.2 6.9 6.3 6.6 6.4 6.6 6.5 6.2 5.7 6.0 6.1
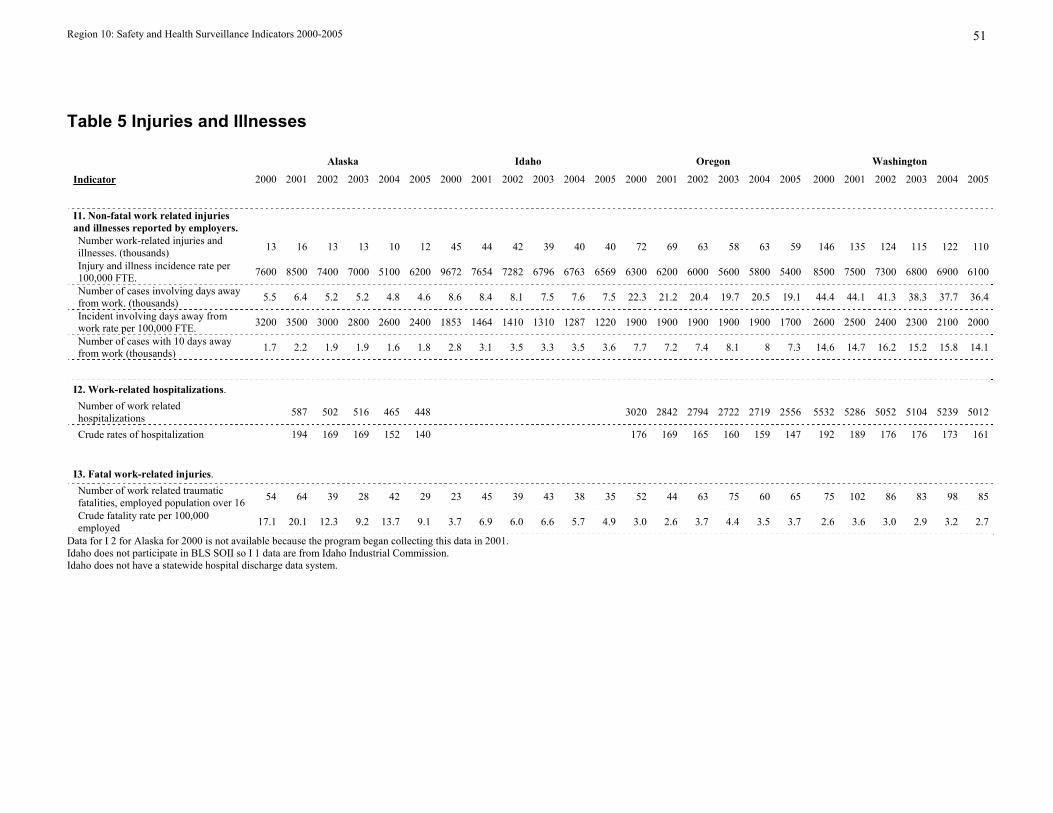
Region 10: Safety and Health Surveillance Indicators 2000-2005 51
Table 5 Injuries and Illnesses
Alaska Idaho Oregon Washington
Indicator 2000 2001 2002 2003 2004 2005 2000 2001 2002 2003 2004 2005 2000 2001 2002 2003 2004 2005 2000 2001 2002 2003 2004 2005
I1. Non-fatal work related injuries and illnesses reported by employers.
Number work-related injuries and illnesses. (thousands) 13 16 13 13 10 12 45 44 42 39 40 40 72 69 63 58 63 59 146 135 124 115 122 110
Injury and illness incidence rate per 100,000 FTE. 7600 8500 7400 7000 5100 6200 9672 7654 7282 6796 6763 6569 6300 6200 6000 5600 5800 5400 8500 7500 7300 6800 6900 6100
Number of cases involving days away from work. (thousands) 5.5 6.4 5.2 5.2 4.8 4.6 8.6 8.4 8.1 7.5 7.6 7.5 22.3 21.2 20.4 19.7 20.5 19.1 44.4 44.1 41.3 38.3 37.7 36.4
Incident involving days away from work rate per 100,000 FTE. 3200 3500 3000 2800 2600 2400 1853 1464 1410 1310 1287 1220 1900 1900 1900 1900 1900 1700 2600 2500 2400 2300 2100 2000
Number of cases with 10 days away from work (thousands) 1.7 2.2 1.9 1.9 1.6 1.8 2.8 3.1 3.5 3.3 3.5 3.6 7.7 7.2 7.4 8.1 8 7.3 14.6 14.7 16.2 15.2 15.8 14.1
I2. Work-related hospitalizations. Number of work related hospitalizations 587 502 516 465 448 3020 2842 2794 2722 2719 2556 5532 5286 5052 5104 5239 5012
Crude rates of hospitalization 194 169 169 152 140 176 169 165 160 159 147 192 189 176 176 173 161
I3. Fatal work-related injuries. Number of work related traumatic fatalities, employed population over 16 54 64 39 28 42 29 23 45 39 43 38 35 52 44 63 75 60 65 75 102 86 83 98 85
Crude fatality rate per 100,000 employed 17.1 20.1 12.3 9.2 13.7 9.1 3.7 6.9 6.0 6.6 5.7 4.9 3.0 2.6 3.7 4.4 3.5 3.7 2.6 3.6 3.0 2.9 3.2 2.7
Data for I 2 for Alaska for 2000 is not available because the program began collecting this data in 2001. Idaho does not participate in BLS SOII so I 1 data are from Idaho Industrial Commission. Idaho does not have a statewide hospital discharge data system.
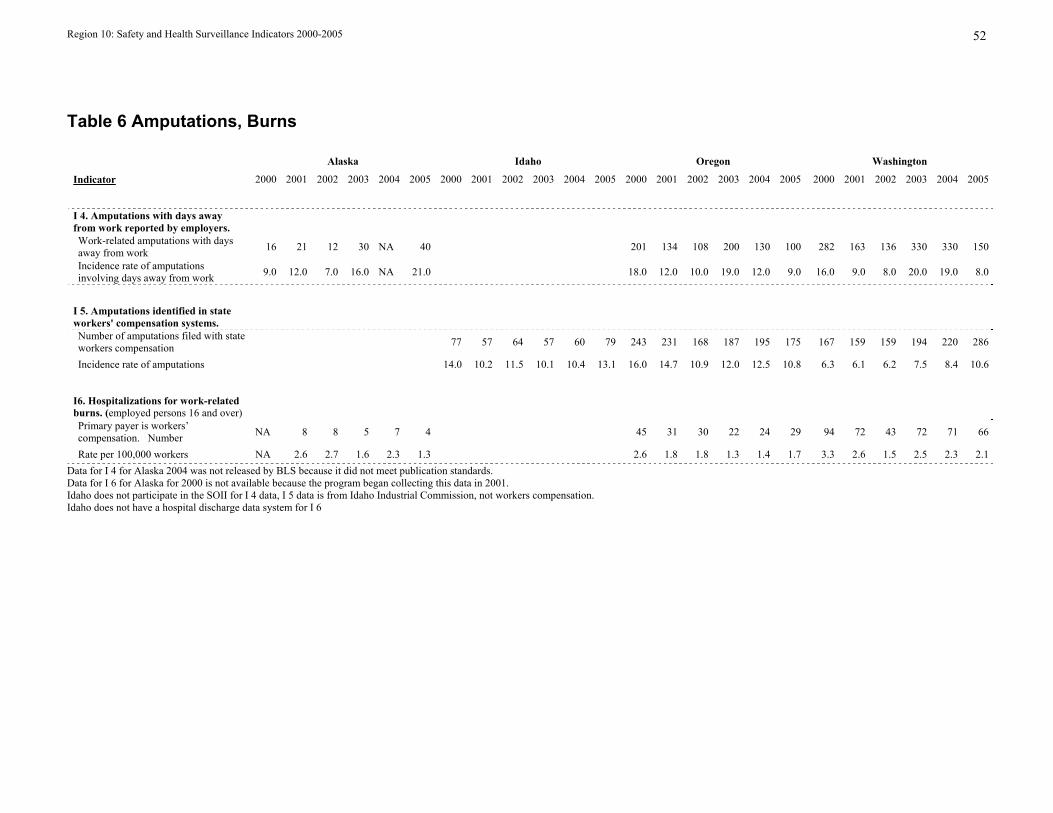
Region 10: Safety and Health Surveillance Indicators 2000-2005 52
Table 6 Amputations, Burns
Alaska Idaho Oregon Washington
Indicator 2000 2001 2002 2003 2004 2005 2000 2001 2002 2003 2004 2005 2000 2001 2002 2003 2004 2005 2000 2001 2002 2003 2004 2005
I 4. Amputations with days away from work reported by employers.
Work-related amputations with days away from work 16 21 12 30 NA 40 201 134 108 200 130 100 282 163 136 330 330 150
Incidence rate of amputations involving days away from work 9.0 12.0 7.0 16.0 NA 21.0 18.0 12.0 10.0 19.0 12.0 9.0 16.0 9.0 8.0 20.0 19.0 8.0
I 5. Amputations identified in state workers' compensation systems.
Number of amputations filed with state workers compensation 77 57 64 57 60 79 243 231 168 187 195 175 167 159 159 194 220 286
Incidence rate of amputations 14.0 10.2 11.5 10.1 10.4 13.1 16.0 14.7 10.9 12.0 12.5 10.8 6.3 6.1 6.2 7.5 8.4 10.6
I6. Hospitalizations for work-related burns. (employed persons 16 and over)
Primary payer is workers’ compensation. Number NA 8 8 5 7 4 45 31 30 22 24 29 94 72 43 72 71 66
Rate per 100,000 workers NA 2.6 2.7 1.6 2.3 1.3 2.6 1.8 1.8 1.3 1.4 1.7 3.3 2.6 1.5 2.5 2.3 2.1 Data for I 4 for Alaska 2004 was not released by BLS because it did not meet publication standards. Data for I 6 for Alaska for 2000 is not available because the program began collecting this data in 2001. Idaho does not participate in the SOII for I 4 data, I 5 data is from Idaho Industrial Commission, not workers compensation. Idaho does not have a hospital discharge data system for I 6
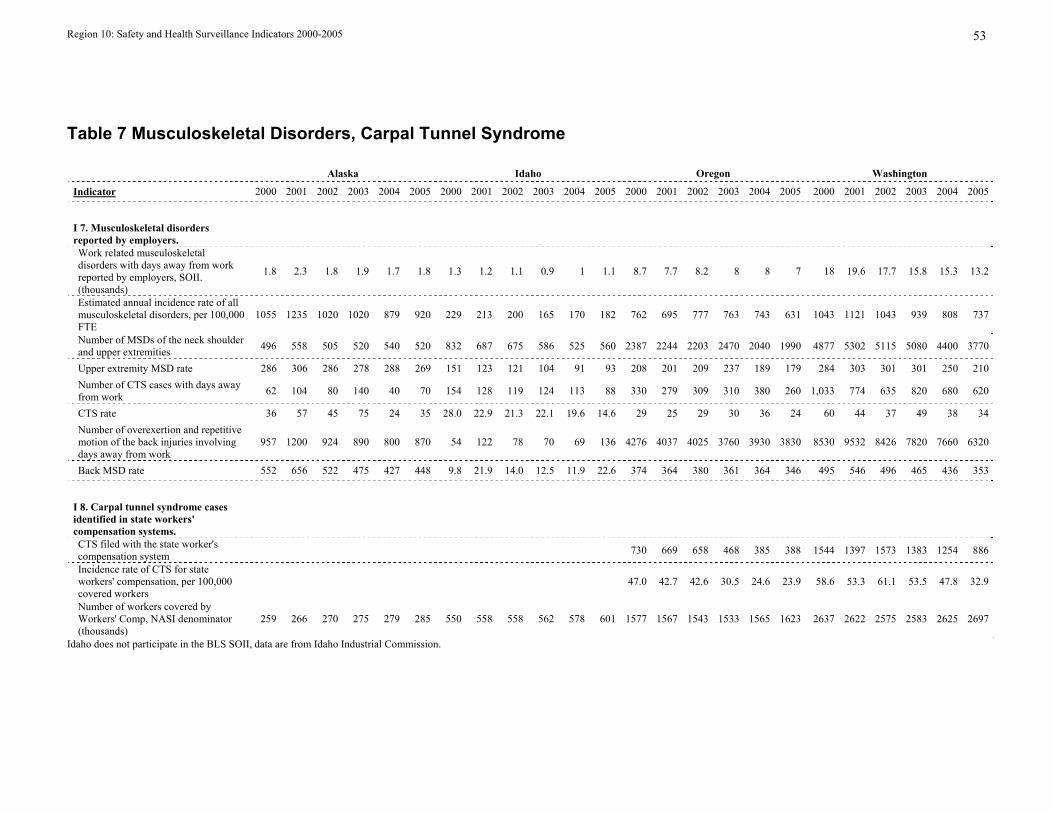
Region 10: Safety and Health Surveillance Indicators 2000-2005 53
Table 7 Musculoskeletal Disorders, Carpal Tunnel Syndrome
Alaska Idaho Oregon Washington
Indicator 2000 2001 2002 2003 2004 2005 2000 2001 2002 2003 2004 2005 2000 2001 2002 2003 2004 2005 2000 2001 2002 2003 2004 2005
I 7. Musculoskeletal disorders reported by employers.
Work related musculoskeletal disorders with days away from work reported by employers, SOII. (thousands)
1.8 2.3 1.8 1.9 1.7 1.8 1.3 1.2 1.1 0.9 1 1.1 8.7 7.7 8.2 8 8 7 18 19.6 17.7 15.8 15.3 13.2
Estimated annual incidence rate of all musculoskeletal disorders, per 100,000 FTE
1055 1235 1020 1020 879 920 229 213 200 165 170 182 762 695 777 763 743 631 1043 1121 1043 939 808 737
Number of MSDs of the neck shoulder and upper extremities 496 558 505 520 540 520 832 687 675 586 525 560 2387 2244 2203 2470 2040 1990 4877 5302 5115 5080 4400 3770
Upper extremity MSD rate 286 306 286 278 288 269 151 123 121 104 91 93 208 201 209 237 189 179 284 303 301 301 250 210 Number of CTS cases with days away from work 62 104 80 140 40 70 154 128 119 124 113 88 330 279 309 310 380 260 1,033 774 635 820 680 620
CTS rate 36 57 45 75 24 35 28.0 22.9 21.3 22.1 19.6 14.6 29 25 29 30 36 24 60 44 37 49 38 34 Number of overexertion and repetitive motion of the back injuries involving days away from work
957 1200 924 890 800 870 54 122 78 70 69 136 4276 4037 4025 3760 3930 3830 8530 9532 8426 7820 7660 6320
Back MSD rate 552 656 522 475 427 448 9.8 21.9 14.0 12.5 11.9 22.6 374 364 380 361 364 346 495 546 496 465 436 353
I 8. Carpal tunnel syndrome cases identified in state workers' compensation systems.
CTS filed with the state worker's compensation system 730 669 658 468 385 388 1544 1397 1573 1383 1254 886
Incidence rate of CTS for state workers' compensation, per 100,000 covered workers
47.0 42.7 42.6 30.5 24.6 23.9 58.6 53.3 61.1 53.5 47.8 32.9
Number of workers covered by Workers' Comp, NASI denominator (thousands)
259 266 270 275 279 285 550 558 558 562 578 601 1577 1567 1543 1533 1565 1623 2637 2622 2575 2583 2625 2697
Idaho does not participate in the BLS SOII, data are from Idaho Industrial Commission.
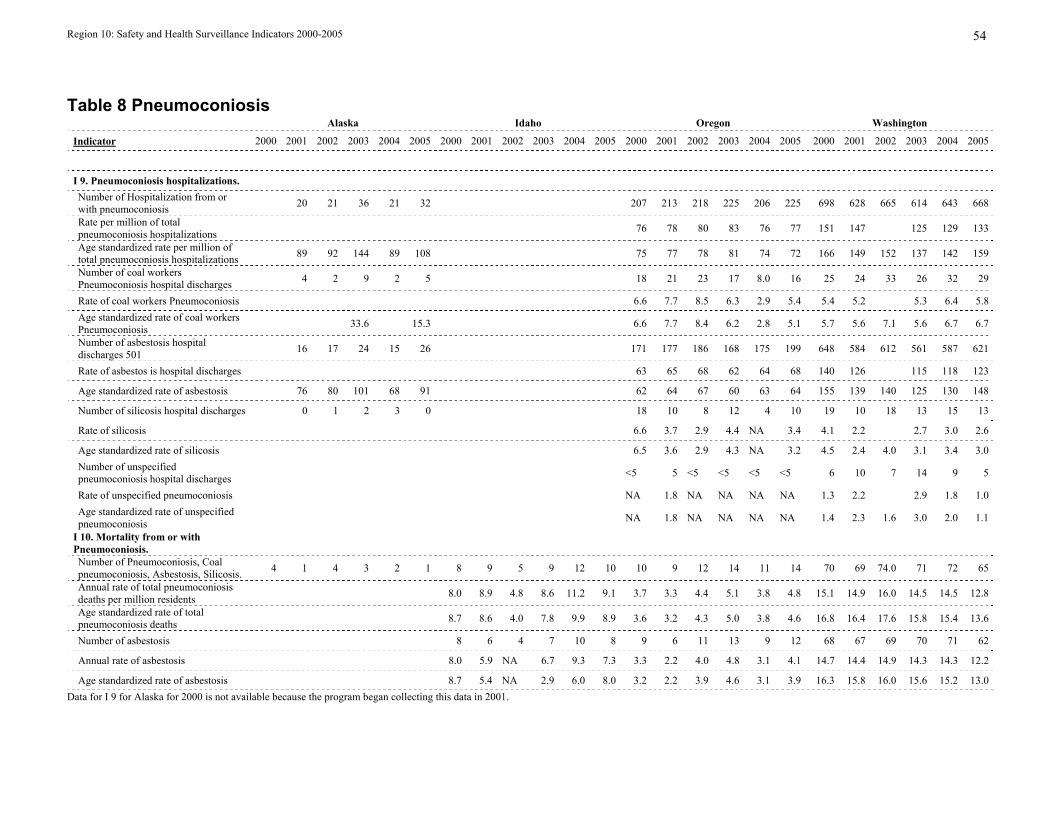
Region 10: Safety and Health Surveillance Indicators 2000-2005 54
Table 8 Pneumoconiosis Alaska Idaho Oregon Washington
Indicator 2000 2001 2002 2003 2004 2005 2000 2001 2002 2003 2004 2005 2000 2001 2002 2003 2004 2005 2000 2001 2002 2003 2004 2005
I 9. Pneumoconiosis hospitalizations. Number of Hospitalization from or with pneumoconiosis 20 21 36 21 32 207 213 218 225 206 225 698 628 665 614 643 668
Rate per million of total pneumoconiosis hospitalizations 76 78 80 83 76 77 151 147 125 129 133
Age standardized rate per million of total pneumoconiosis hospitalizations 89 92 144 89 108 75 77 78 81 74 72 166 149 152 137 142 159
Number of coal workers Pneumoconiosis hospital discharges 4 2 9 2 5 18 21 23 17 8.0 16 25 24 33 26 32 29
Rate of coal workers Pneumoconiosis 6.6 7.7 8.5 6.3 2.9 5.4 5.4 5.2 5.3 6.4 5.8 Age standardized rate of coal workers Pneumoconiosis 33.6 15.3 6.6 7.7 8.4 6.2 2.8 5.1 5.7 5.6 7.1 5.6 6.7 6.7
Number of asbestosis hospital discharges 501 16 17 24 15 26 171 177 186 168 175 199 648 584 612 561 587 621
Rate of asbestos is hospital discharges 63 65 68 62 64 68 140 126 115 118 123
Age standardized rate of asbestosis 76 80 101 68 91 62 64 67 60 63 64 155 139 140 125 130 148
Number of silicosis hospital discharges 0 1 2 3 0 18 10 8 12 4 10 19 10 18 13 15 13
Rate of silicosis 6.6 3.7 2.9 4.4 NA 3.4 4.1 2.2 2.7 3.0 2.6
Age standardized rate of silicosis 6.5 3.6 2.9 4.3 NA 3.2 4.5 2.4 4.0 3.1 3.4 3.0 Number of unspecified pneumoconiosis hospital discharges <5 5 <5 <5 <5 <5 6 10 7 14 9 5
Rate of unspecified pneumoconiosis NA 1.8 NA NA NA NA 1.3 2.2 2.9 1.8 1.0 Age standardized rate of unspecified pneumoconiosis NA 1.8 NA NA NA NA 1.4 2.3 1.6 3.0 2.0 1.1
I 10. Mortality from or with Pneumoconiosis.
Number of Pneumoconiosis, Coal pneumoconiosis, Asbestosis, Silicosis. 4 1 4 3 2 1 8 9 5 9 12 10 10 9 12 14 11 14 70 69 74.0 71 72 65
Annual rate of total pneumoconiosis deaths per million residents 8.0 8.9 4.8 8.6 11.2 9.1 3.7 3.3 4.4 5.1 3.8 4.8 15.1 14.9 16.0 14.5 14.5 12.8
Age standardized rate of total pneumoconiosis deaths 8.7 8.6 4.0 7.8 9.9 8.9 3.6 3.2 4.3 5.0 3.8 4.6 16.8 16.4 17.6 15.8 15.4 13.6
Number of asbestosis 8 6 4 7 10 8 9 6 11 13 9 12 68 67 69 70 71 62
Annual rate of asbestosis 8.0 5.9 NA 6.7 9.3 7.3 3.3 2.2 4.0 4.8 3.1 4.1 14.7 14.4 14.9 14.3 14.3 12.2
Age standardized rate of asbestosis 8.7 5.4 NA 2.9 6.0 8.0 3.2 2.2 3.9 4.6 3.1 3.9 16.3 15.8 16.0 15.6 15.2 13.0 Data for I 9 for Alaska for 2000 is not available because the program began collecting this data in 2001.
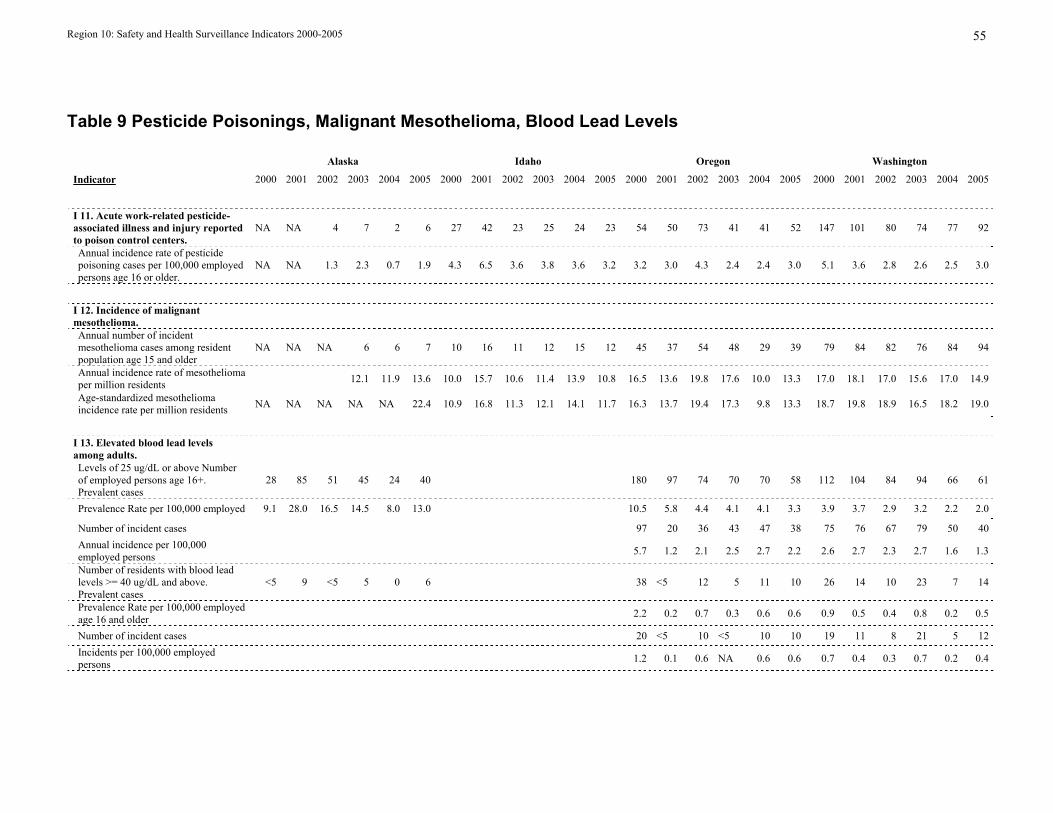
Region 10: Safety and Health Surveillance Indicators 2000-2005 55
Table 9 Pesticide Poisonings, Malignant Mesothelioma, Blood Lead Levels
Alaska Idaho Oregon Washington
Indicator 2000 2001 2002 2003 2004 2005 2000 2001 2002 2003 2004 2005 2000 2001 2002 2003 2004 2005 2000 2001 2002 2003 2004 2005
I 11. Acute work-related pesticide-associated illness and injury reported to poison control centers.
NA NA 4 7 2 6 27 42 23 25 24 23 54 50 73 41 41 52 147 101 80 74 77 92
Annual incidence rate of pesticide poisoning cases per 100,000 employed persons age 16 or older.
NA NA 1.3 2.3 0.7 1.9 4.3 6.5 3.6 3.8 3.6 3.2 3.2 3.0 4.3 2.4 2.4 3.0 5.1 3.6 2.8 2.6 2.5 3.0
I 12. Incidence of malignant mesothelioma.
Annual number of incident mesothelioma cases among resident population age 15 and older
NA NA NA 6 6 7 10 16 11 12 15 12 45 37 54 48 29 39 79 84 82 76 84 94
Annual incidence rate of mesothelioma per million residents 12.1 11.9 13.6 10.0 15.7 10.6 11.4 13.9 10.8 16.5 13.6 19.8 17.6 10.0 13.3 17.0 18.1 17.0 15.6 17.0 14.9
Age-standardized mesothelioma incidence rate per million residents NA NA NA NA NA 22.4 10.9 16.8 11.3 12.1 14.1 11.7 16.3 13.7 19.4 17.3 9.8 13.3 18.7 19.8 18.9 16.5 18.2 19.0
I 13. Elevated blood lead levels among adults.
Levels of 25 ug/dL or above Number of employed persons age 16+. Prevalent cases
28 85 51 45 24 40 180 97 74 70 70 58 112 104 84 94 66 61
Prevalence Rate per 100,000 employed 9.1 28.0 16.5 14.5 8.0 13.0 10.5 5.8 4.4 4.1 4.1 3.3 3.9 3.7 2.9 3.2 2.2 2.0
Number of incident cases 97 20 36 43 47 38 75 76 67 79 50 40 Annual incidence per 100,000 employed persons 5.7 1.2 2.1 2.5 2.7 2.2 2.6 2.7 2.3 2.7 1.6 1.3
Number of residents with blood lead levels >= 40 ug/dL and above. Prevalent cases
<5 9 <5 5 0 6 38 <5 12 5 11 10 26 14 10 23 7 14
Prevalence Rate per 100,000 employed age 16 and older 2.2 0.2 0.7 0.3 0.6 0.6 0.9 0.5 0.4 0.8 0.2 0.5
Number of incident cases 20 <5 10 <5 10 10 19 11 8 21 5 12 Incidents per 100,000 employed persons 1.2 0.1 0.6 NA 0.6 0.6 0.7 0.4 0.3 0.7 0.2 0.4
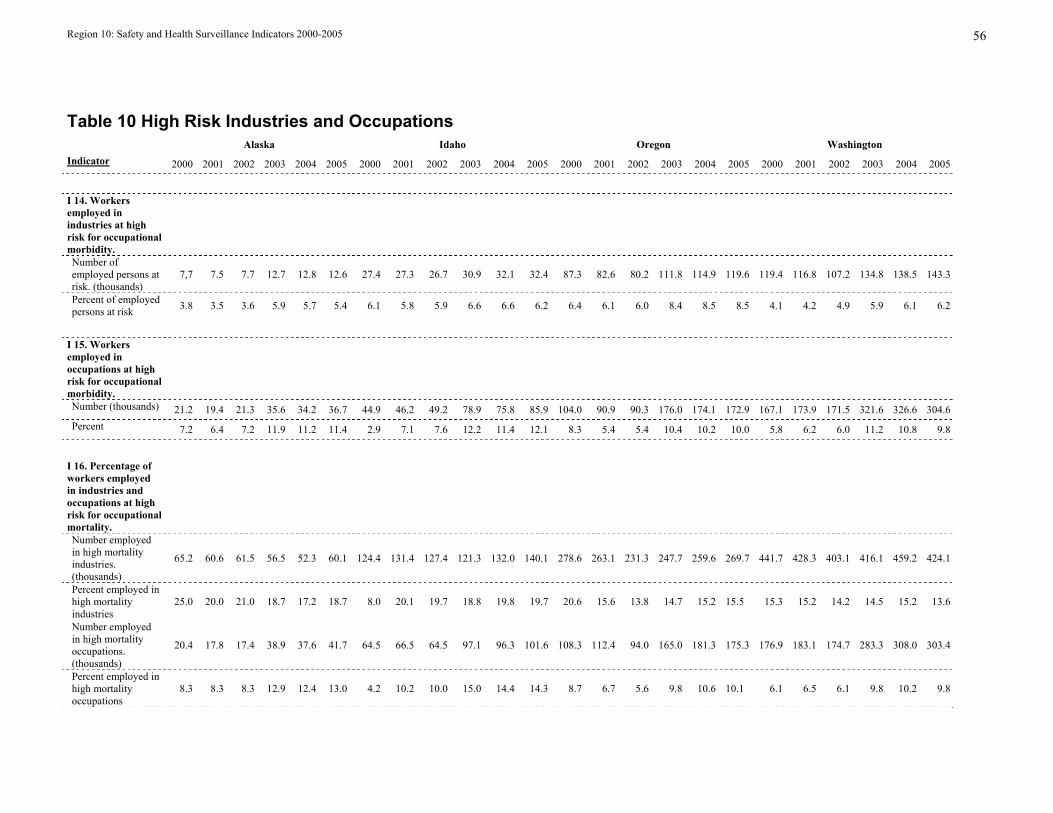
Region 10: Safety and Health Surveillance Indicators 2000-2005 56
Table 10 High Risk Industries and Occupations Alaska Idaho Oregon Washington
Indicator 2000 2001 2002 2003 2004 2005 2000 2001 2002 2003 2004 2005 2000 2001 2002 2003 2004 2005 2000 2001 2002 2003 2004 2005 I 14. Workers employed in industries at high risk for occupational morbidity.
Number of employed persons at risk. (thousands)
7,7 7.5 7.7 12.7 12.8 12.6 27.4 27.3 26.7 30.9 32.1 32.4 87.3 82.6 80.2 111.8 114.9 119.6 119.4 116.8 107.2 134.8 138.5 143.3
Percent of employed persons at risk 3.8 3.5 3.6 5.9 5.7 5.4 6.1 5.8 5.9 6.6 6.6 6.2 6.4 6.1 6.0 8.4 8.5 8.5 4.1 4.2 4.9 5.9 6.1 6.2
I 15. Workers employed in occupations at high risk for occupational morbidity.
Number (thousands) 21.2 19.4 21.3 35.6 34.2 36.7 44.9 46.2 49.2 78.9 75.8 85.9 104.0 90.9 90.3 176.0 174.1 172.9 167.1 173.9 171.5 321.6 326.6 304.6Percent 7.2 6.4 7.2 11.9 11.2 11.4 2.9 7.1 7.6 12.2 11.4 12.1 8.3 5.4 5.4 10.4 10.2 10.0 5.8 6.2 6.0 11.2 10.8 9.8
I 16. Percentage of workers employed in industries and occupations at high risk for occupational mortality.
Number employed in high mortality industries. (thousands)
65.2 60.6 61.5 56.5 52.3 60.1 124.4 131.4 127.4 121.3 132.0 140.1 278.6 263.1 231.3 247.7 259.6 269.7 441.7 428.3 403.1 416.1 459.2 424.1
Percent employed in high mortality industries
25.0 20.0 21.0 18.7 17.2 18.7 8.0 20.1 19.7 18.8 19.8 19.7 20.6 15.6 13.8 14.7 15.2 15.5 15.3 15.2 14.2 14.5 15.2 13.6
Number employed in high mortality occupations. (thousands)
20.4 17.8 17.4 38.9 37.6 41.7 64.5 66.5 64.5 97.1 96.3 101.6 108.3 112.4 94.0 165.0 181.3 175.3 176.9 183.1 174.7 283.3 308.0 303.4
Percent employed in high mortality occupations
8.3 8.3 8.3 12.9 12.4 13.0 4.2 10.2 10.0 15.0 14.4 14.3 8.7 6.7 5.6 9.8 10.6 10.1 6.1 6.5 6.1 9.8 10.2 9.8
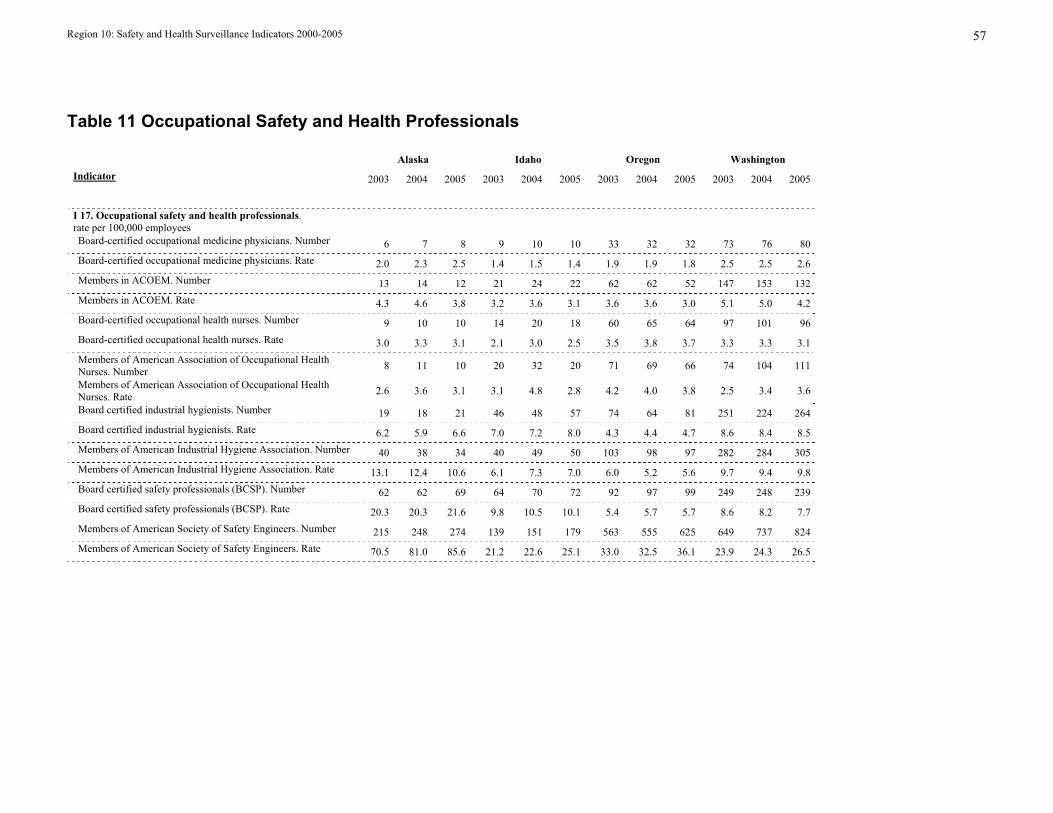
Region 10: Safety and Health Surveillance Indicators 2000-2005 57
Table 11 Occupational Safety and Health Professionals
Alaska Idaho Oregon Washington Indicator 2003 2004 2005 2003 2004 2005 2003 2004 2005 2003 2004 2005 I 17. Occupational safety and health professionals. rate per 100,000 employees
Board-certified occupational medicine physicians. Number 6 7 8 9 10 10 33 32 32 73 76 80 Board-certified occupational medicine physicians. Rate 2.0 2.3 2.5 1.4 1.5 1.4 1.9 1.9 1.8 2.5 2.5 2.6Members in ACOEM. Number 13 14 12 21 24 22 62 62 52 147 153 132Members in ACOEM. Rate 4.3 4.6 3.8 3.2 3.6 3.1 3.6 3.6 3.0 5.1 5.0 4.2Board-certified occupational health nurses. Number 9 10 10 14 20 18 60 65 64 97 101 96Board-certified occupational health nurses. Rate 3.0 3.3 3.1 2.1 3.0 2.5 3.5 3.8 3.7 3.3 3.3 3.1Members of American Association of Occupational Health Nurses. Number 8 11 10 20 32 20 71 69 66 74 104 111
Members of American Association of Occupational Health Nurses. Rate 2.6 3.6 3.1 3.1 4.8 2.8 4.2 4.0 3.8 2.5 3.4 3.6
Board certified industrial hygienists. Number 19 18 21 46 48 57 74 64 81 251 224 264Board certified industrial hygienists. Rate 6.2 5.9 6.6 7.0 7.2 8.0 4.3 4.4 4.7 8.6 8.4 8.5Members of American Industrial Hygiene Association. Number 40 38 34 40 49 50 103 98 97 282 284 305Members of American Industrial Hygiene Association. Rate 13.1 12.4 10.6 6.1 7.3 7.0 6.0 5.2 5.6 9.7 9.4 9.8Board certified safety professionals (BCSP). Number 62 62 69 64 70 72 92 97 99 249 248 239Board certified safety professionals (BCSP). Rate 20.3 20.3 21.6 9.8 10.5 10.1 5.4 5.7 5.7 8.6 8.2 7.7Members of American Society of Safety Engineers. Number 215 248 274 139 151 179 563 555 625 649 737 824Members of American Society of Safety Engineers. Rate 70.5 81.0 85.6 21.2 22.6 25.1 33.0 32.5 36.1 23.9 24.3 26.5
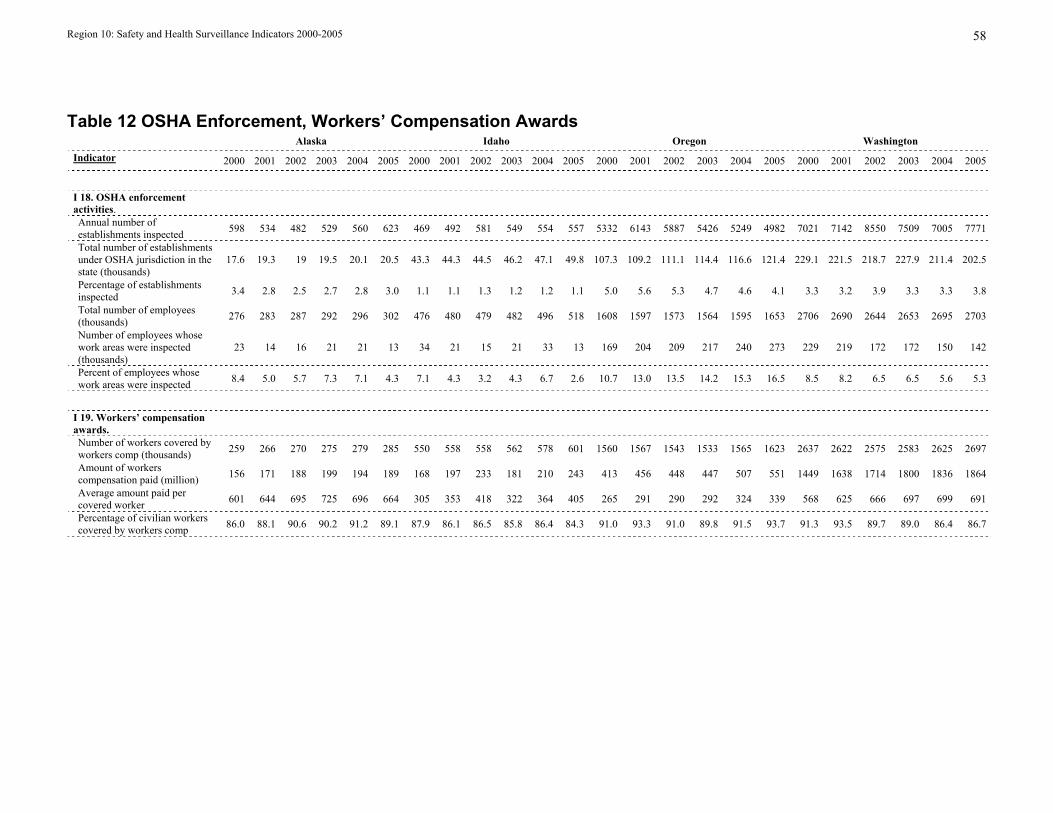
Region 10: Safety and Health Surveillance Indicators 2000-2005 58
Table 12 OSHA Enforcement, Workers’ Compensation Awards Alaska Idaho Oregon Washington
Indicator 2000 2001 2002 2003 2004 2005 2000 2001 2002 2003 2004 2005 2000 2001 2002 2003 2004 2005 2000 2001 2002 2003 2004 2005 I 18. OSHA enforcement activities. Annual number of establishments inspected 598 534 482 529 560 623 469 492 581 549 554 557 5332 6143 5887 5426 5249 4982 7021 7142 8550 7509 7005 7771
Total number of establishments under OSHA jurisdiction in the state (thousands)
17.6 19.3 19 19.5 20.1 20.5 43.3 44.3 44.5 46.2 47.1 49.8 107.3 109.2 111.1 114.4 116.6 121.4 229.1 221.5 218.7 227.9 211.4 202.5
Percentage of establishments inspected 3.4 2.8 2.5 2.7 2.8 3.0 1.1 1.1 1.3 1.2 1.2 1.1 5.0 5.6 5.3 4.7 4.6 4.1 3.3 3.2 3.9 3.3 3.3 3.8
Total number of employees (thousands) 276 283 287 292 296 302 476 480 479 482 496 518 1608 1597 1573 1564 1595 1653 2706 2690 2644 2653 2695 2703
Number of employees whose work areas were inspected (thousands)
23 14 16 21 21 13 34 21 15 21 33 13 169 204 209 217 240 273 229 219 172 172 150 142
Percent of employees whose work areas were inspected 8.4 5.0 5.7 7.3 7.1 4.3 7.1 4.3 3.2 4.3 6.7 2.6 10.7 13.0 13.5 14.2 15.3 16.5 8.5 8.2 6.5 6.5 5.6 5.3
I 19. Workers’ compensation awards.
Number of workers covered by workers comp (thousands) 259 266 270 275 279 285 550 558 558 562 578 601 1560 1567 1543 1533 1565 1623 2637 2622 2575 2583 2625 2697
Amount of workers compensation paid (million) 156 171 188 199 194 189 168 197 233 181 210 243 413 456 448 447 507 551 1449 1638 1714 1800 1836 1864
Average amount paid per covered worker 601 644 695 725 696 664 305 353 418 322 364 405 265 291 290 292 324 339 568 625 666 697 699 691
Percentage of civilian workers covered by workers comp 86.0 88.1 90.6 90.2 91.2 89.1 87.9 86.1 86.5 85.8 86.4 84.3 91.0 93.3 91.0 89.8 91.5 93.7 91.3 93.5 89.7 89.0 86.4 86.7