occupational injury rates and severity among minor, young-adult, and adult workers — washington...
TRANSCRIPT
Occupational injury rates and severity among minor,
young-adult, and adult workers — Washington
State, 2005–2007
Eric Jalonen, MPH
WA State Department of Labor and Industries
Safety and Health Assessment and Research for Prevention Program (SHARP)
Phone: 360-902-6751 Email: [email protected]
Disclaimer:
The findings and conclusions in this report are those of the author(s) and do not necessarily represent the official position of the Centers for Disease Control and Prevention.

Topics of Presentation:
1. Brief history of regulations for young worker
2. Washington State Department of Labor and Industries
3. Differences in injury rates and injury severity by age population within Washington State from 2005 - 2007

History of Young Workers
Fish cutters, Maine

1830s: laws restricting young workers
1904: National Child Labor Committee
1908-1912: Lewis Hines photographs child labor conditions
Replacing empty bobbins at Bibb Mill No. 1; Macon, GA

Six-year-old cotton picker, Comanche County Oklahoma
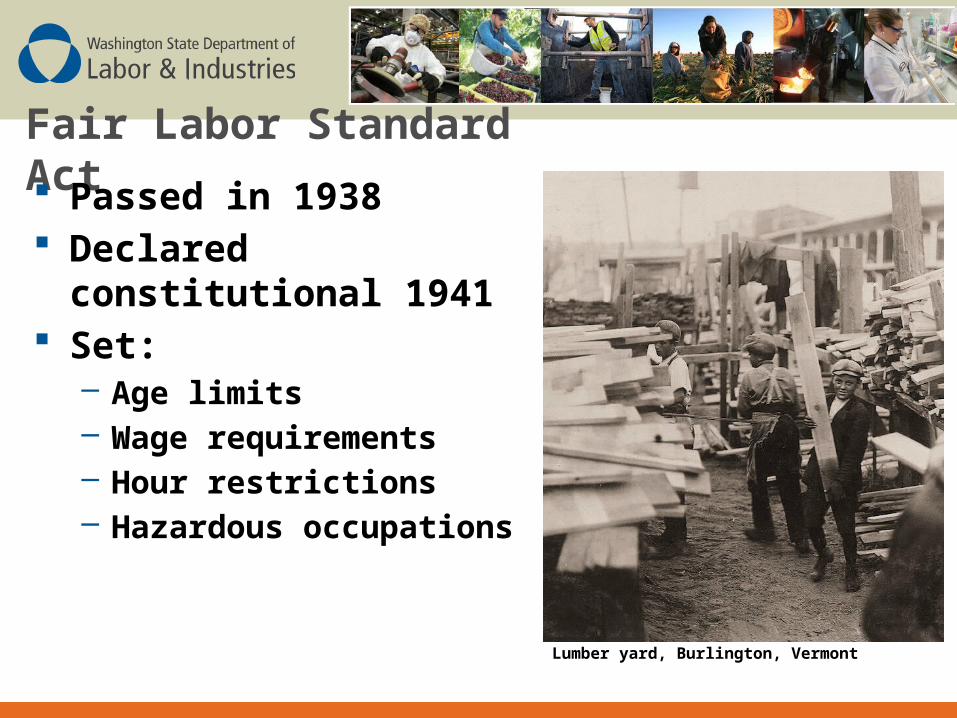
Fair Labor Standard Act Passed in 1938 Declared constitutional
1941 Set:
– Age limits– Wage requirements– Hour restrictions– Hazardous occupations
Lumber yard, Burlington, Vermont
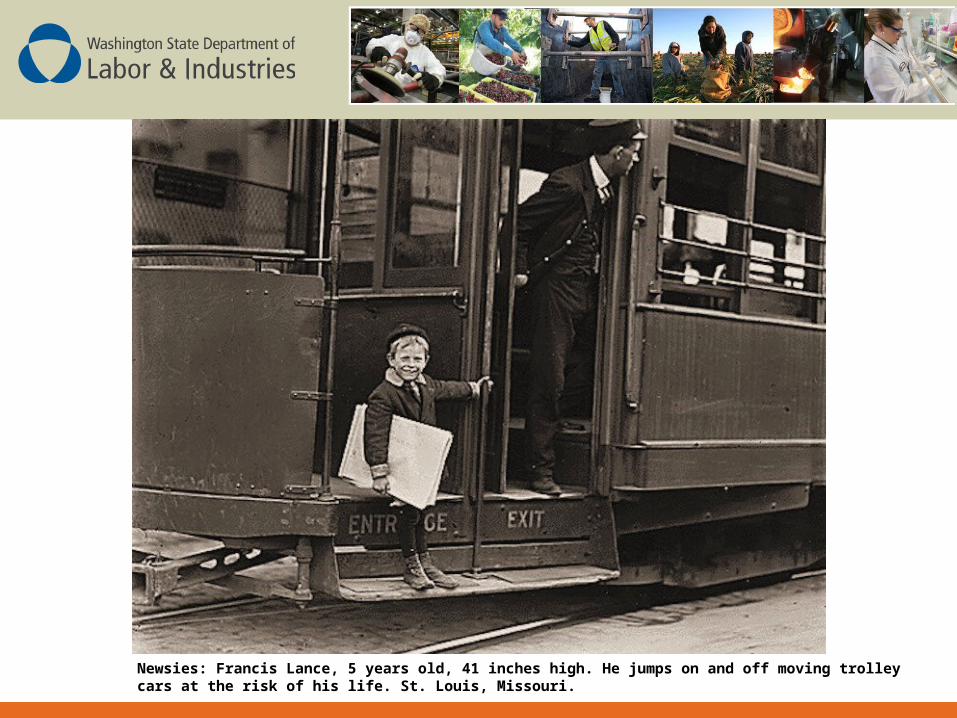
Newsies: Francis Lance, 5 years old, 41 inches high. He jumps on and off moving trolley cars at the risk of his life. St. Louis, Missouri.

Washington’s Regulations Under 18 years old:
– Work permit
– Parent and school permission
– Restricted job duties
– Restricted job hours
– Wage requirements View of the Ewen Breaker of the Pennsylvania Coal Co. South Pittston, Pennsylvania
Bowling alley boys, New Haven, Connecticut

Washington State Department of Labor & Industries
Three divisions:− State OSHA Program− Insurance Services (Workers’ Compensation)− Employment Standards
Prevention Activities− Consultation services− Identification of new hazards− Targeted prevention programs
− Injured Young Worker Speaker Series
− Social marketing campaigns

Young Worker Injuries in Washington
From 1988-1991– 17,800 claims for 11-17 year olds– 89 % of claims between ages 16-17 years old– Lacerations most common type of injury– 3 occupational fatalities
16-17 year olds accepted claims rate almost double that of 18 and older.1
– Males higher rates than females
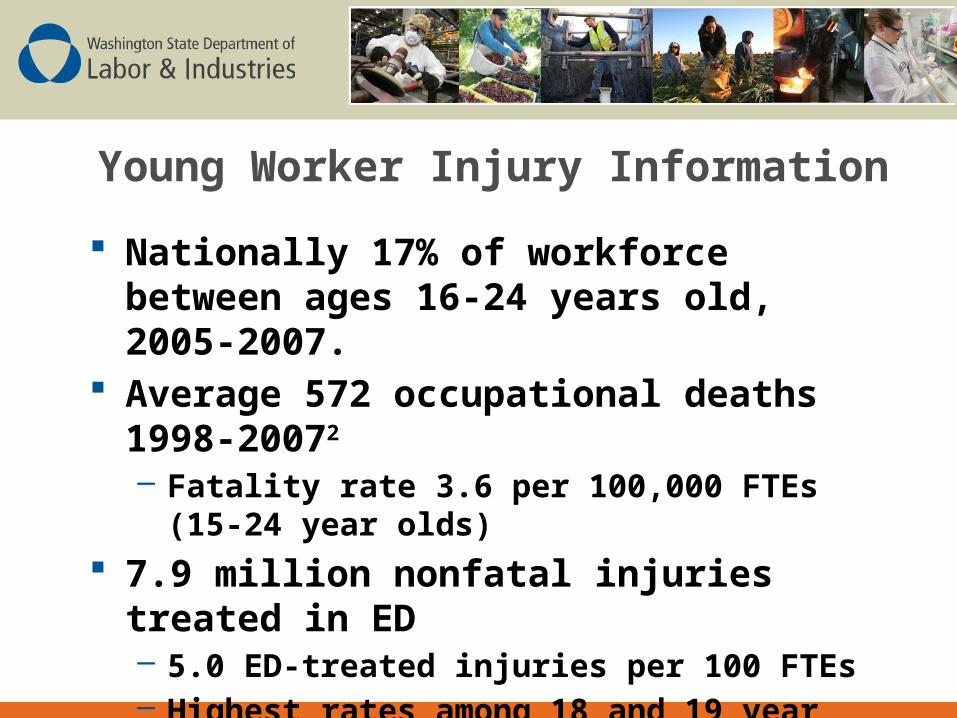
Young Worker Injury Information Nationally 17% of workforce between ages
16-24 years old, 2005-2007. Average 572 occupational deaths 1998-
20072
– Fatality rate 3.6 per 100,000 FTEs (15-24 year olds)
7.9 million nonfatal injuries treated in ED– 5.0 ED-treated injuries per 100 FTEs– Highest rates among 18 and 19 year old
workers

SHARP Research
Injury rates and injury severity for young workers compared to older workers
Methods– WA State Workers’ Compensation Data– American Community Survey
• Select Industries• Reside and work in Washington

Constru
ctio
n
Resta
urant/F
ood Ser
vice
Groce
ry S
tore
s
Amuse
men
t/Gam
bling/R
ecre
atio
n
Depar
tmen
t/Dis
count S
tore
s
All Oth
er In
dustrie
s
All In
dustrie
s Com
bined
0
500
1000
1500
2000
2500
3000
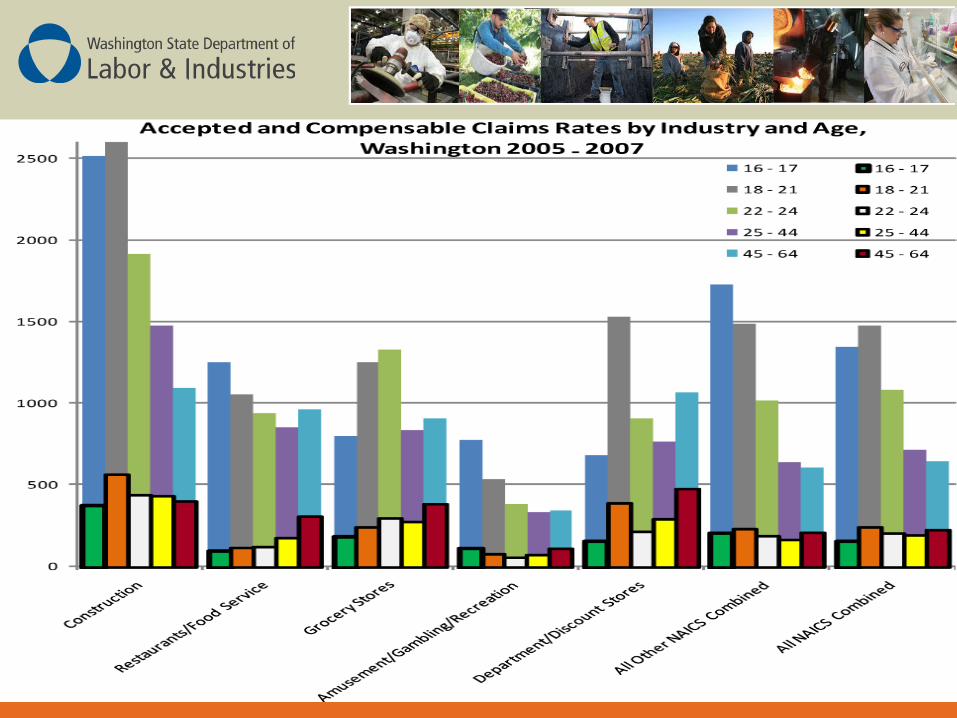
Results: Accepted Claims Rate by Industry and Age, Washing-ton 2005-2007
16-17
18-21
22-24
25-44
45-64
Industry
Rat
e p
er 1
0,00
0 F
TE
s
Age (Years)
Constru
ctio
n
Resta
urant/F
ood Ser
vice
Groce
ry S
tore
s
Amuse
men
t/Gam
bling/R
ecre
atio
n
Depar
tmen
t/Dis
count S
tore
s
All Oth
er In
dustrie
s
All In
dustrie
s Com
bined
0
100
200
300
400
500
600
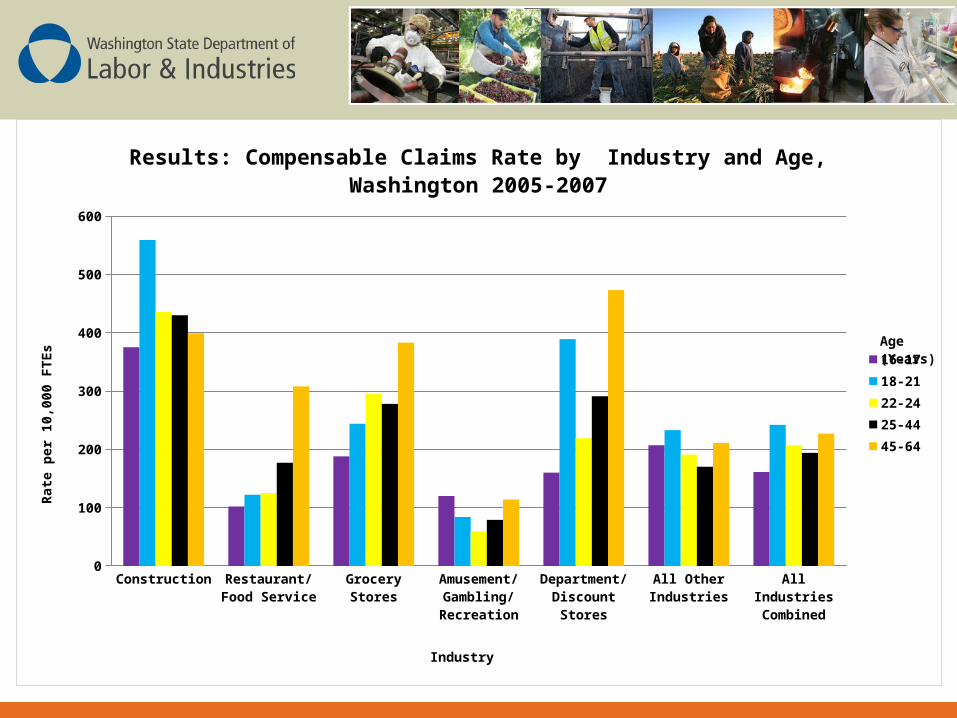
Results: Compensable Claims Rate by Industry and Age, Washington 2005-2007
16-17
18-21
22-24
25-44
45-64
Industry
Rat
e p
er 1
0,00
0 F
TE
s
Age (Years)
Constru
ctio
n
Resta
urant/F
ood Ser
vice
Groce
ry S
tore
s
Amuse
men
t/Gam
bling/R
ecre
atio
n
Depar
tmen
t/Dis
count S
tore
s
All Oth
er In
dustrie
s
All In
dustrie
s Com
bined
0
20
40
60
80
100
120
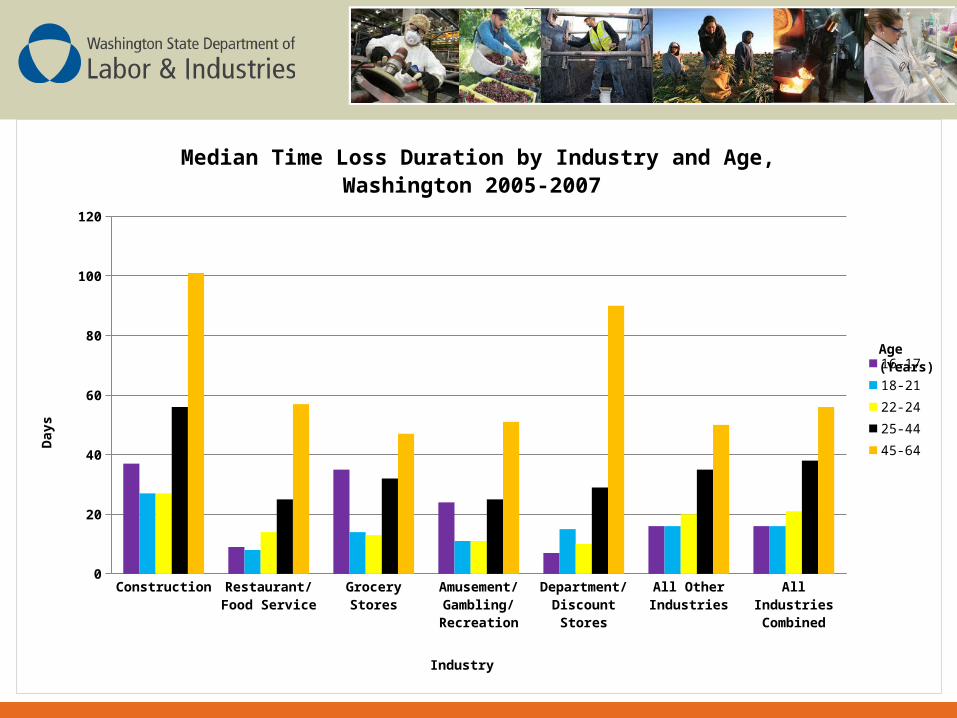
Median Time Loss Duration by Industry and Age, Washington 2005-2007
16-17
18-21
22-24
25-44
45-64
Industry
Day
s
Age (Years)
Const
ruct
ion
Resta
uran
ts/F
ood
Servic
e
Groce
ry S
tore
s
Other
Am
usem
ent
Depar
tmen
t/Disc
ount
Sto
res
All Oth
er In
dust
ries
All Ind
ustri
es C
ombin
ed$0
$2,000
$4,000
$6,000
$8,000
$10,000
$12,000
$14,000
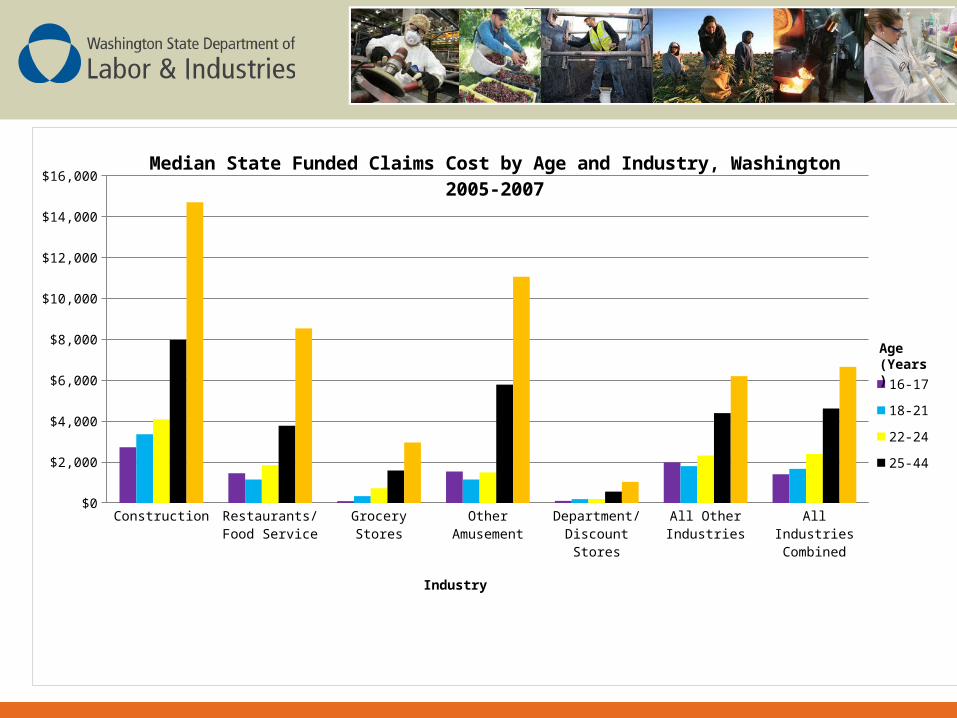
$16,000Median State Funded Claims Cost by Age and Industry, Washington 2005-2007
16-17
18-21
22-24
25-44
45-64
Industry
Age (Years)

16-17 18-21 22-24 25-44 45-640
5
10
15
20
25
30
35
40
45
50
Percentage of State Funded Compensable Claims Costs for Age Group by Industry, Washington 2005-2007
Department/Discount Stores
Other Amusement
Grocery Stores
Restaurants/Food Service
Construction
Age Group (Years)
Per
cen
t

Limitations
Denominator data
Self-insured cost information
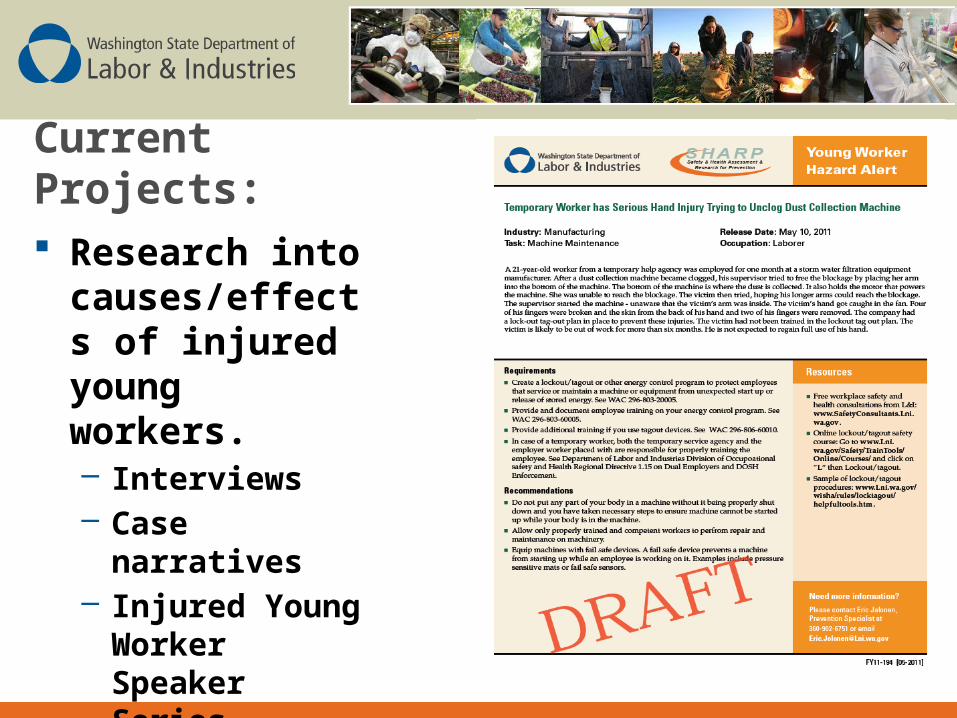
Current Projects:
Research into causes/effects of injured young workers.– Interviews– Case narratives– Injured Young
Worker Speaker Series

Future Research Topics
Effectiveness of restricted duties
Alternative outreach activities– Social marketing and gaming
Social behaviors of young workers– Are they more likely involved in risk taking
behaviors than nonworking peers?
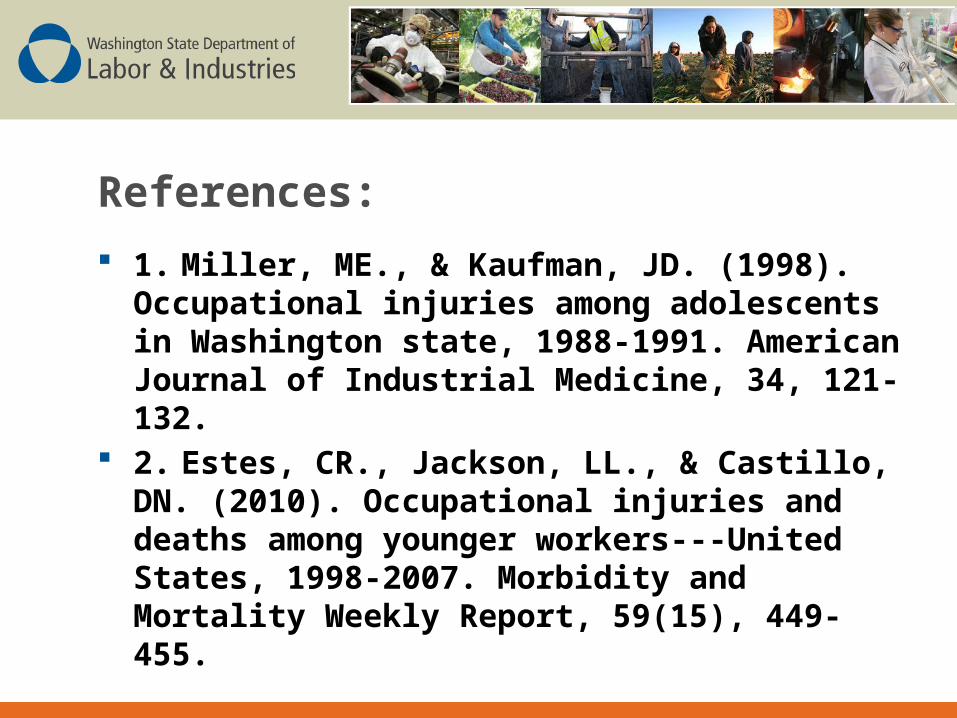
References:
1. Miller, ME., & Kaufman, JD. (1998). Occupational injuries among adolescents in Washington state, 1988-1991. American Journal of Industrial Medicine, 34, 121-132.
2. Estes, CR., Jackson, LL., & Castillo, DN. (2010). Occupational injuries and deaths among younger workers---United States, 1998-2007. Morbidity and Mortality Weekly Report, 59(15), 449-455.

Acknowledgements
Dave Bonauto Darrin Adams Eddy Rauser Xenofon Moniodis Todd Schoonover Jena Pratt Lisa Pogue Fabiola Gonzalez
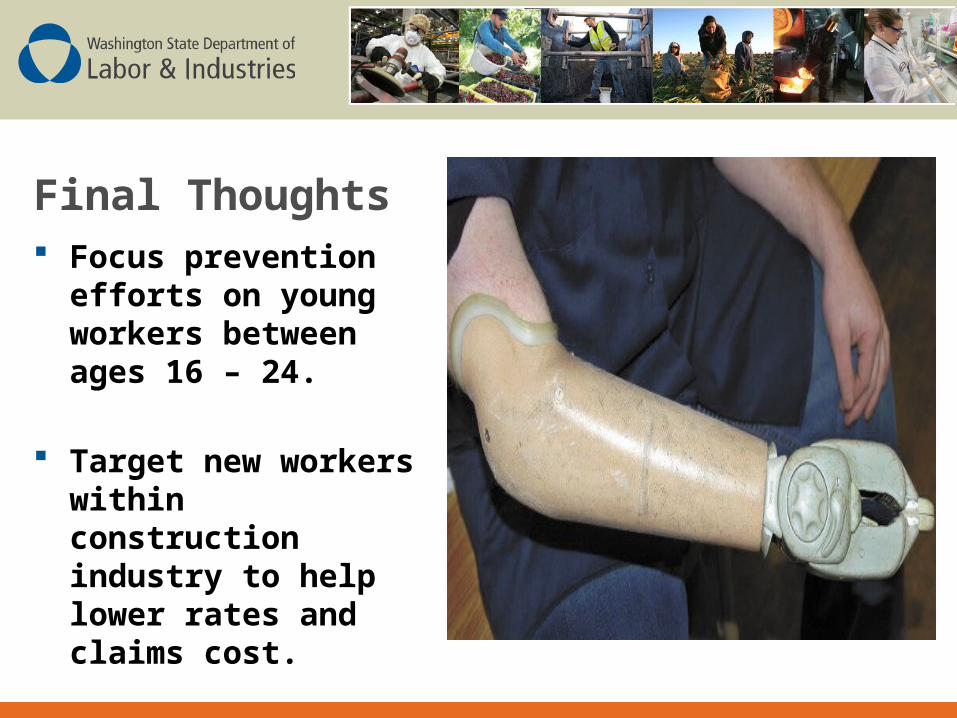
Final Thoughts Focus prevention
efforts on young workers between ages 16 – 24.
Target new workers within construction industry to help lower rates and claims cost.