occupational segregation and the gender wage gap: a job
TRANSCRIPT

Occupational
Segregation
and the
Gender
Wage Gap: A
Job Half
Done
Ariane Hegewisch and
Heidi Hartmann
January 2014

ii
About this Report
This report was prepared by the Institute for Women’s Policy Research (IWPR) as a part of a series of
Scholars’ Papers sponsored by the U.S. Department of Labor Women's Bureau in commemoration of the
50th Anniversary of American Women: Report of the President’s Commission on the Status of Women,
1963.
About the Institute for Women’s Policy Research
The Institute for Women’s Policy Research (IWPR) conducts rigorous research and disseminates its
findings to address the needs of women, promote public dialogue, and strengthen families, communities,
and societies. IWPR works with policymakers, scholars, and public interest groups to design, execute, and
disseminate research that illuminates economic and social policy issues affecting women and their
families, and to build a network of individuals and organizations that conduct and use women-oriented
policy research. The Institute’s work is supported by foundation grants, government grants and contracts,
donations from individuals, and contributions from organizations and corporations. IWPR is a 501(c)(3)
tax-exempt organization that also works in affiliation with the women’s studies and public policy and
public administration programs at The George Washington University.
Acknowledgements
The authors wish to thank Jeffrey Hayes and Hannah Liepmann for their valuable contributions to the
analyses conducted for this report. The authors would also like to thank the staff of the U.S. Department
of Labor Women's Bureau for their support and careful comments on an earlier version of this report.

iii
Table of Contents Occupational Segregation and the Gender Wage Gap .................................................................................. 1
Historical Trends in the Gender Composition of Individual Occupations ................................................ 2
Trends in Occupational Segregation ......................................................................................................... 4
Occupational Segregation by Race and Gender .................................................................................... 7
Occupational Segregation and Different Generations of Women ......................................................... 9
Earnings and Occupational Segregation ................................................................................................. 11
Discussion and Conclusions ................................................................................................................... 16
References ................................................................................................................................................... 21
Figures and Tables Figure 1: Women’s Share of Selected Occupations, 1972 to 2012 ............................................................... 3
Figure 2. The Index of Occupational Dissimilarity, 1972 - 2011 ................................................................. 6
Figure 3. The Index of Occupational Gender Dissimilarity Within the Largest Race/Ethnicity Groups,
1972 - 2011 ................................................................................................................................................... 8
Figure 4: The Index for Occupational Segregation for Different Generations, at Ages 25, 45, and 65...... 10
Figure 5: Change in the Index of Occupational Segregation and the Gender Earnings Ratio,
1979 to 2012 ............................................................................................................................................... 12
Table 1. Women’s and Men’s median hourly earnings and wage gaps by skill level and gender
composition, 2010 ....................................................................................................................................... 14
Figure 6: Median Hourly Earnings in Predominantly Female Occupations as a Percent of Median Hourly
Earnings in Predominantly Male Occupations by Broad Skill Level, for Women and Men, 2010 ............ 15

1
Occupational Segregation and the Gender Wage Gap
The 1963 report of the President’s Commission on the Status of Women states: “The difference in
occupational distribution of men and women is largely responsible for the fact that in 1961, the
earnings of women working full time averaged only about 60 percent of those of men working
full time.”
The formal barriers that characterized much of the labor market for women in the 1960s have long gone.
Colleges and universities are no longer permitted to artificially restrict women’s entry to educational
programs, Black women are as entitled to access to education and jobs as White women, and the days
when employers were able to openly advertise a job just for women, or just for men, are a distant
memory. Women are astronauts, Supreme Court justices, wind turbine engineers, four-star generals,
university presidents, and a female economist is Chairperson of the Board of Governors of the US Federal
Reserve System, the first central bank in an OECD country to be headed by a woman. Almost every
second worker is a woman. Yet even though women have undoubtedly advanced toward economic
equality during the last fifty years, women’s median annual earnings for full-time work are still only 76.5
percent of men’s, and marked differences in the occupational distribution of men and women continue to
characterize the labor market. The Great Recession of 2007 to 2009, with its differential impact on
women’s and men’s job loss and unemployment, provided a vivid illustration of the continued weight of
gender segregation in employment. According to the Carl D. Perkins Vocational and Technical
Education Act of 2006 (Perkins IV) and the Workforce Investment Act of 1998 (WIA), the term
“nontraditional fields” means occupations or fields of work for which individuals of one gender
comprise less than 25 percent of individuals employed in each such occupation or field of work. In 2012,
nontraditional occupations for women employed only six percent of all women, but 44 percent of all men.
The same imbalance holds for occupations that are nontraditional for men; these employ only 5 percent of
men, but 40 percent of women (Hegewisch and Matite 2013). Gender segregation is also substantial in
terms of the broad sectors where men and women work: three in four workers in education and health
services are women, nine in ten workers in the construction industry and seven in ten workers in
manufacturing are men (U.S. Bureau of Labor Statistics 2013).
This paper begins by reviewing trends in occupational segregation during the past several decades,
showing that after significant change during the 1980s and early 1990s, further progress in occupational
integration has stalled across the board during the last decade for women and men with different levels of
education, in different race/ethnic groups, and in different age cohorts. Just as there has been no progress
in occupational integration during the 2000s, there has been no further progress towards equal pay, with
the two trends showing an inverse relationship over time (as job segregation declined, equal pay
increased). While this paper finds a clear wage penalty for work in predominantly female occupations, for
both women and men, it also finds that this earnings penalty differs significantly between highly skilled
and other occupations. The paper ends with a discussion of possible explanations of these findings and
recommendations for policy change.

2
Historical Trends in the Gender Composition of Individual Occupations
Since the publication in 1963 of the report of the President’s Commission on the Status of Women, the
American workforce and American families have changed dramatically. In 1963, women were one third
of all workers, the majority of women were not in the labor force, marriage – and certainly motherhood –
meant an exit from paid work for women who could afford to do so, and women were less likely than
men to have post-secondary education. With the passage of the Equal Pay Act of 1963 and Title VII of
the Civil Rights Act of 1964, outright discrimination in pay and employment more generally became
illegal, while Title IX of the Education Amendments of 1972 prohibited sex discrimination in any
education program or activity at institutions receiving Federal financial assistance. In the decades that
followed women made huge strides. By 1978 women earned the majority of Associate’s Degrees, and by
1982, the majority of Bachelor’s Degrees.1 The labor force participation rate for mothers of children aged
three years or younger (60.9 percent in 2011) is higher now than the labor force participation rate for all
women in 1970 (43.3 percent; U.S. Department of Labor 2013 Tables 2,7). Among workers aged 18 to
65 years, the gap in female and male participation rates roughly halved every twenty years, from 49
percentage points in 1960, to 27 percentage points in 1980 and 13 percentage points in 2000; in 2010 it
remained relatively stable, falling only to 11.7 percent.2
In 1960, only 15 percent of managers were female; 40 years later, women are 38 percent of those in
management jobs, and a higher proportion of women than men work in managerial and professional
occupations (41.2 percent compared with 34.4 percent; U.S. Department of Labor BLS 2013). Women’s
share of lawyers increased from 4 percent in 1972 to 32 percent in 2012; for physicians and surgeons,
from 10 to 34 percent, and for pharmacists from 28 to 54 percent (Figure 1). Women were fewer than 10
percent of accounting majors at universities in the 1960s,; by the mid 1980s they were the majority of
graduates in the field, and now women are more than 60 percent of ‘accountants and auditors.’ While
racial and ethnic disparities continue to be characteristic of the labor market, women of color have also
seen significant improvement in job opportunities. In 1960, more than 40 percent of Black women were
employed in just two occupations – ‘personal service’ and ‘housekeepers, maids, butlers, stewards and
lodging quarter cleaners,’ and one in five Hispanic women worked in just two occupations in
manufacturing – ‘Machine operators, not elsewhere classified (n.e.c.)’ and ‘Other precision, apparel and
fabric workers.’3 Forty years later, more than one third of Black women (34 percent) and one quarter of
Hispanic women (25 percent) work in ‘management, professional and related occupations.’
1 IWPR calculation based on National Center for Education Statistics “Degrees conferred by Degree-granting
Institutions, by level of degree and sex of student” in Snyder and Dillow 2013
2 IWPR analysis of CPS-ASEC (King et al 2010);
3 IWPR analysis of Census data based on IPUMS, as provided by Ruggles et al 2010.

3
Figure 1: Women’s Share of Selected Occupations, 1972 to 2012
Notes: Data refer to annual averages for all persons employed aged 16 years and older.
Source: IWPR compilation based on the U.S. Department of Labor, Bureau of Labor Statistics, “B-20. Employed persons by detailed occupation, sex, and race,
1972-81;” “Employed persons by detailed occupation, sex, and race (1982);” “Employed persons by detailed occupation and sex, 1983-2002 annual averages;”
“Table 11. Employed persons by detailed occupation, sex, race, and Hispanic or Latino ethnicity.” 2003 onwards. Data are from the Current Population Survey.
0
10
20
30
40
50
60
70
80
90
100
1972 1974 1976 1978 1980 1982 1984 1986 1988 1990 1992 1994 1996 1998 2000 2002 2004 2006 2008 2010 2012
Pre/kindergarten teachers
Dental assistants
Registered nurses
Librarians
Cashiers
Bus Drivers
Pharmacists
Photographers
Mail carriers, post office
Physicians and surgeons
Lawyers
Computer programmers
Civil engineers
Carpenters
4
Yet while women have fanned out into many new fields in management and professional occupations,
their comparative concentration in healthcare, care work, and education and their underrepresentation in
craft and technical occupations has not changed. In 2011, more than one in five women (22 percent)
worked in ‘health care and social assistance’. One in seven women (13.5 percent), but only one in twenty
men (5.5 percent), worked in educational services.4 The largest occupations for women – secretaries,
teachers, nurses and ‘nursing, psychiatric, and home health aides’ — are each at least 80 percent female
(Hegewisch and Matite 2013). There has been remarkably little change in the gender balance of some of
the most common occupations for either women or men during the last forty years. Women were more
than nine in ten pre-school and kindergarten teachers, hair dressers and cosmetologists, and dental
hygienists in 1972, and they are more than nine in ten now. Men’s share of nursing has quadrupled since
1972, but nine in ten nurses are still women. Carpentry, one of largest occupations for men, has always
been at least 97 percent male (Figure 1). Yet, as shown in Figure 1, several not already mentioned
common occupations, such as mail carriers and photographers, have become integrated or become more
heavily female, e.g. bus drivers, in the earlier years and then remained about 50-50.
Change in the gender composition of occupations is of course not linear and can run in any direction. As
can be seen in Figure 1 above, some occupations have seen considerable change in their gender
composition over time, others hardly any change at all, and others, such as the occupation of computer
programmer, saw an increase, followed by a decline in women’s share of the job. In the early 1970s,
when computing was still in its relative infancy, women’s share of the profession was considerably higher
than their share of other professional occupations, and for the next two decades, the share of women in
computer programming steadily increased, up to more than one-third of workers in the occupation. Yet
beginning in the early 1990s women’s share of this occupation began to decline, and by 2007, computer
programming once again had become a nontraditional occupation for women, with women accounting for
fewer than one in four workers in that occupation. Computing occupations together account for half of all
Science, Technology, Engineering, and Mathematics (STEM) related occupations; women are only 27
percent of all computing workers (Landivar 2013).
Trends in Occupational Segregation
Highlighting change in individual occupations provides a somewhat arbitrary snapshot of change in the
gender composition of occupations. A more comprehensive analysis of occupational segregation is
provided by constructing the Index of Occupational Dissimilarity. The index, based on a methodology
developed by Duncan and Duncan (1955) to measure racial segregation in neighborhoods, compares the
share of women in each individual occupation to the share of women in the labor force overall and then
calculates how many women (or men) would have to change occupations to get to a state where each
individual occupation had the same gender distribution as the economy overall; occupations are weighted
by their share of the overall workforce (see Blau and Hendricks 1979). A value of 1 of the index would
4 U.S. Department of Labor Bureau of Labor Statistics 2013. Women in the Labor Force: A Databook; Table 13
5
suggest that an occupation is completely segregated, and a value of 0, that an occupation has the same
gender balance as total employment.
Figure 2 below is based on data for 389 occupations covering the entire civilian labor force and uses a
crosswalk developed by Meyer and Osborne (2005) to compare occupations over time based on the 1990
occupational reclassification. Generating occupational crosswalks across years and changing definitions
provides a broader analysis of occupational segregation than is available in any one year (in 2012, the
U.S. Bureau of Labor Statistics listed more than 500 occupations). Research has variously found that
gender segregation is more marked the more detailed the classifications of occupations are (see for
example Bayard, Hellerstein, Neumark, and Troske, 2003; Bellas and Coventry, 2001; Brummund, Liu
2013; and Groshen, 1991) and hence, if anything, the following analysis may underestimate actual levels
of segregation (since to ensure data compatibility across years, a number of occupations had to be
combined, reducing the level of detail). Data are shown for all workers, as well as separately for workers
with at least a Bachelor’s Degree and for workers with less than a Bachelor’s Degree, all aged 25-64. The
index suggests a substantial decline in occupational segregation over time for all workers. Between 1972
and 2011, the index fell from close to 0.68 in 1972 to 0.50 in 2011, a substantial change, yet still very far
from gender integration. According to this measure of occupational segregation, in 2011 half of women or
men would still have to change occupations for there to be true gender parity across occupations.
The index also shows marked differences in the extent of change among different decades. The decline in
the index was strongest during the 1980s, change was more moderate during the 1990s, and there was
virtually no further improvement towards integration during the 2000s (Figure 2).

6
Figure 2. The Index of Occupational Dissimilarity, 1972 - 2011
Notes: The analysis is restricted to the civilian labor force, and to workers aged 25 to 64. Occupations are
consistently classified according to 1990 Census occupational classifications.
Source: Authors' compilations based on the Current Population Survey, March/Annual Social and Economic
Supplement (ASEC), as provided by King et al., (2010).
A change in the value of the index can reflect a change in the gender composition of individual
occupations or a change in the labor force’s mix of more and less integrated occupations among all
occupations (Blau and Hendricks 1979). Holding everything else constant, the index will decline when
more women move into occupations where they are underrepresented, such as in construction (called the
‘composition’ effect by Blau and Hendricks), but also when the share of occupations where they are
underrepresented, such as construction worker, declines as a proportion of all workers (called the ‘mix’
effect). Estimating the contribution of the composition and the mix effects separately5 finds that the
composition effect was negative in each of the four decades, albeit to a declining extent; that is, in each of
the four decades, on balance individual occupations have become more gender integrated. Other things
held equal, a negative value for the composition effect leads to a decline in the value of the index.
However, the composition effect has become much weaker over time and has become almost zero during
the 2000s. The mix effect, on the other hand, was positive in each of the decades as less integrated
occupations (such as nursing and other healthcare occupations) have seen particularly strong growth
(Hegewisch and Liepmann 2013), and this faster growth of more segregated occupations would have
raised the index, had the increased integration of many individual occupations not been occuring
simultaneously.
5 The analysis follows the methods developed by Blau and Hendricks (1979).
0.00
0.10
0.20
0.30
0.40
0.50
0.60
0.70
0.80
0.90
1.00
1972 1976 1980 1984 1988 1992 1996 2000 2004 2008
Ind
ex
of
Dis
sim
ila
rity
Less than 4 years of college
Civilian labor force
At least 4 years of college
7
Figure 2 also shows that while there has been a move towards greater gender integration across all major
levels of educational attainment, women and men with at least a four-year college degree are considerably
more likely to work in more integrated occupations than women and men with lower levels of education .
There has been much less change towards gender integration for workers with Associate’s Degrees than
for workers with Bachelor’s Degrees, a trend also noted in earlier studies (Cotter, Hermsen and
Vannemann 2004; Jacobs 2003). In 1970, the index for men and women with Associate’s Degrees was
0.64, at that time a lower (more integrated) level than for workers with Bachelor’s Degrees (0.71). By
2010, the index for the former had fallen only to 0.59, while the index for the latter had fallen to 0.44.6
Nevertheless, overall the trends have been similar during the last few decades: further movement towards
greater integration stalled from the late 1990s onwards. As Jacobs (2003) noted, the stalling in
occupational integration for college-educated persons followed change in the gender composition of
college majors which, after a 20-year trend towards greater integration that began in the early 1960s,
slowed markedly during the late 1980s and came to a complete stop in the 1990s.
Occupational Segregation by Race and Gender
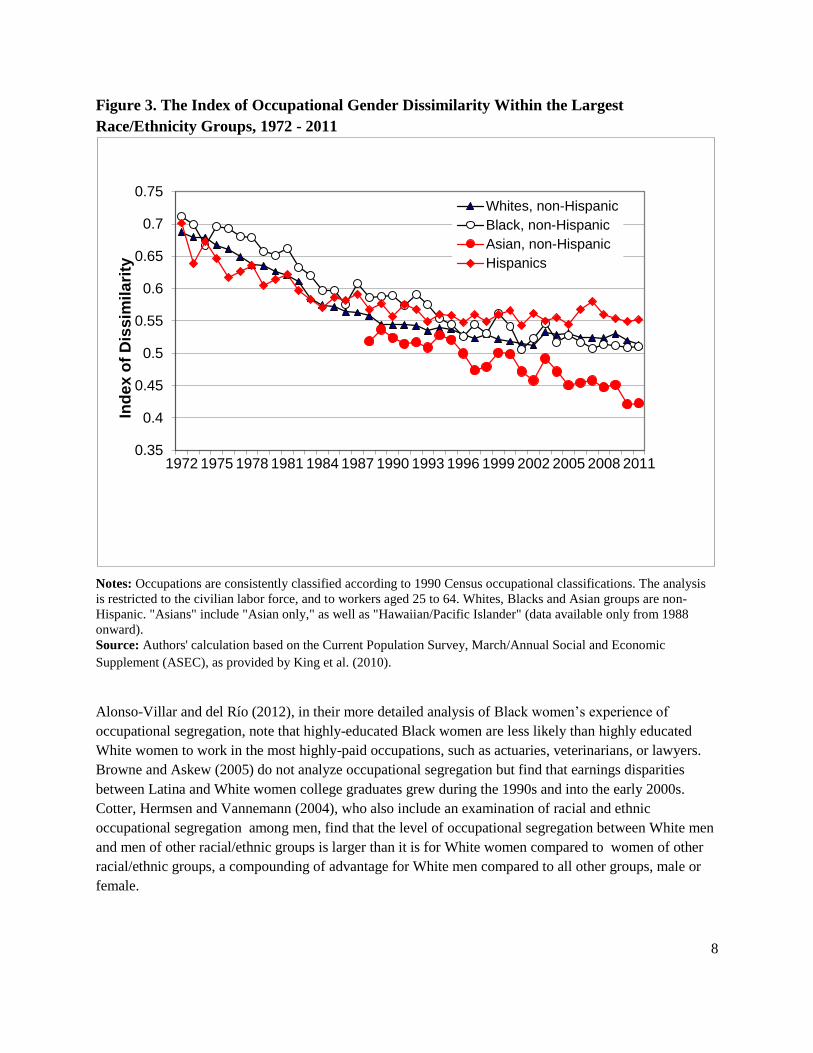
The movement towards greater gender integration, followed by a slowdown in further change, is also
clearly discernible for women and men of each of the largest racial/ethnic groups. Figure 3 below shows
the index for women and men within each broad racial/ethnic group. Hispanic men and women are the
least likely to work in the same occupations, Asian American men and women, the most likely. The
differences among groups closely correlate to differences in gender integration for persons with different
levels of education. Asian Americans are the racial/ethnic group most likely to have a four-year college
degree, Hispanics, least likely. Gender segregation between Black female and male workers was
considerably higher than among White female and male workers during the first two decades, but the
indices of gender segregation have converged for these two racial groups during the most recent decade.
Overall, occupational segregation by gender is much stronger than occupational segregation by race.
Women are more likely to work in occupations with other women, irrespective of their race, than they are
to work with men of their own race or ethnicity. That said, segregation by race and ethnicity is still
considerable. For example, the value of the Index of Segregation between all Black and White women
was 0.28; between Hispanic and White women and between Asian American and White women it was
0.30 (Hegewisch and Liepmann 2013). .
6 IWPR analysis of workers aged 25 to 64 years and older, based on analysis of the Current Population Survey,
March/Annual Social and Economic Supplement (ASEC), as provided by King et al., (2010).
8
Figure 3. The Index of Occupational Gender Dissimilarity Within the Largest
Race/Ethnicity Groups, 1972 - 2011
Notes: Occupations are consistently classified according to 1990 Census occupational classifications. The analysis
is restricted to the civilian labor force, and to workers aged 25 to 64. Whites, Blacks and Asian groups are non-
Hispanic. "Asians" include "Asian only," as well as "Hawaiian/Pacific Islander" (data available only from 1988
onward).
Source: Authors' calculation based on the Current Population Survey, March/Annual Social and Economic
Supplement (ASEC), as provided by King et al. (2010).
Alonso-Villar and del Río (2012), in their more detailed analysis of Black women’s experience of
occupational segregation, note that highly-educated Black women are less likely than highly educated
White women to work in the most highly-paid occupations, such as actuaries, veterinarians, or lawyers.
Browne and Askew (2005) do not analyze occupational segregation but find that earnings disparities
between Latina and White women college graduates grew during the 1990s and into the early 2000s.
Cotter, Hermsen and Vannemann (2004), who also include an examination of racial and ethnic
occupational segregation among men, find that the level of occupational segregation between White men
and men of other racial/ethnic groups is larger than it is for White women compared to women of other
racial/ethnic groups, a compounding of advantage for White men compared to all other groups, male or
female.
0.35
0.4
0.45
0.5
0.55
0.6
0.65
0.7
0.75
1972 1975 1978 1981 1984 1987 1990 1993 1996 1999 2002 2005 2008 2011
Ind
ex
of
Dis
sim
ila
rity
Whites, non-Hispanic
Black, non-Hispanic
Asian, non-Hispanic
Hispanics

9
Occupational Segregation and Different Generations of Women
Another way of looking at change over time is to focus on the experience of different cohorts of women.
Figure 4 below shows the value of the Index at ages 25, 45 and 65 for five different cohorts of women and
men.7 Progressively, at age 25 each new generation found the labor market less segregated than it was for
the preceding generation, suggesting a reasonably strong effect of progress from cohort to cohort at early
labor market entry. The intergenerational drop in occupational segregation was particularly marked
between the Late and Early Boomers at age 25, but for the last cohort to reach age 25, Generation Y, the
decrease in occupational segregation compared to Generation X women at 25 was very small. The older
cohorts also experienced a drop in occupational segregation during their lifetimes. The data shown
compare the occupational segregation only for men and women within each cohort and thus suggest that
desegregation was not due solely to younger women moving out of female-dominated occupations, but
also to occupational change during the lifetimes of each cohort. The Silent Generation experienced the
most consistent drops in segregation over their lifetimes. The Early Boomer generation experienced the
largest drop in occupational segregation at age 45 relative to the earlier cohort, the Silent Generation, as
well as a large decline in occupational segregation at age 45 compared with their experiences at age 25.
Yet by the time Early Boomers reached age 65 in the 2000’s and 2010’s, the measure of occupational
segregation within the cohort had increased. Likewise, Generation X women, reaching their mid-forties
mainly in the 2010’s, saw an increase, rather than a decrease, in occupational segregation between ages
25 and 45. The Early Boomer, the Late Boomer, and Generation X all saw an increase in occupational
segregation in the 2000’s and 2010’s , suggesting a strong effect of this time period on virtually all
cohorts.
7 The different cohorts are defined in consultation with the AARP: Silent Generation, born between 1930 and 1945;
Early Boomers, born between 1946 and 1955; Late Boomers, born between 1956 and 1964; Generation X, born
between 1965 and 1979; and Generation Y, born between 1980 and 1994.

10
Figure 4: The Index for Occupational Segregation for Different Generations, at Age 25, 45,
and 65
Note: The specification of the each cohort follows the definition used by AARP.
Source: Authors' calculation based on the Current Population Survey, March/Annual Social and Economic
Supplement (ASEC), as provided by King et al. (2010).
Blau, Brummund, and Liu (2013) have also extended the analysis of occupational gender segregation into
the most recently completed decade, examining change from 1970 to 2009. While the analysis in this
paper is based on the standard occupational classification system of 1990 and uses the Current Population
Survey, Blau, Brummund, and Liu construct a crosswalk based on the most recent occupational
reclassification from 2000 and use the Decennial Census and the American Community Survey. While
the results are thus not strictly comparable, they find broadly similar trends, although they find a small
further trend towards occupational integration during the last decade, while the analysis reported in this
paper finds no further progress. Blau, Brummund, and Liu compare trends for different cohorts of
women by adopting decennial birth cohorts and suggest that the decline in occupational segregation
experienced by older women in older cohorts may be due primarily to the labor market entry of better
educated and trained younger women more likely than the previous cohort to enter previously male
occupations. Yet, as we suggest above, our cohort analysis indicates that change towards greater
occupational integration also occurred as a result of women of older cohorts making career changes
during their working lives. While each younger cohort of women has had higher educational attainment at
age 25 than the preceding cohort, many women returned to education later in life, and the educational
profile of Baby Boomers does not differ dramatically from that of the subsequent generations. 8 Rose and
Hartmann (2004), who use panel data to study the work experience of women and men aged 26 to 59
8 For example, at age 25, 19 percent of the Early Boomers had graduated from a 4-year college; by age 55 this
proportion had risen to 28 percent (IWPR micro data analysis of CPS-ASEC, as provided through King et al 2010).
0.40
0.45
0.50
0.55
0.60
0.65
0.70
Age 25 Age 45 Age 65
Silent Generation (1930-
1945)
Early Boomers (1946-1955)
Late Boomers (1956-1964)
Generation X (1965-1979)
Genration Y (1980-1994)

11
across a 15-year period (from 1983 to 1998), find that close to 60 percent of firmly-attached workers
(with work experience in each of the 15 years) consistently worked in one of six major gender-typed
occupational groupings and that among the men and women who did not change groupings, gender
segregation was very pronounced. Yet more than 40 percent of workers did change their grouping. A
more thorough investigation of the role of factors such as job change due to further training and education
and the weight of ‘occupational mix’ compared to ‘compositional’ factors in accounting for change within
cohorts lies outside the scope of this paper.
Earnings and Occupational Segregation
Research suggests that occupational segregation is a major contributor to the gender wage gap (see for
example Blau and Kahn 2007; England, Hermsen, and Cotter 2000; Jacobs and Steinberg 1990; Treimann
and Hartmann 1981). Concomitantly, the decline in occupational segregation was a major contributing
factor to women’s increased real earnings during the last decades. Hsieh et al. (2013) estimate that
between 1960 and 2008 approximately 60 percent of real wage growth for Black women, 40 percent for
White women, and 45 percent for Black men can be attributed to falling levels of occupational
segregation; during the same time they estimate a real wage decline of 5 percent for White men as a result
of the change in the gender composition of occupations.
A look at the change in occupational segregation and in the gender earnings ratio on the same graph
suggests that the two trends are inversely correlated (Figure 5 below). During the 1980s, when the decline
in occupational segregation was strongest, women’s earnings relative to men’s saw the greatest
improvement. During the 1990s, when the trend towards occupational integration slowed down, so did
further improvements in the gender earnings ratio, and when occupational integration stagnated during the
2000s, likewise, there was little further improvement in the gender earnings ratio.

12
Figure 5: Change in the Index of Occupational Segregation and the Gender Earnings
Ratio, 1979 to 2012
Note: The Index of Occupational Segregation is calculated all workers aged 16 and older; the Gender Earnings
Ratio is calculated for full-time workers aged 15 and older.
Source: Authors' calculation based on the Current Population Survey, March/Annual Social and Economic
Supplement (ASEC), as provided by King et al. (2010). Weekly earnings ratio based on U.S. Department of Labor
Bureau of Labor Statistics (2013), Table 16
To investigate the relationship between earnings and occupations in more detail, following Rose and
Hartmann (2004) and Hegewisch, Liepmann, Hayes and Hartmann (2010), occupations were divided into
nine different categories, using three broad groups to indicate the gender composition of occupations—
‘predominantly female’ occupations, where women were at least 75 percent of workers; ‘integrated
occupations,’ where women were fewer than 75 percent but more than 25 percent of workers; and
‘predominantly male’ occupations, where women were fewer than 25 percent of workers, and then
subdividing each of these into three broad levels of education and skill requirements—‘high skill’,
requiring at least a four-year college degree; ‘medium skill,’ requiring at least some college education,
moderate or long-term on-the-job training, a postsecondary vocational award or an Associate’s Degree;
and ‘low skill,’ requiring a high school education or less and no or only short-term on-the-job training.9 It
9 The three groups combine data from the Bureau of Labor Statistics’ assessment of education and training
requirements with an analysis of the actual educational profile of workers in an occupation; all apprenticeable
occupations were classified as medium skilled. For more detailed discussion of the methodology, see Hegewisch,
Liepmann, Hayes, and Hartmann 2010.
0.30
0.40
0.50
0.60
0.70
0.80
0.90
1.00
Index Weekly earnings ratio
13
should be noted that the medium skill level includes a considerable range of skills and educational
attainment, ranging from just some college or certification to an Associate’s Degree. Taking a simple
measure, for example subdividing occupations between those that require Associate’s Degrees and others
would inadvertently introduce gender bias. Women are the majority of those with Associate’s Degrees,
and female-dominated sectors such as health care and social assistance tend to be more focused on
formal certification and qualifications than male-dominated sectors such as construction. While
apprenticeships can be considered equivalent to Associate’s Degrees (and, indeed, in trades such as
electrician, more akin to a Bachelor’s Degree in terms of years of training required), the share of
apprenticed workers in construction has fallen to well under 20 percent, with many workers primarily
learning on the job without formal benchmarks of skill attainment.
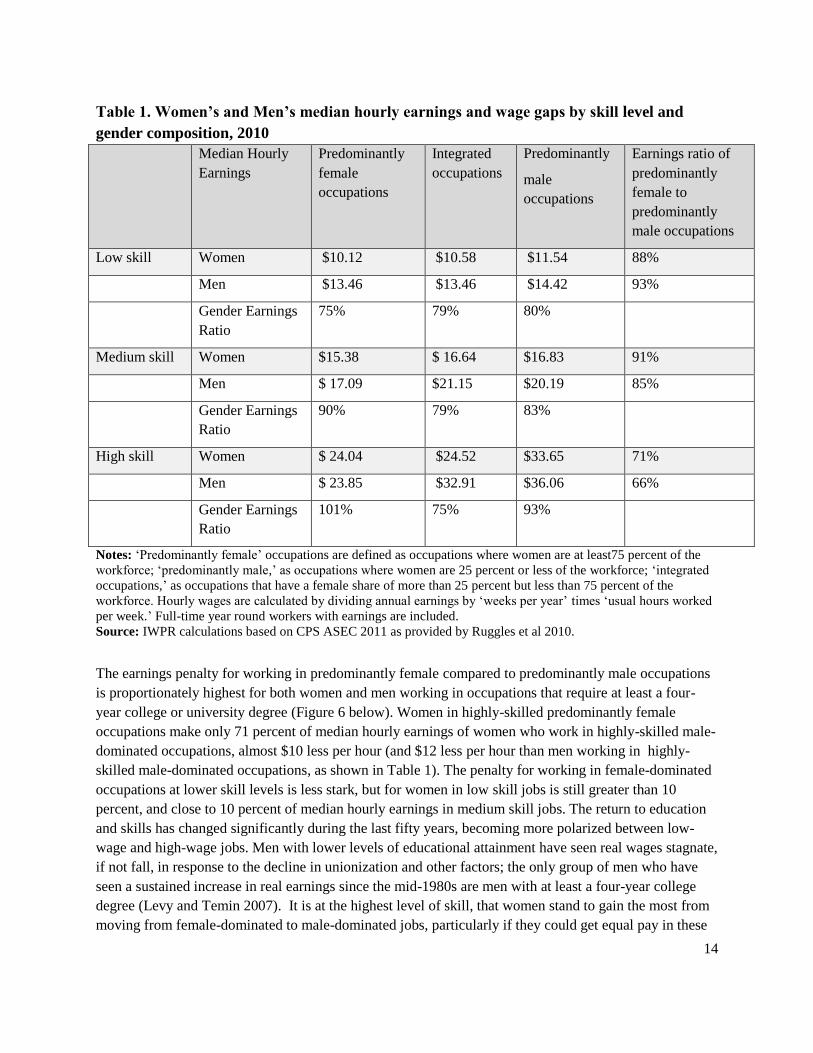
Hegewisch et al (2010) analyze median weekly earnings for workers working full-time, year round in
each of these nine groups and find clear earnings differences at each skill level, with predominantly
female occupations having the lowest earnings and predominantly male occupations, the highest. The
present analysis conducts the earnings analysis separately for women and men because the gender
earnings gap within occupations is well-documented: of the more than 100 occupations with sufficient
numbers of women and men to estimate a gender earnings ratio, in fewer than five occupations are
women’s median weekly earnings higher than men’s (Hegewisch and Matite 2013). To capture
differences in earnings due to differences in the numbers of hours worked,10 data are estimated on a
median hourly basis. As Rose and Hartmann (2004) found in their analysis, average hours worked differ
significantly between men and women in male- and female-dominated occupations, with both women and
men on average working more hours in predominantly male occupations than workers in predominantly
female occupations. Table 1 below presents data on median hourly earnings for predominantly female,
integrated, and predominantly male occupations for women and men in each of the major occupational
skill groups. With one exception, it shows that irrespective of skill level or gender composition, men have
higher median hourly earnings than women; the exception is for the highly-skilled female-dominated
occupations, where women’s hourly earnings are estimated at 101 percent of men’s hourly earnings
within these occupations, a fact at least partly reflecting women’s likely greater seniority.
The analysis also suggests that there is a clear penalty for working in female-dominated occupations, with
women in each of the three broad skill categories earning less in female-dominated occupations than in
integrated or male-dominated occupations. Men also suffer a wage penalty for working in female-
dominated occupations compared to what they could earn in male-dominated or integrated ocupations at
the same skill level.
10 While the majority of full-time workers work 40 hours per week, women are more likely than men to work
between 35 and 39 hours per week while men are more likely than women to work more than 40 hours (U.S.
Department of Labor 2013a)
14
Table 1. Women’s and Men’s median hourly earnings and wage gaps by skill level and
gender composition, 2010
Median Hourly
Earnings
Predominantly
female
occupations
Integrated
occupations
Predominantly
male
occupations
Earnings ratio of
predominantly
female to
predominantly
male occupations
Low skill Women $10.12 $10.58 $11.54 88%
Men $13.46 $13.46 $14.42 93%
Gender Earnings
Ratio
75% 79% 80%
Medium skill Women $15.38 $ 16.64 $16.83 91%
Men $ 17.09 $21.15 $20.19 85%
Gender Earnings
Ratio
90% 79% 83%
High skill Women $ 24.04 $24.52 $33.65 71%
Men $ 23.85 $32.91 $36.06 66%
Gender Earnings
Ratio
101% 75% 93%
Notes: ‘Predominantly female’ occupations are defined as occupations where women are at least75 percent of the
workforce; ‘predominantly male,’ as occupations where women are 25 percent or less of the workforce; ‘integrated
occupations,’ as occupations that have a female share of more than 25 percent but less than 75 percent of the
workforce. Hourly wages are calculated by dividing annual earnings by ‘weeks per year’ times ‘usual hours worked
per week.’ Full-time year round workers with earnings are included.
Source: IWPR calculations based on CPS ASEC 2011 as provided by Ruggles et al 2010.
The earnings penalty for working in predominantly female compared to predominantly male occupations
is proportionately highest for both women and men working in occupations that require at least a four-
year college or university degree (Figure 6 below). Women in highly-skilled predominantly female
occupations make only 71 percent of median hourly earnings of women who work in highly-skilled male-
dominated occupations, almost $10 less per hour (and $12 less per hour than men working in highly-
skilled male-dominated occupations, as shown in Table 1). The penalty for working in female-dominated
occupations at lower skill levels is less stark, but for women in low skill jobs is still greater than 10
percent, and close to 10 percent of median hourly earnings in medium skill jobs. The return to education
and skills has changed significantly during the last fifty years, becoming more polarized between low-
wage and high-wage jobs. Men with lower levels of educational attainment have seen real wages stagnate,
if not fall, in response to the decline in unionization and other factors; the only group of men who have
seen a sustained increase in real earnings since the mid-1980s are men with at least a four-year college
degree (Levy and Temin 2007). It is at the highest level of skill, that women stand to gain the most from
moving from female-dominated to male-dominated jobs, particularly if they could get equal pay in these

15
jobs and earn what men do. As Table 1 shows, a woman with a high skill predominantly female job earns
$24.04 per hour. If she could move to a high skill male-dominated job and earn $36.06 per hour (the male
range) she would earn $12.02 per hour more or $25,000 more for a full year of work at 40 hours per
week.
Figure 6: Median Hourly Earnings in Predominantly Female Occupations as Percent of
Median Hourly Earnings in Predominantly Male Occupations by Broad Skill Level, for
Women and Men, 2010
Notes and Sources: See Table 1
As discussed above, hours of work are an important differentiator between predominantly female and
predominantly male occupations, with predominantly male jobs often involving longer hours and the
opportunity to earn overtime pay. While this may partly be a reflection of preferences informed by the
gendered division of unpaid care and family work, recent research on the retail and leisure industry
suggests that many women would prefer to work more hours, but also that the lack of predictability of
hours of work is an increasing problem for both men and women (Lambert and Henly 2012). At the same
time, the emphasis on long hours in male-dominated occupations may act as a barrier to women’s entry
into these occupations, creating a chicken and egg situation where the emphasis on long hours may act as
a disincentive to many women with caregiving responsibilities, while at the same time the lack of
policies to allow flexible work provides them with little incentive to enter.
Table 1 also shows that earnings, across the board, are low for women in the lowest-skilled occupations.
In the low-skill female-dominated occupations, for a work year of 2080 hours, women would earn $6,950
more if they earned the same hourly wage as men in those occupations. For the low-skill integrated jobs,
women would earn $5,990 more per full-time year if they earned men’s hourly wages in those
occupations, and in the low-skill male-dominated jobs, equal pay would also bring women $5,990 more
per full-time year. Wage differences of this magnitude are enough to make the difference between above-
poverty and below-poverty family living standards. These least-skilled occupations include female-
93%
85%
66%
88%91%
71%
Low skill Medium skill High skill
Men Women

16
dominated occupations such as ‘personal care aides,’ ‘home health aides,’ and ‘nursing assistants,’
occupations predicted to see high levels of growth (U.S. Bureau of Labor Statistics 2013c).
Even at higher skill levels, the data in Table 1 suggest that women would benefit from earning equal pay
with men in virtually all groups of occupations. In medium skill occupations, equal pay for women for a
full-time work year would bring them an additional $3,555 per year in predominantly female occupations,
$6,990 more per year in the predominantly male occupations, and the largest gain, $9,380, in the
integrated occupations. In the high skill occupations, women would gain $5,015 per year by earning equal
pay with men in the male dominated occupations and a whopping $17,451 additional per year from equal
pay in the high-skill integrated occupations. In the female-dominated occupations, men would gain $395
per year if they earned the same as women.
Discussion and Conclusions
The literature reviewed and the data analyzed for this paper show that occupational gender segregation
remains a major feature of the labor market and that trends towards integration of occupations have
stalled in the last decade for women and men of different generations, across different levels of
educational attainment, and for all of the largest racial and ethnic groups. The data further suggest that
change across time in the gender earnings ratio is inversely related to change in occupational segregation
– the gender earnings ratio improved most strongly when occupational segregation fell most strongly, and
it no longer improved when there was no further change in the level of occupational segregation. The
analysis also shows that at at each major level of education and skills, women, as well as men, face a
wage penalty for working in female-dominated occupations. This relationship suggests that occupational
segregation should continue to be a target of any policy efforts designed to tackle the wage gap, whether
such policies focus on encouraging women’s movement into better-paid integrated or male-dominated
occupations, or whether they are focused on improving earnings in female-dominated occupations, or
both.
Indeed the relatively low pay of female-dominated jobs at all skill levels compared with gender integrated
and male-dominated jobs at comparable skill levels suggests that comparable worth (also called pay
equity) is a needed strategy for improving pay in female-dominated jobs. A comparable worth strategy
calls for evaluating jobs and their pay levels to test whether female-dominated jobs earn less than male-
dominated jobs that are comparable in terms of skill, effort, responsibility, and working conditions
considered together, and then, if such discrimnation in pay is found, to increase the wages of the female-
dominated jobs. Nearly half the states have analyzed jobs in their civil services for pay bias and approved
changes in pay as a result of studies conducted (Hartmann and Aaronson 1994). Less is known about
whether private employers may also be undertaking studies and redressing pay inequities. Because many
federal courts have held that this type of pay inequity is not covered by Title VII, fewer legal cases are
coming forward making the argument that such pay inequity is wage discrimination. The proposed Fair
Pay Act has been introduced in Congress many times; it would clarrify that the pay discrimination in
female-dominated jobs compared to male-dominated jobs of equal value is indeed wage disrimination.
Although some observers believe that the lowest-wage jobs are not likely to gain from comparable worth
17
strategies, research suggests otherwise. For example, Lovell, Hartmann, and Werschkul (2007), in a study
that examined skill requirements of jobs with more detail than was possible here, show that men’s low-
wage jobs require far less in the way of skill, education, and certifications than women’s low-wage jobs,
despite their generally higher pay. Deborah Figart and June Lapidus (1997) and Pamela Stone and
Arielle Kuperberg (2005) find that comparable worth wage readjustments would raise wages for women
and minorities at the bottom of the labor market. Such studies suggest that the skills required in many
low-wage women’s occupations are not currently being recognized and rewarded in the labor market.
Indeed a comparable worth strategy would likely raise women’s wages at all skill levels relative to men’s
wages (much as it has in the civil service systems where pay adjustments have occurred; Hartmann and
Aaronson 1994).
Other ways to raise pay in female-dominated jobs (and all jobs), especially at the low-skill level, include
increasing minimum wages and enhancing support for unionization and policies that can improve job
quality, such as paid sick days and paid family leave. Women hold the majority of jobs subject to the
minimum wage, and labor unions have been shown to raise women’s wages more than men’s (Hartmann,
Spalter-Roth, and Collins 1994). And it is often women’s jobs at the low end of the labor market that
lack acces to paid sick days or paid family leave. These policies tend to strengthen and lengthen workers’
attachment to the labor market and to their specific jobs, helping them accumulate seniority on the job,
often leading to experience-related pay increases.
Integrating male and female-dominated jobs is also a needed, continuing strategy. All employers with 15
employees or more are subject to Title VII and should be hiring, promoting, and compensating workers
without bias based on gender, race, ethnicity, religion, or national origin. The slow progress that has been
made in integrating many jobs, especially those that require less than a college education, and in further
closing the wage gap, shows just how far employers still need to come in changing their employment
practices to achieve equal opportunity for women workers (and for male workers in female-dominated
jobs).
In addition, since Table 1 shows wide disparities in hourly pay between women and men who are in
occupations that share the same skill ranking, it appears that stronger enforcement of plain vanilla equal
pay laws that require equal pay for men and women doing substantially equal work is still needed. Lack
of equal pay with men at the same general skill level and with the same gender composition of occupation
costs women from $3,555 to $17,450 per year for full-time work, according to the data presented here.
The data in Table 1 also show considerable wage premia for higher-skilled jobs compared with lower-
skilled ones. All workers benefit from moving up the educational ladder to the next higher level of skill.
This path is not open to or desired by all workers, and other efforts, such as building career pathways at
work via on-the-job training or specific job-related courses or certificates can help low skill workers
achieve higher-skilled positions. Such strategies as these, coupled with higher minimum wages and more
collective bargaining, as well as stronger equal pay enforcement efforts, may do as much to improve
earnings as a focus on greater occupational integration would. As Charles and Grusky (2004) note, while

18
occupational gender segregation has persisted, this does not mean that all men’s jobs (and certainly not
the jobs of men of color) are always better than women’s. Many jobs done by both men and women
would benefit from improvements in job quality, including in terms of pay, career progression, family and
medical leave benefits, retirement benefits, and so on.
While the slowdown and stagnation in occupational integration are clear, the reasons for this stagnation
are less obvious. Cotter, Hermsen and Vanneman (2011) pointed to the mid- and late-1990s as a time
period when a whole group of indicators of gender equality began to stagnate, including women’s labor
force participation and men’s contribution to household labor. They tracked a similar slowdown in change
in social attitudes towards women and work and towards women’s and men’s roles in the home and in
politics. They drew on Charles and Grusky’s concept of “gender egalitarialism” to point to the
coexistence of traditional social beliefs about male and female roles, for example in relation to caregiving
and nurturing, and more egalitarian or feminist beliefs that women are equal to men in their right and
capacity to work, earn a living, or exert political power.
England (2010, 2011) draws on Charles and Grusky’s analysis of gender essentialism to examine the
potential impact of traditional gender attitudes, which might act as “gender blinders” on women’s and
men’s career choices, on intergenerational change in occupations, and on the faster rate of integration of
occupations that require higher education than others. She speculates that, while there is a belief that
young women should advance beyond their parents, in the context of traditional gender perceptions
(gender essentialism), women will take their mothers’ (rather than their fathers’) career as the yardstick
against which to measure their progress. For women who are the first in their families to pursue college
education, this would mean following traditional careers for women such as teaching or (now)
accounting. For women whose mothers are already teachers, for example, the route to advancement and
higher earnings would more likely require a less traditional career for women, such as lawyer or doctor.
In other words, England expects that women are likely to follow a traditional career path as long as this
path allows upward progress; they will only move into nontraditional career paths if advancement along
the traditional path is not possible. While England is less concerned with explaining the stagnation in
trends towards occupational integration, the expansion of jobs in healthcare, education, and business
services provides scope for advancement along more traditional gender lines for daughters of mothers
without a college education, potentially explaining the lack of futher progress in reducing sex segregation.
This analysis has been strongly criticized by Bergmann (2011) for being overly focused on white collar
careers and higher levels of education and for ignoring the continued high levels of discrimination in
predominantly male technical and manual occupations. Women in construction trades—and it should be
remembered that while they are proportionately few, in absolute numbers almost as many women work in
construction occupations as in the occupation of ‘physicians and surgeons’—report high levels of
discrimination. In a recent study of tradeswomen, well over a third reported that they rarely or never were
treated equally to men in hiring decisions, and close to a third, that they frequently or always experienced
sexual harassment (Hegewisch and O’Farrell forthcoming). Yet, whether more subtle gender essentialist

19
notions or outright discrimination, both theories add to an understanding of why the integration of
occupations has been slower in medium and lower skilled occupations.
Our analysis of the smaller wage penalty for women working in medium and low-skilled female-
dominated occupations compared with higher-skilled predominantly female occupations provides an
added dimension to understanding women’s career decisions. Given the difficulties that may be
associated with entering a nontraditional career, whether as a result of gendered beliefs of what is
appropriate for women, hostile work cultures, or outright discrimination, the financial incentives for
women to pursue nontraditional medium- or lower- skilled careers are much smaller than the financial
incentives to pursue nontraditional four-year college degrees such as engineering or computer
programming or to pursue postgraduate training in law or medicine. Of course, pursuing a four-year
degree and then postgraduate education can be expensive and also incurs opportunity costs because
women could be earning more if not in school. Either way, pursuing expensvie higher education or
breaking down the barriers to enter traditionally male blue collar skilled jobs, like the skilled construction
trades, as well as civil service jobs like police officer and firefighter, presents barriers for women to
overcome. It would appear that the professional barriers are the easier ones to overcome.
Yet, sophisticated explanations focused on economic incentives or on tradtional gender beliefs as the
culprit in holding back gender integration perhaps underemphasize the lack of information about career
paths available to young women when they enter such paths. Ma (2009) examines the role of socio-
economic status and race and ethnicity in the choice of students’ college majors;11 she finds that women
and men of lower socio-economic status and from minority households are very concerned with the
economic payoff of college careers, more so than young women of higher socio-economic status (and in
stark contrast to similar young men), for whom it seems more acceptable to seek traditionally female low-
paying fields (such as art history or social work). Ma’s research suggests that for young women from less
well off families the choice of traditional female career paths may be more directly related to lack of
information about the relative economic value of different careers.12 Such lack of information is
particularly costly. College degrees do not come more cheaply in female-dominated fields, and the gender
wage gap together with the penalty for working in a female-dominated occupation leave women
graduating in these fields with many fewer resources and lower future earnings potential than women who
choose nontraditional fields. Therefore, improved information about the differences in prospective
earnings in different fields at differenet educational levels would be especially useful to women. It is
important to keep in mind, however, that if some higher-paying fields put up more resistance to women
entering these fields, as seems likely, than information alone will not enable women to enter and thrive in
these fields. Also when the earnings of women with higher education are compared to the earnings of
11 The study examines only the initial choice of majors, not completion and retention rates.
12 In the aforementioned study of women working in the construction trades, fewer than three percent of respondents
reported having learned about the possibility of a construction career either from a career counselor at school or at
a One Stop shop (Hegewisch and O’Farrell forthcoming)
20
those without postsecondary learning, higher education generally pays just as large a premium for women
as it does for men.
The slowdown in occupational integration may also reflect a change in the emphasis on gender equality in
education and workforce development policies. Support for active career counseling towards
nontraditional careers, particularly in career and technical educations, declined dramatically after the
1990s. During the 1980s and 1990s, until the reauthorization of the Carl D. Perkins Act in 1998, states
were mandated to set aside at least 3 percent of federal funds for career and technical education (CTE) for
the promotion of sex equity and to employ a full-time sex equity coordinator. From 1998 onwards there
no longer were dedicated funding streams to support the coordinators or the programs. While the Perkins
Act continues to include participation in nontraditional career and technical education among its
performance measures, the change from funded mandates to unfunded voluntary efforts resulted in a
dramatic decline in the number and size of programs designed to improve access to nontraditional careers.
As we argue elsewhere (Hegewisch and O’Farrell forthcoming) the close correlation between the
weakening of the federal mandate and the halt in desegregation of employment is striking. Public
financial support for women’s entry into career and technical occupations has clearly declined at the
federal level.
At this point in the development of knowledge about sex segregation, it seems impossible to say whether
the stagnation in occupational integration is due to discrimination, such as a failure of teachers,
counselors, and employers to encourage females to pursue male-dominated fields as much as they
encourage males to do so or hostile work environments or unequal pay and promotion opportunities that
drive women away from traditionally male occupations, or simply to lack of information, or to actual
gendered preferences, or to a combination of all these factors.
In conclusion, the correlation between occupational segregation and the gender wage gap suggests that
just as fifty years ago, both improving career advice about nontraditional fields and tackling
discrimination in nontraditional fields remain important building blocks for women’s economic equality.
Equally important are finding ways to raise pay in jobs traditionally held by women and improving the
quality of those jobs, through such policies as increasing the minimum wage, providing paid sick days
and paid family leave, assuring collective bargaining, enforcing equal pay laws (these address similar as
well as identical jobs), and pursuing further comparable worth remedies that recognize that women’s jobs
are frequently underpaid simply because women do them.
21
References
Alonso-Villar, Olga and Cotal del Río. 2012. “The Occupational Segregation of Black women in the
United States: A Look at its Evolution from 1940 to 2010.” ECINEQ Working Paper WP 2013-304
Bayard, Kimberley, Judith Hellerstein, David Neumark, and Kenneth Troske. 2003. “New evidence on
sex segregation and sex differences in wages from matched employee-employer data.” Journal of
Labor Economics, 21(4):887-921.
Bellas, Marcia and Barbara Coventry. 2001. “Salesmen, Saleswomen, or Sales Workers? Determinants
of the Sex Composition of Sales Occupations.” Sociological Forum 2001: 73-98
Bergmann, Barbara R. 2011. “Sex segregation in the blue-collar occupations: Women’s choices or
unremedied discrimination? Comment on England” Gender and Society, 25 (1), 88-93.
Blau, Francine D., Peter Brummund, Albert Yung-Hsu Liu. 2013. “Trends in occupational segregation
by gender 1970–2009: Adjusting for the impact of changes in the occupational coding system.”
Demography, 50:2, 471-492
Blau, Francine D. and Wallace E. Hendricks. 1979. “Occupational Segregation by Sex: Trends and
Prospects.” The Journal of Human Resources 14 (2): 197-210
Blau, Francine D. and Lawrence M. Kahn. 2007. “The Gender Pay Gap.” The Economists’ Voice 4 (4):
Article 5
Browne, Irene and Rachel Askew. 2005. “Race, Ethnicity and Wage Inequality Among Women: What
Happened in the 1990s and the Early 21st Century?” American Behavioral Scientist 48 (9),
1275:1292
Charles, Maria, and David B. Grusky. 2004. Occupational Ghettos: The Worldwide Segregation of
Women and Men. Stanford, Calif.: Stanford University Press.
Cotter, David A., Joan M. Hermsen and Reeve Vanneman. 2004. Gender Inequality at Work, New York,
NY: Russell Sage Foundation and Population Reference Bureau.
Cotter, David, Joan M. Hermsen, and Reeve Vanneman. 2011. “The End of the Gender Revolution?
Gender Role Attitudes from 1977 to 2008” American Journal of Sociology, 117 (1), 259-289
Duncan, Otis D. and Beverly Duncan. 1955. “A Methodological Analysis of Segregation Indexes.”
American Sociological Review 20 (2): 210-217.
England, Paula. 2010. “The gender revolution: Uneven and stalled.” Gender & Society, 24 (2), 149-160.
England, Paula. 2011. ‘Reassessing the uneven gender revolution and its slowdown.’ Gender & Society,
25 (1), 113-123.
22
England, Paula, Joan M. Hermsen, and David A. Cotter. 2000. ‘The devaluation of women’s work: a
comment on Tam’, American Journal of Sociology, 105 (6), 1741–1751.
Figart, Deborah M. and June Lapidus. 1997. “How Women Can Earn a Living Wage: The Effects of Pay
Equity Remedies and a Higher Minimum Wage.” Washington, DC: Institute for Women’s Policy
Research Research-in-Brief, http://www.iwpr.org/publications/pubs/how-women-can-earn-a-living-
wage-the-effects-of-pay-equity-remedies-and-a-higher-minimum-wage (accessed January 6, 2014)
Groshen, Erica. 1991. “The structure of the female/male wage differential: Is it who you are, what you do,
or where you work?” Journal of Human Resources, 26(3):457-472.
Hartmann, Heidi and Stephanie Aaronson. 1994. “Pay Equity and Women’s Wage Increases: Success in
the States, a Model for the Nation.” Duke Journal of Gender Law & Policy, 1(1): 69-88.
Hartmann, Heidi, Roberta Spalter-Roth, and Nancy Collins. 1994. “What Do Unions Do For Women?”
Challenge, 37 (4), 11-18.
Hegewisch, Ariane, Hannah Liepmann, Jeffrey Hayes and Heidi Hartmann (2010) ‘Separate and not
equal? Gender Segregation in the labor market and the gender wage gap.’ Washington, DC: Institute
for Women’s Policy Research Briefing Paper, http://www.iwpr.org/publications/pubs/separate-and-
not-equal-gender-segregation-in-the-labor-market-and-the-gender-wage-gap/ (accessed 15 March,
2012).
Hegewisch, Ariane and Max Matite. 2013. “The Gender Wage Gap by Occupation.” Washington, DC:
Institute for Women’s Policy Research <http://www.iwpr.org/publications/pubs/the-gender-wage-
gap-by-occupation-2?searchterm=Matite> (accessed December 17, 2013)
Hegewisch, Ariane and Brigid O’Farrell. Forthcoming. Improving Access to Quality Jobs for Women in
the Green Economy. Washington, DC: Institute for Women’s Policy Research
Hsieh, Chang-Tai , Erik Hurst, Charles I. Jones, Peter J. Klenow. 2010. “The Allocation of Talent and
U.S. Economic Growth.” NBER Working Paper No. 18693
Jacobs, Jerry A. 2003. “Detours on the Road to Equality: Women, Work and Higher Education.” Contexts
2(1):32-41.
Jacobs, Jerry. 1989. “Long-term Trends in Occupational Segregation by Sex.” American Journal of
Sociology 95 (1)160-73
Jacobs, Jerry and Ronnie J. Steinberg .1990. “Compensating differentials and the male-female wage gap:
evidence from the New York State comparable worth study.” Social Forces, 69(2), 439-468.
King, Miriam, Steven Ruggles, Trent Alexander, Donna Leicack, and Matthew Sobek. 2009. Integrated
Public Use Microdata Series, Current Population Survey: Version 2.0. Minneapolis, MN: Minnesota
Population Center; <http://cps.ipums.org> (retrieved March 22, 2010).
23
Lambert, Susan J. and Julia R. Henly. 2012. “Labour flexibility and precarious employment in hourly
retail jobs in the U.S.: How frontline managers matter.” In Are Bad Jobs Inevitable? Trends,
Determinants and Responses to Job Quality in the Twenty-First Century. Chris Warhurst, Francoise
Carré, Patricia Findlay, and Chris Tilly, eds. 143-59. England: Palgrave Macmillan..
Landivar, Liana C. 2013. “Disparities in STEM Employment by Sex, Race, and Hispanic Origin.”
American Community Survey Reports U.S. Census Bureau ,
<http://www.census.gov/prod/2013pubs/acs-24.pdf> (accessed November 29, 2013)
Levy, Frank and Peter Temin. 2007. “Inequality and Institutions in 20th Century America.” NBER
Working Paper 13106, National Bureau of Economic Research, Inc.
Lovell, Vicky, Heidi Hartmann, and MishaWerschkul. 2007. "More than Raising the Floor: The
Persistence of Gender Inequalities in the Low-Wage Labor Market." In The Class of Sex:Women
Transforming American Labor, Dorothy Sue Cobble, ed., pages 33-57. Ithaca, NY: ILR Press.
Meyer, Peter B. and Anastasiya M. Osborne. 2005. “ Proposed Category System for 1960-2000 Census
Occupations.” U.S. Bureau of Labor Statistics Working Paper 383 (September ) ,
<http://www.bls.gov/ore/pdf/ec050090.pdf> (accessed December, 1, 2013)
Rose, Stephen J. and Heidi Hartmann. 2004. Still a Men’s Labor Market: The Long-Term Earnings Gap.
Washington, DC: Institute for Women’s Policy Research.
Snyder, Thomas. D., and Dillow, Sally A. 2012. Digest of Education Statistics 2011 (NCES 2012-001).
"Table 310. Degrees conferred by degree-granting institutions, by level of degree and sex of student,
Selected years: 1869-79 through 2021-22." U.S. Department of Education, National Center for
Education Statistics; < http://nces.ed.gov/pubs2012/2012001.pdf> (accessed December 1, 2013)
Stone, Pamela and Arielle Kuperberg. 2005. “Anti-Discrimination vs. Anti-Poverty? A Comparison of
Pay Equity and Living Wage Reform.” Journal of Women, Politics & Policy, 27 (3/4): 23-39.
Treiman, Donald J. and Heidi Hartmann (1981), Women, Work, and Wages: Equal Pay for Jobs of Equal
Value. Washington, DC: National Academy Press.
U.S. Bureau of Labor Statistics. 2013. “Current Population Survey Household Annual Averages” on the
internet at <http://www.bls.gov/cps/cpsaat17.pdf> (accessed December 17, 2013).
U.S. Bureau of Labor Statistics. 2013a. “Highlights of Women’s Earnings in 2012.” BLS Report 1045.
On the internet at <http://www.bls.gov/cps/cpswom2012.pdf> (accessed December 18, 2013).
U.S. Bureau of Labor Statistics. 2013b. “Women in the Labor Force: A Databook.” BLS Report 1040. On
the internet at <http://www.bls.gov/cps/wlf-databook-2012.pdf> accessed December 18, 2013).
U.S. Bureau of Labor Statistics. 2013c. “Employment Projections: Occupations with the Most Growth.”
On the internet at < http://www.bls.gov/emp/ep_table_104.htm> (accessed December 18, 2013).