occupational stress in health service workers in the uk
TRANSCRIPT

STRESS MEDICINE, VOL. 8: 79-90 (1992)
STRESS IN THE COMMUNITY
OCCUPATIONAL STRESS IN HEALTH SERVICE WORKERS IN THE UK
DAVID REES Department of Clinical Psychology, North Manchester Health Authority, North Manchester General Hospital,
Crumpsall, Manchester M8 6RL, UK
A N D
CARY L. COOPER Manchester School of Management, University of Manchester institute of Science and Technology, UK
SUMMARY
Levels of occupational stress were examined in 1176 employees of all occupational groups within one large UK health authority. In comparison with the most recently established normative group of workers from non-health care sectors, health workers reported significantly greater pressure at work but scored lower on measures of Type A behaviour pattern and employed coping strategies more frequently. The health care workers reported, in contrast with previous studies, fewer symptoms of mental ill-health and similar levels of job satisfaction. Job satisfaction and psychosomatic ill-health were related to sickness absence among health workers. Approximately one in 12 health workers had stress symptoms of equal magnitude to patients attending clinical psychology outpatient clinics. The major occupational groups within the health worker sample were compared on stress measures. General managers were found to report the lowest levels of pressure, were high on Type A (nearly as high as doctors), were found to be the most ‘internal’ in their perceived locus of control, had the lowest levels of ill-health symptoms, the highest levels of job satisfaction and the lowest sickness absence rate. Nurses reported the highest levels of pressure. Ancillary staff and scientists and technicians, on the other hand, had very low levels of job satisfaction and high sickness absence.
KEY woRDs-Health workers, occupational stress, sick absence, job satisfaction, OSI.
It has been estimated that stress-related illnesses are responsible for more absenteeism from work than any other single cause. Nearly half of prema- ture deaths in Britain are due to lifestyle and stress- related illnesses.’ The National Health Service is the largest employer in Britain and it is believed that health workers are particularly susceptible to developing stress-related illness because of the nature of their work.* Health professionals face an occupational stressor which is not part of most other professions. They may deal with people in situations which have profound implications, involving perhaps death and suffering. It has been suggested that a government health warning should be imprinted in every health professional’s mind, ‘Caring can damage your health’.3 The term burn- out has been coined to describe the effects of the
kinds of stress experienced by some health pro- fessionals. Although the term has no universally agreed definition, it is characterized by depersonal- ization, emotional exhaustion and a reduced sense of personal acc~mpl ishment .~~~
STRESS FACTORS
The extensive literature on stress at work demon- strates that the causes of stress are many and varied, including those which are intrinsic to the job, for example having to counsel bereaved parents in a paediatric oncology unit, deal with intoxicated youths in an accident and emergency unit or pro-
Received 14 June 1991 0748-8386/92/020079- 1 2$06 .OO 0 1992 by John Wiley & Sons, Ltd.
80 D. REES AND C . L. COOPER
vide terminal care to a young man with AIDS with whom you have formed a relationship over many months. Other stressors include the tensions that might exist at the interface between home and work, one’s perceptions, frustrations and disap- pointments about career achievements, perceptions about the organization, and all the stress associated with being and working with other people.
Personality characteristics
Any list of stressors will not affect everyone in the same way. People have different personalities and in stress studies two personality characteristics or sources of individual differences have been recognized as important predictors of response to pressure. When individuals explain events that have happened to them they do so by describing the interaction between their environments and selves. At one extreme, some individuals will interpret events as being substantially due to ‘chance’, with their actions being largely irrelevant to either the occurrence or outcome. Such individuals have been considered as having an external locus of control,6 control coming from outside of the individual. At the other end of the continuum are persons who believe events are substantially ‘under their control’ and that they have influence over what happens to them, that is, they have internal locus of control. The evidence to date suggests that the more control individuals feel they have over events important to them, the less their perception of stress.
The second personality attribute of note is Type A behaviour pattern. This refers to an overall style of behaviour that is observed in persons who are excessively time-conscious, competitive, ambitious, hard-driving, and confident, perhaps the stereotype of the successful and dynamic executive. This be- havioural syndrome has been found to be a signifi- cant predictor of coronary heart disease and other stress-related illnesses.’
The stresses at work may also be modified by biographical and demographic factors such as age and sex. A review of sex differences in stress research found that females tend to report higher levels of psychological distress, while men are more prone to severe physical illness.*
When stressors are present, the individual will operate on them using whatever stress-coping stra- tegy is available. Individuals possess, for a variety of reasons such as training and experience, a reper-
toire of coping responses that might reduce or eliminate stress.
In the structural model proposed by Cooper and his colleagues, the experience of stress is moderated (perhaps enhanced) by individual characteristics of personality (perceived locus of control and Type A behaviour pattern), demographic factors and coping strategies, with consequent effects on
The strain effects on people may be mani- fest as problems of mental or physical ill-health and a reduction in job satisfaction, which itself may operate on incoming stress. For the organization, the effects of stress may be many including high absenteeism, both from work and within work, poor job performance and reduced efficiency and effectiveness, low staff morale and high staff turn- over.
Rationale
The present authors presented preliminary data on levels of occupational stress, measured using the Occupational Stress Indicator (OSI)” in health service employees, and compared them with the normative sample of the OSI.” The OSI was orig- inally standardized on a population of white collar workers in industry, and in comparison with this group the health workers reported significantly greater pressure at work, scored higher on measures of Type A behaviour, had a more external perceived locus of control, used a range of coping strategies more frequently, but reported higher levels of men- tal and physical ill-health and lower levels of job satisfaction.
The present study reports on a much larger sample of health service employees from most occu- pational groups within one health authority, and compares them with a more recently established OSI normative group representing employees from a very wide range of both public and private sector industries and consisting of both white collar an blue collar workers.
The purpose of the present study was to deter- mine whether health workers experience more stress than those working in non-health care indus- tries. It was also designed to compare different occupational groups of health workers in order to increase our understanding of possible intergroup differences, and to consider whether the various occupational groups are likely to require different intervention strategies to reduce the adverse effects of stress at work.

HEALTH SERVICE WORKERS 81
METHOD
Subjects
The sample for this investigation was obtained from employees of one large health authority. A disproportionate stratified sample was identified to ensure adequate representation of all occupational groups by grade, shift worked, and full-time or part-time status. This was done by taking the names of all employees from the Integrated Personnel Sys- tem and choosing each cluster at random. Staff who were on either long-term sick leave (ie greater than three moths) or maternity leave were also excluded from the study.
One thousand seven hundred and fifty-four ques- tionnaires were distributed to potential respon- dents and 1176 were returned for analysis, a response rate of 67 per cent. The 64 occupations represented in the sample were grouped into larger occupational groups to allow meaningful statistical analysis. The groups formed were: administrative and clerical staff ( N = 129), ancillary and mainten- ance staff N = 65), doctors ( N = 153),nurses ( N = 555), professions allied to medicine ( N = 147), scientists and technicians ( N = 66) and general managers ( N = 12). The occupational group of 49 respondents was unknown and they were excluded from further analysis.
Measures
Data were collected from each respondent on a number of independent variables: personal and job demographics, sources of job stress, type A behaviour pattern, perceived locus of control, and cognitive and behavioural coping strategies; and two dependent or criteria measures: well-being (mental and physical health) and job satisfaction. The independent and dependent measures used have been found to be implicated in previous research9,12 in the stress-strain relationship.
INDEPENDENT VARIABLES
Personal andjob demographics
Each subset supplied data on job title, grade, sex, age, time since qualification, time in grade, time employed within the authority, the number of hours worked each week and shift worked (days, nights or rotating shifts), and working environment (eg hospital-based vs community-based).
Stress questionnaire The instrument used to investigate and measure
stress was the Occupational Stress Indicator, a self- completion questionnaire, devised by Cooper, Sloan and Williams.“ The structure of the OSI in terms of its component scales and subscales is shown in Fig. 1. It consists of six scales (each of which provides a number of subscale scores) from a total of 167 items using Likert-type rating scales. The OSI provides a number of independent vari- ables (sources of pressure at work, Type A behav- iour pattern, perceived locus of control of the work environment, use of various coping with stress stra- tegies) and dependent variables (ratings of current health, both mental and physical, and job satisfac- tion). Reliability and validity data for the Occupa- tional Stress Indicator (OSI) are widely a~a i l ab le ’~ . ’~ and are of a high standard.
The OSI provides a comprehensive analysis of work stress and has been widely used as a diagnos- tic tool. Although the OSI was originally devised to examine the above variables among white collar workers, it has been found to be equally valid for use with health care professionals and blue collar workers.12
Sources of pressure
a variety of job stressors: This scale consists of six subscales which measure
1.
2.
3.
4.
5.
6.
‘Factors intrinsic to the job’, looks at workload, variety of tasks, and rates of pay. ‘Management role’ is concerned with how indi- viduals perceive the expectations other have of them and includes role ambiguity and role con- flict. ‘Relationships with others’ looks at pressures that arise from personal contacts at work includ- ing ‘office politics’ and asks about possible lack of support from superiors. ‘Career and achievement’ is concerned with respondents’ perception of their career develop- ment, their promotion prospects and perceived threats of redundancy. ‘Organizational structure and climate’ looks at problems that may arise from bureaucracy, com- munication problems and morale in the organ- ization. ‘Home and work’ is concerned with the interface between home and work. It asks about whether home problems are brought to work and

82 D. REES AND C. L. COOPER
STRESS ELEMENTS
Source of Pressure
~ intrinsic to the job - management role - relationships with
others - career and achievement ~ organizational
structure and climate - home/work interface
INDIVIDUAL DIFFERENCES
Type A Behaviour Pattern
- attitude to living ~ style of behaviour - ambition
Perceived Locus of Control
- organizational forces ~ management process ~ individual influence
Coping With Stress
- social support - task strategies - logic - homeiwork relations - time management ~ involvement
STRAIN EFFECTS
Current State of Health
- mental ill-health ~ physical ill-health
Job Satisfaction
~ achievement, value and growth
job itself ~ organizational design
and structure - organizational
processes - personal relationships
Fig. 1-Structure of the Occupational Stress Indicator
whether work has a negative impact on home life.
Type A behuviour pattern This scale produces three subscale scores which
are summated to produce a total Type A score:
1. ‘Attitude to living’ measures attitudinal aspects of Type A such as confidence, commitment to work and how much of a priority it is.
2 . ‘Style of behaviour’ assesses the behavioural aspects of Type A including time pressure and abruptness of behaviour.
3. ‘Ambition’ measures aspects of achievement needs.
Perceived locus of control This scale produces three subscale scores which
are summated to produce an overall perceived LOC score. The items in this scale ask about an indivi- dual’s control or autonomy over a number of work situations:
influence over the ‘invisible’ influences and con- straints within the organization.
2. ‘Management processes’ looks at how subjects’ performance is appraised, how they get pro- moted or progress and their influence over these.
3. ‘Individual influence’ looks at a more general ability to have influence within the workplace.
Coping with stress
of use of six kinds of stress-coping strategies:
I . ‘Social support’ looks at subjects’ use of various means of informal and formal personal support networks.
2. ‘Task strategies’ looks at how individuals organ- ize their work into manageable chunks and for- ward planning.
3. ‘Logic’ addresses respondents’ adoption of an unemotional and rational approach to situ- ations.
4. ‘Home and work relationships’ is concerned with the use of non-working time to dissipate
This scale asks respondents to rate the frequency
1 . ‘Organizational forces’ control measures the stress. extent to which respondents perceive their 5. ‘Time management’ measures aspects of work

HEALTH SERVICE WORKERS 83
6.
organization in terms of priority setting and use of delegation. ‘Involvement’ is concerned with individuals’ job commitment and acceptance of the situation in which they work.
THE SAMPLE
The full sample ( N = 1176) had a mean age of 35.7 years (SD = 10.1). Nearly 72 per cent were female. Eighty per cent had a vocational qualification, and those qualified had been so for a mean of 10.5 years
DEPENDENT VARIABLES
The Occupational Stress Indicator (OSI) provides two kinds of criterion measures, current state of health and job satisfaction. Both were included in the present study because of the extensive research evidence indicating their relationship with indivi- dual turnover, absenteeism and job performance. l 4
Current state of health This is in two parts, mental and physical ill-
health. These two aspects of well-being are meas- ured using six-point Likert-type scales of symptom frequency: 1. ‘Mental ill-health’ taps a range of cognitive
2. ‘Physical ill-health’ looks at the somatic symp- aspects of strain.
toms of anxiety and depression.
Job satisfLacfian This scale produces five subscale scores which
are summated to provide an overall job satisfaction score:
1. ‘Achievement, value and growth’ looks at respondents’ perceived opportunities for advan- cement, how valued they feel and whether their job is rewarding.
2. ‘Job itself measures satisfaction with the type of work undertaken.
3. ‘Organizational design and structure’ looks at how well the organization functions.
4. ‘Organizational processes’ looks at perceptions of whether the organization facilitates or hinders getting things done.
5. ‘Personal relationships’ examines views about the quality of personal relationships at work.
Sickness absence Subjects were asked to state how much sick leave
they had taken in the previous six months. The self-reports were compared to actual sickness absence for 182 sub‘ects. The resulting correlation coefficient was 0.96. .15
(SD =8.8). The mean time in grade was 4.5 years (SD = 5.2) and the mean time employed within the district was 7.5 years (SD = 6.9). Nearly 85 per cent of staff were full time with 88 per cent working on days, 5.5 per cent nights and 5 per cent rotating shifts.
The subjects reported a mean sickness absence of 4.39 days (SD = 9.1). Forty per cent of staff reported taking no sick leave, 36 per cent took between one and 5 days, 12 per cent six to 10 days and 10 per cent more than 10 days.
RESULTS
The questionnaires were returned by 129 (69 per cent) of administrative and clerical staff, 65 (39 per cent) of ancillary and maintenance staff, 153 (59 per cent) of doctors, 555 (68 per cent) of nurses, 147 (75 per cent) of professions allied to medicine, 66 (57 per cent) of scientists and technicians, and 12 (80 per cent) of general managers. The occupa- tional groups of 49 staff are unknown because of missing data. On the whole, the response rate was very good for a postal survey. The poor response rate for ancillary and maintenance staff was expected because the OSI is more white collar and professionally orientated, and shopfloor workers are less experienced in questionnaire responding.
Control comparisons The health service workers’ OSI scores were com-
pared with recently updated normative data on 6326 non-health care workers;’* the results are shown in Table 1.
As Table 1 indicates, the health care workers reported significantly higher pressure on five of the six OSI sources of job pressure variables, but did not differ in reports of pressure from ‘factors intrin- sic to the job’. The health care workers scored signi- ficantly lower on all three Type A variables (and thus also on total Type A) and as more ‘internal’ in their perceived locus of control on two of the three variables and on total perceived locus of con- trol. Health care workers also reported more fre- quent use of a number of stress-coping strategies

84 D. REES AND C L. COOPER
Table 1-Health workers’ OSI scores and comparison with the OSI normative group
Health workers OSI normative group ( N = 1157-1 163) ( N = 6326)
OSI variables Mean (SD) Mean (SD) Difference t ratio (0)
Sources ofpressure Factors intrinsic to the job The managerial role Relationships with other people Career and achievement Organizational design and structure Home-work interface
Attitude to living Style of behaviour Ambition Total Type A
Perceived locus of control Organizational forces Management processes Individual influence Total locus of control
General behaviour
Coping with stress Social support Task strategies Logic Home and work Time management Involvement
Current state of health Mental ill-health Physical ill-health Job satisfaction Achievementhahe growth The job itself Organizational design and structure Organizational processes Personal relationships Total iob satisfaction
30.09 36.28 3 1.70 30.01 41.06 31.78
20.75 17.25 10.72 48.73
18.56 13.49 10.20 42.24
16.57 25.87 12.29 16.23 14.49 23.48
52.03 30.04
21.59 16.42 16.83 15.44 11.89 82.17
(6.42) (8.46) (7.63)
(8.85) (10.42)
(3.31) (3.62) (2.18) (6.73)
(2.78) (1.92)
(4.81)
(3.10) (3.84) (2.07) (3.39) (2.16) (3.50)
(7.74)
(2.00)
(13.40) (9.49)
(5.89) (3.14) (4.16) (3.71) (2.44)
( 1 6.64)
30.19 35.53 30.16 28.02 38.14 31.00
22.29 17.91 11.41 51.62
18.54 14.18 10.49 43.20
14.89 25.30 12.48 15.28 14.32 23.17
56.54 29.69
21.66 16.34 16.73 15.54 11.78 81.76
(6.56) t =0.486 (NS) (8.54) t = 3.506 ( p < 0.001) (7.51) t =6.330 ( p < 0.001) (8.23) t = 7.960 ( p < 0.001) (9.24) t = 10.249 ( p < 0.001)
(10.22) t = 2.349 ( p < 0.02)
(3.85) t = 14.180 ( p <0.001) (3.87) t = 5.709 ( p <0.001) (2.29) t = 9.857 ( p <0.001) (7.71) t = 13.126 ( p <0.001)
(2.98) t =0.310 (NS) (2.37) t = 10.798 ‘ (p < 0.001) (2.16) t =4.475 ( p < 0.001) (5.91) t = 6.009 ( p < 0.001)
(3.25) t = 16.834 ( p < 0.001) (3.71) t =4.672 ( p < 0.001) (2.18) t =2.849 ( p < 0.001) (3.70) t =8.639 ( p < 0.001) (2.14) t = 2.457 ( p < 0.001) (3.42) t =2.780 ( p < 0.001)
(12.47) t = 10.662 ( p < 0.001) (9.79) t = 1.151 (NS)
(5.74) t =0.690 (NS) (3.25) t=0.794 (NS) (4.17) t =0.753 (NS) (3.78) t=0.840 (NS) (2.51) t = 1.405 (NS)
(16.64) t = 0.779 (NS) Note: The probability values are for two-tailed tests.
(social support, task strategies, use of home, time management and involvement), but significantly less use of logic. On the strain side of the stress- strain equation, health workers reported signifi- cantly lower mental ill-health scores, although the two groups were similar on the physical ill-health measure. The groups did not differ in reported levels of job satisfaction.
The OSI does not provide cut-off scores to, for example, distinguish those with clinically signifi- cant mental and physical health problems from others. One way of doing this is to compare the
obtained current state of health scores of health care workers with those obtained by patients with psychoneurotic problems. Some OSI normative data have been collected from patients attending departments of clinical psychology in Manchester with problems of anxiety and depression. The pre- liminary data provide a mean mental ill-health score of 77.11 (SD 13.64) and physical ill-health score of 45.38 (SD = 10.25). If ‘caseness’ is defined by health care workers scoring at or above the mean score obtained by patients, 3.5 per cent of the sample would be cases on the basis of mental ill-
HEALTH SERVICE WORKERS 85
health scores, 7.6 per cent on physical ill-health and 1.7 per cent on both indicators.
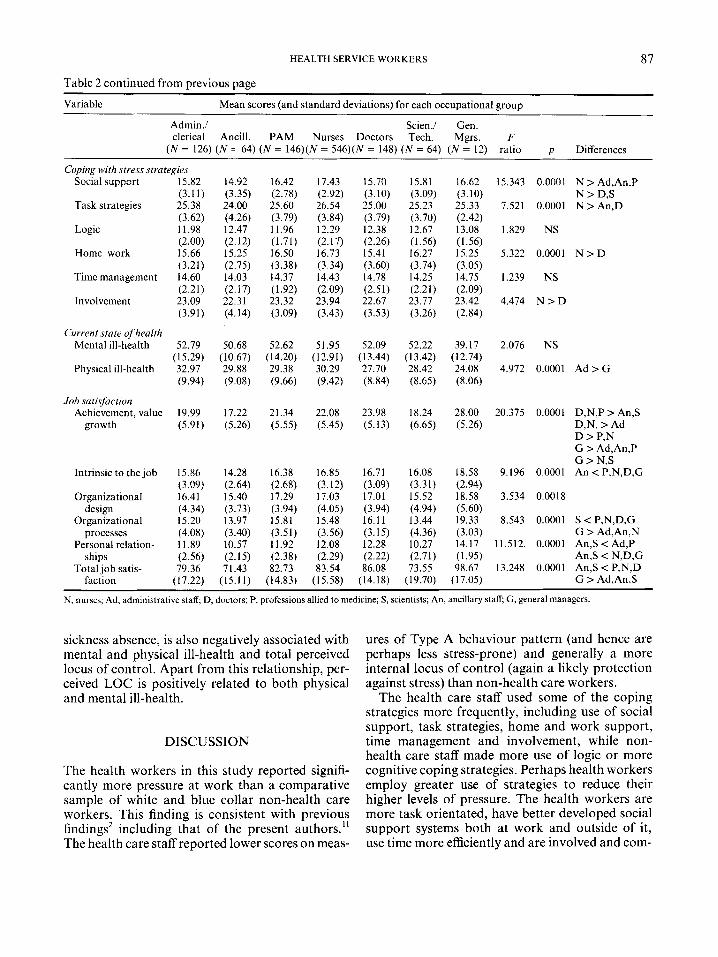
Stafl diflerences Table 2 present OSI mean scores (and standard
deviations) obtained by the seven groups of staff and the results of a series of one-way analyses of variance. Intergroup differences are reported to be significantly different at the 5 per cent level of prob- ability, using the Scheffe procedure for multiple comparisons (this procedure produces conservative estimates of significant differences).
As Table 2 indicates, there was a significant main effect on all six sources of job pressure variables. The general managers were shown to be consis- tently lower than other groups on all variables, although this did not result in many statistically significant differences because of their small group size (N= 12). The nurses scored higher than ad- ministrative and clerical staff on five of the six stres- sor variables. Doctors reported significantly lower scores on pressure from ‘managerial role’ than nurses and lower scores on pressure from ‘relation- ships’ with others in comparison with professions allied to medicine (PAMs), nurses and scientists and technicians. Doctors also scored significantly lower than all other groups, with the exception of general managers, on ‘career and achievement’ pressure. Nurses reported significantly more pres- sure from ‘organizational design and structure’ than administrative staff, PAMs and doctors. Nurses also reported significantly higher pressure from the home-work interface than administrative staff, PAMs and scientists.
A significant main effect was found on each of the Type A behaviour pattern variables. Overall, the general managers had the highest scores on two of the three variables and on total Type A, although as they were a small group this was not reflected in statistically significant differences. Doctors had the second highest scores on Type A variables. The difference between this group’s scores on the vari- able ‘attitude to living’ was significantly higher than that obtained by PAMs. The doctors scored signifi- cantly higher than the nurses and administrative staff on ‘ambition’ (on which they also scored higher than ancillary staff) and total Type A (on which they also scored higher than PAMs).
A significant main effect was found on two of the three perceived locus of control (LOC) vari- ables (and on total LOC score) but intergroup com- parisons revealed only one significant difference.
Doctors reported a significantly more ‘internal’ locus of control than nurses. Although general managers scored lower than all other groups on all of the perceived LOC variables, none of the differences were statistically significant.
Significant main effect were found on four of the coping with stress variables: social support, task strategies, home and work, and involvement. Nurses made significantly more frequent use than doctors of these four variables. Nurses made more frequent use of social support than administrative, ancillary and PAM staff and also of task strategies than ancillary staff. General managers were inter- mediate on these variables.
There was no significant main effect for mental ill-health. Although general managers reported a substantially lower score than all the other groups on this variable (as on physical ill-health too), the differences did not reach statistical significance. A significant main effect was found for physical ill- health, although the only intergroup comparison to reach statistical significance was that administra- tive and clerical staff scored significantly higher than general managers.
A significant main effect was found on all five job satisfaction Variables and also on total job satis- faction. The intergroup differences on satisfaction from ‘achievement, value and growth’ show an almost hierarchical arrangement with general managers scoring as being significantly more satis- fied than all other groups with the exception of doctors. The doctors scored significantly higher than all groups apart from general managers. The nurses and PAMs scored more than ancillary staff and scientists (the two groups with the lowest levels of job satisfaction), and the nurses also scored higher than the administrative staff.
The ancillary staff also reported the lowest levels of job satisfaction intrinsic to the job and their score was found to be significantly lower than PAMs, nurses, doctors and general managers. No intergroup differences were found on satisfaction from ‘organizational design and structure’. Differ- ences, however, were found with satisfaction from ‘organizational processes’. On this variable, the general managers, who had by far the highest score, scored significantly higher than administrative staff, ancillary staff, nurses and scientists. The scientists scored lowest on this variable, their score being significantly lower than PAMs, nurses, doc- tors and, as mentioned above, general managers. Differences were found between groups on satisfac- tion from personal relationships. The ancillary staff

86 D. REES AND C. L. COOPER
Table 2-Summary of ANOVA across occupational groups on OSI variable scores Variable Mean scores (and standard deviations) for each occupational group
Admin./ Scien./ Gen. clerical Ancill. PAM Nurses Doctors Tech. Mgrs. F
(N = 126) (N = 64) ( N = 146)(N = 546)" = 148) (N = 64) ( N = 12) ratio D Differences
Sources of Pressure Intrinsic to the
Management role
Relationships with
Career/
job
others
achievement
Organization
Home-work design/struct.
28.25 (5.81) 33.15 (7.85) 29.44 (6.71) 29.25 (7.12)
37.87 (8.92) 28.25 (9.64)
30.23 (7.06) 35.11 (8.36) 32.02 (7.79) 32.94 (6.82)
41.78 (8.70) 32.78
(10.25)
General behaviour Attitude to living 20.27 21.36
(3.02) (3.32) Style of behaviour 17.29 16.88
(3.64) (3.23) Ambition 10.53 9.95
(1.95) (1.65) Total Type A 48.09 48.19
(6.36) (5.79)
Perceived locus of control Organizational 18.94
forces (2.59) Management 13.92
processes (2.20) Individual 10.39
influence (1.86) Total locus of 43.25
Control (4.42)
Table 2 continues opposite.
29.40 (6.61) 35.50 (8.45) 31.57 (7.72) 29.25 (6.78)
39.47 (9.03) 30.18
(10.48)
20.23 (2.97) 17.02 (3.06) 10.85 (1.98) 48.10 (5.84)
30.77 (6.47) 38.02 (8.49) 33.32 (7.61) 31.37 (7.76)
43.10 (8.41) 33.42
(10.85)
20.64
16.84
10.57 (2.18) 48.05 (6.87)
(3.44)
(3.74)
30.09 (6.26) 34.28 (7.62) 28.60 (6.82) 25.45 (7.47)
38.03 (8.60) 31.76 (8.80)
21.68 (3.34) 18.30 (3.59) 11.59 (2.38) 51.57 (6.83)
30.95 (4.89) 36.97 (7.24) 32.34 (7.06) 31.88 (5.54)
41.50 (7.29) 28.91 (8.35)
26.17 (8.02) 31.17 (8.83) 23.92 (5.87) 23.00 (7.85)
35.50 (10.84) 26.25 (9.50)
3.946 0.0015 N > Ad
10.877 0.0001 N > A d
12.781 0.0001 D < P,N,S N > D
N > A d 18.469 0.0001 D < Ad.An.P , ,
D < N,S P < A n
14.590 0.0001 N > Ad,P,D
7.644 0.0001 N > Ad,P,S
20.73 22.50 4.051 0.0002 D > P (3.1 1) (3.29) 17.30 19.75 4.496 0.0001 D > N (3.38) (2.70) 10.78 11.42 6.329 0.0001 D > N,Ad,An (2.52) (2.39) 48.81 53.67 7.101 0.0001 D>Ad,P ,N (7.20) (5.00)
18.24 18.34 18.66 18.56 18.42 16.75 1.653 NS (2.29) (3.09) (2.99) (2.23) (1.90) (2.86) 13.48 13.83 13.28 13.70 13.33 13.00 3.475 0.0021 (1.86) (1.78) (1.91) (1.85) (1.65) (1.86) 10.09 10.55 10.05 10.31 10.73 9.67 2.399 0.0262 D < N (2.14) (2.11) (2.04) (1.80) (1.92) (2.50) 41.82 42.74 41.99 42.57 42.48 39.42 2.285 0.0338 (5.04) (5.23) (5.00) (4.26) (3.79) (6.64)
and scientists scored significantly lower than the other five groups on this variable.
The general managers reported the highest level of overall job satisfaction (they scored as the high- est group on all five satisfaction variables). The ancillary staff and scientists scored significantly lower on total job satisfaction than PAMs, nurses, doctors and general managers. The latter group also scored significantly higher than administrative staff on this variable.
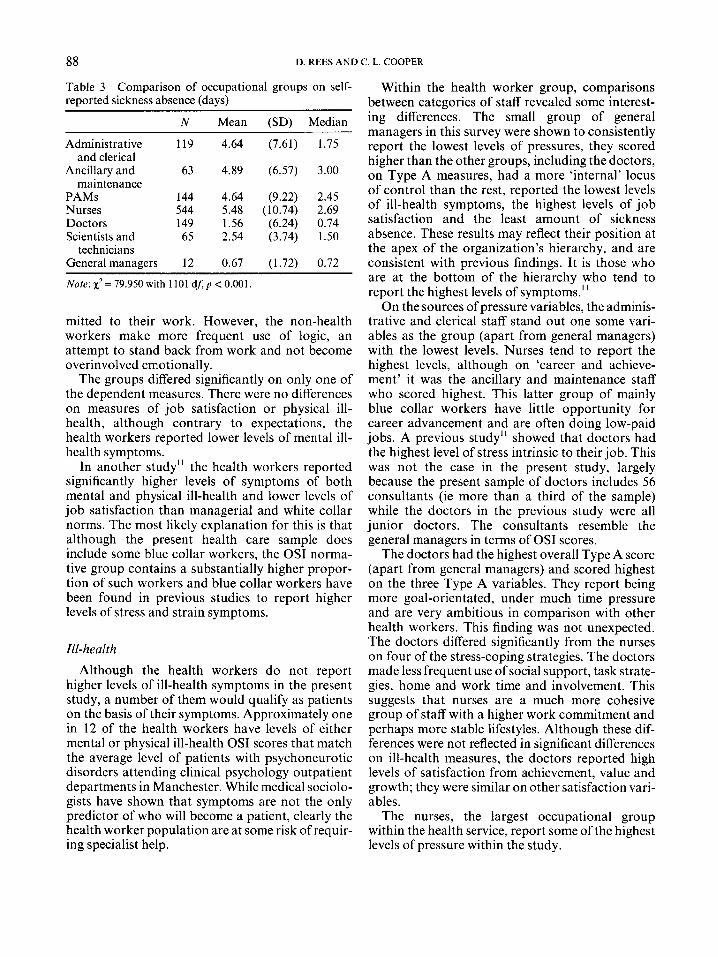
Sickness absence
Table 3 shows the self-reported sickness absence records of the occupational groups. The differences between groups are statistically significant &' = 79.950 with 1101 df,p < 0.001). Using a I per
cent level as indicative of significant intergroup dif- ference, a series of Mann-Whitney tests showed that general managers and doctors took signifi- cantly less sick leave than all other groups (although the difference between general managers and scientists only approached significance).
Self-reported sickness absence in this population is a ver reliable measure of actual sickness absence."Table 4 shows the relationships between each of the OSI scales and self-reported sickness absence. There is a positive significant association between sickness and mental and physical ill- health, and a negative significant relationship between sickness absence and job satisfaction and Type A behaviour pattern, although for this latter association the relationship is weak. Job satisfac- tion, in addition to its negative relationship with
HEALTH SERVICE WORKERS 87
Table 2 continued from previous page
Variable Mean scores (and standard deviations) for each occupational group
Admin./ Scien./ Gen. clerical Ancill. PAM Nurses Doctors Tech. Mgrs. F
( N = 126) ( N = 64) ( N = 146)(N = 546)(N = 148) ( N = 64) ( N = 12) ratio
Coping with stress strategies Social support 15.82 14.92 16.42 17.43 15.70 15.81 16.62 15.343
Task strategies 25.38 24.00 25.60 26.54 25.00 25.23 25.33 7.521
Logic 11.98 12.47 11.96 12.29 12.38 12.67 13.08 1.829
Home-work 15.66 15.25 16.50 16.73 15.41 16.27 15.25 5.322
Timemanagement 14.60 14.03 14.37 14.43 14.78 14.25 14.75 1.239
Involvement 23.09 22.31 23.32 23.94 22.67 23.77 23.42 4.474
(3.11) (3.35) (2.78) (2.92) (3.10) (3.09) (3.10)
(3.62) (4.26) (3.79) (3.84) (3.79) (3.70) (2.42)
(2.00) (2.12) (1.71) (2.17) (2.26) (1.56) (1.56)
(3.21) (2.75) (3.38) (3.34) (3.60) (3.74) (3.05)
(2.21) (2.17) (1.92) (2.09) (2.51) (2.21) (2.09)
(3.91) (4.14) (3.09) (3.43) (3.53) (3.26) (2.84)
Current state of health Mental ill-health 52.79 50.68 52.62 51.95 52.09 52.22 39.17 2.076
Physical ill-health 32.97 29.88 29.38 30.29 27.70 28.42 24.08 4.972 (15.29) (10.67) (14.20) (12.91) (13.44) (13.42) (12.74)
(9.94) (9.08) (9.66) (9.42) (8.84) (8.65) (8.06)
Job satisfaction Achievement, value 19.99 17.22 21.34 22.08 23.98 18.24 28.00 20.375
growth (5.91) (5.26) (5.55) (5.45) (5.13) (6.65) (5.26)
Intrinsic to the job
Organizational design
Organizational processes
Personal relation- ships
Total job satis- faction
15.86 (3.09) 16.41 (4.34) 15.20 (4.08) 11.89 (2.56) 79.36
(1 7.22)
14.28 (2.64) 15.40
13.97 (3.40) 10.57
7 I .43 (15.1 I )
(3.73)
(2.15)
16.38 (2.68) 17.29 (3.94) 15.81 (3.51) 11.92 (2.38) 82.73
(14.83)
16.85 (3.12) 17.03 (4.05) 15.48 (3.56) 12.08 (2.29) 83.54
(1 5.58)
16.71 (3.09) 17.01 (3.94) 16.11 (3.15) 12.28
86.08 (14.18)
(2.22)
16.08 (3.31) 15.52 (4.94) 13.44 (4.36) 10.27 (2.71) 73.55
(1 9.70)
18.58 9.196 (2.94) 18.58 3.534 (5.60) 19.33 8.543 (3.03) 14.17 11.512. (1.95) 98.67 13.248
(17.05)
p Differences
0.0001 N > Ad,An,P
0.0001 N > An.D N > D,S
NS
0.0001 N > D
NS
N > D
NS
0.0001 A d > G
0.0001 D,N,P > An,S D,N, > Ad D > P,N G > Ad,An,P G > N,S
0.0001 An < P,N,D,G
0.0018
0.0001 S < P,N,D,G G > Ad,An,N
0.0001 An,S < Ad,P An,S < N,D,G
0.0001 An,S < P,N,D G > Ad,An,S
N, nurses; Ad, administrative staff; D, doctors; P, professions allied to medicine; S , scientists; An, ancillary staff; G , general managers
sickness absence, is also negatively associated with mental and physical ill-health and total perceived locus of control. Apart from this relationship, per- ceived LOC is positively related to both physical and mental ill-health.
DISCUSSION
The health workers in this study reported signifi- cantly more pressure at work than a comparative sample of white and blue collar non-health care workers. This finding is consistent with previous findings2 including that of the present authors.” The health care staff reported lower scores on meas-
ures of Type A behaviour pattern (and hence are perhaps less stress-prone) and generally a more internal locus of control (again a likely protection against stress) than non-health care workers.
The health care staff used some of the coping strategies more frequently, including use of social support, task strategies, home and work support, time management and involvement, while non- health care staff made more use of logic or more cognitive coping strategies. Perhaps health workers employ greater use of strategies to reduce their higher levels of pressure. The health workers are more task orientated, have better developed social support systems both at work and outside of it, use time more efficiently and are involved and com-
88 D. REES AND C. L. COOPER
Table 3-Comparison of occupational groups on self- reported sickness absence (days)
N Mean (SD) Median
Administrative 119 4.64 (7.61) 1.75
Ancillary and 63 4.89 (6.57) 3.00
PAMs 144 4.64 (9.22) 2.45 Nurses 544 5.48 (10.74) 2.69 Doctors 149 1.56 (6.24) 0.74 Scientists and 65 2.54 (3.74) 1.50
General managers 12 0.67 (1.72) 0.72
and clerical
maintenance
technicians
~~
Note: x2 = 79.950 with 1101 dA p < 0.001,
mitted to their work. However, the non-health workers make more frequent use of logic, an attempt to stand back from work and not become overinvolved emotionally.
The groups differed significantly on only one of the dependent measures. There were no differences on measures of job satisfaction or physical ill- health, although contrary to expectations, the health workers reported lower levels of mental ill- health symptoms.
In another study" the health workers reported significantly higher levels of symptoms of both mental and physical ill-health and lower levels of job satisfaction than managerial and white collar norms. The most likely explanation for this is that although the present health care sample does include some blue collar workers, the OSI norma- tive group contains a substantially higher propor- tion of such workers and blue collar workers have been found in previous studies to report higher levels of stress and strain symptoms.
Ill-health Although the health workers do not report
higher levels of ill-health symptoms in the present study, a number of them would qualify as patients on the basis of their symptoms. Approximately one in 12 of the health workers have levels of either mental or physical ill-health OSI scores that match the average level of patients with psychoneurotic disorders attending clinical psychology outpatient departments in Manchester. While medical sociolo- gists have shown that symptoms are not the only predictor of who will become a patient, clearly the health worker population are at some risk of requir- ing specialist help.
Within the health worker group, comparisons between categories of staff revealed some interest- ing differences. The small group of general managers in this survey were shown to consistently report the lowest levels of pressures, they scored higher than the other groups, including the doctors, on Type A measures, had a more 'internal' locus of control than the rest, reported the lowest levels of ill-health symptoms, the highest levels of job satisfaction and the least amount of sickness absence. These results may reflect their position at the apex of the organization's hierarchy, and are consistent with previous findings. It is those who are at the bottom of the hierarchy who tend to report the highest levels of symptoms."
On the sources of pressure variables, the adminis- trative and clerical staff stand out one some vari- ables as the group (apart from general managers) with the lowest levels. Nurses tend to report the highest levels, although on 'career and achieve- ment' it was the ancillary and maintenance staff who scored highest. This latter group of mainly blue collar workers have little opportunity for career advancement and are often doing low-paid jobs. A previous study'' showed that doctors had the highest level of stress intrinsic to their job. This was not the case in the present study, largely because the present sample of doctors includes 56 consultants (ie more than a third of the sample) while the doctors in the previous study were all junior doctors. The consultants resemble the general managers in terms of OSI scores.
The doctors had the highest overall Type A score (apart from general managers) and scored highest on the three Type A variables. They report being more goal-orientated, under much time pressure and are very ambitious in comparison with other health workers. This finding was not unexpected. The doctors differed significantly from the nurses on four of the stress-coping strategies. The doctors made less frequent use of social support, task strate- gies, home and work time and involvement. This suggests that nurses are a much more cohesive group of staff with a higher work commitment and perhaps more stable lifestyles. Although these dif- ferences were not reflected in significant differences on ill-health measures, the doctors reported high levels of satisfaction from achievement, value and growth; they were similar on other satisfaction vari- ables.
The nurses, the largest occupational group within the health service, report some of the highest levels of pressure within the study.

HEALTH SERVICE WORKERS 89
Table &Intercorrelations between OSI scales and sickness absence
Physical Type A behaviour Sickness absence Mental ill-health ill-health pattern Control
Mental ill-health 0.146*** Physical ill-health 0.189***
Control 0.056 Type A behaviour -0.059*
Job satisfaction -0.1 19***
0.531*** 0.004 0.207***
-0.302***
0.001 0.197*** - -0.226***
-0.038 0.047 -0.342***
* p < 0.05. ***p < 0.001
The ancillary and maintenance staff and scien- tists and technicians had the lowest overall levels of job satisfaction. These two groups may lack the potential stress of dealing face to face with patients but lack the positive satisfaction that can be gained from it.
The groups were found to differ in the amount of sick leave taken. As one might expect, the group with the lowest levels of self-reported sickness absence were the general managers (low pressure, high Type A, good measure of perceived internal control, high job satisfaction) and doctors who share many of the above protectors against stress at work. The ancillary workers have the highest sickness absence rate, perhaps reflecting their general lack of satisfaction with their work.
Self-reported sickness absence was found to be related, as one might expect, with measures of ill-health symptoms. Although the correlations achieved were highly significant, they were quite small, indicating little shared variance. As expected there was a significant inverse relationship between job satisfaction and sickness absence, suggesting that if job satisfaction could be increased then sick- ness absence might decrease. An alternative expla- nation for the inverse relationship might be that staff who took sick leave were criticized or treated in a negative way by their colleagues and managers who had to continue to provide a service during their absence.
Occupational stress appears at all levels of the workforce within a health authority, albeit at lower levels amongst its most senior staff. Stress is not specifically a disease of middle or senior managers but one that is more likely to occur in staff in jobs with little intrinsic job satisfaction. Within a health authority, it is not necessarily those who work in direct contact with patients who suffer most from stress. While such work may present special stres-
sors, these may be compensated for by providing much job satisfaction.
REFERENCES
1. Palmer, S. Occupational stress. Health and Safety Practitioner 1989; August, 16-18.
2. Payne, R. and Firth-Cozens, J. (Eds) Stress in Health Professionals. Wiley, Chichester, 1987.
3. Bailey, R. D. Coping With Stress In Caring. Black- well, Oxford, 1985.
4. Maslach, C. Burn-out-The Cost of Caring. Prentice Hall, Englewood Cliffs, 1982.
5. Leiter, M. P. and Maslach, C. The impact of interper- sonal environment on burnout and organizational commitment. J. Organiz. Behav. 1988; 9: 297-308.
6. Rotter, J. B. Generalized expectancies for internal vs external control of reinforcement. Psychol. Monogr. 1966; 80: 609.
7. Houston, B. K. and Snyder, C. R. (Eds) Type A Behaviour Pattern: Research, Theory and Interven- tion. Wiley, Chichester, 1988.
8. Jick, T. D. and Mitz, L. F. Sex differences in work stress. Acud. Man. Rev. 1985; 10: 408420.
9. Cooper, C. L. and Baglioni, A. J . A structural model approach toward the development of a theory of the link between stress and mental health. Brit. J. Med.
10. Cooper, C. L., Sloan, S. J. and Williams, S. Occupa- tional Stress Indicator Management Guide. NFER- Nelson, Windsor, 1988.
11. Rees, D. W. and Cooper, C. L. Occupational stress in health service employees. Health Serv. Man. Res.
12. Cooper, C. L., Sloan, S. J . and Williams, S. Occupa- tional Stress Indicator Data Supplement. NFER-Nel- son, Windsor, 1989.
13. Robertson, I . R. and Cooper, C. L. The validity of the occupational stress indicator. Work and Stress
Psychol. 1988; 61: 87-102.
1990; 3: 163-172.
1990; 4: 29-39.

90 D. REES AND C. L. COOPER
14. Griffin, R. W. and Bateman, R. S. Job satisfaction and organizational commitment. In: .International Review ofI /O Psychology. Cooper, C. L. and Robert- son, I. T. (Eds) Wiley, Chichester, 1986.
15. Rees, D. W. Stress in health service employees: A diagnostic survey. Unpublished MSc thesis, Univer- sity of Manchester, Faculty of Technology.