oce-93-1 dairy programs: effects of the dairy termination
TRANSCRIPT
i 1 itlit (4 Stat (3 (;c~rrt~r;tl Acwr~nt ing Of’fiw .I _ _-~_
GAO Ii-cqmrt, t,o tlhc Scxretary of Agric:ultJurc~
.11lflt” I’)%I * * DAIRY PROGRAMS
Effects of the Dairy Termination Program and Support Price Reductions
.~--,- ..- _-_... ---.” .----. ““-“-~ -,_. ---I---

GAO United States General Accounting Office Washington, D.C. 20648
Office of the Chief Economist
B-21 1447
June 15,1993
The Honorable Mike Espy The Secretary of Agriculture
The Food and Security Act of 1985 authorized the Dairy Termination Program (during 1986 and 1987) and a series of reductions in the dairy support price (1986 to 1990). Both program initiatives were intended to reduce government expenditures associated with federal purchases of surplus dairy products under the dairy support price program. This report presents estimates of the long-term consequences of these dairy program initiatives. Our purpose is to provide interested parties with information and projections that may be of assistance in deliberations on future dairy program initiatives.
We previously reported on the consequences of the Dairy Termination Program (DTP). 1 This report presents a more complete analysis of government dairy policy since 1986 because it also analyzes support price reductions and incorporates recent data that are necessary to extend our projections of program consequences to include the 1990s. Specifically, we used an economic model of the dairy sector to estimate the effects of each program initiative on government purchases under the dairy support price program from 1986 through 2001. (See app. I.) The analyses were supplemented by data obtained through our recent survey of DTP participants. (See apps. II and III.) We also present estimates of the extended effects of each program on government expenditures and the welfare of consumers and producers, and we project government purchases through 2001 under current policy.
The Food and Security Act of 1985 reduced dairy support prices in both the first and the fourth quarters of calendar year 1987. It also permitted the Secretary of Agriculture to further adjust the support price up or down by 50 cents per hundredweight at the beginning of calendar years 1988,1989, and 1990, depending on projected government purchases. The act stipulated, however, that the Secretary could reduce support prices in these 3 years only if DPT was successfully completed. Under DTP, the U.S. Department of Agriculture (USDA) paid participating farmers to dispose of their entire dairy herds, either by slaughter or by export, during 1986 and 1987. Participants also agreed not to involve themselves or their facilities in dairy production for 5 years. Although DTP reduced dairy production capacity for a time, it was not designed to permanently do so. Nonetheless,
‘Dairy Termination Program: An Estimate of Its Impact and Cost-Effectiveness (GAOBCED-8986, hly 6, 1989).
Page 1 GAO/OCE-93-1 Dairy Programs

B-211447
the program did ease farmers’ transition to lower support prices by rapidly retiring excess production capacity. This perspective suggests that DTP and the support price reductions that were enacted concurrently should be evaluated jointly.
Results in Brief DTP, are likely to reduce government purchases of excess dairy products by about 10 billion pounds (milk-equivalent, milk-fat basis) annually from 1988 to 2001. Between 1986 and 2001, these reductions in both the support price and government purchases will save the government an estimated $8.5 billion, will benefit consumers by nearly $3.3 billion, and will cost producers around $2.3 billion (in 1986 dollars).
Assuming no further adjustments to current dairy policy, we project that government purchases of excess dairy products will remain at about their current level of 8 billion to 10 billion pounds annually through 1997 and then will decline to below 5 billion pounds by 2001. Despite the near constancy of the quantity of government purchases in recent years, however, government outlays associated with the support price program have been substantially reduced. This occurred because of legislated reductions in the support price in general and because of further downward adjustments in the government purchase price for butter, compared with the government purchase prices for cheese and nonfat dry milk, at a time when butter accounts for most government purchases.
Background Under the dairy support price program, the federal government stands ready to purchase manufactured dairy products-cheese, butter, and nonfat dry milk-that manufacturers consider in excess of the supply necessary to meet private sector demand at the federal support price level. A Support price levels generally have been high enough to encourage excess production and therefore to require government purchases.
The support price level was raised to an all-time high (in constant dollar terms) during 1980, and this quickly resulted in substantial increases in government purchases. Specifically, during the 198Os, annual government purchases (milk-equivalent, milk-fat basis) averaged about 11 billion pounds compared with annual average purchases of about 3.6 billion, 6 billion, and 4.8 billion pounds in the 1970s 196Os, and 1950s respectively. Government outlays (in constant dollars) under the support price program during 1980-82 were more than 2.5 times higher than during
Page 2 GAO/OCE-93-1 Dairy Programs

B-211447
1977-79. To address the problem of excessive government purchases, the Congress enacted several program initiatives, including the Milk Diversion Program (1984-85),2 multiple reductions in the dairy support price, and DTP.
Support Price Reductions The Agriculture Act of 1949 gave the Secretary of Agriculture discretion to adjust the dairy support price annually to between 75 and 90 percent of the parity price index to meet program goals. The 1977 farm bill, however, constrained the Secretary to adjust support prices semiannually to 80 percent of parity or higher. By the late 197Os, parity-tied increases in the support price level began to outpace increases in costs. This improved profitability encouraged dairy producers to increase production so much that by 1980, a more than 20-year decline in the size of the national dairy herd was reversed.
In the 198Os, the Congress enacted legislation to disassociate the support price from the parity index and ultimately lowered the support price from a high of $13.10 (per hundredweight) during 1980-83 to a low of $10.10 by 1990. In constant dollars between 1980 and 1990, the dairy support price fell about 47 percent, while feed costs fell by about 32 percent.
Since 1988, the Secretary of Agriculture has been empowered to lower or raise the support price levels depending on whether government purchases for the coming year were projected to be above or below stated levels. Under the 1990 farm bill, however, while a version of this ad(justment innovation is in effect, the milk-equivalent support price is subject to an absolute minimum of $10.10 per hundredweight. Nonetheless, the Secretary can still minimize government costs by adjusting the individual support purchase prices of butter and nonfat dry milk (because these products are assumed to be jointly produced) as long as the two prices combined maintain the milk-equivalent support price a level. The Secretary is limited, however, to only two adjustments to the butter/nonfat dry milk prices in any calendar year.
Th& Dairy Termination Program
Under DTP, participating farmers were paid to slaughter or export their entire dairy herds. In addition, participants agreed to remove themselves and their facilities from dairy production for at least 5 years. These
%ee Effects and Administration of the 1984 Milk Diversion Program (GAO/RCED%-126, July 29, 1986) for a discussion of that program. We concluded that the program had only a temporary effect. A follow-on study by C. Bausell, D. Belsley, and S. Smith, “An Analysis of 1980s Dairy Programs and Some Policy Implications,” American Journal of Agricultural Economics (Aug. 1992), reached similar conclusions.
Page 3 GAO/OCE-93-1 Dairy Programs

B-211447
program features ensured a protracted reduction in dairy production capacity from preprogram levels.
The actual number of dairy cows disposed of under the DTP was slightly more than 1 million, or about 9 percent of the national dairy herd in 1985. Nearly 590,000 heifers and calves were also disposed of under the DTP. Beginning in 1991, DTP participants became eligible to return to dairy production as their &year agreement expired.
Some DTP Participants W ill Returrho Dairy Production
In the spring of 1991, when DTP participants were furst eligible to return to dairy production, we surveyed 1,145 of the nearly 14,000 DTP participants to obtain information on their intentions to return themselves or their facilities to dairy production.3 Of those surveyed, 85 percent, or 969 participants, returned usable questionnaires. (See app. III.)
The survey results show that returning participants and/or their facilities will likely be responsible for adding about 172,000 cows to dairy production capacity in 1991-96.* As returning participants add to production capacity, however, dairy prices will be subject to greater downward pressure, which should dampen any current dairy producers’ incentive to expand production capacitye6 Using our model of the dairy sector, we project that some such displacement will occur between cows of returnees and existing producers so that returnees will account for a net increase of only about 62,000 cows annually between 1991 and 1995 and only about 23,000 cows annually between 1996 and 2001. That is, returning participants will add slightly more than 0.6 percent to current national capacity in 1991-1995.
The survey results indicated that the median time required for returning participants’ operations to reach full capacity would be about 1 year. a Therefore, most new capacity would have been added during 1991 and 1992. At the time of our survey, about 47 percent of those who were
80ur July 1989 report on the DTP did not examine program consequences beyond 1990 because of data limitations. In particular, as of 1988, when the earlier study was conducted, estimates of participants or their facilities returning to dairy production beginning in 1991 either did not exist or existed with little or no supporting evidence.
‘All survey results presented in this report are subject to a sampling error. The sampling error for this estimate is plus or minus 44,480 cows at the 9%percent level of confidence.
6WhiIe the government support price has, in recent decades, dominated the determination of dairy product prices, it is not the only influence on these prices. Regional market prices often experience price premiums even during times of nationwide surplus. This occurs because a surplus of all dairy products does not occur in all markets at all times.
Page 4 GAO/OCE-93-1 Dairy Programs

B-211447
intending to return and were eligible to do so by September 1991 had already taken such steps as arranging to get cows, adding or reconditioning equipment, acquiring additional land, or building new facilities6
Respondents also indicated that current federal dairy policy was not a dominant factor in their decision to return. Specifically, among those most likely to return, about half indicated that their decision was not affected by the level of the dairy support price. Some returning participants indicated they would return even if the support price ranged between $6 to $10 per hundredweight.
On other issues, over two-thirds of respondents indicated that possible federal approval of Bovine somatotropin (BST), a growth hormone that promotes milk production, did not affect their decision, and more than half indicated that the strength of the local cooperative also did not affect their decision. About half of those participants who indicated they might return believed that government policy likely would shift to dairy production quotas in the next 6 years. We did not, however, attempt to determine if the prospect of quotas was a prominent factor affecting participants’ decisions to return.
Ebtimates of E ixtended Effects of S ;Upport Price Reductions and DTP
Although DTP ended in 1987 and the support price cannot be reduced below the current level of $10.10 per hundredweight, the consequences of both DTP and support price reductions in 198690 will extend through the 1990s and beyond. Our analysis of the effects of these program initiatives covers 1986 to 2001 and incorporates our survey results on the extent to which DTP participants and/or their facilities will return to dairy production.
For our analysis, we developed an economic model of the dairy sector that describes dairy demand, supply, price, and government purchases as determined by a variety of factors, including such government programs as DTP and the support price level, The estimated model was used to simulate the dairy sector both with and without DTP in place and with and without the support price reductions in 1986-90. The simulation results were then used to estimate the effects of each program initiative on government expenditures and the welfare of producers and consumers.
‘The 47-percent estimate is subject to a sampling error of plus or minus 7 percent at the 9%percent level of confidence.
Page 5 GAO/OCE-93-1 Dairy Programs

B-211447
Effects on Government Purchases, Production, Prices, and Consumer Demand
Our analysis suggests that DTP is responsible for reducing government purchases under the dairy support price program by about 37 billion potmds (milk-fat basis) between 1986 and 1990 and by about 49 billion pounds between 1991 and 2001. Further, we estimate that reductions in the support price between 1986 and 1990 reduced government purchases by only about 6 billion pounds during that period but will be responsible for reductions of nearly 61 billion pounds between 1991 and 2001. These results are depicted in figure 1.
Figure 1: Reductions in Government Purchases Because of Program initiatives
3.0 bllllonr of Ibr. per quarter
- DTP initiative -- Lower support price initiative
Combined, the two program initiatives should achieve rather consistent reductions in government purchases of about 10 billion pounds a year between 1988 and 2001. These results are consistent with DTP'S objective of achieving immediate but not lasting results, although DTP'S effects extend well beyond a decade. In contrast, support price reductions bring about more gradual but permanent responses by producers. The complementary effects of the two program initiatives are consistent with viewing DTP as easing the transition to lower support prices.
Page9 GAOIOCE-93-1DairyPrograms
B-211447
Our simulation results also suggest that nearly all reductions in total production that result from the two initiatives are realized as reductions in government purchases. This is because the two initiatives combined do not reduce excess supply (government purchases) to zero.
In addition, dairy prices received by farmers are projected to correspond approximately to support price reductions.’ DTP, however, when considered independently of support price reductions, slightly increases dairy prices. This occurs because DTP reduces excess production, which lessens the downward pressure on prices, or their rate of descent8 The simulation results also show that reductions in the support price, or in dairy prices in general, increase the quantity of dairy products demanded. Because DTP results in slightly higher prices, however, it reduces the quantity demanded.
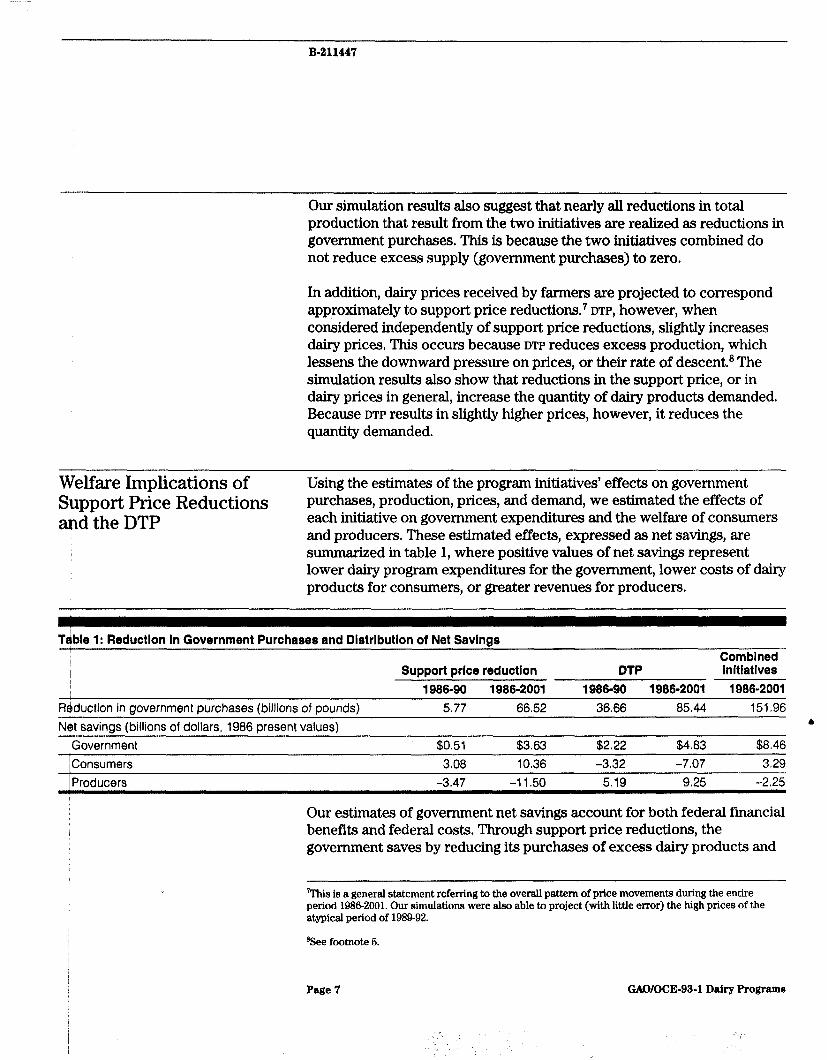
Welfare Implications of Support Price Reductions and the DTP
Using the estimates of the program initiatives’ effects on government purchases, production, prices, and demand, we estimated the effects of each initiative on government expenditures and the welfare of consumers and producers. These estimated effects, expressed as net savings, are summarized in table 1, where positive values of net savings represent lower dairy program expenditures for the government, lower costs of dairy products for consumers, or greater revenues for producers.
Tsible 1: Reduction In Government Purchases and Distribution of Net Savings
Support price reduction 1966-90 1966-2001
Combined DTP initiatives
1966-90 1966-2001 1966-2001 Rdduction in crovernment Durchases (billions of Dounds) 5.77 66.52 36.66 85.44 151.96 N# savings (billions of dollars, 1986 present values)
iGovernment IConsumers
a
$0.51 $3.63 $2.22 $4.83 $8.46 3,08 10.36 -3.32 -7.07 3.29
IProducers -3.47 -11.50 5.19 9.25 -2.25
Our estimates of government net savings account for both federal financial benefits and federal costs. Through support price reductions, the government saves by reducing its purchases of excess dairy products and
7This is a general statement refening to the overall pattern of price movements during the entire period 19862001. Our simulations were also able to project (with little error) the high prices of the atypical period of 1989-92.
%ee footnote 5.
Page 7 GAO/OCE-93-1 Dairy Programs

B-211447
pays no costs. Through DTP, the government again saves by reducing its purchases and also obtains revenues from DTP-related assessments of dairy farmers’ production. Government costs related to DTP consist mostly of direct payments to DTP participants, including compensation for eliminating herds and otherwise disengaging dairy production capacity.O The results suggest that the government will realize net savings from both program initiatives because each reduces government purchases substantially at relatively modest or no cost.
We determined consumer net savings in each period by multiplying each program initiative’s estimated effect on price by simulated demand.‘O The results show slow-growing but ultimately substantial savings to consumers as the support price is reduced. Over time, these consumer savings will dominate consumer losses associated with DTP’S effect of delaying dairy price reductions.
We determined producer net savings by multiplying each program initiative’s estimated effect on price by simulated supply.” The estimate of producer net savings from DTP also includes government payments to DTP participants. The results suggest that the higher prices and government payments associated with DTP substantially lessen, but do not completely compensate for, the long-range producer losses attributable to support price reductions. Nonetheless, DTP did mitigate the pace of welfare transfers from producers to consumers that are associated with the transition to lower support prices, albeit at the consumers’ expense.
Viewed as a whole, the results indicate that the two program initiatives achieved savings for the government and consumers that exceeded associated costs borne by producers. To some extent, the two initiatives resulted in overall net savings to society because they lessened the incentive (initially created by relatively high support price levels) and the l
QOther DTP-related costs include administrative costs, red meat purchases to minimize the program’s impact on the meat markets, and additional USDA support payments for crops grown on land diverted from dairy production because of DTP. Estimates of DTP savings and costs are detailed in appendix I.
r”Specifically, the price difference was multiplied by the average of simulated demand with and without the program initiative in place. This estimate approximates the conventional economic measure of consumer welfare changes-changes in the area under the demand curve but above the price paid by consumers-that results from a change in market price. This estimate of consumer net savings assumes, however, that effects on the price received by producers, specifically the all-milk price, are fully passed on to consumers.
lLSpeciflcally, the price difference was multiplied by the average of simulated supply with and without the program initiative in place. This estimate approximates the conventional economic measure of producer welfare changes-changes in the area above the supply curve but below the price received by producers-that results from a change in market price.
Page 0 GAO/OCE-93-1 Dairy Programs
, ‘:
‘c . ,. ‘. ‘. I’ .I 1,
I.

B-211447
capacity to use valuable resources for excess or unnecessary dairy production. Nonetheless, we probably overestimated net savings to society by some amount because our estimates excluded any measure of welfare recipients’ loss due to these program initiatives. Since the initiatives effectively reduced government purchases, they are responsible for reducing government stocks of dairy products that, for the most part, are eventually distributed to the needy through government food assistance programs.
Government Purchase Quantities Are Likely to Decline Slowly, but Costs Have Already Fallen Substantially
The results presented above suggest that both DTP and support price reductions have proven, in this experience, to be a cost-effective means of substantially reducing the quantities of government purchases of excess dairy products. Nonetheless, we project that in the coming years, with no change in current policy, government purchase levels will be similar to the current levels and will remain appreciably above the levels achieved during several decades before the 1980s.
Recent trends suggest, however, that by far the most surplus production, and therefore the most government purchases, may consist of butter rather than the other manufactured dairy products that are purchased by the government. Because the Secretary of Agriculture can adjust the butter/nonfat-dry-milk support price ratio while maintaining the overall support price level, the butter purchases bias presents the government with an opportunity to reduce outlays, and ultimately costs, associated with government purchases. This bias also represents, however, a new consideration to be addressed in designing any future programs aimed at further reducing the quantity of government purchases.
overnment Purchases 11 Decline Gradually
Although DTP and support price reductions reduced dairy production capacity for an extended period, our projections suggest that government purchase quantities will remain near current levels for at least several more years. Specifically, assuming that current policy does not change and that support price levels remain above comparable world prices, we project that government purchases will not begin to decline until after 1993 and will range between 8 billion and 10 billion pounds through 1997 (milk-equivalent, milk-fat basis). After 1997, government purchases will decline more rapidly, reaching under 5 billion pounds by 2001.12 Our
12For several reasons, USDA classifies exports under the Dairy Export Incentive Program (DEIP) as government purchases, or net removals. For our purposes, it was best not to classify DEIP-related expoxta as government purchases. However, on the advice of USDA economists, we did attempt to account for DEIP in our estimates by adding projections of DEIP exports to dairy product demand.
Page 9 GAO/OCE-93-1 Dairy Programs

B-211447
projections also show a steady decline in the size of the nation’s dairy herd throughout the 199Os, although the yield per cow will steadily improve so that total production will increase slowly.
Available data show that recent government purchases of the three types of manufactured dairy products under the price support program-butter, cheese, and nonfat dry milk-have been much less evenly distributed than previously. Specifically, since 1988, butter purchases have constituted the vast majority of government purchases, and there is no indication at this time that this trend will be altered at current support price levels.13 This recent imbalance in excess supply reflects a shift in consumers’ perceptions of the health benefits of low-fat diets, which has caused increased demand for dairy products with less butterfat. l4 Milk-product processors have responded to consumers’ preferences by reducing butterfat levels in many dairy products. However, because butter is jointly produced with other milk products and cheese and because the butterfat content of raw milk has not changed in decades, processors have been unable to reduce the total production of butter relative to cheese and other milk products, Consequently, butter has remained substantially in excess supply, and the government has purchased it under the price support program.
Cost of Government Purchases Has Fallen in Recent Years
I
The 1989-91 average annual government outlays (in constant dollars) for excess dairy products under the price support program were about half of the 1987-88 average level, even though the quantity of government purchases (measured on a milk-fat basis) averaged more during the later years.16 In part, this recent trend in government outlays reflects the combined effects of inflation and legislated reductions on the constant
I I a
‘This assertion is not based on our projections. Our model projects government purchases only on a total milk-fat basis and does not show the proportions of cheese, butter, and nonfat dry milk that the government will purchase during the next decade.
14For example, following rather steady trends in 1980-88, plain whole milk sales dropped over 20 percent, while plain low-fat and skim milk sales increased by about 40 percent.
r6The Food, Agriculture, Conservation, and Trade Act of 1990 defines a tot&nilk-solids basis for measuring government purchases. Using this measure rather than the milk-fat basis, purchases fell by one-third during this period.
Page 10 GAO/OCE-93-1 Dairy Progrsms

B-211447
dollar value of the government purchase prices of dairy products.16 For example, the government cheese price (in constant dollars) decreased by about 26 percent between 1986 and 1992 because of these factors.
The recent decline in outlays is also attributable to action taken by the Secretary of Agriculture to further lower the government purchase price for butter at a time when most government purchases consist of butter. The Secretary has authority to adjust the government purchase price of butter and nonfat dry milk, the joint product of butter, as long as the government price of these two products combined maintains the milk equivalent support price level, currently $10.10 per hundredweight. During 1986-92, due to multiple adjustments by the Secretary, in addition to inflation and legislated reductions in the overall support price level, the government’s butter price fell by more than 50 percent (in constant dollars), while the nonfat dry milk price increased by almost 2 percent (in constant dollars).
The recent reductions in the butter support price may mean that our projections of government purchases will prove to be overstated. Specifically, after these reductions, the U.S. butter price is now much closer to world butter price levels than at any time during the 1980s at least. This may mean that at some point soon to come, some excess butter production will be exported rather than purchased by the government. Furthermore, it may be too soon after the butter support price reductions to observe how the industry will react to the price changes and to the imbalance in butterfat and skim product demands in general. Alternative uses for butterfat may yet emerge, which may result in lesser government purchases.
- A Conclusions have proven to be a cost-effective means of reducing the quantity and expense of government purchases under the price support program. We project that the two programs combined will reduce government purchases by about 10 billion pounds a year from 1988 through at least 2001. Also, the two programs together have resulted in net savings for consumers and net losses for producers. DTP provided more immediate
leA provision of the 1990 Farm Bill limits government expenditures for purchases to 7 billion pounds annually, milk equivalent, total milk solids basis. This provision is unlikely to have any effect, however, because the purchase limits are on a total milk solids basis. For example, in 1991 the government purchased over 10 billion pounds on a milkfat basis but this translated into less than 7 billion pounds on a total milk solids basis so the purchase limits had no effect. Our projections of purchases for any year during the next decade do not exceed 10 billion pounds on a milkfat basis and decline with time, and therefore are unlikely to exceed 7 billion pounds on a total milk solids basis at any time.
Page 11 GAO/OCE-93-1 Dairy Programs

B-211447
reductions in government purchases and helped to mitigate losses to producers or eased their transition to lower support price levels, whereas support price reductions were slower to affect government purchases but will substantially and permanently reduce them in the long run.
Despite the achievements of these program initiatives, we project that government purchases will remain near current levels for several years. The initiatives appear to have stemmed the growth of government purchases, but they will be slow to substantially reduce purchases. Furthermore, recent trends suggest that current and foreseeable surpluses may consist mostly of butter, and while this situation has afforded the government an opportunity to reduce outlays, it may also mean that previous programs to reduce government purchases will not be adequate solutions to future excessive purchase conditions.
Our survey results indicate that some tarp program participants will return to dairy production following their &year exits, although their return will add only about 0.6 percent to national production capacity overall. These participants likely will have returned during 1991 and 1992 and should reach their full production capacity before 1994.
Agency Comments and Our Evaluation
USDA did not respond to our request for formal written comments on the report. USDA officials did inform us, however, that they agreed with our approach to evaluate jointly the DTP and post-1985 support price reductions. They also agreed, in general, with our findings concerning the effectiveness of each program initiative, but they had reservations concerning the model we developed for the analysis and therefore could not concur with the magnitudes of effects that are suggested by our analysis. We do not concur with their specific concerns about the model. We have, however, attempted to clarify our position on these issues of A concern in appropriate places throughout the report.
We performed our review between February 1991 and August 1992. Our methodology for estimating the effects of DTP and support price reductions on the dairy sector is described in appendix I. Appendix II describes our methodology for our survey of DTP participants.
We are sending copies of this report to the Chairmen, Senate and House Agriculture Committees. Copies will also be made available to others upon request.
Page12 GAO/OCE-93-1DairyPrograms
B-211447
This work was performed under the direction of Scott L. Smith, Assistant Director in the Office of the Chief Economist, who can be reached at (202) 612-6713 if you or your staff have any questions. Other major contributors to this report are listed in appendix IV.
Sidney G. Winter Chief Economist
Page 13 GAO/OCE-93-l Dairy Programs

Contents
Letter Appendixes Appendix I: Dairy Sector Model 16
Appendix II: Survey Methodology 33 Appendix III: Survey of Dairy Termination Program Participants 36 Appendix IV: Major Contributors to This Report 40
Tables Table 1: Reduction in Government Purchases and Distribution of Net Savings
Table I. 1: Estimation Results Table 1.2: Estimated Savings From the Dairy Termination
Program
7
23 30
Table 1.3: Measures of Forecast Accuracy 31
Figures Figure 1: Reductions in Government Purchases Because of Program Initiatives
6
Figure I. 1: Reductions in Government Purchases Because of DTP Figure 1.2: Reductions in Government Purchases Because of Both
Program Initiatives
28 29
Abbreviations
Ascs Agricultural Stabilization and Conservation Service BST Bovine somatotropin DEIP Dairy Export Incentive Program DTP Dairy Termination Program MDP Milk Diversion Program RMS root mean square USDA U.S. Department of Agriculture
Page 14 GAO/OCE-93-l Dairy Programs

4
Page 16 GAO/OCE-93-1 Dairy Programs
Appendix I
Dairy Sector Model
We developed an economic model of the dairy sector to estimate the effects of both the 1986-87 Dairy Termination Program and the 1986-90 support price reductions on milk production, prices, and government purchases of excess dairy products1 The model consists of a system of equations that describe the role of the government and other factors in determining milk demand, the all-milk price, several components of milk production, and government purchases. Coefficients of the model were estimated using a nonlinear, three-stage, least-squares regression analysis of data covering 1976-90. The estimated model was used to simulate milk production and government purchases from 1986 through 2001, both with and without DTP in place and with and without support price reductions. Differences between the simulations with and without DTP or support price reductions represented our estimates of the effects of these program initiatives. These estimated effects were then used to estimate the effects of each program on the welfare of producers, consumers, and the government. We also used the model to project dairy production and government purchases beyond 1991, assuming no change in current government policy.
This appendix
l describes the equations and variables included in the model, l discusses both the methodology for estimating the model’s coefficients
and the estimation results, . explains the methodology for simulating both the DTP and support price
reduction effects, l presents detailed simulation results and corresponding welfare estimates
not otherwise presented in the preceding letter, and l examines the model’s forecasting accuracy.
We conducted thorough sensitivity analyses of reasonable alternative 4 specifications for the original version of our model and presented the results of those analyses in our July 1989 report. Key results of that model were found to be insensitive to the alternative specifications examined at that time. Modifications to the model incorporated in the present version produced key results highly similar to those previously estimated. Consequently, we did not conduct additional sensitivity analyses for this revision.
‘The model presented here is an update of our model originally presented in Dairy Termination Program: An Estimate of Its Impact and Cost Effectiveness (GAO/RCED-89-93, July 6,198O).
Page 16 GAO/OCE-93-l Dairy Programs
Appendix I Dlliry Sector Model
Description of the Model
The model consists of eight equations. The demand side of the dairy market is represented by two equations, one defining total demand and the other relating the dominant component of total demand (commercial disappearance) to the determining factors of price and income. The supply side of the dairy market is represented by four equations. One defines total milk supply, two relate each of the two aspects of milk production (herd size and yield per cow) to such determining factors as price-feed cost ratios and government policies,2 and one accounts for heifers. This last equation is included in the model to allow for the effects on production of the age distribution, or composition, of the dairy herd. Government policies are reflected in the two remaining equations. One of these equations describes the farm milk price as determined by the government support price and other supply/demand factors; the other defines government purchases of dairy products under the support price program as the excess of milk supply over demand.
The model’s equations explain each of eight variables whose values are dependent on, or determined jointly by, the other factors or variables in the model. All other variables in the model are predetermined, or determined by factors considered outside the influence of the market system described by the model. The values of dependent variables from prior time periods are also considered predetermined. The model’s eight equations are listed below, then the variables are described.
20ur measure of price-feed cost ratios is determined differently from the milk-feed price ratio published by USDA. Nonetheless, both measures should be positively correlated with the profitability of milk production.
Page 17 GAO/OCE-93-1 Dairy Programs
’ ‘. ,.

Appendix I Dairy Sector Model
Dairy Sector Model
Demand equations: 1. QMD(t) = BQDC(t) + BQDF(t) + BSTC(t) - BSTC(t-1) 2. BQDC(t) = Al + A2*RPMLK(t) + A3*DIPC(t)
Supply equations 3. QMS(t) = COWS(t) * YIELD(t) + IMPTS(t) 4. COWS(t) = Bl*COWS(t-1) + B2*DTPSL(t) + B3*MDPSL(t)
t B4*[RPMLK(t-2) - RDED(t-2)]/RPFEED(t-2) t BS*[RPMLK(t) - RDED(t)]/RPUTIL(t) t B6*RHEFX(t-l)/COWS(t-1) + B7*YIELD(t-2)
5. YIELD(t) = Cl t C2*YIELD(t-1) + C3*TREND(t) + C4*MDPM(t) + CZ*[RPMLK(t-3) - RDED(t-3)]/RPFEED(t-3) t CG*RHEFX(t-8)/COWS(t-8) + C7*RHEFX(t-12)/COWS(t-12)
6. RHEFX(t) = Dl*COWS(t-7) + D2*RHEFX(t-7) + D3*RPUTIL(t-7) + D4*(DTPCM(t) - DTPCM(t-7)] + DS*MDPMX(t-1) + DG*MDPMX(t-3) + D7*[RPSMLK(t-3)-RDED(t-3)]/RPFEED(t-3) + DB’[RPSMLK(t-7) - RDED(t-7)]/RPFEED(t-7)
Price and aovernment net removals equations 7. RPMLK(t) = El t E2*BNRMLK(t) t E3*RPSMLK(t) + E4*XSDCH(t)
+ E5*DUM89(t) *BNRMLK(t) 8. BNRMLK(t) = QMS(t) - QMD(t)
4
Page 18 GAO/OCE-93-1 Dairy Programs
*: ,

Appendix I Dairy Sector Model
Model Varlables
Dependent varlables: BNRMLK Government net removals (purchases) of excess dairy products (billions of pounds). BQDC Commercial demand (disappearance) for dairy products, including exports (billions of pounds). cows Number of milk cows (millions). QMD Quantitv of milk demanded (billions of pounds). C&IS RHEFX
Quantity of milk supplied (billions of pounds). Number of replacement “dairy” heifers (millions).
RPMLK All-milk price received bv farmers (constant dollars oer oound). YIELD Milk production per cow (thousands of pounds). Predetermined variables: BSTC Endino commercial stocks of dairv products (billions of pounds). BQDF DIPC
Consumption of milk on farms (billions of pounds). Disposable income per capita (thousands of constant dollars).
DTPSL Milk cows disposed of through slauqhter or export under DTP (millions). DTPCM Cumulative number of heifers disposed of throuah slauahter or export under DTP (millions). IMPTS Imports of dairy products (billions of pounds). MDPM
M~DPMX
Milk Diversion Program payments (millions of constant dollars), adjusted to exclude payments made for production reductions achieved through slaughter and lagged 1 quarter to better align with corresponding reductions in production. Total Milk Diversion Program payments to participants (millions of constant dollars), accounting for production reductions achieved in any manner and laqqed 1 quarter to better align with corresponding reductions in production.
M~DPSL RDED
Estimated slaughter of milk cows because of the Milk Diversion Program (millions). Payments per pound (constant dollars) made by farmers to the government under various dairy collection programs since 1983.
@‘FEED Price of feed for dairv cows (constant dollars oer pound). BPUTIL Price of utility cows, Omaha (constant dollars per 10,000 pounds). DpM89
/
RPSMLK
TREND
Dummy variable equal to 1 from 1988.4 through 1990.1 and zero otherwise. The period corresponding with DUM89=1 4 was determined to be atypical of prelpost relationships according to correlations of the dependent and predetermined (interactive variables). Government support price for milk (constant dollars per pound), adjusted to include the class 1 differential (weighted by the percentage of milk sold as class 1). Time trend equal to 1 in 1976.1, 2 in 1976.2, etc. The purpose of the trend term is to reflect the rather steady imorovement in dairv oroducts technoloav and in some aseects of dairv manaaement.
-i-- -~ ~~~~ ~~ - ~ ~~~ -~~ ~~ XSDCH A measure of the excess demand for cheese that we developed based on the relationship between government
purchases and total cheese supply during 1976-90. (See footnote 7.) titime measured in quarters, and Al...A3,Bl...B7,Cl...C7,Dl,..D8,El...E5 are coefficients to be estimated.
Page 19 GAOKXE-93-1 Dairy Programs

Appendix I Dairy Sector Model
Five variables we consider predetermined are conceivably dependent. Among the five, BQDF, BSTC, and IMPTS contribute only minor variation to milk supply and demand; therefore, our treatment of these variables as predetermined does not compromise results but does minimize complexity. Also, RPFEED (which only appears in the model with a time lag in any case) and RPUTIL are treated as predetermined because we believe that changes in the dairy sector probably have little impact on the domestic feed grains and beef markets, especially given the many other major influences on those markets, such as government programs and foreign markets. We note that DTP, in requiring participants to dispose of ,their entire herds (which was done mostly through slaughter rather than export), could have depressed beef market prices. However, to minimize any such effect, the Food Security Act of 1986 required the federal government to purchase a stated quantity of red meat.
Model Specification In general, the structure of our model is similar to that commonly found in the literature. We include separate equations for both cows (herd size) and yield per cow, and we use a milk-price feed-cost ratio in the COWS and YIELD equations to reflect the relative profitability of milk production. In response to concerns in the literature, we model the effects of the dairy herd’s age composition on dairy production by including lags of the ratio RHEFXXOWS in both the COWS and YIELD equations. These ratios are lagged 2 and 3 years in the YIELD equation to account for a cow’s tendency to produce below average in the first lactation and above average in the second or thirde3 We also include a separate RHEFX equation to allow for the possibility that government policy may affect farmers’ decisions concerning age composition.
Government policy variables accounting for DTP, the Milk Diversion Program (MDP), and the support price appear explicitly in the RPMLK, l
COWS, YIELD, and RHEFX equations4 One plausible variation on our specification would be to include a DTP-related variable in the YIELD equation because the average yield of DTP participants’ herds could conceivably be different from that of nonparticipants’ herds. However,
3We included these lagged variables because of input from USDA economists. In doing so, however, we recognize that the timing of when, and how many, heifers are bred can vary considerably and that our variables may not add much explanatory power to the equation because of this variation. In previous versions of the model, estimated over a less-current data set, the estimated coefficients of these variables were both signed consistent with expectations and significant at better than the lo-percent level.
‘Under MDP (1884-86), the government paid participants to reduce their milk marketlngs from a base period by 6 to 30 percent. Reductions could be achieved by reducing yield, herd size, or both. Our model needs to account for this program since it occurred during our sample period.
Page 20 GAWOCE-93-1 Dairy Program8

Appendix 1 D&y Sector Model
available data do not suggest that DTP had an immediate effect on YIELD (other than through age composition, which is modeled in our specification), nor do they show that DTP participants’ herds had lower (or different) average yields versus nonparticipants’ herds. This fmding supports the position of USDA economists, who pointed out that dairy farmers either close to retirement or in financial difficulty, as opposed to those with lower-than-average yields, dominated the list of DTP participants.
Several equations include a lagged dependent variable among the predetermined variables. These lagged terms account for a variety of past information and may be thought of as starting points from which changes in the dependent variable can be linked to recent changes in the other predetermined variables. For example, in the COWS equation, DTPSL measures the number of cows in a given current quarter that are slaughtered and exported because of DTP, and the lagged dependent variable, COWS(t-l), reflects herd size in the previous quarter, which accounts for the DTP slaughters and exports from all previous quarters.
In the YIELD equation, we include a TREND variable along with the lagged dependent variable, YIELD(t-1). The specific purpose of this TREND term is to reflect the rather steady improvements in dairy production technology and in some aspects of dairy management. Although YIELD(t-1) should also capture these and other trend effects, our analysis of different specifications of this equation suggested that both the TREND and YIELD(t-1) variables should be included to enhance forecast accuracy.
One atypical feature of our model is the lack of a constant, or intercept, term in either the COWS or RHEFX equations. Given that both these equations include lagged dependent variables and assuming steady values of the other predetermined variables, there is no necessary reason to 4 include a constam6
The RPMLK equation accounts for the role of both the support price, RPSMLK, in providing a minimum to the all-milk price, and excess supply in the form of government purchases, BNRMLK, as they may influence the over-order premium component of the all-milk price. The support price measure used for estimation is adjusted to include the contribution of the class I differential so that the measure represents more a realized than a
%estricting these equations to not have constant terms is supported by estimation results; when included, the constant terms are insignificant, and the model performs better, in terms of a higher dusted R-squared, without them.
Page 21 GAO/OCE-93-1 Dairy Program6

Appendix I Dairy Sector Model
stated support price.‘j The RPMLK equation also includes XSDCH to represent the influence on price of an excess demand for cheese when manufactured dairy products in general are in excess suppl~.~
Finally, the RPMLK equation includes an interaction term involving the dummy variable DUM89. This dummy term models atypical relationships during a brief time following the 1988 drought. The drought set the stage for unanticipated production shortfalls in 1989, leaving distributors overcommitted and driving up prices beyond what would be expected given underlying supply and demand conditions8 The XSDCH variable in the RPMLK equation also accounts for atypical relationships among manufactured product prices during this unusual period.
Estimation Results The model’s coefficients were estimated simultaneously using nonlinear, three-stage least squares-a regression technique that uses all information in the model to estimate the coefficients for each equation. The data used to estimate the model were quarterly observations for 1976-90, and all data were seasonally adjusted. Data were obtained from USDA and WEFA, a commercial forecasting company.
Table I. 1 presents our estimation results. Most of the coefficient estimates are statistically significant (different from zero) at the 5-percent level or better for a one-tailed test.Q All estimates have signs consistent with our
@l’he class I differential factor is weighted by the percentage of milk sold as class I, and this introduces an element of dependence to an otherwise predetermined variable. However, because this percentage is largely determined by consumer tastes and/or preferences and government programs, all of which A are predetermined, we believe that it is reasonable to still treat the achusted measure of RPSMLK as predetermined.
70ur preliminary results indicated that excess demands for butter or nonfat dry milk, unlike cheese, do not add to the model’s ability to explain the data. Consequently, we excluded corresponding variables for butter and nonfat dry milk from the model. We measured the excess demand for cheese only for periods when net removals of cheese were zero. For each such period, excess demand is measured as the amount that total cheese supply is below the average (weighted to reflect population changes) of total cheese supply for periods of low net removals, and we defined the latter as periods when net removals are more than 1 standard deviation below the mean of net removals for all nonzero net removals periods.
sAn agricultural economist/dairy expert who reviewed this study has presented an alternative explanation. He believes that the 1988 drought was more coincidental to atypical relationships, rather than a cause, and that the atypical relationships really represent a major structural change in the dairy industry, specifically the beginning of an era when the support price is so low as to be no longer effective in propping up market prices.
The critical t-statistic values for a one-tailed test with 60 observations are 1.671 at 5 percent, 1.296 at 10 percent, and 0.679 at 26 percent.
Page 22 GAO/OCE-93-1 Dairy Programs
,, ”

Appendix I Dairy Sector Model
expectations. lo For example, as economic theory would suggest, the coefficient of price in the demand equation, A2, is negative, while the coefficients of the milk-price feed-cost ratios in the COWS and YIELD equations, B4 and CS, are positive. In addition, coefficients of the lagged heifer/cows ratios in the YIELD equation, C6 and C7, show, as expected (albeit with very weak significance), the below-average yield of milk cows in their first lactation and above-average yield in their second lactation, Also, the coefficient of government purchases in the RPMLK equation, E2, is negative and consistent with our expectation that the market price level (the ah-milk price) is affected via premiums by the magnitude of excess supply (or government purchases under the support price program) and not merely by their presence.”
Table 1.1: Estlmation Results
Equatlonharlables Coefficient estlmate
for variable t-ratio
Demand Equation 2a CONSTANT RPMLK DIPC
Al = 12.77 2.48 A2 = -18.69 -1.40
A3 = 2.06 5.94
COWS Equation 4 cows (t-l) DTPSL MDPSL RPMLK(t-2)/RPFEED(t-2) RPMLK/RPUTIL RHEFX(t-l)/COWS(t-1) YIELD (-2)
Bl = .95 101.38 82 = -.83 -14.00
83 = -1.12 -7.48 84 = 2.63 3.38
B5 = .33 2.71 B6 = 1.75 8.45 87 = -.13 -7.04 .
YIELD Equation 5a CONSTANT TREND YIELD (t-l)
Cl = 1.13 c2 = .007
C3 = .58
4.23 4.61 6.67
(continued)
loOne exception is the estimated coefficient for COWS(t-‘7) in the RHEFX equation. However, this estimate is close to zero in value and would, according to the convention of establishing significance cutoffs at 10 percent or better, generally be considered not significantly different from zero. This variable was retained in the model on theoretical grounds, in that heifers in the current period are not possible unless a related number of cows are in existence during the periods around t-7.
‘?fhe coefficient must reflect the effect of magnitude rather than just the presence of government purchases because the seasonally adjusted measure of government purchases we use in estimation is continuous, and positive for 6’7 of the 60 quarters of our sample period. Unadjusted data show only 2 of 60 quarters in our sample when government purchases were not positive.
Page 23 GAO/OCE-93-1 Dairy Programs
., ,’ ., ,,.” ,/,

Appendix I Dairy Sector Model
Equation/variables Coeff lcient estimate
for variable t-ratio MDPM c4 = -.0004 -3.27 RPMLK(t-3)/RPFEED(t-3) c5 = 1.09 1.68 RHEFX(t-8)/COWS(t-8) C6 = -.40 -1.25 RHEFX (t-12)/COWS(t-12) C7 = .16 .47
RHEFX Equation 68 cows (t-7) RHEFX(t-7) RPUTIL(t-7) DTPCM - DTPCM(t-7) MDPMX(t-1) MDPMX(t-3) RPSMLK(t-3)/RPFEED(t-3) RPSMLK(t-7I/RPFEED(t-71
Dl = -.02 -1 .oo D2 = .89 17.49 D3 = .95 7.36
D4 = -1.52 -10.75 D5 = .0003 1.73 D6 = .0007 4.64
D7 = 1.77 1.13 D8 = 3.66 2.84
RPMLK Equation 7a CONSTANT BNRMLK RPSMLK XSDCH DUM89*BNRMLK
El = ,021 5.58 E2 = -.0025 -6.47
E3 = .89 33.49 E4 = .016 8.19
E5 = .0017 2.34
Summary Statistics Equation Adjusted R-squared F-statistic SER DEMAND Eq. 2 .92 362.7 .55 COWS Eq. 4 .99 1376.7 -03 YIELD Eq. 5 .99 1615.8 .02 RHEFX Eq. 6 .98 364.6 .04 4 RPMLK Eq. 7 .97 572.3 ,003 aEstimated equation was adjusted to correct for autocorrelation. The autocorrelation Coefficient (RHO) for Equation 2 = .42, Equation 5 = .24, Equation 6 = .63, and Equation 7 = .26
The Role of Government in the Estimated Model
The government’s role in the dairy market is represented in the model by the support price variable and several DTP and MDP variables. The support price, RPSMLK, appears in both the RPMLK and RHEJ?X equations. The estimated coefficient of RPSMLK in the price equation, E3, is 0.89, suggesting that a large percentage of any change in the support price is
Page 24 GAO/OCE-93-1 Dairy Programs

Appendix I Dairy Sector Model
passed on to farmers through the all-milk price.12 In the RHEFX equation, RPSMLK appears in two minimum-price/feed ratios. The positive estimates of the corresponding coefficients D7 and D8 suggest that more heifers are bred and kept as the minimum level of dairy production profitability improves.
DTP is represented in the model through two variables that measure program-related slaughters/exports: one for cows, DTPSL, and the other for heifers, DTPCM. DTPSL and DTPCM appear in the COWS and RHEFX equations, respectively. Assuming that all participants’ cows were in fact disposed of, the coefficient of DTPSL, B2, should equal -1.00. The estimate of B2 is -0.83, which is significantly greater than -1.00 (at the &percent level, two-tailed test), suggesting that there was some slippage in the program-related disposal of cows or specifically that the program resulted in the disposal, on net, of about 8 cows for every 10 signed up. Slippage could occur if nonparticipants reacted to the program by culling fewer cows than usual or if some participants not only had planned to exit the industry regardless of DTP but, in so doing, decided to dispose of their cows more through slaughter (i.e., net of normal culling) than through sales to remaining farmers.
Again, assuming that all participants’ heifers were disposed of, the coefficient of the DTPCM term, D4, should equal -1.00. The estimate of D4 is -1.52, which is significantly less than -1.00 (at the l-percent level), suggesting that, on net, the heifer count decreased by about 15 for every 10 destined for disposal under the program. One likely explanation for this result is that nonparticipants rushed their heifers into the producing herd to fill the production shortfall created by the program and thereby reduced the heifer count while simultaneously increasing the cow count (and the appearance of program slippage).
MDP is represented in the model through three variables: expected program-related slaughters, MDPSL, in the COWS equation; nonslaughter-related program payouts, MDPM, in the YIELD equation; and total program payouts, MDPMX, in the RHEFX equation. Assuming that actual slaughters associated with the program were close to farmers’ reported anticipated slaughters, the coefficient on MDPSL, B3, should be close to -1.00. The estimate of B3 is -1.12 and is not significantly different from -1.00.
“The significance of the DUM89 interactive term suggests, however, that the relationship between the support price and the market price was weak or nonexistent between 1988 and 1990.
Page 23 GAO/OCE-93-1 Dairy Programs
Appendix 1 Dairy Sector Model
The estimated coefficient for the nonslaughter-related program payouts, C4, is negative, suggesting that participants did reduce yield, in addition to some slaughter, to comply with production reductions required by MDP.
Also, the estimated coefficients for the two total program payout variables in the RHEFX equation, D5 and D6, are positive, suggesting that one way farmers reduced production to comply with MDP was to delay the progression of heifers into the producing herd.
Simulation Methodology and Results
To estimate the independent effects of both DTP and accompanying support price reductions, we used the model to simulate milk production and net removals both with and without each program in place from 1986 through 2001 (the last year for which we could obtain projected values for predetermined variables). The difference in both milk production and net removals between the with and without simulations for each program is our estimate of the isolated effects of that program on those variables. The without simulation below assumes that no other government program (beyond, for example, the federal milk marketing orders system already in place) would have been implemented in the absence of DTP in the one case or support price reductions in the other.
For this analysis, we assume that the dairy price support program is independent of both DTP and MDP. In other words, the model does not permit the presence of either DTP or MDP to affect the price support level. Consequently, our simulations under the assumption that DTP never occurred use the same support price levels as were actually in place when DTP did occur. Beyond the DTP period, support prices are adjusted in the simulations in accordance with the Food Security Act of 1985 and the Food, Agriculture, Conservation, and Trade Act of 1990 and with the assumption that the Secretary of Agriculture has perfect foresight A regarding excess dairy production. In any case, the result is that in both simulations the support prices are reduced each year by the maximum allowed by law.
Simulations with and without the support price reductions were conducted both with and without DTP in place. The results derived from each set of simulations were not appreciably different, however, suggesting that the model incorporates only minimal interaction between DTP and support price policy. Since the results were nearly identical, we reported only those obtained from simulating the with and without support price policy, where DTP is assumed to occur in both cases.
Page 20 OANOCE-93-1 Dairy Programs

Appendix I Dairy Sector Model
Simulation Methodology All simulations covered 1986 through 2001. For each quarterly period of the simulations, current values of the model’s dependent variables were determined using the estimated coefficients and the values of the predetermined variables. The simulations were dynamic in that solved values of dependent variables were employed (through lagging functions) as predetermined variables in solving for the values of dependent variables in subsequent periods. Thus, the simulation solutions for dependent variables of later periods fed on simulation solutions for dependent variables from earlier periods. Data for the simulations consisted of actual data on predetermined variables through 1990, WEFA forecasts of predetermined variables from 1991 through 2001, and our survey data on DTP participants returning to dairy production as of 1991.
For our simulation of the dairy sector under the assumption that DTP never existed, the coefficients of the DTPSL and DTPCM variables were set to zero, and RDED was adjusted to remove those deduction payments associated with DTP. The results of this simulation were compared with a second simulation under the assumption that DTP occurred as it did and that some participants were returning to dairy production beginning in 1991 to the extent suggested by our survey results. For our simulation showing what would occur if the support price had not been reduced beginning in 1986, we fixed the nominal (current dollar) level of the support price at the 1986 level for all remaining periods.
Because these simulations are dynamic, random deviations or shocks in the actual data will result in errors in our forecasts that may cause our forecasted values to deviate from actual values for an extended period. Consequently, for our analysis of each program to be a valid comparison of the with and without scenarios, it was necessary that both with and without simulations not only covered the same time period but also were dynamic over that period, even though actual data were available for the ’ 1986-90 subset of our simulation period. The parallel in the dynamic period for the with and without simulations ensured that any random errors or shocks would be reflected similarly in both simulations and should not, therefore, appreciably affect our estimate of the effects of DTP or support price reductions (defined as the difference in the with and without simulations).
Simulation Results and Welfare Estimates
The results presented here supplement those presented in the letter.
Page 27 GAO/OCE-93-l Dairy Programs
!I.’ ;, ,i ), ,I

Appendix I Da&y Sector Model
Figure I. 1 summarizes our simulation results concerning the effect on government savings associated with DTP when some participants and/or their facilities return to dairy production beginning in 1991. The solid line represents our projection of DTP-related reductions in government purchases (a measure of program-related government savings), assuming no participants return to dairy production when their 5-year stay-out agreement under DTP is over. The dashed line represents government savings amended to reflect the extent that participants are likely to reenter dairying according to our survey results. As shown, returning participants and/or their facilities are likely to modestly reduce program-related government savings throughout the 199Os, but both the magnitude of total program-related savings (represented by the area under the respective curves) and the time period during which savings are realized will not be appreciably affected.
Figure 1.1: Reductions In Government Purchases Because of DTP
3,O bllllonr of Ibr. per quarter
- Assuming No Participants Return - - Assuming Some Participants Return
Figure I.2 shows our estimate of the effect on government purchases of the combination of DTP and support price reductions during 1986-90. The
Page 28 GAO/OCE-93-1 Dairy Programs

Appendix I Dairy Sector Model
independent effect of DTP in reducing government purchases (resulting in government savings) declines over time, as seen in figure I. 1; however, the effect of the support price reductions is almost a mirror image to that of DTP. In combination, the two program initiatives result in reductions in government purchases that reach about 10 billion pounds annually (2.6 billion quarterly) by the end of 1987 and, with only minor variation, remain at about that level through 2001. The consistency of the combined effects of DTP and support price reductions reflects the complementary nature of the two programs in bringing about substantial and sustained reductions in government purchases.
Figure 1.2: Reductions In Government Purchases Because of Both Program Initiatives
3.0 bllllonr of Iba. par qorrtrr
I dato
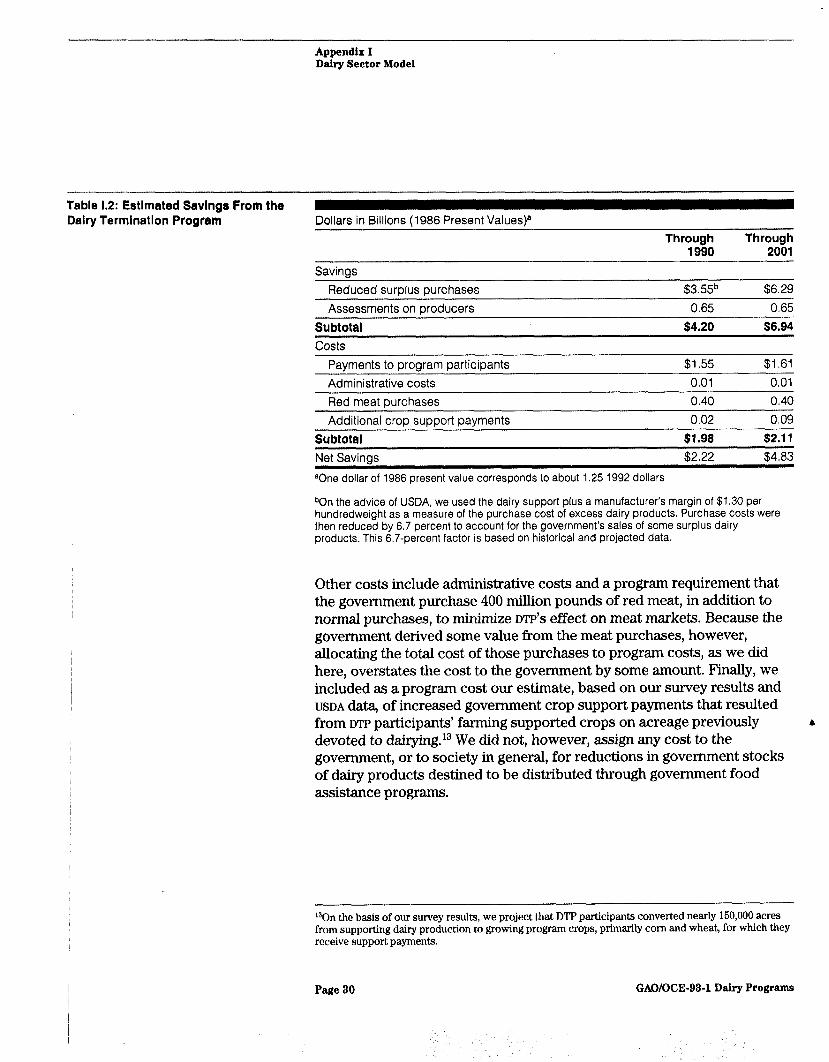
Government savings and costs attributable to DTP are itemized in table 1.2. Savings are derived mostly from reductions in government purchases. Other savings are obtained through an assessment (or tax) on all milk production. Payments to participants for disposing of their herds and agreeing to remove themselves and their facilities from dairy production for 5 years account for most program costs and were mostly realized by the end of 1990.
Page 29 GAO/OCE-93-1 Dairy Programs
Appendix I Dairy Sector Model
Table 1.2: Estlmated Savlngs From the Dairy Termlnatlon Program Dollars in Billions (1986 Present Values)a
Through Through 1990 2001
Savings
Reduced surplus purchases $3.55b $6.29 Assessments on Droducers 0.65 0.65
Subtotal costs
$4.20 $6.94
Payments to program participants $1.55 $1.61
Administrative costs 0.01 0.01 - Red meat purchases 0.40 0.40 Additional crop support payments 0.02 0.09
Subtotal $1.98 $2.11 Net Savings $2.22 $4.83 @One dollar of 1986 present value corresponds to about 1.25 1992 dollars
bOn the advice of USDA, we used the dairy support plus a manufacturer’s margin of $1.30 per hundredweight as a measure of the purchase cost of excess dairy products. Purchase costs were then reduced by 6.7 percent to account for the government’s sales of some surplus dairy products. This 6.7-percent factor is based on historical and projected data.
Other costs include administrative costs and a program requirement that the government purchase 400 million pounds of red meat, in addition to normal purchases, to minimize DTP'S effect on meat markets. Because the government derived some value from the meat purchases, however, allocating the total cost of those purchases to program costs, as we did here, overstates the cost to the government by some amount, Finally, we included as a program cost our estimate, based on our survey results and USDA data, of increased government crop support payments that resulted from DTP participants’ farming supported crops on acreage previously a devoted to dairying.13 We did not, however, assign any cost to the government, or to society in general, for reductions in government stocks of dairy products destined to be distributed through government food assistance programs.
130n the basis of our survey results, we project that DTP participants converted nearly 160,000 acres from supporting dairy production to growing program crops, primarily corn and wheat, for which they receive support payments.
Page 30 GAO/OCE-93-1 Dairy Programs

Appendix I Dairy Sector Model
Examining the Model’s Forecasting Accuracy
Because we estimated the effects of DTP by conducting simulations with the estimated model, the accuracy of our estimates depends, in part, on how accurately the model forecasts milk supply and demand. To assess our model’s forecast accuracy, we used the model to simulate values of the dependent variables during a period for which actual (historical) values were available (the first quarter of 1977 through the last quarter of 1990). By comparing the simulated values with the actual values over this period, we measured forecast errors to evaluate the model’s forecast accuracy. Nonetheless, we recognize that such a model might forecast the past well but not the future; hence, these measures of forecast accuracy are necessarily limited.
Using the forecast errors described above, we calculated several statistics to interpret the model’s forecasting accuracy. One statistic is the root-mean-square (RMS) simulation error, which is presented here as a percentage of the variable’s actual value. The other statistic is the Theil-U, or inequality coefficient, which is RMS, scaled in a different manner to lie between 0 and 1. For both statistics, values close to zero indicate that the model is able to forecast the past well. These statistics are presented in table 1.3.
Table 1.3: Measures of Forecast
AcFuracy Dependent variable RMS percent error Thell-U BQDC 1.64 .0082 QMD 1.61 .0081 QMS 1.07 .0053 cows 0.53 50027 YIELD 0.92 .0045 RHEFX 1.69 .0085 BNRMLK 257.00 .1171 l
RPMLK 2.47 .0117
As shown in table 1.3, the Theil-U numbers are all very small; similarly, the RMS percent errors are all less than 2 percent, with two exceptions. One is RPMLK, with an RMS percent error of about 2.5 percent, which probably reflects the difficulties of attempting to model the drought/price bubble of 1933-90.14 The other exception is BNRMLK (net removals), and its relatively high values in the table are likely to have occurred because
‘“The RMS percent error for RPMLK is less than 2 percent for the sample period 1977.1 through 1988.1. Again, we note the suggestion of an expert reviewer that 1988 may mark the beginning of a new structural relationship between the market and support prices in the dairy sector and that this, rather than the drought, could account for our results.
Page 81 GAO/OCE-93-1 Dairy Programs
,’
‘.
., ,

Appendix I Dairy Sector Model
BNRMLK is a residual value, specifically the difference between &MS and &MD, where a small change in &MS and/or &MD could mean a rather large (percentage) change in BNRMLK. The fact that the forecast evaluation statistics for QMS and &MD are reasonably good suggests that poor numbers for BNRMLK do not indicate’ that the model fails to forecast well; rather, they suggest that forecasting a residual value is difficult. A decomposition of the Theil-U statistic does show that the forecast of BNRMLK is not biased. Furthermore, such decomposition indicates that the forecast errors for all the variables are primarily random, not the result of inadequacies or bias inherent in the model specification.16
15We also used the model to forecast the period 1986-90 and found that the forecast evaluation statistics improved substantially from those in table I.3 for all variables except COWS, for which the RMS percent error increased slightly from 0.6 to 0.6. The model was also used to forecast government purchases from 1991-2001, and in comparison to data now available, our forecasts of government purchases (milkfat basis, and including projected DEIP exports) exceeded actual purchases (milkfat basis, including DEIP) by less than 4 percent for the 1991-92 period.
Page 32 GAG/OCE-93-1 Dairy Programs

Appendix II
Survey Methodology
Survey Sample To obtain information about participants returning to dairy production, we mailed questionnaires to a random sample of 1,145 participants, drawn from the 13,834 DTP contracts listed in the Agriculture Stabilization and Conservation Service (tics) Dairy Termination Master Contract File. Of those in our sample, 645 were also in our 1987 survey of DTP participants. Addresses were obtained from the ASCS Name and Address Master File. Only one participant per contract was sent a questionnaire. The survey was conducted from March through June 1991. Appendix III presents our questionnaire with aggregated responses.
Of those surveyed, 969 participants returned usable questionnaires, for a response rate of 84.6 percent. Except where noted, we generalized our results to the 11,708 participants we estimate would have answered our questionnaire if we had surveyed them all. Our estimates may overstate or understate the views and experiences of all participants to the extent that survey nonrespondents differ from respondents on these factors.
The precision of our estimates is indicated by sampling errors calculated at the 95-percent level of confidence. Since we used a probability sample to develop our estimates, each estimate has a measurable precision, or sampling error, which may be expressed as a plus/minus figure. A sampling error indicates how closely we can reproduce from a sample the results that we would obtain if we were to take a complete count of the universe using the same measurement methods. By adding the sampling error to and subtracting it from the estimate, we can develop upper and lower bounds for each estimate. This range is called a confidence interval. Sampling errors and confidence intervals are stated at a certain confidence level-in this case, 95 percent. For example, a confidence interval at the 95-percent confidence level means that in 95 of 100 instances, the sampling procedure we used would produce a confidence interval containing the universe value we are estimating. 4
tieturning I I
years, we first identified which businesses were likely to return to dairy production on the basis of responses to several items on the questionnaire. We defined businesses as “returning”
Page 33 GAO/OCE-93-1 Dairy Programs
, ,‘. ,
.

Appendix II Survey Methodology
I
if respondents indicated that
l they were definitely or probably returning to the dairy business during the next 2 years,
l their facilities would definitely or probably be used for dairying in the next 2 years, or
l either they or their facilities were just as likely to return to diary production as not in the next 2 years, but they had taken some action in the direction of returning, such as buying new equipment or building new facilities.
We defined all other businesses, including those of the nonrespondents, as not returning to dairy production.
We estimated the total number of cows returning using one of three indicators for each returning business, listed in order of preference: (1) the number of dairy cows participants planned to have when their new operation was at full capacity, (2) the number of dairy cows participants’ former facilities could currently support, or (3) the predicted number of cows at full capacity based on a simple regression of cows at capacity on cows owned in 1986, which we developed in the sample of respondents who provided the former information.
For each business, we estimated in which months over the next 5 years participants would bring cows back into production. The monthly rate at which cows were estimated to be brought back was assumed to be constant across all months, from the most likely month of return through the expected number of months needed to reach full capacity. The most likely month of return identified by survey respondents was, on average, 1 month after they were contractually eligible to return. This median lag from the date of eligibility was imputed for nonrespondents. Also imputed ’ for nonrespondents was the median time needed to reach full capacity -12 months.
For model sensitivity analyses, described in appendix I, we developed two alternative estimates of the number of cows returning to dairy production by month. These alternatives were developed by changing only how we defined a business as returning. The first definition included only those
Page 34 GAO/OCE-93-1 Dairy Programs
:‘, ,.‘,‘l ., ._ ,(i/,” _, .,. .’ ,/’

Appendix II Survey Methodology
respondents who indicated that either they or their facilities were definitely or probably returning. This definition yielded smaller estimates of the number of cows returning.
The second definition adjusted original estimates upward by a constant to allow for some returning businesses among survey nonrespondents and those respondents who had taken no steps in the direction of dairying and indicated they or their facilities were just as likely to return as not. The constant was developed from survey data.
Page 36 GANOCE-93-1 Dairy Programs

Appendix III
Survey of Dairy Termination Program Participants
GAO United St&a Gcncral Accounting Offlee
Survey of Dairy Termination Program Participants
INSTRUCTIONS
The U.S. General Accounting Office-an independent agency of the Congress-is completing its review of the dairy termination (buy-out) program. As part of that review, we are asking farmers who were in the program to tell us their plans for future dairying.
We selected your name at random from a list of farmers in the program. About half of those selected also got our earlier questionnaire when the program began. Because we can survey only a few of the people who were in the program, it is very important that we hear from each person we selected.
Your response by May 14. 1991 will help us avoid costly follow-up mailings. The questionnaire will take about 15 minutes to complete. If the enclosed return envelope is misplaced, please return your completed questionnaire to
Scott Smith U.S. General Accounting Office 441 G Street, N.W. Room 1826, RCED Washington, D.C. 20548
2. In your opinion, how useful are your former dairy facilities at the present time for daitying? (Check one.)
37.4 Hardly or not at all useful
19.0 Somewhat useful
19.1 Moderately useful
13.8 Very useful
5.2 Extremely useful
3 .7 No opinion
3. To the best of your knowledge, will your former dairyfacilities be used for dairying in the next 2 years or will they stay out? (Check one.)
5.1 Will definitely be used for daitying
7.1 Will probably be used for dairying
8.3 Just as likely to be used as not
29.7 Will probably stay out
43.3 Will definitely stay out
4.9 No knowledge about use of facilities Feel free to call Scott Smith collect at 202-275-5713 if you have any questions. Thank you for your cooperation. 4. If your former dairy facilities were used now for
Use oPLand and Facilities dairying, about how many dairy cows could they support, not counting heifers and calves? (FiIf in number.)
1. To the best of your knowledge, when does your dairy termination contract with USDA expire? (Write 81.3% 9tolSOOdairycows month and vear. J
I
63.0% 1991
28.0% 1992
9 . o % Other years or no response
Median of 50 dairy cows, n=788
10.2% None
Page 36 GAO/OCE-93-1 Dairy Programs
,: ,’ .._

Appendix III Survey of Dairy Termination Program Participanta
5. Since you terminated your dairy herd, have you started farming crops or increased your crop farming with the purpose of establishing or increasing your base for government crop support programs? (Check one.)
12.1 Yes
85.0 No
6. About how many additional or new acres are you farming for crops that you would have otherwise used for dairying? (Write in number of acres.)
23 .2% 1 to 600 new or additional acres Median of 80 new acres, k225
58.5% None
7. Have you received any federal crop support pay- ments for these new or additional acres? (Check one.)
10.6 Yes
84.2 No
8. How likely or unlikely are you to receive federal crop support payments in the future for these new or additional acres? (Check one.)
5.1 Very likely
5.6 Somewhat likely
6.4 Just as likely as not
8.3 Somewhat unlikely
65.1 Very unlikely
Government Policies
9. In your opinion, how likely or unlikely is it that government policy will shift to dairy production quotas in the next 5 years? (Check one.)
15 .9 Very likely
2 1.9 Somewhat likely
25.5 Just as likely as not
12.0 Somewhat unlikely
18.2 Very unlikely
10. How much, if at all, has possible federal approval of the BST growth hormone affected your plans to go back or stay out of the dairy business? (Check one.)
82 .7 Hardly or not at all affected
3.6 Somewhat affected
4 .6 Moderately affected
2.1 Greatly affected
2.2 Extremely affected
11. How familiar, if at all, are you with the change in federal policy regarding dairy support prices in the new 1990 Farm Bill? (Check one.)
4 9 .1 Hardly or not at all familiar
20.3 Somewhat familiar
15.3 Moderately familiar
7 .8 Greatly familiar
4.1 Extremely familiar
12. How much, if at all, has the change in federal policy regarding dairy support prices in the 1990 Farm Bill affected your plans to go back or stay out of the dairy business? (Check one.)
7 6 .4 Hardly or not at all affected
7 .4 Somewhat affected
5.0 Moderately affected
3 .8 Greatly affected
3 .5 Extremely affected
13. Are there dairy cooperatives you could sell your milk to if you were back in the dairy business? (Check one.)
78.8 Yes
3.0 No
14.8 Don’t know
Page 37 GAO/OCE-93-1 Dairy Programs
I.,,,,, ..’ :$ Jr ,’ I : ,p : .:;”
,._ ;, .., ‘, “,.!‘X:.,,;., ,‘, ; ~ , , I,‘,~_, ,,, ~.’ , ,;. (”

Appendix III Survey of Dairy Termination Program Partleipanta
14. How much, if at all, has the strength of dairy cooperatives in your community affected your curnnt plans to go back or stay out of the dairy business? (Check one.)
18. What orher steps, if any, have you already taken to get ready to dairy? (Describe in space below.)
80.1 Hardly or not at all affected
5.9 Somewhat affected
5.1 Moderately affected
2 .8 Greatly affected
2.1 Extremely affected
Personal Plans About Dairying 19. How many dairy animals, if any, do you own now? (Fill in numbers.)
IS. During the next two years, do you expect to go back to the dairy business or stay out of it? (Check one.) Data not available
3 .4 Will definitely go back + CONTINUE 4.6 Will probably go back + CONTINUE 7.4 Just as likely to go back as not + CONTINUE
28.8 Will probably stay out + GO TO Q.24 20. About how many dairy animals do you plan to have
55.0 Will definitely stay out 4 GO TO Q.24 when your dairy operation is at full capacity? (Fill in numbers.)
If you think you will probably or definitely stay out of the dairy business during the next 2 years, skip over the next several questions and pick up with Question 24.
16. About when, if ever, are you most likely to return to dairying? (Wrire month and Year)
- cows
Heifers and calves not available
22.0% 1991 8.7% 1993 313.7% 1992 2.7% 1994
21. When your operation is at full capacity. about what do you expect your annual production per cow to be? (Fill in pounds per cow.)
17. Which, if any, of the following steps have you already taken to get ready to dairy? (Check all that uPPlY.)
9.3 Arranged to get cows, heifers or calves
2.0 Bought new dairy equipment
11.3 Reconditioned old dairy equipment
4 .7 Leased or purchased additional land
3.3 Built or am building new dairy facilities
66.0 None of the above
Data not available
22. In your opinion, about how many months would it take for your dairy operation to reach full capacity, starting from when you first return to dairying? (Fill in number ofmonths.)
Median of 12 months, n=119
Page 38
:>,
^ ‘. : ,,“l ‘. ,-,
GAO/OCE-93-1 Dairy Programs

Appendix III Survey of Dairy Termination Program Part.Icipknta
23. Ignoring the fact that we currently have a legislated minimum price, what federal support price, if any, would make you change your mind about rc-entering dairying? (Fill in amount below or check “None”.)
$10.00 per cwt.(median) I would quit again if the price got this low.
or
49.0% None. The federal support price would have no effect on my decision to dairy.
19.5 No Response and values greater than $20.00.
GO TO QUESTION 25
24. What average market price, if any, would make you change your mind about staying out of the dairy business? (Fill in umount below or check “None”.)
$16.00 per cwt. (median) I would dairy again if the average market price got this high.
or
68.6% None. The average market price would have no effect on my decision to stay out of the dairy business.
19.3 No Response and values gmater than $20.00.
25. Comments. Please use the space below to write any comments you may have.
TechnicaI Notes:
(1) Unless otherwise indicated, results are based on 969 responses.
(2) Percentages do not sum to 100% because of item non-response.
rced:cbl Thank you for your cooperation.
Page 39
a
GAO/OCE-93-1 Dairy Programs

Appendix IV
Major Contributors to This Report
7 -!-L-.-L r\: ___^ A.--
Office of the Chief Economist,
Mark Turner, hG?3GQLLll rFwLJIuy-IU
Washington, D.C.
Resources, - Community, and
Carol Herrnstadt Shulman, Reports Analyst
Economic Development Division, Washington, DC.
a
(6/72624) Page 40 GAO/OCE-93-1 Dairy Programs

Ord~G~g Informwtion
l’hc~ first, copy of citch GAO report and testimony is frtbcb. .4ddit~ionill copi(bs are $2 each. Orders should 1~: sfbnt. to t.hcb following address, accompanied by a check or mcmcy order made out. to tkt Superintendent of Documents, W~IPII
nfhctlssary. Ortlcrs for 100 or more copies to he mailed to a singly address are discounted 25 percent,.
Ordt~rs by mail:
U.S. Gc~neral Accounting Office I’.(). Ihx 6015 Gaithersburg, MI.) 20884-6015
or visit,:
Room 1000 700 4th St. NW (corner of 4th and G Sts. NW) 1J.S. Gt:neral Accounting Office Washington, IX
Ordtbrs may also be placed by calling (202) 5 12-6600 or by using fax number (301) 258-4066.
PRINTED ON &$ RECYCLED PAPER
