oce template 070715 -3-30pm - department of industry ... · web viewthe full licence terms are...
TRANSCRIPT

The Westpac–Department of Industry, Innovation and Science China Resources Quarterly
Southern spring ~ Northern autumn 2016
The Westpac–Department of Industry, Innovation and Science China Resources QuarterlyThe Westpac–Department of
Industry, Innovation and Science China Resources Quarterly 1

© Commonwealth of Australia 2016
Creative Commons licence
With the exception of the Coat of Arms, this publication is licensed under a Creative Commons Attribution 3.0 Australia Licence. Creative Commons Attribution 3.0 Australia Licence is a standard form license agreement that allows you to copy, distribute, transmit and adapt this publication provided that you attribute the work.
A summary of the licence terms is available from: http://creativecommons.org/licenses/by/3.0/au/deed.en
The full licence terms are available from: http://creativecommons.org/licenses/by/3.0/au/legalcode
The Commonwealth’s preference is that you attribute this publication (and any material sourced from it) using the following wording: Source: Licensed from the Commonwealth of Australia under a Creative Commons Attribution 3.0 Australia Licence.
ISSN 978-1-921516-05-4 [Print]
ISSN 978-1-921516-07-8 [PDF]
This work is copyright. Apart from any use as permitted under the Copyright Act 1968, no part may be reproduced or altered by any process without prior written permission from the Australian Government. Requests and inquiries concerning reproduction and rights should be addressed to:
Department of Industry, Innovation and ScienceGPO Box 9839, Canberra ACT 2601
or by emailing [email protected]
The Westpac–Department of Industry, Innovation and Science China Resources QuarterlyThe Westpac–Department of
Industry, Innovation and Science China Resources Quarterly 2

AcknowledgementsThis publication was jointly undertaken by the Westpac Institutional Bank, a division of the Westpac Group, and the Australian Government Department of Industry, Innovation and Science. The relationship is non–commercial. The report was previously published under the title of the Westpac–BREE China Resources Quarterly.
Editors
Westpac: Elliot Clarke and Justin Smirk
Department of Industry, Innovation and Science: Kieran Bernie, Nikolai Drahos, Mark Gibbons, Marco Hatt, Joseph Moloney, Thuong Nguyen, Monica Philalay and Tim Bradley.
Design and production
Julie Doel
Cover image
Shutterstock
This report was finalised on 4 November 2016.
The Westpac–Department of Industry, Innovation and Science China Resources QuarterlyThe Westpac–Department of
Industry, Innovation and Science China Resources Quarterly 3

ContentsThe Westpac–Department of Industry, Innovation and Science China
Resources Quarterly
1. Executive summary
2. Recent developments in the Chinese economy
2.1 The real estate sector
2.2 Monetary & financial conditions
3. Steel
4. Iron ore
5. Metallurgical coal
6. Developments in China’s energy policy
6.1 Electricity trends
7. Thermal coal
8. Oil
9. Gas
10. Uranium
11. Gold
12. Silver
13. Copper
14. Aluminium
15. Alumina
16. Bauxite
17. Nickel
18. Zinc
19. Lead
20. Tin
The Westpac–Department of Industry, Innovation and Science China Resources QuarterlyThe Westpac–Department of
Industry, Innovation and Science China Resources Quarterly 4

21. Molybdenum
22. Tungsten
23. Cobalt
24. Antimony
25. Platinum & Palladium
26. Mineral Sands
27. China’s exports of rare earth oxides
28. Magnesium & Cadmium
29. Diamonds and Magnesium
30. China maps
31. Terms and conditions.
The Westpac–Department of Industry, Innovation and Science China Resources QuarterlyThe Westpac–Department of
Industry, Innovation and Science China Resources Quarterly 5

Acronyms and abbreviationsABS Australian Bureau of Statistics
ASEAN Association of Southeast Asian Nations
AUD, $A Australian dollar
bcm billion cubic metres
CEIC Chinese Economic Information Company
CFR Cost including freight
CNY, CNH Chinese yuan (onshore & off shore)
cm cubic metres
dltu dry long tonne unit
FDI foreign direct investment
FOB free on board
FX Foreign exchange
G3 United States, Europe and Japan
GDP gross domestic product
GFC global financial crisis
GFCF gross fixed capital formation
GCF gross capital formation
IEA International Energy Agency
IMF International Monetary Fund
koe, mtoe kilogram of oil equivalent, million tonnes of oil equivalent
kgpp kilograms per person
kWh kilowatt hour
LME London Metal Exchange
LNG liquefied natural gas
Mt million tonnes
na not available
NAR net as received
NIEs Newly Industrialised Economies (Singapore, Taiwan, Hong Kong, South Korea)
The Westpac–Department of Industry, Innovation and Science China Resources QuarterlyThe Westpac–Department of
Industry, Innovation and Science China Resources Quarterly 6

NDRC National Development and Reform Council
ODI outward direct investment
OECD Organisation for Economic Cooperation and Development
OPEC Organisation of Petroleum Exporting Countries
PMI Purchasing Managers Index
PPP purchasing–power parity
ppt percentage point
RMB Chinese Renminbi
SHIBOR Shanghai Interbank Offered Rate
SHFE Shanghai Futures Exchange
Sq km square kilometres
USD, US$ United States dollar
The Westpac–Department of Industry, Innovation and Science China Resources QuarterlyThe Westpac–Department of
Industry, Innovation and Science China Resources Quarterly 7

1. Executive summary The Chinese economy lost momentum through 2015 and Q1 2016. However, since then, real GDP growth has stabilised at 6.7%. Many questions remain regarding the outlook for China; but, at least for now, solid growth continues.
The tertiary or service sector remains the primary driver of aggregate momentum, with nominal growth in the sector near 11%yr through 2016. Whereas service sector growth was heavily skewed to the financial sub-sector in 2015, now real estate services are in the ascendency, experiencing growth of 16%yr in 2016. Also aiding headline growth in 2016 has been wholesale & retail activity, where growth has firmed from 6%yr in 2015 to 7%yr in 2016.
Looking forward, authorities will be hoping that the recent strong residential property price growth not only supports an improvement in residential construction, but also gains for consumption. The improvement seen in employment indicators during 2016 should also aid spending. However, in tier-1 cities (the four largest cities), further policy action is expected to cool excessive price pressures.
In contrast, concerns over the secondary sector remain despite an acceleration in growth, from 0.4%yr in late-2015 to a (still-modest) 5%yr at September. For manufacturing, near-term downside risks clearly have abated in recent months as production and new orders improved. The weaker currency has certainly played a part, improving Chinese manufacturers’ competitiveness.
For construction, conditions are still weak and the outlook clouded. Despite the substantial rise in house prices primarily in tier-1 cities, there has only been a modest acceleration in investment in the sector. Affordability concerns; the potential for further policy actions; and limits on land supply in tier-1 cities are restraining new investment. Outside of tier-1, there is still a considerable inventory of unsold new homes to work through, giving little cause to expand supply.
Growth in investment by state-owned enterprises remains strong, circa 21%yr in September 2016. But private-sector momentum is unquestionably weak, experiencing growth of just 2.5%yr. Public investment continues to be focused on essential services, transport and utilities in particular.
The past six months have seen much calmer financial markets, both with respect to the Renminbi and equities. Since July 2016, the Renminbi has been broadly stable on a trade-weighted basis, but a strengthening USD has seen the currency depreciate by around 9% against the USD over that period. This recent period of trade weighted stability (official policy since August 2015) and the
The Westpac–Department of Industry, Innovation and Science China Resources QuarterlyThe Westpac–Department of
Industry, Innovation and Science China Resources Quarterly 8

depreciation against the USD has likely been welcomed by policy makers.
Following the declines of 2014–2015, commodity prices have experienced a sharp rally through 2016. Sluggish real demand; high inventory levels; and market analysis all indicate that financial speculation and US dollar asset demand has provided considerable support to prices. Into 2017 we expect prices to revert back towards cost curves, as the supply of key commodities adjusts to current windfall profits, and speculative demand softens under the weight of falling prices.
Australian bulk commodity producers have taken great strides in lowering their production costs and increasing capacity. They are expected to play a significant role in the supply adjustment. Further, they remain in a strong position to weather any undershoot in prices that may result from increased supply. However, those further up the cost curve, including private Chinese producers, are in a much more precarious position.
The Westpac–Department of Industry, Innovation and Science China Resources QuarterlyThe Westpac–Department of
Industry, Innovation and Science China Resources Quarterly 9

2. Recent developments in the Chinese economy
Many questions remain regarding China, but for now solid growth persists. This is primarily the result of robust gains for the tertiary (service) sector, as manufacturing continues to be impacted by global conditions and the construction sector is restricted by limited new building activity, particularly outside of tier-1 cities.
Following the reported 1.2% lift in real GDP in Q1, Q2 and Q3’s respective 1.9% and 1.8% gains have left average quarterly growth for 2016 at 1.6%, broadly in line with 2015’s 1.7% pace.
Annual growth in real GDP of 6.7% over the year to Q3 2016 is unchanged from Q2 and Q1 2016. It is however a step down from 7.0%yr at Q2 2015; and 7.5%yr at Q2 2014. Taking a longer historical perspective, annual growth through the first half of 2016 is the weakest it has been since Q1 2009 and before that Q4 1999.
Nominal growth has seen an improvement over the past nine months, the annual gain rising from 6.1%yr in Q4 2015 to 7.8%yr in Q3 2016. This acceleration has come as the deflator rebounded with commodity prices, from –0.7%yr to 1.1%yr.
After a commodity price induced surge in Q1 2016, in nominal terms annual growth in the primary sector has since moderated from 13.3%yr to 2.7%yr. However, offsetting this deceleration has been further robust growth in the service sector (10.9%yr) as well as a lift in the secondary sector pulse, from 0.4%yr at Q4 2015 to 5.4%yr in Q3 2016.
The consumer continues to take over as the structural driver of aggregate growth. Year-to-date in 2016, consumption has added 4.8ppts to annual growth, almost twice investment’s contribution of 2.5ppts. Compare 2016 to three years ago: at that time investment contributed 4.3ppts against consumption’s 3.5ppts.
Nominal investment in heavy industrial and extractive industries remains weak but is being partly offset by utilities and transport. Housing has also strengthened, although the gains are modest versus history and concentrated in a sub-set of cities. Fixed asset investment by private enterprise remains weak, with annual growth of 2.5%yr against state-owned enterprises’ 21.0%yr.
Figures 1–3
The Westpac–Department of Industry, Innovation and Science China Resources QuarterlyThe Westpac–Department of
Industry, Innovation and Science China Resources Quarterly 10

Please refer to page 2 of The Westpac-DIIS China Resources Quarterly PDF version.
It is constructive to complement the national accounts with a range of alternative indicators which also correlate with overall activity. Doing so provides a richer and more complete picture of key macroeconomic trends.
Beginning with the People’s Bank of China’s corporate survey, the largest firms across the nation believe conditions remained challenging through mid-2016, a sustained improvement in domestic orders notwithstanding.
The survey’s ‘business situation’ measure has now been below its long–run average for eleven consecutive quarters – and thirteen of the past fourteen. Weakness in domestic orders has been a key factor, so the Q2 bounce gives hope that conditions are stabilising and that a lasting improvement might be in train. Clearly though, risks remain to the downside.
Other measures of aggregate activity are mixed. Electricity consumption has picked up, annual growth accelerating from an average of 2.2%yr over the 18 months to June 2016 to 8.4%yr in September. Against this improvement, growth in cement and steel usage remains weak at 1.7%yr and 3.7%yr respectively. The divergence in these indicators is entirely consistent with the imbalance between growth in the service and secondary sectors previously discussed.
To better understand the consumer growth story, it is instructive to dig deeper into the service sector detail. First, it is evident that growth in the financial sector has slowed considerably. Through 2015 it averaged 23.2%yr; in 2016, growth of 8.5%yr has been seen. This deceleration comes as a result of reduced interest in marketable financial assets and margin lending amongst investors.
Investor interest has instead shifted back to the real estate sector, where growth in related services has accelerated from 8.6%yr in 2015 to 16.3%yr. Strong price gains and available credit have resulted in a surge in sales activity. While a clear positive for current growth, this is one area of the economy where substantial risks lay. Finally, on household consumption, an uptrend continues to emerge in wholesale & retail activity, with growth firming from 6.0%yr in 2015 to 7.0%yr in 2016.
Figures 4–6
Please refer to page 3 of The Westpac-DIIS China Resources Quarterly PDF version.
2.1 The real estate sector
Real estate investment itself is split roughly 70/30 between residential and non–residential. State–Owned Enterprises represent circa 16% of the total.
In recent editions of the CRQ, we have noted that the real estate slowdown (which directly accounted for almost 50% of the near 5ppt deceleration in investment growth through 2015) had partly reversed, with year-to-date
The Westpac–Department of Industry, Innovation and Science China Resources QuarterlyThe Westpac–Department of
Industry, Innovation and Science China Resources Quarterly 11

growth in real estate investment strengthening from 1.0% at end-2015 to 7.2% in April 2016.
Authorities would have hoped this momentum would strengthen further in mid-2016, but growth instead moderated again to a low of 5.3% in July. Since then there has only been an incremental acceleration, to 5.8% in September.
Crucial for the housing outlook is the geographical breadth of activity, best highlighted by the 70-city house price data.
Splitting the 70 cities into three development-based tiers, there remains a marked divergence between the most wealthy and developed locales and those that are much further down the urbanisation frontier. Note tier-1 cities continue to see price growth near 30%yr; while in tier-3, prices have gained circa 6%yr.
While it is certainly the case that tier-2 and tier-3 price momentum has firmed, the city-by-city data suggests these gains are, in large part, the result of speculative activity broadening to the outer tiers. This is evident in the broad spectrum of price gains in each tier: from 0%yr to 46%yr in tier-2 new housing; and from –5%yr to 47%yr in tier-3.
Clearly, less-developed cities with proximity to more-developed areas and/or new industry are receiving much stronger interest from investors than areas which have a heavy exposure to the old economy.
While property and land prices continue to rally, the leading indicators for construction are only growing at a modest pace. This is likely to persist. Developers in cities that have seen strong price growth need to consider the risk tighter policy measures could pose; meanwhile, weaker cities still have considerable new home inventory to work through.
Figures 7–9
Please refer to page 4 of The Westpac-DIIS China Resources Quarterly PDF version.
2.2 Monetary & financial conditions
The monetary policy stance has had a basic tightening posture since 2011, related to the unwinding of the stimulus–era legacy. This has been periodically interrupted by a cyclical need to underpin growth and/or accommodate smooth refinancing. The annual flow of credit to GDP peaked at 40% in late 2009; hit a local trough of 25% of GDP in early 2012; rebounded to 33% of GDP in early 2013; then fell to a new low circa 16% of GDP at Q3 2016. Of the 2013–2016 deceleration, the decline was led by shadow finance to the end of 2015 – itself dominated by the off-balance sheet activity of banks. Since then, the reduction in the flow of new credit has instead come as a result of reduced growth in on-balance sheet bank loans.
Turning to the currency, in August 2015 authorities altered the way in which the Renminbi was managed, focusing on stability against a basket of currencies rather than the USD bilateral rate. The Renminbi has since
The Westpac–Department of Industry, Innovation and Science China Resources QuarterlyThe Westpac–Department of
Industry, Innovation and Science China Resources Quarterly 12

depreciated by 9% against the USD and around 8% on a trade-weighted basis; however, the latter (authorities’ benchmark) has been broadly stable since mid-July.
Coupled with real interest rates which are marginally below average, the actions taken by authorities on the currency have improved domestic financial conditions, reducing pressure on Chinese exporters. This has clearly been evident in recent PMI data.
Authorities’ management of the currency has also seen the downtrend in China’s FX reserves abate, although it is worth bearing in mind that global financial conditions have also been more supportive of authorities aims through mid-2016. A renewed spate of global risk aversion and/or anxieties over growth could once again put pressure on reserves.
On a longer-term perspective, it should be remembered that other factors are restricting China’s FX reserve accumulation, specifically a rise in foreign loans made by Chinese banks and outward FDI from China at a time of weaker export receipts. As internationalisation proceeds, bank–related activity; outward direct investment; rapid growth in portfolio flows; and a growing services deficit will increasingly see the goods’ surplus recycled.
Figures 10–12
Please refer to page 5 of The Westpac-DIIS China Resources Quarterly PDF version.
The Westpac–Department of Industry, Innovation and Science China Resources QuarterlyThe Westpac–Department of
Industry, Innovation and Science China Resources Quarterly 13

Table 1: General macroeconomic data
Sep–13Dec–
13 Mar–14 Jun–14 Sep–14Dec–
14 Mar–15 Jun–15 Sep–15 Dec–15 Mar–16 Jun–16 Sep–16
Real GDP %yr 7.9 7.7 7.4 7.5 7.1 7.2 7 7 6.9 6.8 6.7 6.7 6.7
Nominal GDP %yr 10.3 10.6 8.4 8.7 8.4 7.4 6.7 7.2 6 6.1 7.1 7.3 7.8
Contributions to real GDP percentage points ytd
Final consumption expenditure 3.5 3.6 5.5 4 3.6 3.6 4.5 4.2 4 4.1 5.7 4.9 4.8
Gross capital formation 4.3 4.3 3.1 3.6 3 3.4 1.2 2.6 3 2.9 2.4 2.5 2.5
Net exports –0.1 –0.1 –1.2 –0.2 0.8 0.3 1.3 0.3 –0.1 –0.1 –1.4 –0.7 –0.5
Secondary industry %ytd 7.9 8 7.6 7.7 7.6 7.4 6.3 6.2 6.1 6.1 5.9 6.1 6.1
Tertiary industry %ytd 8.4 8.3 7.6 7.6 7.6 7.8 8 8.3 8.4 8.3 7.6 7.5 7.6
Current Account %GDP 4qma 1.8 1.5 1.3 1.7 2.1 2.6 3.2 3.2 3.1 3.1 2.7 2.4 n.a.
GDP deflator %yr 2.4 2.9 1 1.2 1.3 0.2 –0.3 0.2 –0.9 –0.7 0.4 0.6 1.1
Fixed investment deflator %yr 0 0.9 1.1 0.6 0.4 –0.1 –0.9 –1.2 –2.3 –2.9 –2.7 –0.8 –0.1
Land price index %yr 6.2 7 7.5 7.2 6.1 5.2 3.8 3.4 3.5 3.2 3.6 3.9 4.5
Consumer price index %yr 2.8 2.9 2.3 2.2 2 1.5 1.2 1.4 1.7 1.5 2.1 2.1 1.7
Non–food %yr –1.7 –1.4 –2.0 –1.5 –1.3 –2.8 –4.6 –4.7 –5.7 –5.9 –4.8 –2.9 –0.8
Central revenue 4qma %yr 10.8 10.2 10.8 10.8 9.7 8.7 7.3 7.5 8.2 8.5 9.2 8.8 7.3
Central expenditures 4qma %yr 7.5 11.2 11.3 13.4 14.1 8.5 7.6 7.1 11.1 15.9 17.4 17.4 13.3
Central operating position 4qma %GDP –1.4 –1.8 –1.8 –2.3 –2.3 –1.8 –1.9 –2.2 –3.0 –3.4 –3.8 –4.2 –4.4
Money supply M2 %yr 14.2 13.6 12.1 14.7 12.9 12.2 11.6 11.8 13.1 13.3 13.4 11.8 11.5Bank loans (stock) %yr 14.3 14.1 13.9 14 13.2 13.6 14.7 14.4 15.8 15 14.7 14.3 13Total credit supply (new, rolling annual) %GDP 31.1 29.1 27.7 28.6 25.7 25.6 23.7 22.2 23.1 22.5 25.1 23.2 25.1
The Westpac–Department of Industry, Innovation and Science China Resources QuarterlyThe Westpac–Department of Industry, Innovation and Science China Resources Quarterly
14

Sep–13 Dec–13 Mar–14 Jun–14 Sep–14 Dec–14 Mar–15 Jun–15 Sep–15 Dec–15 Mar–16 Jun–16 Sep–16
Exports %yr 3.9 7.5 –4.7 5 13 8.6 10 –2.2 –5.9 –5.3 –8.6 –4.3 –6.6
to G3 2.6 9.4 2.8 9.3 10.5 3.8 7.6 –1.0 –3.3 –4.2 –6.4 –6.3 –3.7
to Asia ex Japan 7.5 6.9 –10.3 2.8 16.2 13.3 9.9 –2.6 –7.4 –4.1 –9.0 –2.0 –8.5
to Australia 3 –1.5 1.1 4.8 4.1 5.3 14.4 4.2 1 2 –1.0 –9.4 –5.0
to non–Asian emerging markets –1.4 5.9 –3.3 3.9 14.6 10 16.6 –5.0 –10.0 –14.7 –16.1 –6.6 –10.7
Imports %yr 8.4 7.2 3.3 1.5 1.2 –1.4 –17.9 –13.5 –14.2 –12.0 –13.4 –6.6 –4.5
from G3 4.3 8.1 11.5 7.4 4.3 2.4 –11.8 –10.2 –13.0 –11.0 –9.8 –3.3 –2.1
from Asia ex Japan 7.3 1.5 –4.7 1.7 3.5 –0.4 –14.1 –11.4 –14.5 –9.2 –12.9 –7.2 –4.0
from Australia 19 33.5 24.8 2.4 –1.9 –20.5 –26.5 –30.9 –20.5 –18.5 –30.8 –0.3 –2.2
from non–Asian emerging markets 4.9 6.3 2.4 4.5 0.8 –4.4 –36.7 –27.6 –20.5 –23.0 –11.3 –6.4 –9.9
Trade balance USDbn 61.5 90.5 16.6 85.9 128.1 149.5 123.7 139.5 163.6 174.8 125.7 143.4 144.3
Change in FX reserves USDbn 166 159 127 45 –106 –45 –113 –36 –180 –184 –118 –7 –39
Enterprise survey – net balance, 50 base
Business conditions56.3 58.1 55.3 55.4 54.9 54.5 52.8 51.8 49.4 48.4 46.7 48.3 50.3
Profitability55.1 57.6 50.9 54.1 55 55 51 52.8 51.1 50.5 47.2 52.7 54.7
Domestic orders48.2 49.4 44.4 48.5 46.9 46.5 42.5 46.3 43.3 42.5 39.1 46.6 46
Foreign orders50.1 48.7 45.4 49.7 49.9 47.9 44.2 48.7 46.3 43.7 41 46.5 46.9
Banking climate – % of average
Demand for loans97.9 97.5 102.5 93.7 87.3 85.1 90.2 79.2 74.3 74.5 82.2 74.3 73
Ease of policy stance71.8 72.7 67.9 73.3 83.3 89.3 95.8 117.3 108.8 119.6 113.8 108.4 103.9
Bankers’ confidence level113.2 132.3 125.5 99.7 109.7 97.4 88.2 80.6 75.4 70.3 70.7 81.1 86.3
The Westpac–Department of Industry, Innovation and Science China Resources QuarterlyThe Westpac–Department of Industry, Innovation and Science China Resources Quarterly
15

Westpac MNI Consumer Sentiment* – % of average
Headline composite96.6 103.4 99.2 97.8 95.1 93.2 94.4 93.2 97.3 93.8 95.9 96.9 95
Expected family finances97.3 104.6 98.5 100.1 95.6 92.9 94.8 93.8 99.9 94.1 97.3 95.7 92.5
House price expectations103.5 102 105.5 104.3 105.5 104.3 106.2 105.1 107.2 103.6 105.3 103.6 103.9
Employment outlook97.5 110.4 99.8 99.9 94.9 93.5 94 93.3 90.9 90.2 88.3 93.4 92.5
Sources: Westpac Economics, CEIC, MNI.
The Westpac–Department of Industry, Innovation and Science China Resources QuarterlyThe Westpac–Department of Industry, Innovation and Science China Resources Quarterly
16

Table 2: Resource related economic indicators
Oct–15 Nov–15 Dec–15 Jan–16 Feb–16 Mar–16 Apr–16 May–16 Jun–16 Jul–16 Aug–16 Sep–16
Industrial production %yr 3mma 5.8 5.8 5.9 5.8 5.6 5.9 6.1 6.3 6.1 6.1 6.2 6.1
Electricity 1.4 1.4 1.4 n.a. n.a. 5.9 2.9 2.5 1.6 4.4 6.9 8.4
Processed crude oil 3.3 2.2 2.8 n.a. n.a. 0.5 2.1 1.6 2.8 2.9 2.6 2.4
Cement* –3.6 –4.3 –4.3 n.a. n.a. 6.3 8.5 10.4 2.9 2 1.5 1.7
Steel products* –0.9 0 –0.7 n.a. n.a. 1.7 1 1 1.2 2.4 3.3 3.7
Non–ferrous metals* 16.1 13.6 9.9 n.a. n.a. 3.8 2.8 2.1 0 –0.4 –0.3 1.7
Automobiles* –7.0 0.1 8.8 n.a. n.a. 4.2 4.6 4.8 6.2 13.4 20.1 28
Civilian ships* 0.3 –9.8 –9.1 n.a. n.a. –14.7 –20.9 –20.2 –17.9 –15.5 –11.0 –9.8
Metal cutting tools* –16.4 n.a. n.a. n.a. n.a. n.a. n.a. n.a. n.a. n.a. n.a. n.a.
Fixed asset investment %yr 3mma 8.4 9 9 9.3 9.1 10.5 10.5 9.6 8.3 6.2 6.5 7
Manufacturing, of which 6.8 7.4 7.4 7.1 6.5 6.9 6.2 4.1 2.1 0.8 1.1 2.9
Heavy industry 4.9 4.9 5.7 4.4 4.1 4.4 4 2.6 –0.6 –2.5 –3.2 –1.2
Hard infrastructure, of which 15.5 16.7 15.4 16.3 13.9 17.8 19.4 20.8 20.7 17.8 16.6 14.5
Highways 13.8 15.7 13.4 10.8 7.6 8.9 10.3 11.6 14.6 15.7 18.5 17.2
Railways –10.2 –10.7 –13.6 –13.4 –17.4 –8.7 3.1 18.7 30.4 16.9 12.8 6.8
Utilities 12.8 14.5 17.5 18.8 18.1 19 23.4 22.9 24.5 16.8 12.2 7.3
Real estate, of which –2.2 –3.5 –3.1 –1.3 1.4 5.2 7.5 8.6 6.6 3.8 3.7 5.1
Dwellings –1.8 –2.9 –3.0 –1.9 0.3 3.8 6.8 8.8 6.9 3.1 2.7 4.3
Non–residential –3.0 –4.8 –3.4 –0.2 3.6 8.2 8.9 8.3 5.9 5.3 5.8 7
Off–market urban construction –6.5 17 –6.8 –24.0 –46.5 –32.9 –30.2 –32.1 –37.0 97.6 179.3 192.2
Value of new project starts
Number of new project starts –0.2 3.9 5.7 19.2 27.6 40.3 38.4 31.1 21.1 15.1 13.6 18.1
Local government projects 23.3 27.9 24 32.1 41.8 46.8 38.6 28.4 25.8 19.7 22.3 23.4
Central government projects 9.1 9.8 9.2 9.5 9.2 11 10.6 9.3 7.9 6.3 6.4 8
State owned enterprise investment –3.0 –4.0 5.3 4.4 5.1 0.1 9.9 15.1 17.7 5.2 9.2 –12.6The Westpac–Department of Industry, Innovation and Science China Resources QuarterlyThe Westpac–Department of Industry, Innovation and Science China Resources Quarterly
17

Oct–15 Nov–15 Dec–15 Jan–16 Feb–16 Mar–16 Apr–16 May–16 Jun–16 Jul–16 Aug–16 Sep–16
Volume of housing starts –8.6 –10.0 –17.4 –4.7 6.9 18.1 22.1 21.1 13.8 7.9 5.4 –2.7
Volume of housing sales 9.7 7.7 5.2 12.8 19.3 31.3 36.6 35.3 27.6 19.2 17.7 24.2
Value of housing sales – Nationwide 18.3 18 17.5 27.9 38.3 52.9 57 58.4 53.1 46.4 41.9 41.5
Eastern provinces 25.4 24.7 23.7 36.2 48.9 67.8 72.7 73.7 65 55.2 48.7 47.5
Central provinces 12 13.2 13.6 21.2 28.3 37.1 41 44.4 45.1 43.1 42.1 43.8
Western provinces 4.4 4.1 3.9 9.4 14.7 21.6 23.2 24.2 22.5 20.1 18.4 18.6
Volume of land sales –37.1 –34.9 –26.6 –21.8 –19.6 –11.3 –2.0 2.9 3.7 –8.4 –11.0 –9.3
70 city new house prices net % rising m–o–m –8.6 11.4 20 20 45.7 77.1 85.7 80 64.3 50 85.7 81.4
Auto sales 27.1 34.3 14.3 17.1 8.6 58.6 58.6 51.4 48.6 55.7 68.6 75.7
Excavator sales 3.6 11.3 15.8 14.5 7.5 5.3 4.8 8.4 10.4 16 20.8 24.8
Bulldozer sales 4.4 13.4 18.5 17.2 8.8 5.9 5 9.3 12 18.6 23.7 27.5
Terrestrial freight –31.6 –29.2 –28.4 –17.8 4 19.7 14.5 1.9 –2.2 7.5 21.7 43.2
Aquatic freight 3.9 4.4 5.3 1 –4.6 –8.6 –7.7 –5.8 –5.6 –5.9 –5.6 –5.7
International air freight 5.3 5.9 4.7 2 0.5 0.9 2.2 2.3 2.2 1.1 0.7 –0.1
Manufacturing PMI – index – of which Oct–15 Nov–15 Dec–15 Jan–16 Feb–16 Mar–16 Apr–16 May–16 Jun–16 Jul–16 Aug–16 Sep–16
Output 49.8 49.6 49.7 49.4 49 50.2 50.1 50.1 50 49.9 50.4 50.4
New orders 52.2 51.9 52.2 51.4 50.2 52.3 52.2 52.3 52.5 52.1 52.6 52.8
New export orders 50.3 49.8 50.2 49.5 48.6 51.4 51 50.7 50.5 50.4 51.3 50.9
Order backlog 47.4 46.4 47.5 46.9 47.4 50.2 50.1 50 49.6 49 49.7 50.1
Raw material inventories 47.2 47.1 47.6 46.8 48 48.2 47.4 47.6 47 47.3 47.6 47.4
Finished goods inventories 47.2 46.7 46.1 44.6 46.4 46 45.5 46.8 46.5 46.8 46.6 46.4
Purchases of inputs 48.8 48.3 50.3 49 47.9 52.6 51 51.2 50.5 50.5 52.6 51.9
Imports 47.5 46.7 47.6 46.4 45.8 50.1 49.5 49.6 49.1 49.3 49.5 50.4
New orders to finished goods inventories ratio 1.07 1.07 1.09 1.11 1.05 1.12 1.12 1.08 1.09 1.08 1.1 1.1Sources: Westpac Economics, CEIC.* Output for these sectors was not released for the months of January and February. As a consequence, we have entered na for those two months and reported the unsmoothed year–ended rate for March.
The Westpac–Department of Industry, Innovation and Science China Resources QuarterlyThe Westpac–Department of Industry, Innovation and Science China Resources Quarterly
18

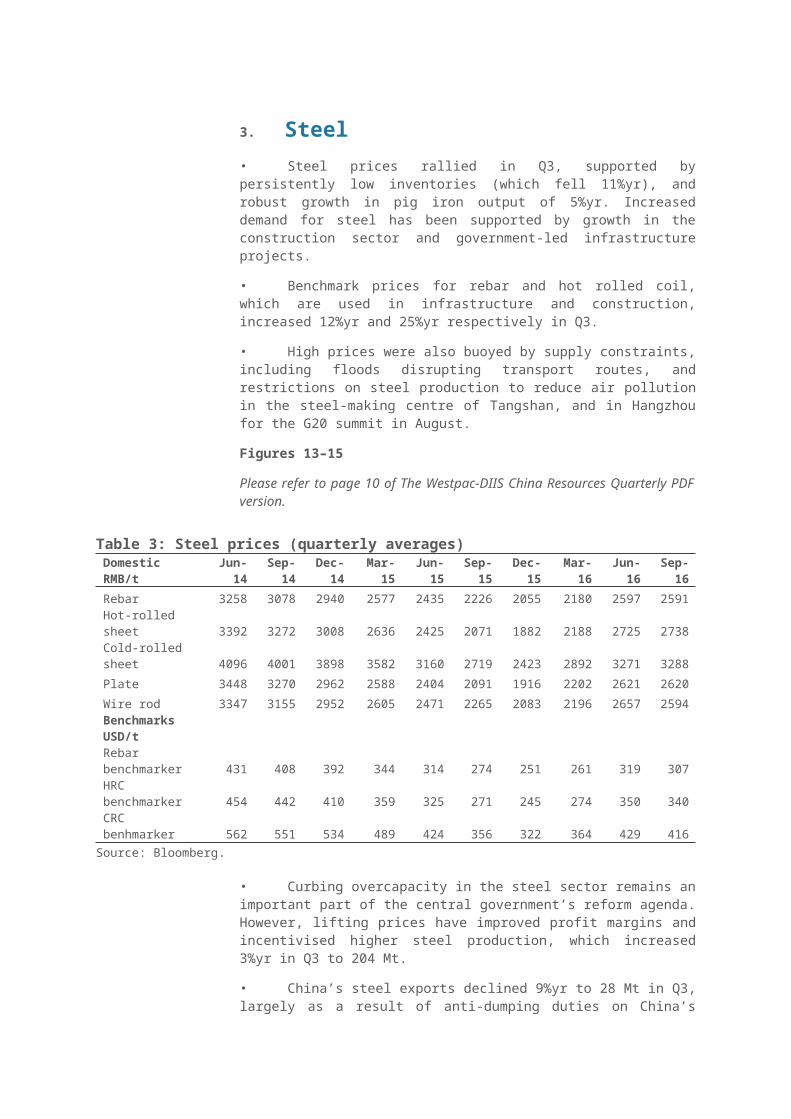
3. Steel• Steel prices rallied in Q3, supported by persistently low inventories (which fell 11%yr), and robust growth in pig iron output of 5%yr. Increased demand for steel has been supported by growth in the construction sector and government-led infrastructure projects.
• Benchmark prices for rebar and hot rolled coil, which are used in infrastructure and construction, increased 12%yr and 25%yr respectively in Q3.
• High prices were also buoyed by supply constraints, including floods disrupting transport routes, and restrictions on steel production to reduce air pollution in the steel-making centre of Tangshan, and in Hangzhou for the G20 summit in August.
Figures 13–15
Please refer to page 10 of The Westpac-DIIS China Resources Quarterly PDF version.
Table 3: Steel prices (quarterly averages)
Domestic RMB/t Jun-14 Sep-14Dec-
14 Mar-15 Jun-15Sep-
15 Dec-15 Mar-16 Jun-16 Sep-16
Rebar 3258 3078 2940 2577 2435 2226 2055 2180 2597 2591
Hot-rolled sheet 3392 3272 3008 2636 2425 2071 1882 2188 2725 2738
Cold-rolled sheet 4096 4001 3898 3582 3160 2719 2423 2892 3271 3288
Plate 3448 3270 2962 2588 2404 2091 1916 2202 2621 2620
Wire rod 3347 3155 2952 2605 2471 2265 2083 2196 2657 2594
Benchmarks USD/t
Rebar benchmarker 431 408 392 344 314 274 251 261 319 307
HRC benchmarker 454 442 410 359 325 271 245 274 350 340
CRC benhmarker 562 551 534 489 424 356 322 364 429 416Source: Bloomberg.
• Curbing overcapacity in the steel sector remains an important part of the central government’s reform agenda. However, lifting prices have improved profit margins and incentivised higher steel production, which increased 3%yr in Q3 to 204 Mt.
• China’s steel exports declined 9%yr to 28 Mt in Q3, largely as a result of anti-dumping duties on China’s steel products in the European Union, United States and India. The fall represents first quarterly year-on-year decline since Q2 2011.
Figures 16–20
Please refer to page 11 of The Westpac-DIIS China Resources Quarterly PDF version.

4. Iron ore• Iron ore prices averaged US$58 a tonne (CFR) in Q3, up 5%qtr and up 6%yr. Prices continued to increase at the start of Q4, closing at US$65 a tonne on 1 November. Persistently high iron ore prices have been supported by robust demand from the steel sector.
• Iron ore port stocks were 98 Mt at the end of July, the highest level since November 2014. At the end of Q3, iron ore port stocks were 95 Mt, up 18%yr.
• Higher prices have also been supported by lower than expected production from major iron ore producers. Rio Tinto revised down its 2016 shipment target from 330 Mt to a range of 325 to 330 Mt, and Vale has indicated that annual production for 2016 is likely to be at the lower end of its guidance range of 340 Mt to 350 Mt. BHP Billiton’s production guidance for 2016–17 remained unchanged.
• China’s imports of iron ore increased 8%yr in Q3, with imports from Australia up 7%yr, and imports from Brazil up 12%yr. Imports from the rest of the world also increased, up 15%yr. Australia’s share of China’s imports was 63% in Q3, while Brazil and the rest of the world accounted for 21% and 16% respectively.
• Increased demand for iron ore imports was also supported by the continued fall in China’s iron ore production (run of mine), which was down 10%ytd due to declining ore grades.
• Australia’s iron ore export volumes into China increased 2.5%qtr and 2.9%yr to 169 Mt in Q3, while export earnings increased 4.1%qtr and 5.5%yr to A$11.1 billion.
Figures 21–33
Please refer to pages 12–14 of The Westpac-DIIS China Resources Quarterly PDF version.
Table 4: Iron ore prices (USD/t, 62% ferrous metal content unless otherwise indicated).
Qingdao spot price, CFRJun-14
Sep-14
Dec-14
Mar-15
Jun-15
Sep-15
Dec-15
Mar-16
Jun-16
Sep-16
Quarter average 103 90 74 62 58 55 47 49 55 58
Quarter end 94 78 71 51 59 56 44 54 56 56
Quarter high 120 98 84 71 66 59 57 64 70 62
Quarter low 89 78 67 51 47 45 38 40 48 54
Qingdao price in CNY terms, CFR
642 558 457 390 363 346 299 318 363 389
Sources: Bloomberg. CFR is cost including freight

Table 5: Iron ore & metallurgical coal summary data
Iron ore Jun-14
Sep-14 Dec-14 Mar-15 Jun-15 Sep-15 Dec-15 Mar-16
China iron ore imports Mt 235.3 242.1 233.6 227.1 226.0 246.3 253.9 241.6
Australia Mt 138.2 149.4 142.7 144.4 146.8 158.5 157.9 150.1
Brazil Mt 38.9 44.7 45.8 41.8 42.3 50.1 57.5 53.6
value USDbn 25.7 21.9 18.5 15.8 13.2 14.8 14.1 10.8
Raw production * Mt 393.6 410.6 389.3 280.6 350.2 381.6 362.6 260.0
Iron ore stocks at ports, end of qtr Mt
105.7 103.2 95.2 93.3 74.1 80.9 89.3 89.4
weeks of imports weeks 6.2 6.1 5.6 5.5 4.4 4.8 5.3 5.3
Exports to China Mt 147.4 159.7 153.3 144.9 155.6 164.7 162.7 153.0
value AUDbn 13.6 12.8 10.9 9.9 9.6 10.5 9.1 8.6
Metallurgical coal
China met coal imports Mt 18.1 13.4 18.0 10.9 10.7 14.8 11.6 11.4
value USDbn 8.6 5.9 10.3 5.3 5.5 8.7 6.1 6.0
Australian exports to China Mt
5.5 3.2 4.0 3.1 3.1 3.0 3.4 3.2
value AUDmn1812.4
1270.3 1736.1 980.2 882.6 1162.8 790.6 742.3
Sources: Bloomberg, ABS, CEIC. * Raw mine output with a low iron content.
5. Metallurgical coal• Spot prices for metallurgical coal increased sharply in Q3 and into early Q4, driven by supply disruptions, and to a lesser extent, by robust demand from China’s steel making sector. The average price of prime hard coking coal (CFR) was US$134 a tonne, up 41%qtr and 48%yr. Low volatility PCI CFR China averaged US$91 a tonne, up 24%qtr and 40%yr.
• Australian benchmark prices for high-quality metallurgical coal delivered in Q4 settled at US$133 a tonne, up from US$91 a tonne in Q3.
• Mandated output cuts and weather-related closures of key transport routes in China compounded operational issues at Australian mines to constrain world supply. At the same time, global demand has been steadily increasing in 2016, with production of coke in Q3 only 4.2% lower than the Q2 2013 peak.
• The NDRC rejected a request by China’s steel makers for coal mines to increase coking coal production to bring down prices.
• China imported 17 Mt of metallurgical coal in Q3, up 12%yr. China’s imports of metallurgical coal from Australia fell 8%yr to 8 Mt, accounting for 49% of China’s metallurgical coal imports. China’s imports from Mongolia, increased 108%yr to 6 Mt.
• Australia exported 8 Mt of metallurgical coal to China in Q3, a decrease of 2%yr. Export earnings from metallurgical coal declined 2%yr to $A852 million, due to lower volumes.
Figures 34–36
Please refer to page 16 of The Westpac-DIIS China Resources Quarterly PDF version.
Table 6: Metallurgical coal prices (quarterly average spot prices).Jun-
14Sep-
14Dec-
14Mar-
15Jun-
15Sep-
15Dec-
15Mar-
16Jun-
16Aus Premium Hard FOB East Coast
USD/t
115 114 113 108 90 84 77 79 91
Aus Premium Hard CFR East Coast to China
USD/t
118 120 122 112 95 91 82 81 95
Source: Bloomberg
Figures 37–41
Please refer to page 17 of The Westpac-DIIS China Resources Quarterly PDF version.
6. Developments in China’s energy policy • In early 2016, China reduced the annual operating day limit on coal mines from 330 to 276 days per year. Following a rise in thermal coal prices and expectations of increased coal demand over winter, this policy directive was partially reversed in Q3.
• On 8 September, Chinese officials loosened coal capacity controls. A group of 74 mines were allowed to adopt a 330 day per year schedule on a monthly basis, but were required to stay within the 276 day cap by operating for fewer days in other months of the year.
• From 1 October, policies to curb production were further relaxed, with around 800 mines allowed to operate on 330 days per year until the end of 2016. The mines were also allowed to operate through the Golden Week holiday at the beginning of October — a time when activity usually ceases.
• On 25 October, the NDRC and major coal companies met to discuss further steps to guarantee supply during the winter while also pursuing the government’s long-term goal of removing excess inefficient capacity.
• In September, the National Energy Administration cancelled 15 new coal-fired power plants projects, with a total capacity of 12 million kilowatt hours (kWh). The decision was designed to address overcapacity in China’s coal-fired power sector.
• On 12 October, the NDRC announced that the rate of return on investments in natural gas pipelines would be reduced to 8 per cent, from previous rates of 10 and 12 per cent, starting from January 2017. The policy applies to pipelines with utilisation rates of above 75 per cent. The policy

aims to lower transportation costs and lift the share of gas in the country’s energy mix.
• On 30 September, the National Energy Administration released the Shale Gas Development Plan (2016-2020). China is aiming to increase shale gas production from around 4.5 bcm in 2015 to 30 bcm by 2020, and to between 80 bcm and 100 bcm by 2030.
• On 31 August, “Guidelines on Establishing the Green Financial System” were issued by seven Chinese government agencies, including the People’s Bank of China (PBOC). The PBOC noted the purpose of establishing a green financial system was to mobilise investment in green sectors and restrict investment in polluting sectors.
6.1 Electricity trends
• China’s electricity generation increased 8%yr to 1.6 trillion kWh in Q3. The majority of the increase was driven by growth in thermal power generation, although generation from hydro, nuclear and wind also rose. Higher thermal power generation has been attributed to an extremely hot summer and an uptick in manufacturing activity. Hydro, nuclear and wind generation increased by 2%yr, 17%yr and 30%yr respectively.
• Electricity consumption increased across all sectors. Primary, secondary, tertiary and residential electricity use increased, by 1%yr, 7%yr, 15%yr and 18%yr respectively.
• Investment in electricity generation capacity stood at RMB 199 billion in the first nine months of 2016, down 11% from the same period last year. Investment declined in thermal, hydro, nuclear and wind by 8%yr, 20%yr, 1%yr and 29%yr respectively.
Figures 42–47
Please refer to page 19 of The Westpac-DIS China Resources Quarterly PDF version

7. Thermal coal• Thermal coal prices rose to their highest level in over two years in Q3 because of mandated production cuts in China. Newcastle spot prices increased 30%qtr, while the Baltic benchmark rose 28%qtr, and Qinhuangdao increased 22%.
• In May, the NDRC ordered all Chinese coal mines to reduce working days from 330 to 276, in an effort to cut production capacity. This saw coal production decline 10%yr in the first eight months of 2016. However, in September the NDRC partially reversed its decision allowing some major mines to increase thermal coal output.
• China’s electricity generation from coal increased by 10%yr in Q3. Thermal coal’s share of the electricity mix in China increased slightly to 73% in Q3, up from 72% a year earlier.
• In September, China cancelled 15 new coal-fired power plant projects, with a combined capacity of 12 million kilowatt hours.
• China’s imports of thermal coal increased 33%yr to 56 Mt in Q3. Indonesia accounted for the majority of China’s total thermal coal imports in Q3, at 51%, while imports from Australia accounted for 24%.
• Australia exported 10 Mt of thermal coal to China in Q3, up 33%yr. Export earnings increased 36%yr to $607 million.
Figures 48–50
Please refer to page 20 of The Westpac-DIIS China Resources Quarterly PDF version.
Table 7: Thermal coal prices
Jun-14
Sep-14
Dec-14
Mar-15
Jun-15
Sep-15
Dec-15
Mar-16
Jun-16
Newcastle 6000 kcal USD/t 84 79 73 69 64 66 59 59 53
Newcastle 6000 kcal AUD/t
91 87 78 74 75 84 76 81 74
Source: Bloomberg.
Figures 51–55
Please refer to page 21 of The Westpac-DIIS China Resources Quarterly PDF version.

Table 8: Thermal coal summary data
Jun-14 Sep-
14Dec-
14Mar-
15Jun-15 Sep-
15Dec-
15Mar-
16Jun-16
China imports Mt 58.1 49.7 50.4 38.1 40.1 41.7 36.2 37.0 44.0
value USDmn4069.
33346.
43156.3 2254.7 2243.
52095.
81682.0 1567.6 1903.
2EOQ stocks at ports Mt
31.4 26.3 29.4 32.4 27.8 23.3 16.3 14.8 15.1
weeks of imports weeks 7.0 6.9 7.6 11.0 9.0 7.2 5.9 5.2 4.5
Exports to China Mt 12.9 11.8 10.4 10.3 9.0 7.4 6.6 7.3 8.8
valueAUDmn
870.7 742.0 659.8 692.1 541.8 447.2 362.2 395.2 497.3
Sources: ABS; CEIC; Bloomberg.
8. Oil• The oil price rally, which began in early 2016, stalled in Q3, weighed down by the recovery of Canadian production, strong Middle Eastern production, subdued growth in global consumption and high inventories.
• Brent prices remained unchanged quarter-on-quarter in Q3, averaging US$47/bbl. WTI prices fell 1%qtr to average US$45/bbl, while Tapis declined 2%qtr to US$46/bbl.
• Oil prices increased to just over US$50/bbl in October after OPEC announced a production target of 32.5 to 33.0 mb/d on 28 September.
• China’s oil consumption increased 0.5%yr in Q3. Subdued demand growth reflected flooding in southern China which kept motorists off the road, government efforts to curtail factory activity in Hangzhou ahead of the G20 meeting, and China’s ongoing transition to consumption-led growth.
• China’s crude oil output declined 9%yr in Q3 to 49 Mt—the lowest quarterly production in over six years. The result reflects the shut-down of high cost operations over the past year and natural decline at older fields.
• China’s imports of crude oil increased 14%yr in Q3 to 97 Mt due to declining domestic output.
• China’s crude oil imports from Australia increased 68%yr to 0.9Mt in Q3. Their value increased 37%yr to US$344 million.
Figures 56–58
Please refer to page 23 of The Westpac-DIIS China Resources Quarterly PDF version.

Table 9: Crude oil spot prices (USD/bbl, quarterly)
BrentSep-
14Dec-14 Mar-15 Jun-15 Sep-15 Dec-15 Mar-16 Jun-16 Sep-16
Quarter average103.5 77.1 55.1 63.5 51.3 44.7 35.2 47.0 47.0
Quarter end94.7 57.3 55.1 63.6 48.4 37.3 39.6 49.7 49.1
Quarter high112.3 94.2 62.6 67.8 62.1 53.1 41.8 52.5 50.9
Quarter low94.7 57.3 46.6 55.0 42.7 36.1 27.9 37.7 41.8
Tapis
Quarter average106.2 79.5 56.1 64.6 52.6 44.2 36.2 47.4 46.4
Quarter end100.2 58.6 55.9 63.3 48.2 35.6 40.7 50.3 47.9
Quarter high115.0 98.4 64.2 70.3 64.7 53.7 42.9 52.2 50.4
Quarter low98.7 58.6 47.4 56.8 43.8 35.6 27.7 38.5 41.1
West Texas Intermediate
Quarter average97.6 73.2 48.5 57.8 46.5 42.0 33.4 45.5 44.9
Quarter end91.2 53.3 47.6 59.5 45.1 37.0 38.3 48.3 48.2
Quarter high107.6 91.0 53.5 61.4 57.0 49.6 40.2 51.2 49.0
Quarter low91.2 53.3 43.5 49.1 38.1 34.7 26.2 35.7 39.5
Source: BloombergFigures 59–63
Please refer to page 24 of The Westpac-DIIS China Resources Quarterly PDF version.

9. Gas• The unit value of China’s LNG and pipeline imports decreased in Q3, by 7%qtr and 6%qtr respectively.
• China’s total natural gas imports increased 23%yr in Q3. In September, monthly imports reached the highest level on record as Chinese energy companies increased natural gas purchases to avoid repeating the shortages that occurred last winter.
• Pipeline imports declined 8%yr to 6.4 Mt in Q3, while LNG imports increased 38%yr to 6.4Mt. Outages at two major gas pipelines disrupted supply to the domestic markets in the east and north of the country.
• China sourced 52% of its total LNG imports from Australia in Q3. Imports from Australia increased 99%yr to 3.3Mt in Q3. The value of these imports rose 108%yr to US$1.0 billion.
• On October 20, the NDRC noted that it expects natural gas supply to be tight in northern China over the winter, indicating that various channels will be used to increase natural gas imports during this period.
• China’s natural gas production increased 4%yr in Q3. According to the National Energy Administration Shale Gas Development Plan (2016-2020) released in September, China is aiming to increase shale gas production from around 4.5 bcm in 2015 to 30 bcm by 2020.
Figures 64–68
Please refer to page 26 of The Westpac-DIIS China Resources Quarterly PDF version.
Figures 69–73
Please refer to page 27 of The Westpac-DIIS China Resources Quarterly PDF version.

Table 10: Oil and gas summary data
Oil Jun-14 Sep-14 Dec-14 Mar-15 Jun-15 Sep-15 Dec-15 Mar-16 Jun-16 Sep-16
China imports Mt 77.2 76.5 79.9 80.3 83.0 85.3 86.9 91.1 95.4 97.0
Saudi Arabia Mt
11.5 12.4 13.1 12.8 13.6 12.1 12.1 13.7 12.8 12.3
Angola Mt 8.7 5.8 6.1 6.7 7.9 6.3 5.7 6.4 8.6 7.6
Russian Federation Mt
7.8 8.0 9.8 8.6 10.9 10.9 12.1 12.1 14.2 11.8
Iran Mt 10.2 9.5 10.4 9.9 9.2 10.2 9.5 11.4 10.8 12.2
Oman Mt 8.5 7.6 7.7 7.8 6.5 9.2 8.6 8.1 8.9 9.2
other Mt 30.5 33.3 32.9 34.6 35.0 36.6 38.9 39.3 40.2 43.9
China production
Crude Mt 52.2 52.0 53.9 52.2 53.8 54.0 53.9 51.5 50.0 49.1
Gasoline Mt 26.9 26.8 28.7 28.7 30.6 30.9 31.0 29.5 32.5 31.2
Diesel Mt 42.9 43.5 46.0 43.8 45.6 44.8 45.4 43.0 43.7 43.5
Chinese imports from Australia kt 711.9 744.2 540.3 600.4 557.2 541.2 689.7 708.7 916.6 911.6
value USDmn 567.1 594.8 342.1 247.3 269.1 251.8 246.0 216.8 326.5 344.2
Gas
China pipeline imports Mt 5.9 6.0 6.2 6.7 5.7 5.8 6.5 8.4 6.9 6.4
China LNG imports kt 4.3 4.8 5.2 5.1 4.4 4.6 5.5 6.0 5.5 6.4
Qatar kt 1.4 1.3 1.5 1.3 0.7 1.2 1.6 1.9 0.6 0.6
Australia kt 0.9 1.2 0.9 1.1 1.3 1.7 1.5 2.0 2.8 3.3
Indonesia kt 0.6 0.7 0.7 0.7 0.7 0.8 0.6 0.5 0.7 1.0
Malaysia kt 0.7 0.6 0.8 0.8 1.1 0.5 0.8 0.6 0.6 0.7
other kt 0.7 1.0 1.3 1.2 0.5 0.5 0.9 1.0 0.8 0.8
China production Bcm 29.0 29.2 33.5 33.6 29.2 30.1 34.0 12.3 31.6 31.2
Chinese imports from Australia kt
904.6 1162.2 902.1 1093.8 1286.3 1671.8 1500.2 2023.8 2810.9 3328.4

value USDmn 159.7 239.1 173.1 270.9 433.3 485.4 444.3 600.4 858.8 1010.1
Source: CEIC.

10. Uranium• The average spot price for uranium fell by 9.5%qtr and 32.2%yr in Q3, averaging US$24.57lb over the quarter. High inventories and abundant supply continue to hold uranium prices at near historical lows, although strong reactor growth in China, India, Russia, and South America may lead to some price recovery in late 2017.
• China’s investment in new nuclear capacity rose by 2.2%yr to RMB 87.3 billion in Q3.
• In Q3, two new reactors came online in China. This brings the total number of operational reactors in China to 35, with a further 20 under construction and more than 40 in the planning stage.
Figures 74–77
Please refer to page 28 of The Westpac-DIIS China Resources Quarterly PDF version.
Table 11: Uranium summary data.
Sep-
14Dec-
14Mar-
15Jun-
15Sep-
15Dec-
15Mar-
16Jun-
16Sep-
16
Uranium spot priceUS$/lb U3O8 31.8 37.1 38.0 36.2 36.2 35.5 31.9 27.2 24.6
China nuclear power generation
billion kWh 1455 1384 1307 1376 1479 1402 478 1399 1604
Investment in nuclearRMB billion 97 143 15 49 86 135 14 51 87
China uranium imports t 4985 9281 2041 5659 7505 7439 328 6533 5084
alue USDmn 482 810 210 587 721 691 43 640 437
Source: CEIC, Cameco, UxC Consulting
Figures 78–82
Please refer to page 29 of The Westpac-DIS China Resources Quarterly PDF version.

11. Gold• The average LBMA gold price increased 6.1%qtr in Q3 to US$1335 a troy ounce. However, the price dropped 5.4% in the first two weeks of October due to firming expectations of a US interest rate increase, weaker retail consumption and declining purchases by various central banks.
• The SHFE gold price averaged 287 yuan a gram, up 8.3%qtr. The SHFE gold price also fell in the first two weeks of October to be 5% lower than the September quarter average.
• Despite the recent drop in gold prices, known Exchange Traded Funds (ETFs) gold holdings remain at historically high levels, averaging 2,046 tonnes in October.
• Negative real interest rates in Europe and Japan, and continued uncertainty about the global economy continue to maintain investor interest in gold.
• China’s gold reserves increased to 1,838 tonnes at the end of September, up 0.8%qtr as the central bank of China continued to build its gold reserve holdings.
• Jewellery demand in China increased 17%qtr to 98 tonnes but remains 27% lower yoy due to higher prices and weaker consumer sentiment. Weaker demand has placed considerable pressure on China’s gold industry, with several small jewellery fabricators going bankrupt and a number of larger organisations being forced to downsize.
• Production in China—the world’s largest producer—reached 21 tonnes in September, close to record highs.
• Gold imports to China via Hong Kong increased 12%yoy to 605 tonnes in the first eight months of 2016.
• Australia exported 41 tonnes of gold to China in Q3, up 28%qtr. The value of Australia’s gold exports to China reached A$2.3billion, up 32.3%qtr.
Figures 83–84
Please refer to page 30 of The Westpac-DIIS China Resources Quarterly PDF version
Table 12: Gold prices (USD/troy oz unless specified otherwise)
LBMA spot prices Jun-14 Sep-14Dec-
14 Mar-15 Jun-15 Sep-15 Dec-15 Mar-16 Jun-16 Sep-16
Quarter average 1290 1282 1201 1219 1194 1125 1104 1182 1258 1335
Quarter end 1327 1208 1185 1184 1172 1115 1061 1233 1322 1316
Quarter high 1328 1339 1249 1302 1226 1170 1184 1272 1325 1366
Quarter low 1244 1208 1141 1150 1172 1085 1051 1061 1206 1309Shanghai avg RMB/g 259 255 238 246 239 229 228 248 265 287Shanghai avg USD/g 41 41 39 39 38 36 36 38 41 43Sources: LBMA, Bloomberg

Figures 85–89
Please refer to page 31 of The Westpac-DIIS China Resources Quarterly PDF version.
Table 13: Gold and silver summary data
Sep-
14Dec-
14Mar-
15Jun-
15Sep-
15Dec-
15Mar-
16Jun-
16Sep-
16
GoldChina imports (via Hong Kong) t 168.8 389.1 229.0 178.8 241.9 343.1 168.8 279.6 na
Domestic production t 140.7 100.1 110.7 118.0 110.7 110.7 111.6 117.5 na
Australian exports to China t 29.7 42.5 39.4 40.1 56.4 52.4 37.2 32.3 41.2
alue
AUDmn
1318.1
1899.1
1951.9
1974.6
2800.8
2560.1
1943.5
1763.7
2337.6
Silver
China imports t 83.7 76.3 117.7 217.0 331.9 230.2 219.5 97.0 182.8
Domestic production t 918.0 918.0 918.0 918.0 918.0 918.0 891.9 848.3 naSources: ABS, CEIC, WMS
12. SilverFigures 90–93
Please refer to page 33 of The Westpac-DIIS China Resources Quarterly PDF version.
Table 14: Silver prices (USD/oz unless specified otherwise)LBMA spot prices Jun-14 Sep-14 Dec-14
Mar-15 Jun-15 Sep-15 Dec-15 Mar-16 Jun-16 Sep-16
Quarter average 19.7 19.7 16.5 16.7 16.5 14.9 14.8 14.9 16.8 19.6Quarter end 18.8 19.5 16.5 16.6 16.8 14.6 13.9 15.4 18.7 19.2Quarter high 21.1 21.4 17.5 18.3 17.7 15.2 16.1 15.9 18.7 20.6Quarter low 18.8 17.0 15.3 15.5 15.7 14.4 13.7 13.8 14.9 18.6Shanghai avg RMB/g 4.1 4.2 3.6 3.6 3.5 3.3 3.3 3.3 3.6 4.3Shanghai avg USD/g 0.7 0.7 0.6 0.6 0.6 0.5 0.5 0.5 0.6 0.6
Sources: LBMA, Bloomberg

13. Copper• The average LME copper price increased 0.9%qtr in Q3 to US$4772 a tonne, while the SHFE copper price increased 3.0%qtr to RMB 37,403 a tonne.
• While prices remain historically low, LME and SHFE prices appear to be firming after a lengthy downward trend spanning five years.
• China’s refined copper consumption was 6.7 Mt in the first seven months of 2016, up 8.4%yoy, supported by China’s growing construction sector.
• China’s refined copper production increased 6.3%qtr to 2.2 Mt in Q3. The increase is due to ample supply of concentrate and ores from Chinese-owned mines and imports from other countries.
• China’s total imports of copper ore and concentrate increased 4.5%qtr in Q3 to 4.2 Mt, reflecting increased capacity in China’s refining sector. China’s spot copper-treatment and refining charges are expected to rise due to the increasing supply of concentrate.
• Australia’s copper export volumes (metal content) to China decreased 15%qtr to 107kt in Q3. Earnings from copper exports to China decreased by 14%qtr to A$712 million in Q3.
Figures 94–96
Please refer to page 34 of The Westpac-DIIS China Resources Quarterly PDF version.
Table 15: Copper prices (USD/t unless specified otherwise)
LME spot prices Jun-14 Sep-14Dec-
14 Mar-15 Jun-15 Sep-15 Dec-15 Mar-16 Jun-16 Sep-16
Quarter average 6787 6994 6624 5818 6043 5259 4892 4672 4729 4772
Quarter end 6955 6736 6359 6051 5721 5093 4702 4856 4827 4832
Quarter high 7035 7184 6860 6309 6448 5762 5344 5103 5045 4956
Quarter low 6600 6736 6306 5391 5646 4888 4516 4311 4504 45733 Month forward 6757 6976 6568 5790 6046 5261 4885 4665 4722 4789Shanghai avg RMB/t 49328 50273 47525 42391 44074 39913 36954 36165 36311 37403Shanghai avg USD/t 7915 8156 7729 6799 7104 6335 5779 5532 5557 5611
Sources: LME, Bloomberg
Figures 97–101
Please refer to page 35 of The Westpac-DIIS China Resources Quarterly PDF version.

Table 16: Copper summary data Jun-14 Sep-14 Dec-14 Mar-15 Jun-15 Sep-15 Dec-15 Mar-16 Jun-16 Sep-16
China
total imports kt 1699 1725 1935 1729 1774 1886 2324 2320 2192 1342Austra
lia kt 144 140 152 116 142 123 174 134 105 99
Chile kt 538 438 629 569 558 580 717 702 736 392
Peru kt 182 196 205 172 192 267 300 346 349 272
other 834 950 949 872 883 916 1133 1138 1002 580
refined production kt 1823 2027 2321 1834 1951 2009 2205 1987 2060 2190
total world stocks kt 696 700 767 1038 936 968 926 1027 840 na
stocks - weeks weeks 2 2 2 3 2 2 2 2 2 na
Australian exports to China kt 128 126 138 109 122 139 157 109 126 107
value AUDmn 881 902 1045 778 921 1002 1051 703 827 712Sources: Bloomberg, World Metal Statistics, ABS

14. Aluminium • In Q3, SHFE and LME aluminium spot prices averaged RMB 12,742 and US$1620 a tonne, up 3.3%qtr and 3.1%qtr respectively, in line with production cuts by China and Russia. Russian aluminium smelters responded to weak demand from the automotive sector, while Chinese smelters cut production in response to the government’s ‘supply-side reform’ policy. Cuts to global production contributed to a 10%qtr reduction in LME stocks in Q3, with end-of-month stocks reaching a multi-year low of 2155 kt in September 2016.
• China produced 8.1 Mt of aluminium in Q3, up 2%qtr, as stronger aluminium prices provided Chinese smelters with greater incentive to lift output.
• China’s exports of unwrought aluminium and aluminium products declined in Q3, falling 1%qtr to 1190 kt, as importing countries such as India and the US continued to impose anti-dumping measures against Chinese aluminium.
• China’s aluminium imports increased 56%qtr to 55.7 kt in Q3, driven by the recovery in the construction and automotive sectors.
• Australia’s aluminium exports to China decreased 38%qtr, to 4.3 kt in Q3, and export earnings decreased 37%qtr to $A10 million.
Figures 102–104
Please refer to page 37 of The Westpac-DIIS China Resources Quarterly PDF version.
Table 17: Aluminium and Alumina prices (USD/t unless specified otherwise)
LME spot prices Jun-14Sep-
14Dec-
14Mar-
15 Jun-15Sep-
15Dec-
15Mar-
16 Jun-16Sep-
16
Quarter average 1798 1987 1966 1800 1765 1591 1495 1516 1572 1620
Quarter end 1851 1935 1832 1789 1647 1562 1508 1492 1635 1659
Quarter high 1871 2114 2099 1872 1919 1693 1608 1622 1673 1691
Quarter low 1715 1838 1828 1742 1642 1486 1424 1453 1481 1546
3 Month forward 1836 2008 1974 1813 1787 1621 1509 1516 1582 1633
Shanghai avg RMB/t 13133 14069 13507 12849 12964 12000 10500 11024 12332 12742
Shanghai avg USD/t 2107 2282 2197 2060 2090 1904 1642 1686 1887 1911
Aus FOB alumina 318 323 355 342 337 292 233 221 253 234China Alumina RMB/t 2353 2435 2737 2630 2442 2272 1853 1721 1923 1853Sources: LME, Bloomberg.
Figures 105–109
Please refer to page 38 of The Westpac-DIIS China Resources Quarterly PDF version.

15. Alumina• The FOB Australia alumina price averaged US$234 a tonne in Q3, down 7%qtr, as increasing alumina production outpaced aluminium demand. The recent recovery in aluminium and alumina prices has encouraged refinery restarts in China leading to increased supply and downward pressure on prices.
• Alumina production in China increased 3%qtr to 15.3 Mt in Q3, driven by higher prices and stronger demand.
• China imported 491 kt of alumina in Q3, up 12%qtr in line with increased domestic aluminium production. Australia remained the principal source of China’s alumina imports, accounting for 55% of total imports.
Figures 110–114
Please refer to page 39 of The Westpac-DIIS China Resources Quarterly PDF version.
16. Bauxite• China produced 32.7 Mt of bauxite in the first seven months of 2016, unchanged from 2015.
• China imported 12.6 Mt of bauxite in Q3, up 7%qtr, as steady domestic production failed to meet additional demand from increased alumina production. Growth in China’s bauxite imports was largely attributable to increased imports from Malaysia (up 42%qtr) and Brazil (up 27%qtr) Despite being the principal source of China’s bauxite imports, Australia’s share of China’s total imports decreased from 47% in Q2 to 35% in Q3, at 4.4 Mt.
• Malaysia exported 1.3 Mt of bauxite to China in Q3, up 42%qtr, as the Malaysian government issued temporary export permits in an attempt to clear bauxite stockpiles from Kuantan’s port. However, the ban on bauxite mining announced in early 2016 is to be extended until the end of 2016.
• The ban on unprocessed mineral exports implemented by Indonesia in early 2014 remains in place, and is unlikely to be lifted before the end of 2016 due to growing opposition from domestic aluminium smelters and overseas investors.
• Guinea exported 2.8 Mt of bauxite to China in Q3, down 1%qtr.
• Australia’s bauxite exports to China increased 18%qtr in Q3 because of increased alumina production. Australia’s earnings from bauxite exports also increased in Q3, up 12%qtr to $A259 million.
Figures 115–118
Please refer to page 40 of The Westpac-DIIS China Resources Quarterly PDF version.

Table 18: Aluminium, alumina and bauxite summary data Jun-14 Sep-14 Dec-14 Mar-15 Jun-15 Sep-15 Dec-15 Mar-16 Jun-16 Sep-16
China imports kt 96.1 51.5 30.5 34.4 45.9 70.0 73.4 26.3 35.7 55.7Austr
alia kt 18.9 7.0 5.6 7.7 2.7 12.7 15.3 5.7 2.9 5.5
India kt 0.7 0.8 1.6 6.6 2.0 0.0 0.8 0.1 3.2 5.0
Russia kt 24.2 16.9 2.1 1.5 4.3 4.5 0.7 0.3 1.6 2.7
other kt 52.3 26.8 21.2 18.6 36.8 52.9 56.8 20.3 28.0 42.5
refined production kt 5746.7 6045.5 6393.0 7205.4 8010.4 8184.6 7889.0 7170.0 7930.0 8123.0
total world stocks kt 7145.0 6737.5 6427.6 4809.4 4551.9 4149.4 3787.3 3652.8 3074.7 na
stocks - weeks 6.8 6.5 6.3 4.5 4.0 3.7 3.5 3.5 2.7 na
Australian exports to China kt 9.7 5.4 6.4 3.2 3.3 19.2 11.4 1.4 7.1 4.4
value AUDmn 21.1 13.7 18.2 9.1 9.0 47.4 27.0 3.2 16.0 10.1
Alumina
China imports kt 1280.7 1158.1 1353.9 933.1 879.8 1329.1 1511.5 1239.7 438.8 491.1
Australia kt 654.9 523.0 790.7 455.4 554.5 869.0 986.9 703.4 353.8 272.0
Production Mt 11.5 11.7 12.6 13.3 14.2 14.3 14.5 na na na
Bauxite
China imports Mt 6.6 8.4 8.4 10.1 12.6 16.5 17.0 13.6 11.8 12.6
Australia Mt 3.7 4.7 4.2 4.9 4.5 5.6 4.5 4.0 5.5 4.4
Malaysia Mt 0.2 1.1 2.0 2.5 5.5 8.0 8.2 4.5 0.9 1.3
Australian exports to China Mt 3.9 4.7 5.0 4.7 5.1 5.2 4.8 5.1 5.4 6.3
value AUDmn 140.9 181.7 227.5 234.7 256.9 267.7 250.7 219.2 231.8 259.1Sources: Bloomberg, World Metal Statistics, ABS.

17. Nickel• The LME nickel price averaged US$10,265 a tonne in Q3, up 16%qtr but down 3%yr, and reached a 12 month high of US$10,900 a tonne on 10 August 2016.
• LME stocks declined by 5%qtr and 20%yr to 362 kt in Q3, while SHFE stocks increased 12%qtr to 111 kt. China’s port stocks of nickel ore are estimated to have decreased by 2.1%yr to 5.7 Mt at the end of October
• Despite relatively high stocks, the nickel price has remained strong, supported by increased production of nickel-bearing stainless steel in China and concerns of a shortage of mined nickel due to the suspension of nickel mines in the Philippines following an audit of mining operations in July.
• While China’s imports of nickel ores and concentrates declined 20%yr in the first 8 months of 2016, imports of refined nickel increased 69%yr over the same period.
• China’s refined nickel production declined 13%yr in the first 8 months of 2016, while refined nickel consumption increased 13%yr.
• Australia’s nickel ores and concentrates exports to China declined 71%yr to 24 kt in Q3; as a result, the value nickel exports to China declined 74%yr to A$36 million
Figures 119–121
Please refer to page 42 of The Westpac-DIIS China Resources Quarterly PDF version.
Table 19: Nickel prices (USD/t unless specified otherwise)
LME spot prices Jun-14 Sep-14 Dec-14Mar-
15 Jun-15 Sep-15Dec-
15Mar-
16 Jun-16 Sep-16
Quarter average 18465 18576 15799 14338 13008 10561 9437 8499 8823 10265
Quarter end 18715 16505 14935 12460 11680 10070 8665 8280 9415 10460
Quarter high 21200 19795 16825 15455 14415 12060 10710 9375 9555 10900
Quarter low 15780 16505 14650 12460 11680 9305 8160 7710 8275 9535
3 Month forward 18512 18669 15877 14400 13055 10611 9481 8542 8867 10316Shanghai avg RMB/t
128595
128862
109421
106548 98129 80765 72228 67885 69123 79603
Shanghai avg USD/t 20634 20905 17792 17089 15817 12826 11296 10383 10577 11941Sources: Bloomberg, World Metal Statistics, International Nickel Study Group, CEIC.
Figures 122–126
Please refer to page 43 of The Westpac-DIIS China Resources Quarterly PDF version.

Table 20: Nickel summary data
China imports USDmn
Australia USDmn
Canada USDmn
Russia USDmn
Indonesia USDmn
Philippines USDmn
other USDmn
Refined production kt
LME stocks kt
stocks - weeks weeks
Australian ores and conc. exports kt
value AUDmnSource: Bloomberg, World Metal Statistics, International Nickel Study Group, CEIC, ABS.

18. Zinc• The LME zinc spot price averaged US$2255 a tonne in Q3, an increase of 18%qtr and 22%yr, supported by production cuts and mine closures in late 2015. Falling supply contributed to a 1%qtr decrease in LME stocks, which fell to 439 kt in Q3, and a 23%qtr decrease in SHFE stocks, which declined to 158 kt.
• Global demand for slab zinc exceeded production by 28 kt in the first eight months of 2016.
• China’s refined zinc production decreased 1%yoy to total 4.1 Mt for the first eight months of 2016, as reduced availability of zinc ore and concentrates weighed on production. The fall in production was particularly strong in Qinghai, where output decreased 75%yoy to just under 12 thousand tonnes, and in Hunan, where production decreased 57%yoy to 352 thousand tonnes.
• In the first eight months of 2016, China’s total zinc imports (refined and ores) decreased 24%yoy to 848 kt in line with weaker demand caused by higher zinc prices. Imports from Peru and Kazakhstan fell 51%yoy and 35%yoy to 134 and 77 kt respectively. Imports from Australia also declined, falling 7%yoy to 318 kt.
• Australia’s zinc exports to China (by metal content) decreased 65%yr to 69 kt in Q3, reflecting domestic supply constraints; export earnings fell 56%yr, to A$139 million.
Figures 127–129
Please refer to page 45 of The Westpac-DIIS China Resources Quarterly PDF version.
Table 21: Zinc prices (USD/t unless specified otherwise)
LME spot prices Jun-14 Sep-14 Dec-14 Mar-15 Jun-15 Sep-15 Dec-15Mar-
16 Jun-16 Sep-16
Quarter average 2073 2311 2235 2080 2190 1847 1613 1679 1918 2255
Quarter end 2205 2290 2167 2076 1994 1657 1600 1785 2103 2378
Quarter high 2205 2420 2335 2184 2405 2096 1835 1860 2103 2378
Quarter low 1962 2194 2114 1985 1994 1587 1462 1454 1743 20623 Month forward 2079 2314 2241 2092 2192 1855 1634 1683 1925 2258Shanghai avg RMB/t 15155 16542 16655 16127 16399 14840 13347 13560 15052 17414Shanghai avg USD/t 2432 2683 2709 2586 2643 2356 2087 2074 2303 2612
Sources: LME, Bloomberg
Figures 130–134
Please refer to page 46 of The Westpac-DIIS China Resources Quarterly PDF version.

Table 22: Zinc summary data
China imports ktA
ustralia kt
Kazakhstan kt
Peru kt
Turkey kt
other kt
refined production kt
total world stocks kt
stocks - weeks weeks
Australian exports to China ktv
alue AUDmn
Source: Bloomberg, World Metal Statistics, International Lead and Zinc Study Group, ABS.

19. LeadFigures 135–138
Please refer to page 48 of The Westpac-DIIS China Resources Quarterly PDF version.
Table 23: Lead prices (USD/t unless specified otherwise)
LME spot prices Jun-14 Sep-14 Dec-14 Mar-15 Jun-15 Sep-15 Dec-15Mar-
16 Jun-16 Sep-16
Quarter average 2096 2181 2000 1806 1942 1714 1681 1744 1719 1873
Quarter end 2129 2083 1853 1808 1754 1656 1802 1705 1780 2106
Quarter high 2160 2269 2095 1882 2140 1857 1817 1897 1796 2106
Quarter low 2016 2051 1814 1696 1742 1625 1555 1597 1646 17843 Month forward 2120 2194 2009 1817 1952 1725 1689 1745 1724 1881Shanghai avg RMB/t 13928 13922 14208 13427 13494 13336 13207 13593 13032 13773Shanghai avg USD/t 2282 2234 2305 2184 2175 2116 2065 2079 1994 2066
Sources: LME, Bloomberg
Table 24: Lead summary data
Jun-14Sep-
14Dec-
14Mar-
15 Jun-15Sep-
15Dec-
15Mar-
16Jun-
16Sep-
16
China imports kt 215 285 277 220 196 269 350 183 183 n.a.
kt 29 48 52 44 23 30 46 14 3 n.a.
kt 3 18 26 24 27 29 40 29 19 n.a.
kt 26 15 34 21 23 17 38 29 36 n.a.
kt 27 67 68 26 32 23 85 15 17 n.a.
kt 14 9 17 10 9 9 16 7 2 n.a.
kt 117 128 80 97 83 162 125 89 106 n.a.refined production kt 1057 1289 1333 1048 1017 949 975 913 1135 n.a.total world stocks kt 562 541 577 560 546 468 449 473 436 n.a.
stocks - weeks weeks 3 3 3 3 3 2 2 2 2 n.a.Australian exports to China kt 108.9 90.5 97.1 52.6 51.6 52.8 75.9 9.0 0.0 0.2
AUDmn 105.4 97.5 123.2 72.1 75.0 77.1 114.1 15.6 0.1 0.4Source: Bloomberg, World Metal Statistics, International Lead and Zinc Study Group, ABS.
20. TinFigures 139–144
Please refer to page 50 of The Westpac-DIIS China Resources Quarterly PDF version.

21. MolybdenumFigures 145–150
Please refer to page 51 of The Westpac-DIIS China Resources Quarterly PDF version.
22. TungstenFigures 151–156
Please refer to page 52 of The Westpac-DIIS China Resources Quarterly PDF version.
23. CobaltFigures 157–162
Please refer to page 53 of The Westpac-DIIS China Resources Quarterly PDF version.
24. AntimonyFigures 163–168
Please refer to page 54 of The Westpac-DIIS China Resources Quarterly PDF version.
25. Platinum & PalladiumFigures 169–174
Please refer to page 55 of The Westpac-DIIS China Resources Quarterly PDF version.
26. Mineral SandsFigures 175–180
Please refer to page 56 of The Westpac-DIIS China Resources Quarterly PDF version
.
27. China’s exports of rare earth oxidesFigures 181–186
Please refer to page 57 of The Westpac-DIIS China Resources Quarterly PDF version.

28. Magnesium & CadmiumFigures 187–192
Please refer to page 58 of The Westpac-DIIS China Resources Quarterly PDF version.
29. Diamonds and MagnesiumFigures 193–198
Please refer to page 59 of The Westpac-DIIS China Resources Quarterly PDF version.

Table 25: China mineral and energy import summaryChina's imports unit Jun-14 Sep-14 Dec-14 Mar-15 Jun-15 Sep-15 Dec-15 Mar-16
Iron ore Mt 235.3 242.1 233.6 227.1 226.0 246.3 253.9 241.6
Australia Mt 138.2 149.4 142.7 144.4 146.8 158.5 157.9 150.1
share % 59 62 61 64 65 64 62 62
Thermal coal Mt 58.10 49.65 50.35 38.13 40.08 41.74 36.19 37.02
Australia Mt 12.87 11.77 10.36 10.34 9.04 7.36 6.58 7.29
share % 22.1 23.7 20.6 27.1 22.6 17.6 18.2 19.7Metallurgical coal Mt 18.1 13.4 18.0 10.9 10.7 14.8 11.6 11.4
Australia Mt 8.6 5.9 10.3 5.3 5.5 8.7 6.1 6.0
share % 47.3 43.7 57.4 48.9 51.4 59.2 52.7 52.5
Aluminium kt 96.1 51.5 30.5 34.4 45.9 70.0 73.4 26.3
Australia kt 18.9 7.0 5.6 7.7 2.7 12.7 15.3 5.7
share % 20 14 18 22 6 18 21 22
Alumina kt 1280.7 1158.1 1353.9 933.1 879.8 1329.1 1511.5 1239.7
Australia kt 654.9 523.0 790.7 455.4 554.5 869.0 986.9 703.4
share % 51 45 58 49 63 65 65 57
Bauxite Mt 6.6 8.4 8.4 10.1 12.6 16.5 17.0 13.6
Australia Mt 3.7 4.7 4.2 4.9 4.5 5.6 4.5 4.0
Share % 55 55 50 49 36 34 26 29
Copper kt 1699 1725 1935 1729 1774 1886 2324 2320
Australia kt 128 126 138 109 122 139 157 110
share % 8 7 7 6 7 7 7 5
Oil Mt 77.2 76.5 79.9 80.3 83.0 85.3 86.9 91.1
Australia Mt 0.7 0.7 0.5 0.6 0.6 0.5 0.7 0.7
share % 0.9 1.0 0.7 0.7 0.7 0.6 0.8 0.8
Gas (LNG) kt 4297 4811 5154 5127 4392 4627 5522 6010
Australia kt 905 1162 902 1094 1286 1672 1500 2024
share % 21 24 18 21 29 36 27 34
Zinc kt 347.2 353.0 370.3 391.0 410.3 506.1 607.9 448.9
Australia kt 119.5 111.4 125.1 112.1 131.7 147.5 278.7 184.1
share % 34 32 34 29 32 29 46 41
NickelUS$mn 1625.1 2314.1 1251.1 904.2 1918.1 1951.5 1510.2 1200.8
AustraliaUS$mn 112.4 98.8 71.5 82.8 87.5 97.4 48.2 70.8
share % 7 4 6 9 5 5 3 6
Lead kt 214.80 284.80 277.00 220.30 196.20 269.20 349.50 183.20
Australia kt 29.20 47.80 52.00 44.00 22.90 29.80 45.80 14.00
share % 14 17 19 20 12 11 13 8
Tin kt 21.30 24.54 27.45 17.07 31.18 32.40 31.95 26.22
Australia kt 0.0 0.00 0.00 0.00 0.00 0.00 0.00 0.00
share % 0.0 0.0 0.0 0.0 0.0 0.0 0.0 0.0
Uranium t 6801.39 4985.15 9280.69 2041.31 5659.27 7504.60 7439.16 327.75Sources: CEIC, Bloomberg.

30. China maps(Figures 199–210)
Please refer to pages 62–67 of The Westpac-DIIS China Resources Quarterly PDF version.
© Copyright 2016 Westpac Bank Corporation
31. Terms and conditions.1. WIBIQ is a service provided by Westpac Institutional Bank (Westpac Banking Corporation ABN 33 007 457 141 AFSL and ACL 233714) here referred to as “Westpac”. 2. Your access to this service is subject to these terms and conditions, the Westpac Privacy Statement, notices, disclaimers and any other statements contained on this website. 3. You agree that any view or opinions expressed in the articles or podcasts contained in WIB IQ are the author’s own and may not necessarily reflect the view or opinions of Westpac. 4. You agree that any commentary contained in WIBIQ is not intended as personal advice and should not be relied upon as such by you. 5. WIB IQ may contain information in relation to certain financial products. Westpac makes no recommendation to buy, hold or sell these financial products, nor does it make any representations or warranties regarding the financial products. You should make your own decision in relation to the financial products based on your own enquiries, the information contained in the relevant disclosure documents, and the suitability of the relevant financial products to your own investment objectives, financial situation and particular needs.
Westpac disclaimerThings you should know: Each time someone visits our site, data is captured so that we can accurately evaluate the quality of our content and make improvements for you. We may at times use technology to capture data about you to help us to better understand you and your needs, including potentially for the purposes of assessing your individual reading habits and interests to allow us to provide suggestions regarding other reading material which may be suitable for you.
If you are located in Australia, this material and access to this website is provided to you solely for your own as a client of Westpac Institutional Bank being a division of Westpac Banking Corporation ABN 33 007 457 141 AFSL 233714 (‘Westpac’). If you are located outside of Australia, this material and access to this website is provided to you as outlined below.
This material and this website contain general commentary only and does not constitute personal advice. Certain types oftransactions, including those involving futures, options and high yield securities give rise to substantial risk and are not suitable for all investors. We recommend that you seek your own independent legal or financial advice before proceeding with any investment decision. This information has been prepared without taking account of your objectives, financial situation or needs. This material and this website may contain material provided by third parties. While such material is published with the necessary permission none of Westpac or its related entities accepts any responsibility for the accuracy or completeness of any such material. Although we have made every effort to ensure the information is free from error, none of Westpac or its related entities warrants the accuracy, adequacy or completeness of the information, or otherwise endorses it in any way. Except where contrary to law, Westpac and its related entities intend by this notice to exclude liability for the information. The information is subject to change without notice and none of Westpac or its related entities is under any obligation to update the information or correct any inaccuracy which may become apparent at a later date. The information contained in this material and this website does not constitute an offer, a solicitation of an offer, or an inducement to subscribe for, purchase or sell any financial instrument or to enter a legally binding contract. Past performance is not a reliable indicator of future performance. The forecasts given in this material and this website are predictive in character. Whilst every effort has been taken to ensure that the assumptions on which the forecasts are based are reasonable, the forecasts may be affected by incorrect

assumptions or by known or unknown risks and uncertainties. The ultimate outcomes may differ substantially from these forecasts.
Additional information if you are located outside of AustraliaNew Zealand: The current disclosure statement for the New Zealand division of Westpac Banking Corporation ABN 33 007 457 141 or Westpac New Zealand Limited can be obtained at the internet address www.westpac.co.nz. Westpac Institutional Bank products and services are provided by either Westpac Banking Corporation ABN 33 007 457 141 incorporated in Australia (New Zealand division) or Westpac New Zealand Limited. For further information please refer to the Product Disclosure Statement (available from your Relationship Manager) for any product for which a Product Disclosure Statement is required, or applicable customer agreement. Download the Westpac NZ QFE Group Financial Advisers Act 2008 Disclosure Statement at www.westpac.co.nz.
China, Hong Kong, Singapore and India: This material has been prepared and issued for distribution in Singapore toinstitutional investors, accredited investors and expert investors (as defined in the applicable Singapore laws and regulations) only. Recipients in Singapore of this material should contact Westpac Singapore Branch in respect of any matters arising from, or in connection with, this material. Westpac Singapore Branch holds a wholesale banking licence and is subject to supervision by the Monetary Authority of Singapore. Westpac Hong Kong Branch holds a banking license and is subject to supervision by the Hong Kong Monetary Authority. Westpac Hong Kong branch also holds a license issued by the Hong Kong Securities and Futures Commission (SFC) for Type 1 and Type 4 regulated activities. This material is intended only to “professional investors” as defined in the Securities and Futures Ordinance and any rules made under that Ordinance. Westpac Shanghai and Beijing Branches hold banking licenses and are subject to supervision by the China Banking Regulatory Commission (CBRC). Westpac Mumbai Branch holds a banking license from Reserve Bank of India (RBI) and subject to regulation and supervision by the RBI.
UK: The contents of this communication, which have been prepared by and are the sole responsibility of Westpac bankingCorporation London (“WBC”) and Westpac Europe Limited. WBC (a) has its principal place of business in the United Kingdom atCamomile Court, 23 Camomile Street, London EC3A 7LL, and is registered at Cardiff in the UK (as Branch No. BR00106), and (b) authorised and regulated by the Australian Prudential Regulation Authority in Australia. WBC is authorised in the United Kingdom by the Prudential Regulation Authority. WBC is subject to regulation by the Financial Conduct Authority and limited regulation by the Prudential Regulation Authority. Details about the extent of our regulation by the Prudential Regulation Authority are available from us on request. Westpac Europe Limited is a company registered in England (number 05660023) and is authorised by the Prudential Regulation Authority and regulated by the Financial Conduct Authority and the Prudential Regulation Authority.
This communication is being made only to and is directed at (a) persons who have professional experience in matters relatingto investments who fall within Article 19(5) of the Financial Services and Markets Act 2000 (Financial Promotion) Order 2005 (the “Order”) or (b) high net worth entities, and other persons to whom it may otherwise lawfully be communicated, falling within Article 49(2)(a) to (d) of the Order (all such persons together being referred to as “relevant persons”). Any person who is not a relevant person should not act or rely on this communication or any of its contents. The investments to which this communication relates are only available to and any invitation, offer or agreement to subscribe, purchase or otherwise acquire such investments will be engaged in only with, relevant persons. Any person who is not a relevant person should not act or rely upon this communication or any of its contents. In the same way, the information contained in this communication is intended for “eligible counterparties” and “professional clients” as defined by the rules of the Financial Conduct Authority and is not intended for “retail clients”. With this in mind, Westpac expressly prohibits you from passing on the information in this communication to any third party. In particular this communication and, in each case, any copies thereof may not be taken, transmitted or distributed, directly or indirectly into any restricted jurisdiction.

U.S.: Westpac operates in the United States of America as a federally licensed branch, regulated by the Office of the Comptroller of the Currency. Westpac is also registered with the US Commodity Futures Trading Commission (“CFTC”) as a Swap Dealer, but is neither registered as, or affiliated with, a Futures Commission Merchant registered with the US CFTC. Westpac Capital Markets, LLC (‘WCM’), a wholly–owned subsidiary of Westpac, is a broker–dealer registered under the U.S. Securities Exchange Act of 1934 (‘the Exchange Act’) and member of the Financial Industry Regulatory Authority (‘FINRA’). This communication is provided for distribution to U.S. institutional investors in reliance on the exemption from registration provided by Rule 15a–6 under the Exchange Act and is not subject to all of the independence and disclosure standards applicable to debt research reports prepared for retail investors in the United States. WCM is the U.S. distributor of this communication and accepts responsibility for the contents of this communication. All disclaimers set out with respect to Westpac apply equally to WCM. If you would like to speak to someone regarding any security mentioned herein, please contact WCM on +1 212 389 1269. All disclaimers set out with respect to Westpac apply equally to WCM.
Investing in any non–U.S. securities or related financial instruments mentioned in this communication may present certain risks.The securities of non–U.S. issuers may not be registered with, or be subject to the regulations of, the SEC in the United States.Information on such non–U.S. securities or related financial instruments may be limited. Non–U.S. companies may not subject to audit and reporting standards and regulatory requirements comparable to those in effect in the United States. The value of any investment or income from any securities or related derivative instruments denominated in a currency other than U.S. dollars is subject to exchange rate fluctuations that may have a positive or adverse effect on the value of or income from such securities or related derivative instruments.
The author of this communication is employed by Westpac and is not registered or qualified as a research analyst, representative, or associated person under the rules of FINRA, any other U.S. self–regulatory organisation, or the laws, rules or regulations of any State. Unless otherwise specifically stated, the views expressed herein are solely those of the author and may differ from the information, views or analysis expressed by Westpac and/or its affiliates.
For the purposes of Regulation AC only: Each analyst whose name appears in this report certifies that (1) the views expressed in this report accurately reflect the personal views of the analyst about any and all of the subject companies and their securities and (2) no part of the compensation of the analyst was, is, or will be, directly or indirectly related to the specific views or recommendations in this report.
For XYLO Foreign Exchange clients: This information is provided to you solely for your own use and is not to be distributedto any third parties. XYLO Foreign Exchange is a division of Westpac Banking Corporation ABN 33 007 457 141 and ACL 233714. Information is current as at date shown on the publication. This information has been prepared without taking account of yourobjectives, financial situation or needs. Because of this you should, before acting on this information, consider its appropriateness, having regard to your objectives, financial situation or needs. XYLO Foreign Exchange’s combined Financial Services Guide and Product Disclosure Statement can be obtained by calling XYLO Foreign Exchange on 1300 995 639, or by emailing [email protected].
The information may contain material provided directly by third parties, and while such material is published with permission,Westpac accepts no responsibility for the accuracy or completeness of any such material. Except where contrary to law, Westpac intends by this notice to exclude liability for the information. The information is subject to change without notice and Westpac is under no obligation to update the information or correct any inaccuracy which may become apparent at a later date. Past performance is not a reliable indicator of future performance. The forecasts given in this document are predictive in character. Whilst every effort has been taken to ensure that the assumptions on which the forecasts are based are reasonable, the forecasts may be affected by incorrect assumptions or by known or unknown risks and uncertainties. The ultimate outcomes may differ substantially from these forecasts.