oct. 24, 2012 agenda: 1 – bell ringer 2 – review hw 3 – cornell notes: heat curves 4 –...
TRANSCRIPT


Oct. 24, 2012
AGENDA:1 – Bell Ringer2 – Review HW3 – Cornell Notes:
Heat Curves4 – Practice Together5 – Individual
Practice
Today’s Goal:Students will be able to graph temperature changes during phase changes.Homework1. Finish Heat Curves
Practice2. Make up QUIZ 6 (from
Friday 10/19) by this Friday!

Wednesday, Oct. 24
Objective: Students will be able to graph temperature changes during phase changes.
Bell Ringer:Rank the three states of matter in order from lowest energy to highest energy.

4 MINUTES REMAINING…

Wednesday, Oct. 24
Objective: Students will be able to graph temperature changes during phase changes.
Bell Ringer:Rank the three states of matter in order from lowest energy to highest energy.

3 MINUTES REMAINING…

Wednesday, Oct. 24
Objective: Students will be able to graph temperature changes during phase changes.
Bell Ringer:Rank the three states of matter in order from lowest energy to highest energy.

2 MINUTES REMAINING…

Wednesday, Oct. 24
Objective: Students will be able to graph temperature changes during phase changes.
Bell Ringer:Rank the three states of matter in order from lowest energy to highest energy.

1minute Remaining…

Wednesday, Oct. 24
Objective: Students will be able to graph temperature changes during phase changes.
Bell Ringer:Rank the three states of matter in order from lowest energy to highest energy.

30 Seconds Remaining…
Wednesday, Oct. 24
Objective: Students will be able to graph temperature changes during phase changes.
Bell Ringer:Rank the three states of matter in order from lowest energy to highest energy.

BELL-RINGER TIME IS
UP!
Oct. 24, 2012
AGENDA:1 – Bell Ringer2 – Review HW3 – Cornell Notes:
Heat Curves4 – Practice Together5 – Individual
Practice
Today’s Goal:Students will be able to graph temperature changes during phase changes.Homework1. Finish Heat Curves
Practice2. Make up QUIZ 6 (from
Friday 10/19) by this Friday!

Wednesday, Oct. 24
Objective: Students will be able to graph temperature changes during phase changes.
Bell Ringer:Rank the three states of matter in order from lowest energy to highest energy.

Week 7
Weekly Agenda
Monday 10/22 – Chapter 3 Vocab.
Tuesday 10/23 – Review: Physical & Chemical Properties & Changes
Wednesday 10/24 – Heat Curve Diagrams
Thursday 10/25 – Phase Change Diagrams
Friday 10/26 – Review and QUIZ 7
Review HW: Section 3.1 & 3.2

CHAMPS
C – Conversation – No Talking – Take Notes
H – Help – RAISE HAND for questionsA – Activity – Heat CurvesM – Materials and Movement –
Pen/Pencil, Heat Curve Packet, Notes, Book
P – Participation – Complete your questions
S – Success – Be able to graph changes in temperature during phase changes.
Cornell Notes: Please take out your notebook and properly set up your
paper.Topic: Heat CurvesDate: 10/24/2012
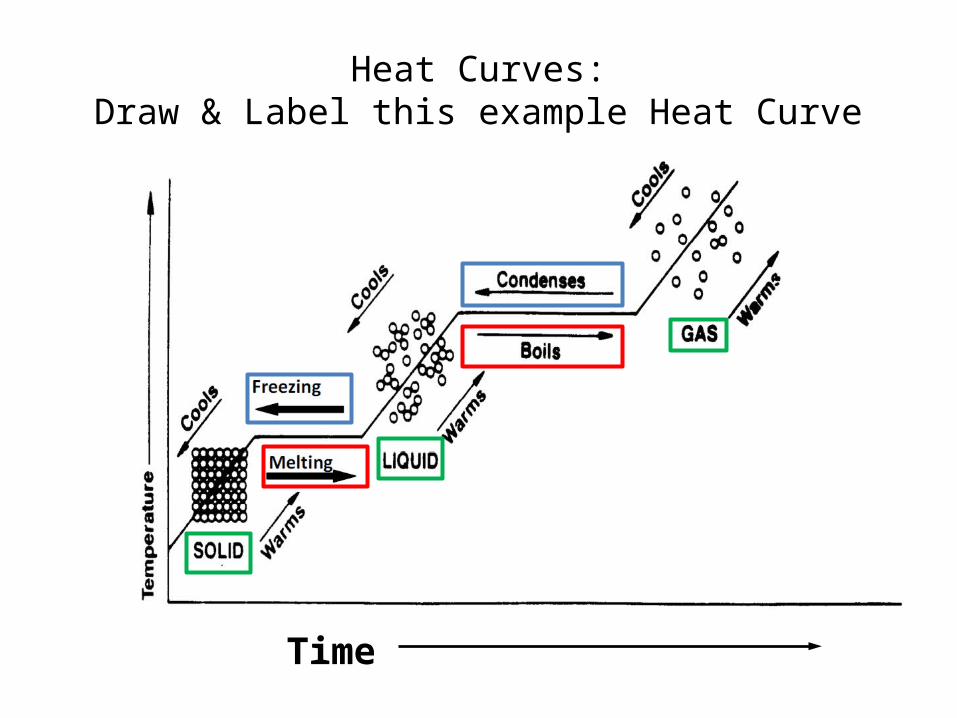
Heat Curves:Draw & Label this example Heat Curve
Time
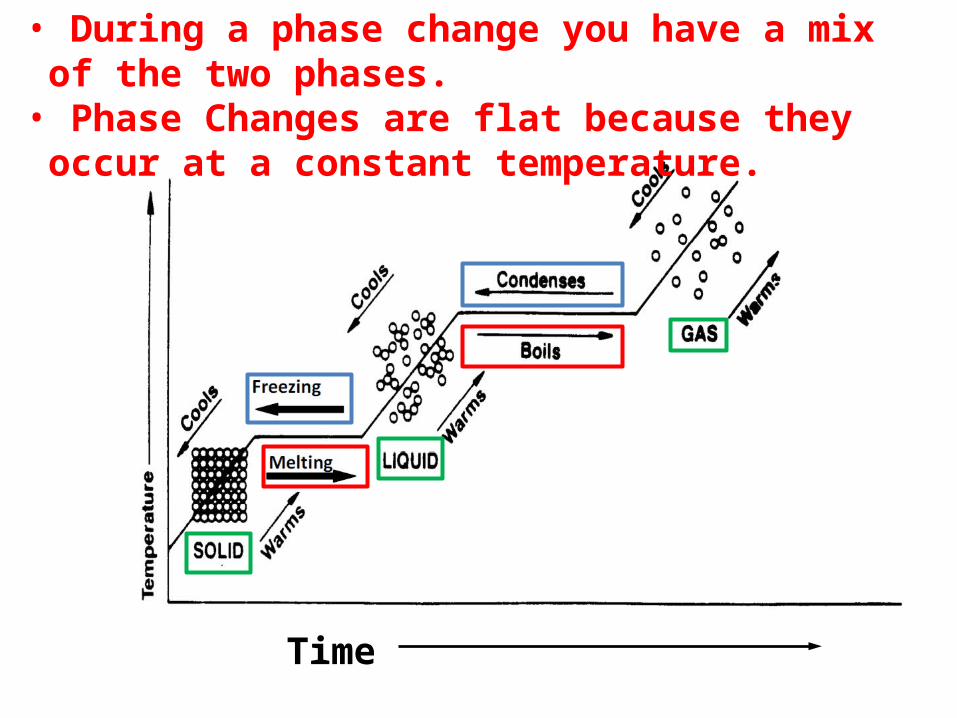
• During a phase change you have a mix of the two phases.• Phase Changes are flat because they occur at a constant temperature.
Time

• Kinetic Energy increases when Temperature increases.• Potential Energy increases during phase changes.
Time
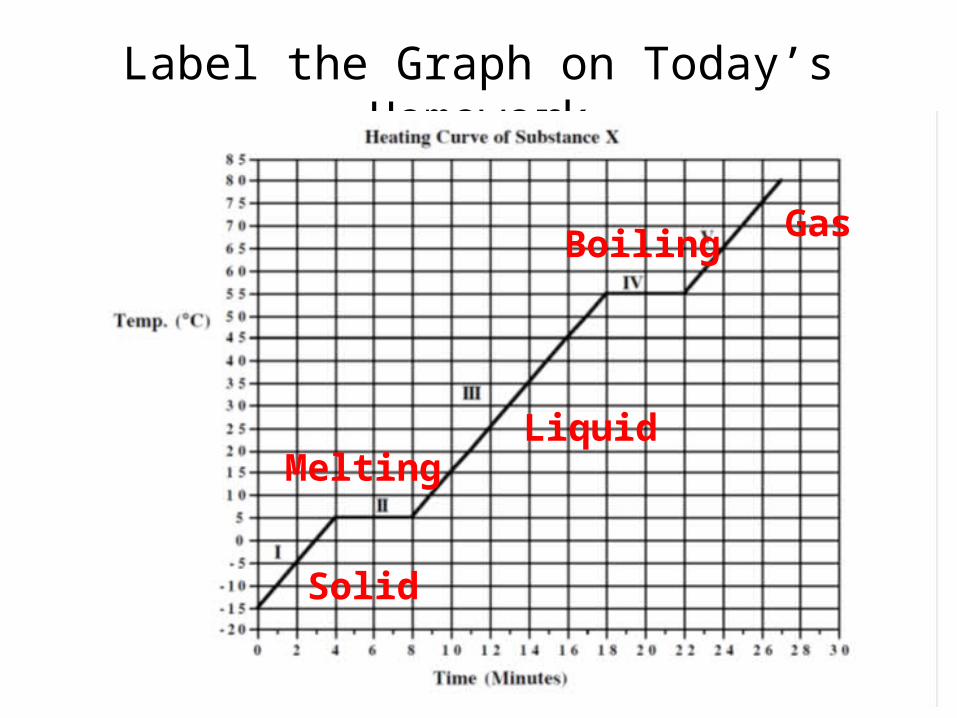
Label the Graph on Today’s Homework
Solid
Liquid
Gas
Melting
Boiling
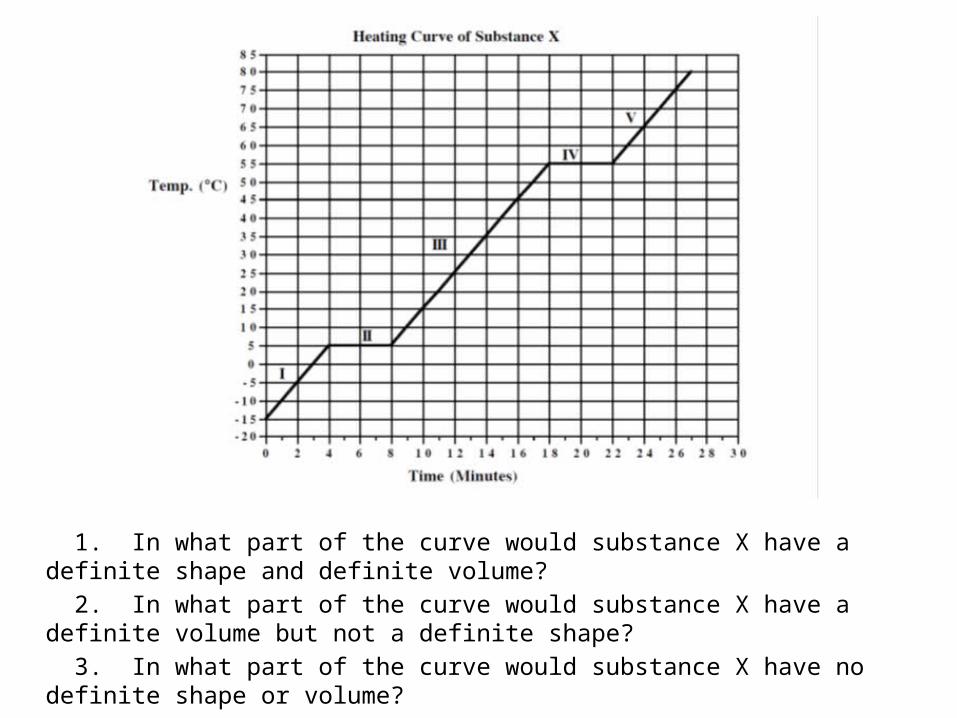
1. In what part of the curve would substance X have a definite shape and definite volume? 2. In what part of the curve would substance X have a definite volume but not a definite shape? 3. In what part of the curve would substance X have no definite shape or volume?

4. What part of the curve represents a mixed solid/liquid phase of substance X? 5. What part of the curve represents a mixed liquid/vapor phase of substance X? 6. What is the melting temperature (melting point) of substance X?
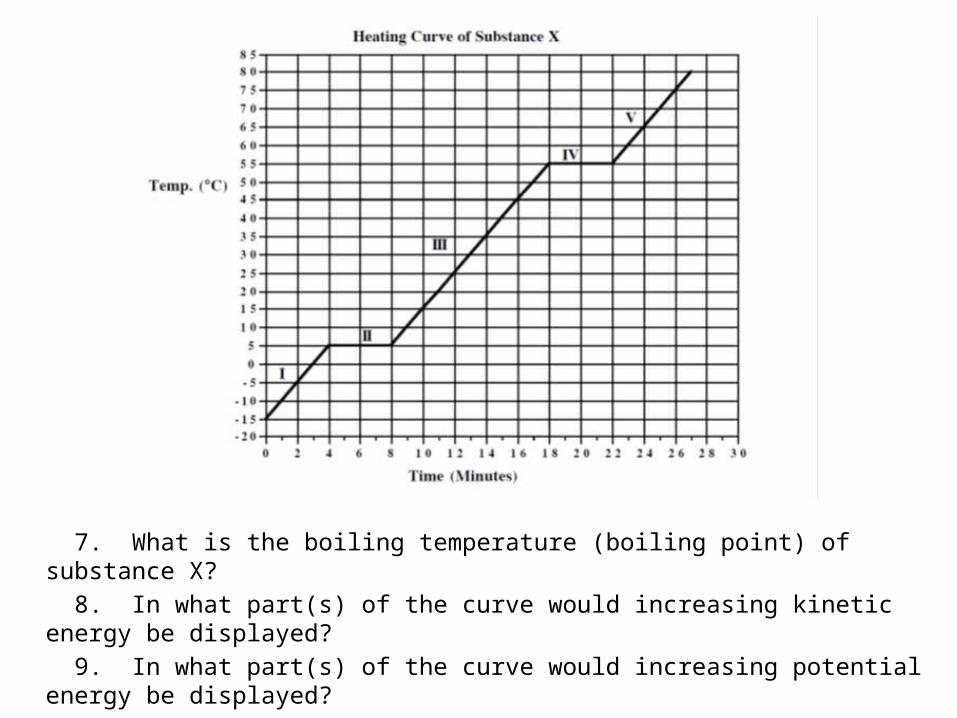
7. What is the boiling temperature (boiling point) of substance X? 8. In what part(s) of the curve would increasing kinetic energy be displayed? 9. In what part(s) of the curve would increasing potential energy be displayed?
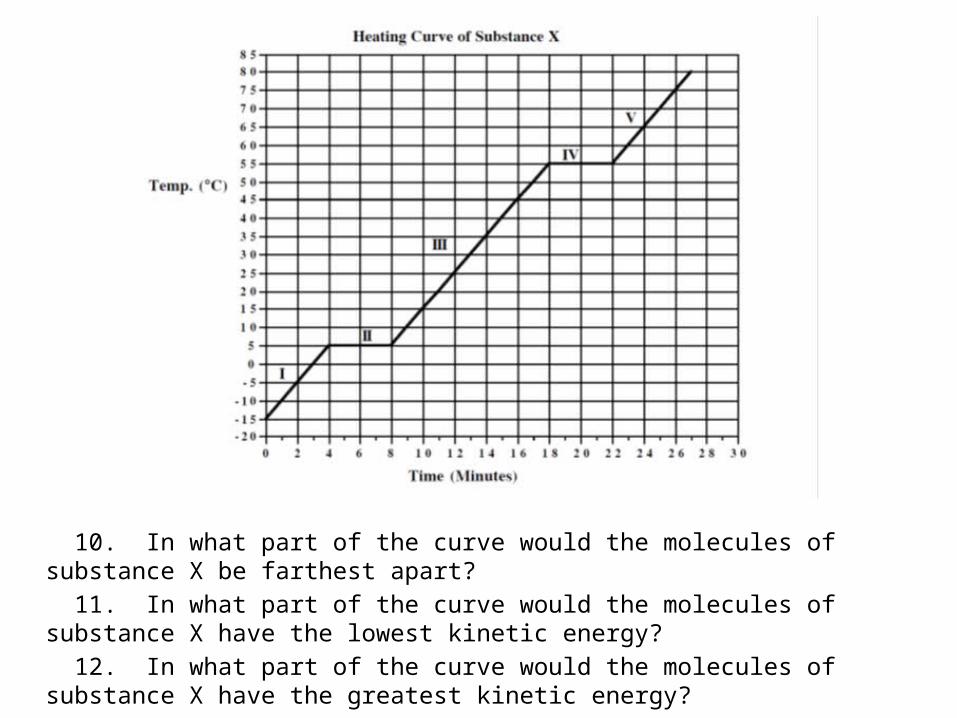
10. In what part of the curve would the molecules of substance X be farthest apart? 11. In what part of the curve would the molecules of substance X have the lowest kinetic energy? 12. In what part of the curve would the molecules of substance X have the greatest kinetic energy?