oct 557 nbs technical · nationalbureauofstandards washington,d.c.20234 s, ......
TRANSCRIPT
U.S.
IPARTMENTOF
COMMERCE
National
2* Bureau
00 of
J7i3 indards
«7970
National Bureau of Standards
Library, £41 Admin. Bldg. reKCfl JlflmJJtj JjjlJdiy.
OCT 3 1970
NBS TECHNICAL NOTE 557
The Brake Pedal Force
Capability of Adult Females

HONAL BUREAU Of STANDARDS
UNITED STATES DEPARTMENT OF COMMERCEMaurice H. Stans, Secretary
NATIONAL BUREAU OF STANDARDS • Lewis M. Branscomb, Director
NBS TECHNICAL NOTE 557ISSUED OCTOBER 1970
Nat. Bur. Stand. (U.S.), Tech. Note 557, 25 pages (Oct. 1970)
CODEN: NBTNA
The Brake Pedal Force
Capability of Adult Females
Richard W. Radlinski and James I. Price
Office of Vehicle Systems Research
Institute for Applied Technology
National Bureau of Standards
Washington, D.C. 20234
S,» or'
NBS Technical Notes are designed to supplement the
Bureau's regular publications program. They provide a
means for making available scientific data that are of
transient or limited interest. Technical Notes may be
listed or referred to in the open literature.
For sale by the Superintendent of Documents, U.S. Government Printing Office, Washington, D.C, 20402.
(Order by SD Catalog No. C 13.46:557). Price 35 cents

CONTENTS
Page
1. Introduction 1
2. Procedure 3
2.1 Apparatus and Instrumentation 3
2.2 Test Subjects 5
2. 3 Data Acquisition 6
3. Results of Test 7
4. Discussion of Results 9
4.1 Test Subject Sample 9
4.2 Motivational Considerations 9
4.3 Pedal Force Results 17
5. Conclusions 23
6„ References 23
II
THE BRAKE PEDAL FORCE
CAPABILITY OF ADULT FEMALES*
R. W. Radlinski and J. I. Price
ABSTRACT
A survey of the brake pedal force capability of
105 women employees at the National Bureau of Standards,Washington, D. C, was performed utilizing two station-ary passenger automobiles as test vehicles. Resultsshowed that over 50% of the test subjects could notachieve an average sustained brake pedal force of 200lb, a value which is considered an acceptable brakingsystem input force under certain conditions of thecurrent Federal Motor Vehicle Safety Standard (FMVSS
No. 105) for passenger vehicle braking system per-formance .
Key words: Automotive braking systems; brakes; brakepedal forces; Federal Motor Vehicle SafetyStandards; pedal effort; women, strength of
1- INTRODUCTION
Federal Motor Vehicle Safety Standard No. 105 [1] and SAE Recom-
mended Practice J937a, Service Brake System Performance Requirements -
Passenger Car [2], allow brake pedal forces up to 200 lb under certain
conditions. Since women in general are physically weaker than men,
their pedal force capabilities are an important factor in establishing
a maximum acceptable level for brake system input forces. There has
been considerable discussion recently in government and industry as to
*This work was carried out at the National Bureau of Standards under the
sponsorship of the Department of Transportation, National Highway Safety
Bureau. The opinions, findings and conclusions expressed are those of
the authors and not necessarily those of the National Highway Safety
Bureau.
1
POSITION I
—J4.5" 1— POSITION ?
REFERENCE POINT
DISTANCE FROM UNDEFLU'CTEUSEAT BACK, 1SCH1.S
SEAT 1
POSITION 1
OCATION
POSITION 7
A - Center of undeflected br.ike perfil
- Center of brake pedal with100 lb force
- Center of brake pedal with100 lb force and hydraulic failuresimulated
12
35
38
37
40
43
B - Floor behind brake pedal 41 46
C - Accelerator pedal 37 11
DIMENSIONS FOR VEHICLE V
rI -I
POSITION I—^ 5.0 '— POSITION II
REFERENCE POINT
DISTANCE FROM UNDEFLECTEDSEAT BACK, INCHES
SEAT L
POSITION 1
OCATION
POSITION 1
1
- 'enter of undeflected brake pedal
- Center >-f brake pedal with100 lb for.e
33
36
38
41
R - Floor behind br.ike ped.'il 41 46
<: - Ai.elerator ped.i] 36 41
D- Floor behind accelerator pedal 39 44
DIMENSIONS FOR VEHICLE "B"
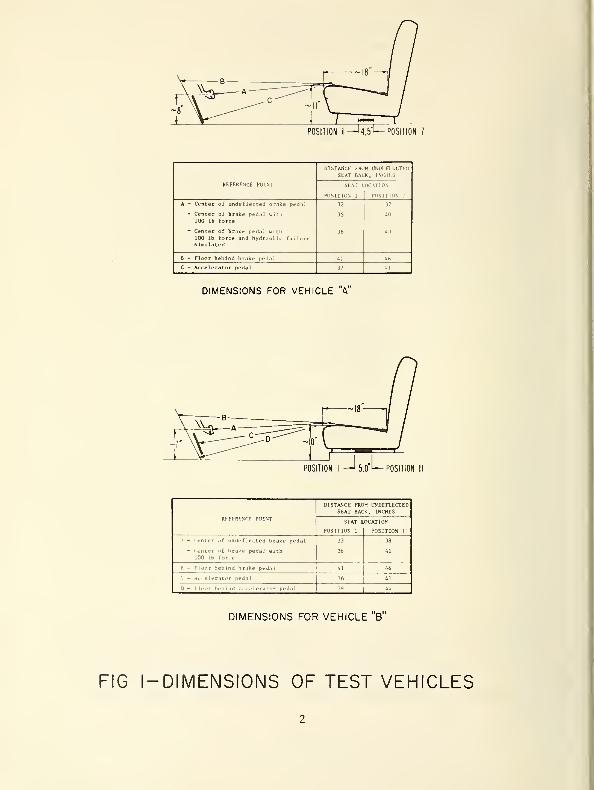
FIG l-DIMENSIONS OF TEST VEHICLES
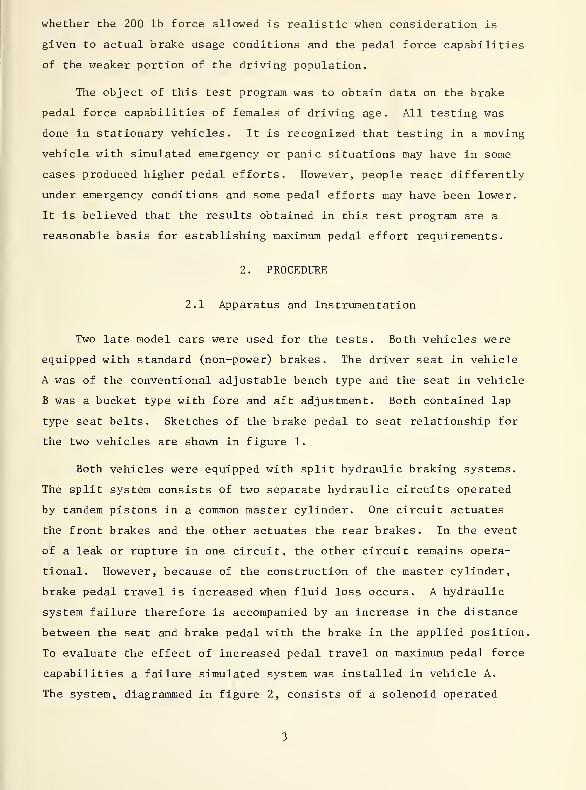
whether the 200 lb force allowed is realistic when consideration is
given to actual brake usage conditions and the pedal force capabilities
of the weaker portion of the driving population.
The object of this test program was to obtain data on the brake
pedal force capabilities of females of driving age. All testing was
done in stationary vehicles. It is recognized that testing in a moving
vehicle with simulated emergency or panic situations may have in some
cases produced higher pedal efforts. However, people react differently
under emergency conditions and some pedal efforts may have been lower.
It is believed that the results obtained in this test program are a
reasonable basis for establishing maximum pedal effort requirements.
2 . PROCEDURE
2.1 Apparatus and Instrumentation
Two late model cars were used for the tests. Both vehicles were
equipped with standard (non-power) brakes. The driver seat in vehicle
A was of the conventional adjustable bench type and the seat in vehicle
B was a bucket type with fore and aft adjustment. Both contained lap
type seat belts. Sketches of the brake pedal to seat relationship for
the two vehicles are shown in figure 1.
Both vehicles were equipped with split hydraulic braking systems.
The split system consists of two separate hydraulic circuits operated
by tandem pistons in a common master cylinder. One circuit actuates
the front brakes and the other actuates the rear brakes. In the event
of a leak or rupture in one circuit, the other circuit remains opera-
tional. However, because of the construction of the master cylinder,
brake pedal travel is increased when fluid loss occurs. A hydraulic
system failure therefore is accompanied by an increase in the distance
between the seat and brake pedal with the brake in the applied position.
To evaluate the effect of increased pedal travel on maximum pedal force
capabilities a failure simulated system was installed in vehicle A.
The system* diagrammed in figure 2, consists of a solenoid operated
LEFT FRONT
BRAKE
RIGHT FRONT
BRAKE
SOLENOID
VALVE1VALVE-_-_-— Hhi
—
RETURN LINE TO
MASTER CYLINDER
RESERVOIRi • 1
DUAL
MASTER CYLINDER
PRESSURE
TRANSDUCER
CONTROL SWITCH
(OPERATED BY
TEST PERSONNEL)
i
PRESSURE
TRANSDUCER
SIGNAL FROM
VEHICLE B
2-CHANNEL
RECORDER
LEFT REAR
BRAKE
RIGHT REAR
BRAKE
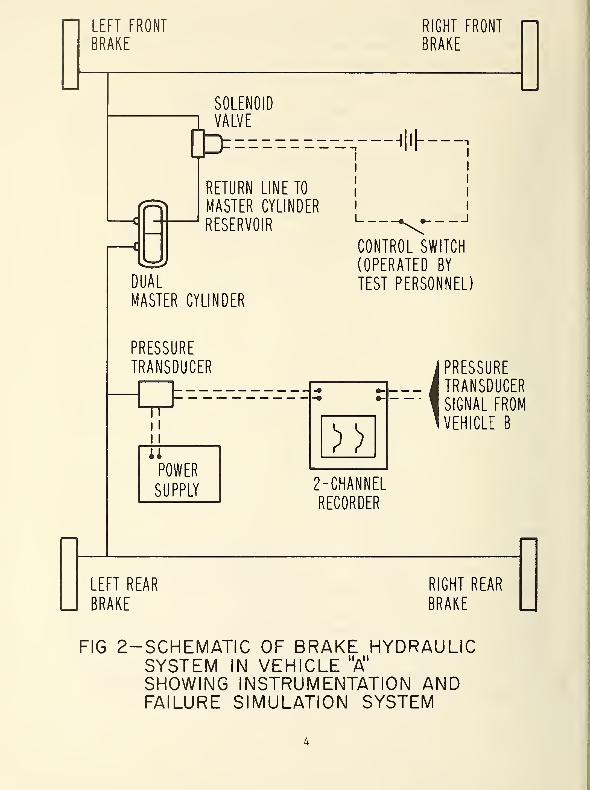
FIG 2-SCHEMATIC OF BRAKE HYDRAULICSYSTEM IN VEHICLE "A"
SHOWING INSTRUMENTATION ANDFAILURE SIMULATION SYSTEM
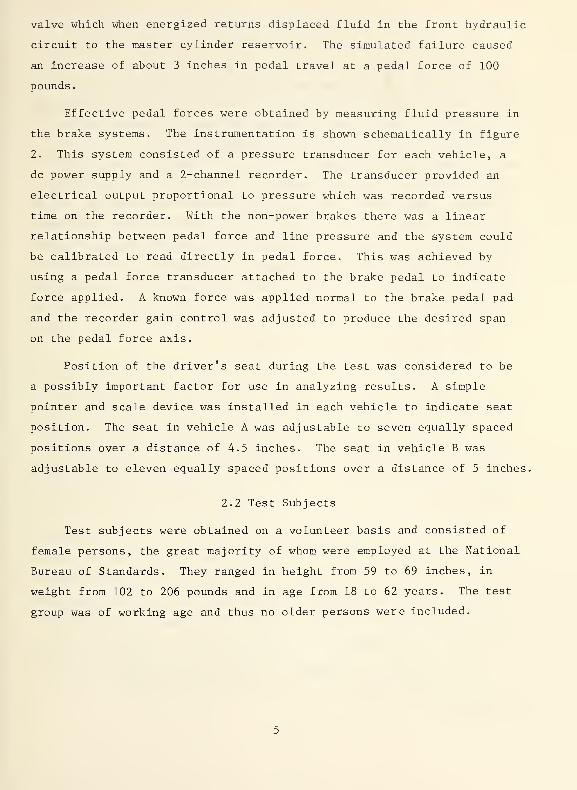
valve which when energized returns displaced fluid in the front hydraulic
circuit to the master cylinder reservoir. The simulated failure caused
an increase of about 3 inches in pedal travel at a pedal force of 100
pounds
.
Effective pedal forces were obtained by measuring fluid pressure in
the brake systems. The instrumentation is shown schematically in figure
2. This system consisted of a pressure transducer for each vehicle, a
dc power supply and a 2-channel recorder. The transducer provided an
electrical output proportional to pressure which was recorded versus
time on the recorder. With the non-power brakes there was a linear
relationship between pedal force and line pressure and the system could
be calibrated to read directly in pedal force. This was achieved by
using a pedal force transducer attached to the brake pedal to indicate
force applied. A known force was applied normal to the brake pedal pad
and the recorder gain control was adjusted to produce the desired span
on the pedal force axis.
Position of the driver's seat during the test was considered to be
a possibly important factor for use in analyzing results. A simple
pointer and scale device was installed in each vehicle to indicate seat
position. The seat in vehicle A was adjustable to seven equally spaced
positions over a distance of 4.5 inches. The seat in vehicle B was
adjustable to eleven equally spaced positions over a distance of 5 inches.
2.2 Test Subjects
Test subjects were obtained on a volunteer basis and consisted of
female persons, the great majority of whom were employed at the National
Bureau of Standards. They ranged in height from 59 to 69 inches, in
weight from 102 to 206 pounds and in age from 18 to 62 years. The test
group was of working age and thus no older persons were included.
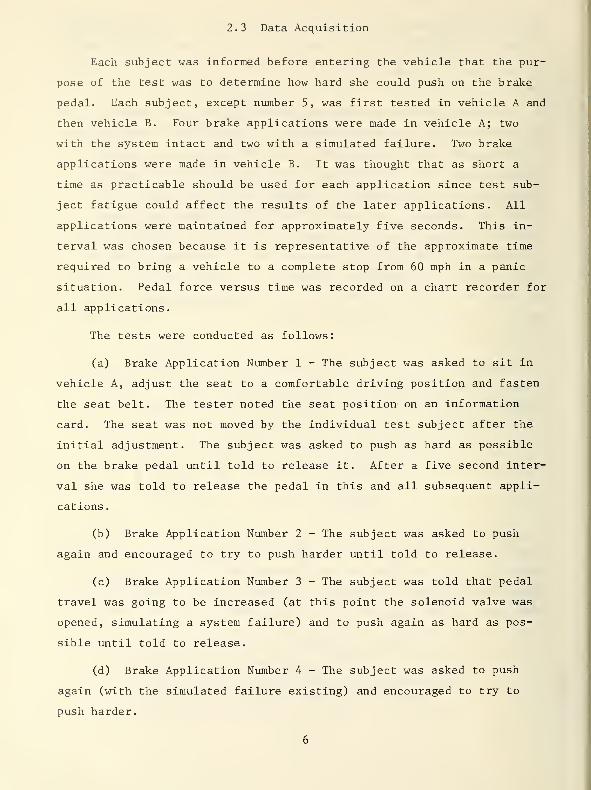
2.3 Data Acquisition
Each subject was informed before entering the vehicle that the pur-
pose of the test was to determine how hard she could push on the brake
pedal. Each subject, except number 5, was first tested in vehicle A and
then vehicle B. Four brake applications were made in vehicle A; two
with the system intact and two with a simulated failure. Two brake
applications were made in vehicle B. It was thought that as short a
time as practicable should be used for each application since test sub-
ject fatigue could affect the results of the later applications. All
applications were maintained for approximately five seconds. This in-
terval was chosen because it is representative of the approximate time
required to bring a vehicle to a complete stop from 60 mph in a panic
situation. Pedal force versus time was recorded on a chart recorder for
all applications.
The tests were conducted as follows:
(a) Brake Application Number 1 - The subject was asked to sit in
vehicle A, adjust the seat to a comfortable driving position and fasten
the seat belt. The tester noted the seat position on an information
card. The seat was not moved by the individual test subject after the
initial adjustment. The subject was asked to push as hard as possible
on the brake pedal until told to release it. After a five second inter-
val she was told to release the pedal in this and all subsequent appli-
cations.
(b) Brake Application Number 2 - The subject was asked to push
again and encouraged to try to push harder until told to release.
(c) Brake Application Number 3 - The subject was told that pedal
travel was going to be increased (at this point the solenoid valve was
opened, simulating a system failure) and to push again as hard as pos-
sible until told to release.
(d) Brake Application Number 4 - The subject was asked to push
again (with the simulated failure existing) and encouraged to try to
push harder.

(e) Brake Application Number 5 - The subject was asked to leave
vehicle A and sit in vehicle B. The instructions to adjust the seat to
a comfortable driving position and fasten the seat belt were repeated
and seat position was noted. The subject was asked to push as hard as
possible on the brake pedal until told to release.
(f) Brake Application Number 6 - The subject was asked to push
again and encouraged to try to push harder until told to release.
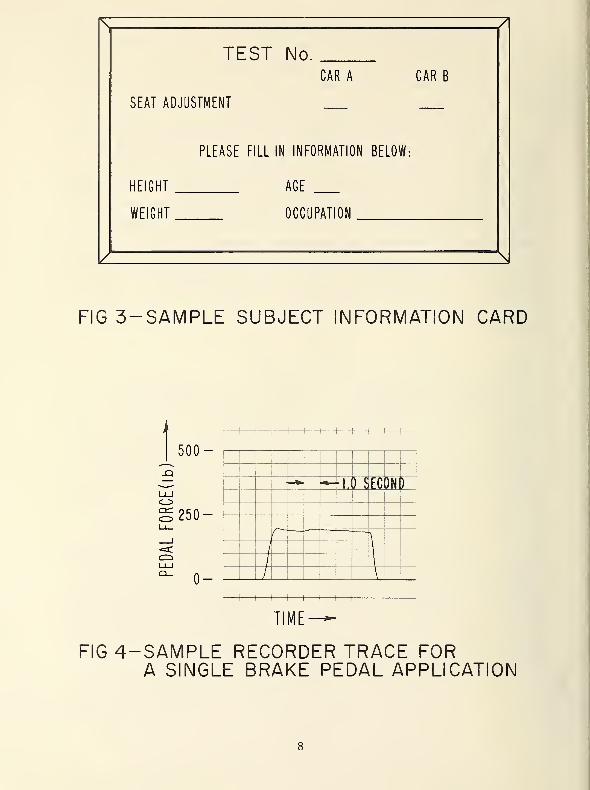
The subject was informed that the test was complete and requested
to fill out an information card giving height, weight, age and occupa-
tion. The subject dropped the card into a box and was not requested to
give her name or show the card to testing personnel. This was an attempt
to eliminate any hesitation on the part of the subject to provide this
information. Information cards were related to recorder charts by
assigning a test number to each subject. A sample information card is
shown in figure 3.
3. RESULTS OF TEST
A sample recorder trace for a single brake pedal application is
shown in figure 4. This sample is marked to clarify its meaning. For
each subject there are six traces of this type since six pedal applica-
tions were made. For each trace two pieces of data were tabulated for
analysis; the maximum pedal force reached during the application and the
average pedal force sustained for a five second interval. The average
sustained pedal force was obtained by a simple graphical integration
approximation. This consisted of positioning a straight line with a
length representing 5 seconds parallel to the time axis and intersecting
the pedal force trace so that the area between the line and trace above
the line is estimated to equal the area between the line and the trace
below the line. The point of intersection of the line and trace repre-
sents the average pedal force sustained for five seconds. Results of
applications 2, 4 and 6 are summarized in table 1 below.
TEST No.
CAR A CAR B
SEAT ADJUSTMENT
PLEASE FILL IN INFORMATION BELOW:
HEIGHT
WEIGHT
AGE
OCCUPATION
FIG 3-SAMPLE SUBJECT INFORMATION CARD
500-
cc:250 —
0-
i—h—^—i—i—i—i—i
—
h—i—i—i
—
1
>*—1. \ s EC )N )
(-
//
—i—i—i—i—i—i—i—i—i—i—i
—
IE
FIG 4-SAMPLE RECORDER TRACE FORA SINGLE BRAKE PEDAL APPLICATION

TABLE 1. AVERAGE SUSTAINED PEDAL FORCE FOR 5 SECONDS
FOR SELECTED PERCENTILES
Brake application number2 4 6
Vehicle A Vehicle A Vehicle B
Percentile normal pedal low pedal normal pedal
Pedal force, pounds
95 260 200 275
90 240 180 250
80 220 160 235
50 175 130 190
20 135 100 165
10 120 80 135
5 90 65 125
Data from the subject information cards is shown in table 2. Maxi-
mum and average pedal force data for each of the six pedal applications
are shown in table 3.
4. DISCUSSION OF RESULTS
4.1 Test Subject Sample
Frequency distributions (histograms) of height, weight and age of
test subjects are shown in figure 5. Comparison of this data to infor-
mation in Reference 1 of a random sampling of 58,343 women 18-79 years
of age indicates that the present sample of test subjects contained no
serious distortions.
4.2 Motivational Considerations
There are many factors which might affect the pedal force capabil-
ities of drivers in the stationary test situation as well as while driv-
ing when an emergency occurs. Some factors difficult to assess in a
test series are motivation and cooperation of the test subjects and

20 r MEAN: 64.5 in
MEDIAN; 64.0 m
MEAN-I32.7ib
MEDIAN 128.0 lb
60 61 62 63 64 65 66 67 68 69 70
SUBJECT HEIGHT(in)
TEST SUBJECT HEIGHT HISTOGRAM
90 100 110 120 130 140 150 ISO 170
SUBJECT WEIGHT(lb)180 190 200 210
TEST SUBJECT WEIGHT HISTOGRAM
20-
MEAN: 35.4 y ,s
MEDIAN: 35.0yrs
15 20 25 30 35 40 45 50 55 60 65
SUBJECT AGE(yr)
TEST SUBJECT AGE HISTOGRAM
FIG 5-TEST SUBJECT INFORMATION HISTOGRAMS
10
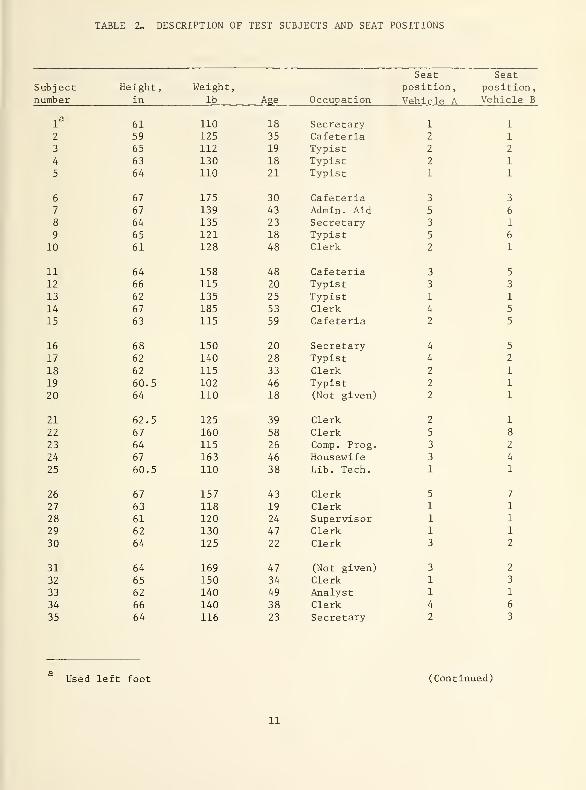
TABLE 2„ DESCRIPTION OF TEST SUBJECTS AND SEAT POSITIONS
Seat Seat
Subject Height, Weight
,
position
,
position,number in lb Age Occupation Vehicle A Vehicle B
la
61 110 18 Secretary 1 1
2 59 125 35 Cafeteria 2 1
3 65 112 19 Typist 2 2
4 63 130 18 Typist 2 1
5 64 110 21 Typist 1 1
6 67 175 30 Cafeteria 3 3
7 67 139 43 Admin. Aid 5 6
8 64 135 23 Secretary 3 1
9 65 121 18 Typist 5 6
10 61 128 48 Clerk 2 1
11 64 158 48 Cafeteria 3 5
12 66 115 20 Typist 3 3
13 62 135 25 Typist 1 1
14 67 185 53 Clerk 4 5
15 63 115 59 Cafeteria 2 5
16 68 150 20 Secretary 4 5
17 62 140 28 Typist 4 2
18 62 115 33 Clerk 2 1
19 60.5 102 46 Typist 2 1
20 64 110 18 (Not given) 2 1
21 62.5 125 39 Clerk 2 1
22 67 160 58 Clerk 5 8
23 64 115 26 Comp. Prog. 3 2
24 67 163 46 Housewife 3 4
25 60.5 110 38 Lib. Tech. 1 1
26 67 157 43 Clerk 5 7
27 63 118 19 Clerk 1 1
28 61 120 24 Supervisor 1 1
29 62 130 47 Clerk 1 1
30 64 125 22 Clerk 3 2
31 64 169 47 (Not given) 3 2
32 65 150 34 Clerk 1 3
33 62 140 49 Analyst 1 1
34 66 140 38 Clerk 4 6
35 64 116 23 Secretary 2 3
Used left foot (Continued)
11
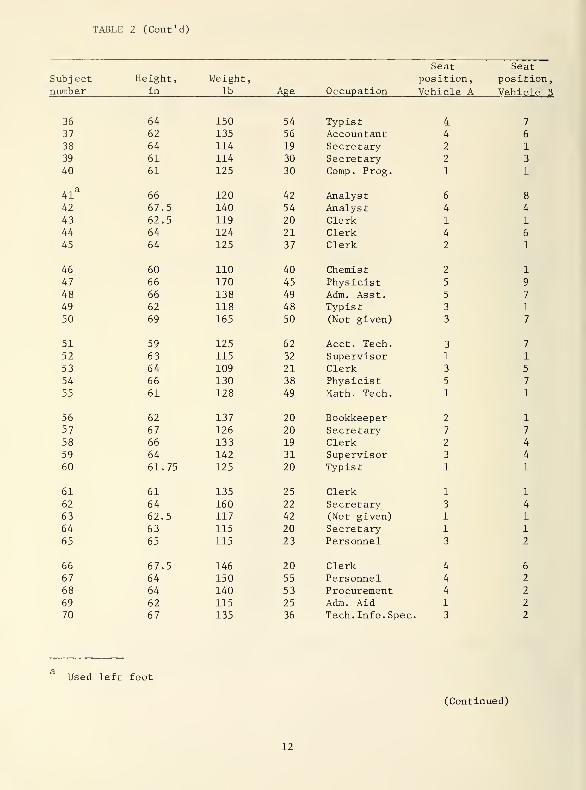
TABLE 2 (Cont'd)
Seat SeatSubject Height, Weight, position, position,number in lb Age Occupation Vehicle A Vehicle B
36 64 150 54 Typist -4. 7
37 62 135 56 Accountant 4 6
38 64 114 19 Secretary 2 1
39 61 114 30 Secretary 2 3
40 61 125 30 Comp . Prog. 1 1
41a
66 120 42 Analyst 6 8
42 67.5 140 54 Analyst 4 4
43 62.5 119 20 Clerk 1 1
44 64 124 21 Clerk 4 6
45 64 125 37 Clerk 2 1
46 60 110 40 Chemist 2 1
47 66 170 45 Physicist 5 9
48 66 138 49 Adm . As s t
.
5 7
49 62 118 48 Typist 3 1
50 69 165 50 (Not given) 3 7
51 59 125 62 Acct. Tech. 3 7
52 63 115 32 Supervisor 1 1
53 64 109 21 Clerk 3 5
54 66 130 38 Physicist 5 7
55 61 128 49 Math. Tech. 1 1
56 62 137 20 Bookkeeper 2 1
57 67 126 20 Secretary 7 7
58 66 133 19 Clerk 2 4
59 64 142 31 Supervisor 3 4
60 61.75 125 20 Typist 1 1
61 61 135 25 Clerk 1 1
62 64 160 22 Secretary 3 4
63 62.5 117 42 (Not given) 1 1
64 63 115 20 Secretary 1 1
65 65 115 23 Personnel 3 2
66 67.5 146 20 Clerk 4 6
67 64 150 55 Personnel 4 2
68 64 140 53 Procurement 4 2
69 62 115 25 Adm. Aid 1 2
70 67 135 36 Tech. Info. Spec 3 2
Used left foot
(Continued)
12
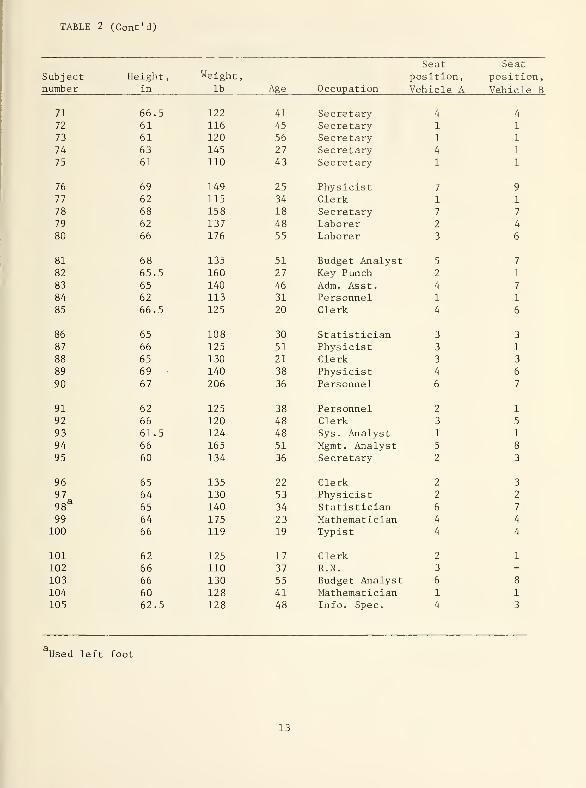
TABLE 2 (Cont'd)
Seat Seat
Subject Height, Weight, position, position,number in lb Age Occupation Vehicle A Vehicle B
71 66.5 122 41 Secretary 4 4
72 61 116 45 Secretary 1 1
73 61 120 56 Secretary 1 1
74 63 145 27 Secretary 4 1
75 61 110 43 Secretary 1 1
76 69 149 25 Physicist 7 9
77 62 115 34 Clerk 1 1
78 68 158 18 Secretary 7 7
79 62 137 48 Laborer 2 4
80 66 176 55 Laborer 3 6
81 68 135 51 Budget Analyst 5 7
82 65.5 160 27 Key Punch 2 1
83 65 140 46 Adm. Asst. 4 7
84 62 113 31 Personnel 1 1
85 66.5 125 20 Clerk 4 6
86 65 108 30 Statistician 3 3
87 66 125 51 Physicist 3 1
88 65 130 21 Clerk 3 3
89 69 140 38 Physicist 4 6
90 67 206 36 Personnel 6 7
91 62 125 38 Personnel 2 1
92 66 120 48 Clerk 3 5
93 61.5 124 48 Sys. Analyst 1 1
94 66 165 51 Mgmt . Analyst 5 8
95 60 134 36 Secretary 2 3
96 65 135 22 Clerk 2 3
97 64 130 53 Physicist 2 2
98a
65 140 34 Statistician 6 7
99 64 175 23 Mathematician 4 4
100 66 119 19 Typist 4 4
101 62 125 17 Clerk 2 1
102 66 110 37 R.N. 3 -
103 66 130 55 Budget Analyst 6 8
104 60 128 41 Mathematician 1 1
105 62.5 128 48 Info. Spec. 4 3
Used left foot
13

TABLE 3. MAXIMUM AND AVERAGE BRAKE APPLICATION FORCES IN TWO AUTOMOBILES
Brake Application Number
Vehicle A Vph i r~\p RSubject 1 2 3 4 5 6
number Max Av Max Av Max Av Max Av Max Av Max AvPedal fctree, pounds
1 165 145 150 140 65 60 100 85 130 120 145 135
2 140 130 200 180 65 60 135 120 150 130 195 175
3 185 180 245 230 175 160 155 145 220 205 215 210
4 280 250 290 250 220 175 180 170 240 220 255 235
5 225 220 235 220 165 150 170 150 165 150 245 230
6 160 140 260 235 190 180 195 170 200 195 265 235
7 130 115 165 140 120 110 125 115 150 145 200 1858 110 105 195 180 95 80 115 85 160 135 145 135
9 115 110 180 160 95 90 125 110 185 165 180 170
10 140 110 175 135 75 50 95 60 185 160 190 170
11 145 115 170 140 110 105 120 110 180 160 190 160
12 175 165 210 190 200 180 225 210 245 235 260 25013 220 210 200 195 195 180 200 185 195 180 245 235
14 225 200 240 200 200 170 190 155 210 175 240 195
15 165 150 165 150 175 150 170 155 200 185 155 140
16 180 175 200 190 200 190 210 190 235 220 270 255
17 75 70 140 130 100 85 115 105 120 105 165 160
18 120 115 150 135 70 65 85 80 90 75 105 100
19 70 65 95 85 70 65 95 80 75 70 105 95
20 190 180 180 175 165 150 170 160 195 190 220 210
21 150 145 205 175 105 100 130 110 135 120 210 190
22 210 195 240 230 145 140 165 155 190 180 210 20023 140 120 210 185 130 100 145 115 170 150 175 14024 100 85 170 160 125 105 150 120 165 145 220 210
25 165 155 185 180 150 145 160 145 180 175 210 200
26 230 225 265 260 180 140 170 150 230 225 225 215
27 235 210 270 260 190 170 185 175 220 200 250 245
28 190 180 210 205 110 100 115 100 185 160 210 205
29 180 160 220 180 100 90 145 130 165 145 205 170
30 100 90 100 95 85 50 80 65 150 120 145 135
31 180 165 235 230 160 155 170 160 220 215 260 255
32 155 145 255 240 130 130 210 200 265 255 265 260
33 180 80 150 120 130 80 105 95 125 120 220 185
34 115 110 190 175 90 80 115 100 165 160 175 165
35 160 150 160 140 105 95 65 65 200 190 215 200
(Continued)
14
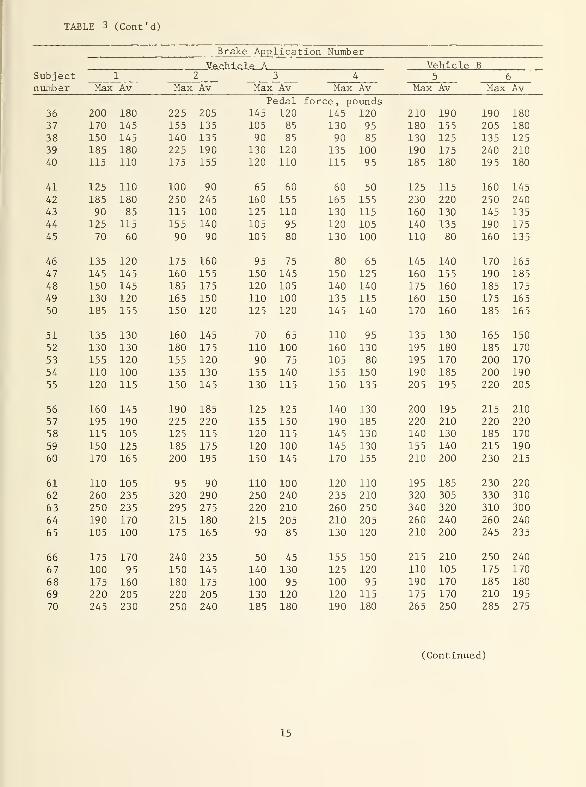
TABLE 3 (Cont'd)
Brake Application Numb er
Vprhirlp A Vehicle BSubject 1 2 3 4 5 6
number Max Av Max Av Max Av Max Av Max Av Max AvPedal force, pounds
36 200 180 225 205 145 120 145 120 210 190 190 180
37 170 145 155 135 105 85 130 95 180 155 205 180
38 150 145 140 135 90 85 90 85 130 125 135 125
39 185 180 225 190 130 120 135 100 190 175 240 21040 115 110 175 155 120 110 115 95 185 180 195 180
41 125 110 100 90 65 60 60 50 125 115 160 145
42 185 180 250 245 160 155 165 155 230 220 250 240
43 90 85 115 100 125 110 130 115 160 130 145 135
44 125 115 155 140 105 95 120 105 140 135 190 175
45 70 60 90 90 105 80 130 100 110 80 160 135
46 135 120 175 160 95 75 80 65 145 140 170 165
47 145 145 160 155 150 145 150 125 160 155 190 185
48 150 145 185 175 120 105 140 140 175 160 185 175
49 130 120 165 150 110 100 135 115 160 150 175 165
50 185 155 150 120 125 120 145 140 170 160 185 165
51 135 130 160 145 70 65 110 95 135 130 165 150
52 130 130 180 175 110 100 160 130 195 180 185 170
53 155 120 155 120 90 75 105 80 195 170 200 170
54 110 100 135 130 155 140 155 150 190 185 200 190
55 120 115 150 145 130 115 150 135 205 195 220 205
56 160 145 190 185 125 125 140 130 200 195 215 210
57 195 190 225 220 155 150 190 185 220 210 220 220
58 115 105 125 115 120 115 145 130 140 130 185 170
59 150 125 185 175 120 100 145 130 155 140 215 190
60 170 165 200 195 150 145 170 155 210 200 230 215
61 110 105 95 90 110 100 120 110 195 185 230 220
62 260 235 320 290 250 240 235 210 320 305 330 310
63 250 235 295 275 220 210 260 250 340 320 310 300
64 190 170 215 180 215 205 210 205 260 240 260 240
65 105 100 175 165 90 85 130 120 210 200 245 235
66 175 170 240 235 50 45 155 150 215 210 250 240
67 100 95 150 145 140 130 125 120 110 105 175 170
68 175 160 180 175 100 95 100 95 190 170 185 180
69 220 205 220 205 130 120 120 115 175 170 210 195
70 245 230 250 240 185 180 190 180 265 250 285 275
(Continued)
15
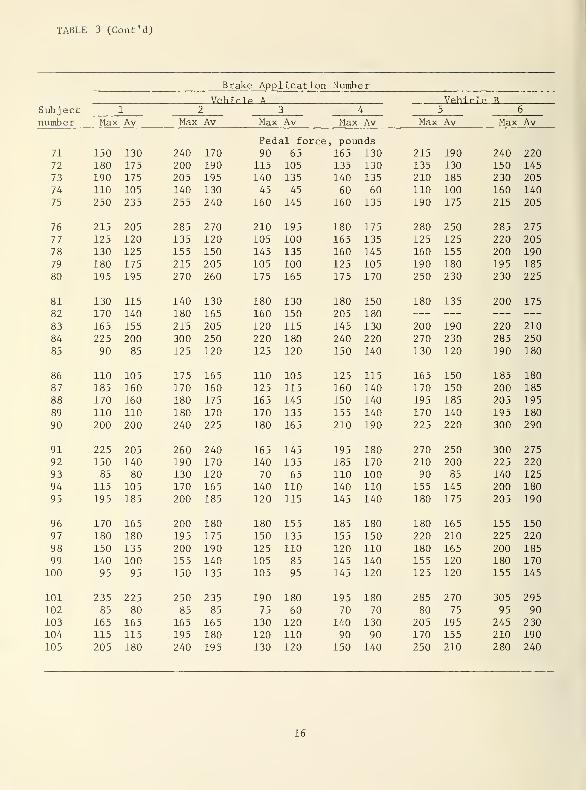
TABLE 3 (Cont'd)
Brake Application Number
Vehf r^ p A Vehir.1 p RSubject 1 2 3 4 5 6
number Max Av Max Av Max Av Max Av Max Av Max Av
Pedal force , pounds71 150 130 240 170 90 65 165 130 215 190 240 220
72 180 175 200 190 115 105 135 130 135 130 150 145
73 190 175 205 195 140 135 140 135 210 185 230 205
74 110 105 140 130 45 45 60 60 110 100 160 140
75 250 235 255 240 160 145 160 135 190 175 215 205
76 215 205 285 270 210 195 180 175 280 250 285 275
77 125 120 135 120 105 100 165 135 125 125 220 205
78 130 125 155 150 145 135 160 145 160 155 200 190
79 180 175 215 205 105 100 125 105 190 180 195 185
80 195 195 270 260 175 165 175 170 250 230 230 225
81 130 115 140 130 180 130 180 150 180 135 200 175
82 170 140 180 165 160 150 205 180
83 165 155 215 205 120 115 145 130 200 190 220 210
84 225 200 300 250 220 180 240 220 270 230 285 250
85 90 85 125 120 125 120 150 140 130 120 190 180
86 110 105 175 165 110 105 125 115 165 150 185 180
87 185 160 170 160 125 115 160 140 170 150 200 185
88 170 160 180 175 165 145 150 140 195 185 205 195
89 110 110 180 170 170 135 155 140 170 140 195 180
90 200 200 240 225 180 165 210 190 225 220 300 290
91 225 205 260 240 165 145 195 180 270 250 300 275
92 150 140 190 170 140 135 185 170 210 200 225 220
93 85 80 130 120 70 65 110 100 90 85 140 125
94 115 105 170 165 140 110 140 110 155 145 200 180
95 195 185 200 185 120 115 145 140 180 175 205 190
96 170 165 200 180 180 155 185 180 180 165 155 150
97 180 180 195 175 150 135 155 150 220 210 225 220
98 150 135 200 190 125 110 120 110 180 165 200 185
99 140 100 155 140 105 85 145 140 155 120 180 170
100 95 95 150 135 105 95 145 120 125 120 155 145
101 235 225 250 235 190 180 195 180 285 270 305 295
102 85 80 85 85 75 60 70 70 80 75 95 90
103 165 165 165 165 130 120 140 130 205 195 245 230
104 115 115 195 180 120 110 90 90 170 155 210 190
105 205 180 240 195 130 120 150 140 250 210 280 240
16
how well they understand and carry out the instructions. Drivers are
conditioned to pushing on the brake pedal up to a certain force level
under normal driving conditions and may have no understanding of what
force level might be required under unusual circumstances.
Some test subjects used unusual techniques to obtain maximum pedal
force. Some braced their shoulders against the back of the seat and
others pulled on the steering wheel. All subjects were restrained by
a lap belt which, when properly fastened, would reduce the effective-
ness of these techniques. Subjects were not instructed as to rate of
force application. Some preferred to "slam" on the pedal while others
applied the force more gradually. It has been suggested that force
acting on the pedal in a decelerating vehicle might be higher than that
measured in a static situation for a given driver due to additional
force developed as a result of the inertia of the driver's body mass.
This might be true if the driver's leg was straight and acted like a
rigid link in compression. However, it is more reasonable to assume
that the leg would be bent at the knee to at least some extent and thus
require muscle strength to transmit inertial force. Therefore pedal
force would be limited to the same muscle capability as that measured
in the static situation. In any case, inertial forces do not become
significant until a very high rate of deceleration is attained.
4.3 Pedal Force Results
The six brake pedal applications for each of the test subjects can
be broken down into three separate groups.
(a) Two applications (numbers 1 and 2) in vehicle A with a normal
pedal height.
(b) Two applications (numbers 3 and 4) in vehicle A with a re-
duced pedal height (failure simulated)
.
(c) Two applications (numbers 5 and 6) in vehicle B with a normal
pedal height.
17
°I0
MEAN 175,0 'b
MEDIAN : 175.0 lb
STANDARD DEVIATION: 46 A lb
cc 10
MEAN :i32.0ib
MEDIAN I30.0ib
STANDARD DEVIATION- 5!6ib
80 100 120 140 160 180 200 220 240 260 280 300
PEDAL FORCE(lb)100 120 14.0 160 180 200
PEDAL FORCE(lb)220 240 260
PEDAL FORCE HISTOGRAMFOR APPLICATION 2
PEDAL FORCE HISTOGRAMFOR APPLICATION 4
MEAN 194.0 lb
MEDIAN : 1 9 0.0 lb
STANDARD DEVIATION 47.91b
80 100 120 140 160 180 200 220 240 260 280
PEDAL FORCE(lb)
PEDAL FORCE HISTOGRAMFOR APPLICATION 6
FIG 6-PEDAL FORCE HISTOGRAMSFOR THREE BRAKE APPLICATIONS
18

The subject had no indication how hard she was pushing. It is be-
lieved that the second brake pedal application under each condition
(numbers 2, 4 and 6) is more indicative of the maximum capability of
the test subject. The subject was more familiar with the system after
the first try and with encouragement from the tester was on the average
able to push harder on the second try of each group. Therefore, appli-
cations 2, 4 and 6 are of primary interest. In addition, the average
pedal force sustained for five seconds during the applications is of
more interest than the maximum value since the area under the force-
time curve has a direct relationship to vehicle stopping distance.
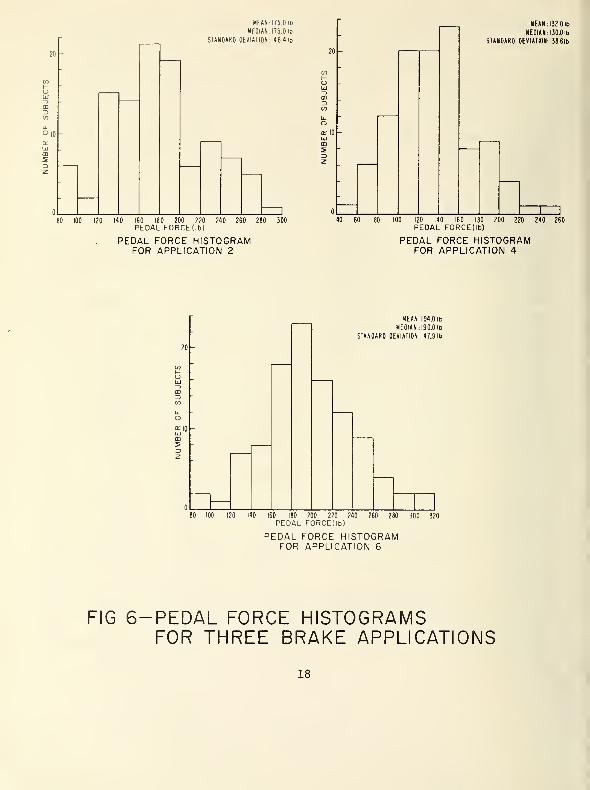
Frequency distributions (histograms) of average pedal force for
applications 2, 4 and 6 are shown in figure 6. Each of these figures
also shows mean, median and standard deviation calculated from the
data. Histograms for maximum pedal forces would be similar in shape
to those for average pedal force since plots of maximum versus average
pedal force showed a linear relationship between the two values.
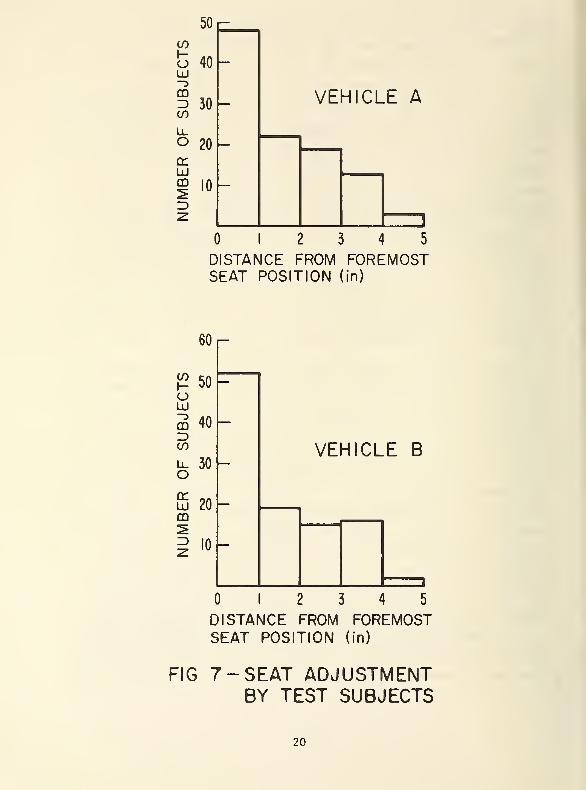
The histograms in figure 7 show a comparison of seat positions
selected in the two vehicles. Since the number of available positions
was different in each vehicle they were divided into five intervals
measured from the most forward position. A similarity in the distri-
butions of the selected positions in the two vehicles is readily ap-
parent. As expected, further examination of the data showed a correla-
tion between subject height and preferred seat position. Eighty-five
percent of all subjects 63 inches in height and shorter selected seat
position 1 or 2. Twenty-five subjects (24%) in vehicle A and forty-one
(39%) in vehicle B adjusted the seat to the forwardmost position.
This position was used more than any other on both cars and it could
be inferred that some subjects would have moved the seat further for-
ward if more adjustment had been available.
A comparison of the means (or medians) for applications 2 and 4
shows that reduced capability results when pedal travel is increased.
Thus when the pedal moves further away from the seat the subject cannot
19
50
co
o 40LU
CDZ>CO
crLUDO
30-
o 20-
-
VEHICLE A
12 3 4 5
DISTANCE FROM FOREMOSTSEAT POSITION (in)
ou
50
40
30 —VEHICLE B
20
10
i
CO
oLU-oCDZ>CO
L_OorLUCO
=> in I
—
12 3 4 5
DISTANCE FROM FOREMOSTSEAT POSITION (in)
FIG 7 -SEAT ADJUSTMENTBY TEST SUBJECTS
20
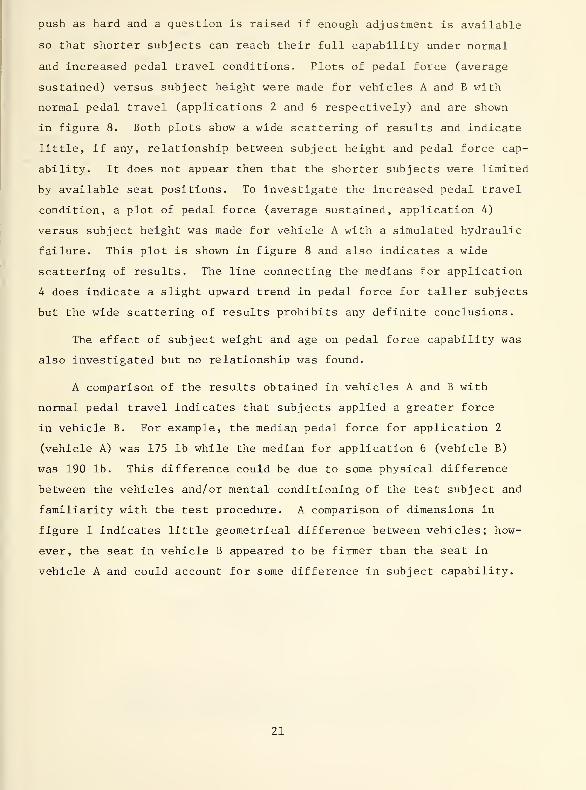
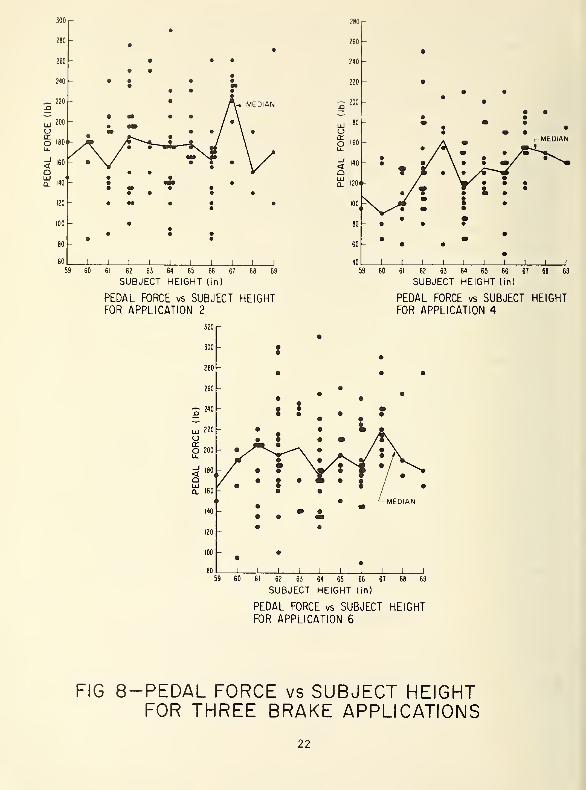
push as hard and a question is raised if enough adjustment is available
so that shorter subjects can reach their full capability under normal
and increased pedal travel conditions. Plots of pedal force (average
sustained) versus subject height were made for vehicles A and B with
normal pedal travel (applications 2 and 6 respectively) and are shown
in figure 8. Both plots show a wide scattering of results and indicate
little, if any, relationship between subject height and pedal force cap-
ability. It does not appear then that the shorter subjects were limited
by available seat positions. To investigate the increased pedal travel
condition, a plot of pedal force (average sustained, application 4)
versus subject height was made for vehicle A with a simulated hydraulic
failure. This plot is shown in figure 8 and also indicates a wide
scattering of results. The line connecting the medians for application
4 does indicate a slight upward trend in pedal force for taller subjects
but the wide scattering of results prohibits any definite conclusions.
The effect of subject weight and age on pedal force capability was
also investigated but no relationship was found.
A comparison of the results obtained in vehicles A and B with
normal pedal travel indicates that subjects applied a greater force
in vehicle B. For example, the median pedal force for application 2
(vehicle A) was 175 lb while the median for application 6 (vehicle B)
was 190 lb. This difference could be due to some physical difference
between the vehicles and/or mental conditioning of the test subject and
familiarity with the test procedure. A comparison of dimensions in
figure 1 indicates little geometrical difference between vehicles; how-
ever, the seat in vehicle B appeared to be firmer than the seat in
vehicle A and could account for some difference in subject capability.
21
280
260 -
•
240
220 •
•• •
— 200 •J3— •
••
•
uj 180 - ••
• ••o • • •
O 160 _ • .-MEDIAN
LL • • • /md 140
•• •/ •
• my • ^^^<Q T • /SUJ •a. i20i>- • • •
»/•
I ••
100 •II **• •
• •so •
•
•
• •
60 • •
•40
1i i i i i i
1 1 1
60 61 62 63 64 65 66 6?
SUBJECT HEIGHT (in)
PEDAL FORCE vs SUBJECT HEIGHTFOR APPLICATION 2
59 60 61 62 63 64 65 66 67 68 69
SUBJECT HEIGHT (in)
PEDAL FORCE vs SUBJECT HEIGHTFOR APPLICATION 4
61 62 63 64 65 66 67 66 69
SUBJECT HEIGHT (in)
PEDAL FORCE vs SUBJECT HEIGHTFOR APPLICATION 6
FIG 8-PEDAL FORCE vs SUBJECT HEIGHTFOR THREE BRAKE APPLICATIONS
22
5. CONCLUSIONS
Serious consideration should be given to reducing the 200 lb pedal
force allowed under certain conditions. Twenty percent of the test sub-
jects could not exceed an average sustained pedal force of 135 lb in
vehicle A with a normal pedal height, 100 lb in vehicle A with a re-
duced pedal height (simulated failure) or 165 lb in vehicle B with a
normal pedal height. Fifty percent of the test subjects could not
achieve an average sustained pedal force of 200 lb in either vehicle.
6
.
REFERENCES
[1] Federal Motor Vehicle Safety Standard No. 105, Hydraulic Service
Brake, Emergency Brake, and Parking Brake Systems, Passenger Cars,
issued by the U. S. Department of Transportation, Federal Highway
Administration, National Highway Safety Bureau, January 1, 1968.
[2] SAE Recommended Practice J937a, Service Brake System Performance
Requirements - Passenger Car, 1970 SAE Handbook, Society of Auto-
motive Engineers, 2 Pennsylvania Avenue, New York, New York 10001.
[3] Weight, Height and Selected Body Dimensions of Adults, United
States 1960-1962. National Center for Health Statistics, Series
11, Number 8, June 1965. U. S. Department of Health, Education
and Welfare.
USCOMM-NBS-DC
23

Latest developments in the subject area of this publication, as well as
in other areas where the National Bureau of Standards is active, are
reported in the IMBS Technical News Bulletin. See following page.
HOW TO KEEP ABREAST OF IMBS ACTIVITIES
Your purchase of this publication indicates an interest in the research,
development, technology, or service activities of the National Bureau of
Standards,
The best source of current awareness in your specific area, as well as in
other IMBS programs of possible interest, is the TECHNICAL NEWS BULLETIN,
a monthly magazine designed for engineers, chemists, physicists, research
and product development managers, librarians, and company executives.
If you do not now receive the TECHNICAL NEWS BULLETIN and would like to
subscribe, and/or to review some recent issues, please fill out and return the
form below.
Mail to: Office of Technical Information and Publications
National Bureau of Standards
Washington, D. C. 20234
Name
Affiliation
Address
City State Zip
| |
Please send complimentary past issues of the Technical News Bulletin.
| |
Please enter my 1 — yr subscription. Enclosed is my check or moneyorder for $3.00 (additional $1.00 for foreign mailing).
Check is made payable to: SUPERINTENDENT OF DOCUMENTS.
TN 557
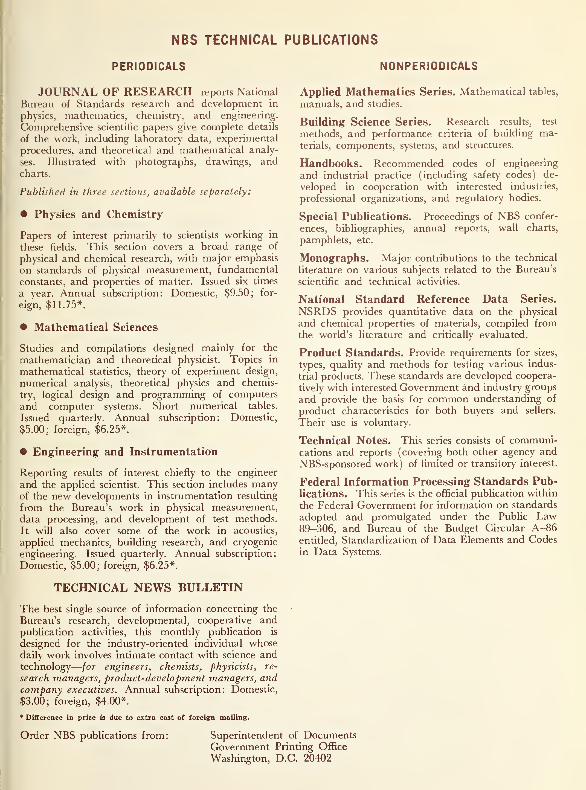
NBS TECHNICAL PUBLICATIONS
PERIODICALS NONPERIODICALS
JOURNAL OF RESEARCH reports National
Bureau of Standards research and development in
physics, mathematics, chemistry, and engineering.
Comprehensive scientific papers give complete details
of the work, including laboratory data, experimental
procedures, and theoretical and mathematical analy-
ses. Illustrated with photographs, drawings, andcharts.
Published in three sections, available separately:
• Physics and Chemistry
Papers of interest primarily to scientists working in
these fields. This section covers a broad range of
physical and chemical research, with major emphasis
on standards of physical measurement, fundamental
constants, and properties of matter. Issued six times
a vear. Annual subscription: Domestic, $9.50; for-
eign, $11.75*.
• Mathematical Sciences
Studies and compilations designed mainly for the
mathematician and theoretical physicist. Topics in
mathematical statistics, theory of experiment design,
numerical analysis, theoretical physics and chemis-
try, logical design and programming of computers
and computer systems. Short numerical tables.
Issued quarterly. Annual subscription: Domestic,
$5.00; foreign, $6.25*.
• Engineering and Instrumentation
Reporting results of interest chiefly to the engineer
and the applied scientist. This section includes manyof the new developments in instrumentation resulting
from the Bureau's work in physical measurement,
data processing, and development of test methods.
It will also cover some of the work in acoustics,
applied mechanics, building research, and cryogenic
engineering. Issued quarterly. Annual subscription:
Domestic, $5.00; foreign, $6.25*.
TECHNICAL NEWS BULLETIN
The best single source of information concerning the
Bureau's research, developmental, cooperative andpublication activities, this monthly publication is
designed for the industry-oriented individual whosedaily work involves intimate contact with science andtechnology
—
for engineers, chemists, physicists, re-
search managers, product-development managers, andcompany executives. Annual subscription: Domestic,
$3.00; foreign, $4.00*.
• Difference in price is due to extra cost of foreign mailing.
Applied Mathematics Series. Mathematical tables,
manuals, and studies.
Building Science Series. Research results, test
methods, and performance criteria of building ma-terials, components, systems, and structures.
Handbooks. Recommended codes of engineering
and industrial practice (including safety codes) de-
veloped in cooperation with interested industries,
professional organizations, and regulatory bodies.
Special Publications. Proceedings of NBS confer-
ences, bibliographies, annual reports, wall charts,
pamphlets, etc.
Monographs. Major contributions to the technical
literature on various subjects related to the Bureau's
scientific and technical activities.
National Standard Reference Data Series.
NSRDS provides quantitative data on the physical
and chemical properties of materials, compiled fromthe world's literature and critically evaluated.
Product Standards. Provide requirements for sizes,
types, quality and methods for testing various indus-
trial products. These standards are developed coopera-
tively with interested Government and industry groups
and provide the basis for common understanding of
product characteristics for both buyers and sellers.
Their use is voluntary.
Technical Notes. This series consists of communi-cations and reports (covering both other agency andNBS-sponsored work) of limited or transitory interest.
Federal Information Processing Standards Pub-lications. This series is the official publication within
the Federal Government for information on standards
adopted and promulgated under the Public Law89-306, and Bureau of the Budget Circular A-86entitled, Standardization of Data Elements and Codes
in Data Systems.
Order NBS publications from: Superintendent of DocumentsGovernment Printing Office
Washington, D.C. 20402

U.S. DEPARTMENT OF COMMERCEWASHINGTON, D.C. 20230
OFFICIAL BUSINESS POSTAGE AND FEES PAID
U.S. DEPARTMENT OF COMMERCE
PENALTY FOR PRIVATE USE, $300