october 2007 a world of - unescounesdoc.unesco.org/images/0015/001517/151707e.pdf · for...
TRANSCRIPT
2 UNESCO and Johannesburg
6 The water crisis: how has it come to this?
10 Taking the temperature of mountains
14 Glacier melt and poor policies behind Central Asia's water woes
16 The future of arid lands
23 The solar school
26 The age of renewables has now begun
28 A system for managing the planet by 2015
34 Watching the oceans for signs of climate change
41 A cabon sink that can no longer cope?
45 Small islands step into the limelight
50 Saviours from space for Siberia's frozen tombs
55 The heat is on for Australia's forests
59 Further reading
60 A glimpse into the future
A World of
Damage controlast February, the Intergovernmental Panel on Climate Change (IPCC) met at UNESCO to approve the scientific basis for its 2007 report on climate change. This report outlines the strong-
est case yet for a warming planet influenced largely by human activities.‘Warming of the climate system is unequivocal’, notes the report approved by the world’s govern-
ments. It predicts that global mean temperatures will rise by 1.8°–4.0°C this century, depending on which socio-economic scenario is followed. The report confirms that ‘most of the observed increase in globally averaged temperatures since the mid-20th century is very likely due to the observed increase in anthropogenic greenhouse gas concentrations’ and that ‘discernible human influences now extend to other aspects of climate, including ocean warming, continental-average temperatures, temperature extremes and wind patterns.’
The International Polar Year launched last March will devote the next two years to monitoring one of the few remaining grey areas in the IPCC report, the polar regions. The report can predict sea-level rise of up to 60 cm by the end of the century, for example, but not the influence on sea-level rise of future changes in the dynamic ice flows in Greenland and Antarctica. The Polar Year will strive to fill some of the gaps in our understanding of these processes, an urgent task when you consider that the last time average polar temperatures were 3–5°C higher than today, some 125 000 years ago, the corresponding reduction in polar ice volume led to 4–6 m of sea-level rise.
Climate change is affecting not only our environment but also our way of life. Finding solutions to mitigate the negative impacts and adapt to a changing world – see the back page of this issue for a glimpse into the future – will require an approach that combines sound, unbiased science with social and cultural considerations. UNESCO offers a unique forum in this regard, bringing under one roof not only key disciplines for climate science such as geology, hydrology, ecology, oceanography, physics, chemistry and biology but also education, social and human sciences, and culture.
More than 30 UNESCO programmes address a range of climate-related issues, including glacier melt, biodiversity loss, sea-level rise, ocean acidification, carbon economics and sequestration, salt-water intrusion in coastal soils and groundwater, drought and flood management, renewable energy use, education for sustainable development, the effects of climate change on world heritage and biosphere reserves, and climate monitoring via global observing systems.
This anniversary issue of A World of Science is a compilation of climate-related articles published in the journal over the past five years. This retrospective has been put together to illustrate the role UNESCO has been playing – and must pursue – in helping countries to monitor, mitigate and adapt to climate change.
The debate about the human influence on climate is over. What the world needs now is damage control, via reductions in greenhouse gas emissions and adaptation strategies. If UNESCO does not take up these challenges, many of its programmes are in danger of becoming irrelevant.
W. Erdelen Assistant Director-General for Natural Sciences
L
IN THIS ISSUE EDITORIAL
Fifth anniversary issue
Natural Sciences Quarterly Newsletter
Special issueOctober 2007
Retrospectiveon climatechange

UNESCO and JohannesburgEducation for SustainableDevelopment Decade a‘tremendous challenge for UNESCO’
A rguably the most spectacular outcome of the WorldSummit on Sustainable Development (Johannesburg,
South Africa, 26 August – 4 September 2002) forUNESCO is the recommendation to the United NationsGeneral Assembly that ‘it consider adopting a Decade ofEducation for Sustainable Development starting in 2005’(para. 117d, Plan of Implementation). The decision comesas welcome news to UNESCO, which first tabled the ideaat the final preparatory meeting for the Summit in Bali(Indonesia) last May.
The next step is for the recommendation to be presented tothe United Nations General Assembly in 2003 for adoption.UNESCO is preparing to take a leadership role in the
Decade, in close association with afull range of partners from theinter- and non-governmentalcommunities. The Decade‘represents a tremendous challengefor UNESCO’, comments AndrasSzollosi-Nagy, Deputy AssistantDirector-General for Science atUNESCO.
As an early follow-up initiativeto the Summit, UNESCO and thegovernment of France are studyingthe feasibility of launching avirtual university on sustainabledevelopment at the University ofLyon in France.
One billion promised access to sanitation by 2015
As expected, the global water crisis took priority at theSummit. Today, more than 1 billion people lack accessto safe drinking water and more than 2.4 billion arewithout adequate sanitation. One of the most ambitioustargets in the Plan of Implementation is that of halvingthe proportion of people without access to these basicrequirements by 2015. Given the size of the challenge,UNESCO will most likely be maintaining ‘waterresources and supporting ecosystems’ as the principalpriority for natural sciences in 2004–2005.
The challenge is to improve water resourcesmanagement and scientific understanding of the watercycle. The new UNESCO centres for water resourcemanagement and the UNESCO-IHE Institute for WaterEducation in Delft (Netherlands) provide a uniqueopportunity for UNESCO to demonstrate the practicalsignif icance of its science programmes in waterresources.
UNESCO may also be asked by the World WaterForum in 2003 to expand its action. Preliminary resultsof the most extensive United Nations undertaking everto assess the world’s freshwater resources werepresented to the Johannesburg Summit and will bepublished in the World Water Development Report dueout in 2003. UNESCO is lead agency for the WorldWater Assessment Programme, which involves 24United Nations agencies.
Towards regular reporting on the marine environment
In the Plan of Implementation (para.34), theIntergovernmental Oceanographic Commission (IOC)received a clear confirmation of its current mandate toaddress the scientific uncertainties of climate and globalchange, and look more closely at new developments,especially in integrated coastal management. Throughthe IOC, UNESCO will be contributing towardsestablishing by 2004 a regular global reporting andassessment system on the state of the marineenvironment.
The IOC is a member of several Type 2 partnershipson oceans and coasts, including the ‘African Process’.
One of the goals of the 2000 United NationsMillennium Declaration 1 is ‘to integrate the principles
UNESCO’S POST-JOHANNESBURG STRATEGY
2 A World of SCIENCE, Vol. 1, No. 1, October–December 2002
We are making great efforts to usesatellite technologies
and the Internet.Many people in
Mongolia… wouldlike the information
and broadcastsemanating from
the major developedcountries to focusmore on learning
and education.
President Bagabandi of Mongolia
Women carrying water in Antigua (Guatemala). Only 0.26%of the world’s freshwater is stored in lakes and rivers. Theremainder exists in the form of groundwater (30%) and iceand snow
1. www.developmentgoals.org/

of sustainable development intocountry policies and programmesand reverse the losses ofenvironmental resources’. In thePlan of Implementation, govern-ments commit themselves toachieving the Millennium goalsand identify new targets. Theyundertake for example to restorefisheries to their maximumsustainable yields by 2015 and toestablish a representative networkof marine protected areas by2012.
UNESCO will be participating actively in a Task Forceon Water and Oceans established by the heads of allUnited Nations agencies under the chairmanship of theSecretary-General of the United Nations, to developeffective implementation plans to achieve theMillennium Goals.
Reversing natural resources degradation
Governments undertake in the Plan of Implementation toreduce biodiversity loss by 2010 and to reverse thecurrent trend towards natural resources degradation.
Moreover, they commit themselvesto improving developing countries’access to environmentally soundalternatives to ozone-depletingchemicals by the same date. Theyalso invite the Global EnvironmentFacility to consider including theUnited Nations Convention toCombat Desertification (UNCCD)as a focal area for funding.
It could be said of UNESCO’sMan and the Biosphere (MAB)programme that it was fostering
sustainable development long before the term wascoined. For 30 years, MAB has been promoting throughits biosphere reserves – which today number 408 in 94countries – the sustainable use and conservation ofbiological diversity, while striving to improve therelationship between people and their environment (seealso page 12).
The Plan of Implementation underscores the need toprotect the rights of local and indigenous communitiesand to respect their traditional knowledge and resourcemanagement systems. Through the Local and IndigenousKnowledge Systems (LINKS) project, UNESCO isstriking partnerships between indigenous people andscientists to bring traditional knowledge and world viewsinto the biodiversity conservation process 2.
3A World of SCIENCE, Vol. 1, No. 1, October–December 2002
Summit innovates with ‘Type 2’ partnerships
The Summit produced three official documents: theJohannesburg Declaration on Sustainable Developmentand a Plan of Implementation (implemented by allgovernments and known as Type 1 outcomes) and, for thefirst time, the inclusion of partnership initiatives as anintegral part of the Summit. These ‘Type 2 partnerships‘were agreed upon in Johannesburg only by those partiesdirectly involved.
A number of Type 2 initiatives were made public inJohannesburg. For example, the USA announced it wouldbe investing US$970 million over the next three years inwater and sanitation projects, while the European Unionintroduced the ‘Water and Life’ initiative engaging partnersto meet goals for water and sanitation primarily in Africaand Central Asia. By the end of the Summit, countries hadpledged to replenish the Global Environment Facility with atotal of US$3 billion.
A range of agreements were concluded by nine majorelectricity companies from G7 countries and the UnitedNations to facilitate technical cooperation for sustainableenergy projects in developing countries. The EuropeanUnion announced a US$700 million partnership initiative onenergy and the USA that it would be investing up toUS$43 million in 2003. The South African energy utilityEskom announced a partnership to extend modern energyservices to neighbouring countries.
Some 20 Type 2 initiatives concluded in Johannesburginvolve UNESCO. For examples, see the boxes on IGOS andGRASP.
Summit produces ‘collateral gains’
Independently of the formal Type 1 and Type 2partnerships, there were distinct ‘collateral gains’ inJohannesburg. It was at the Summit that Russia pledgedto ratify the Kyoto Protocol – foreseeing the reduction ofgreenhouse gas emissions to pre-1990 levels by 2012 –, amove which would enable the five-year agreement toenter into force. The Russian pledge was accompanied byThailand’s and China’s announcements that they hadratified the Protocol and by Canada’s pledge to submitthe Protocol to Parliament for ratification before the endof the year.
Another ‘collateral gain’ was the pledge by individualcountries in Johannesburg to increase officialdevelopment assistance, which had fallen over the pastdecade from 0.33% of donor country GNP to 0.22% – farbelow the target of 0.7% agreed upon in Rio de Janeiro.This is all the more significant in that finance and tradeissues represented much of the 25% of the Johannesburgdocuments still needing to be agreed upon when theSummit began on 26 August.
Constructing the new paradigm
[of sustainabledevelopment] is
not about coiningnew terms – it is
about action.
Kader Asmal, Minister of Education,
South Africa
2. Contact: [email protected]
We must grasp the links between
how differentcultures shape
the environment and vice versa.
Koïchiro Matsuura,Director-General
of UNESCO

A World of SCIENCE, Vol. 1, No. 1, October–December 2002 4
UNESCO would have liked to see the Summit placegreater stress on respect for cultural diversity as anessential element of sustainable development but isnevertheless pleased that the level of awareness hasbeen raised substantially.
When small rhymes with vulnerable
Those who were in Johannesburg will recall the poignantappeal for help from the state of Tuvalu (26 km2), a tinygroup of atolls in the South Pacific with 12,000 inhabitantswhich is slowly sinking into the sea. According to a reportpublished by the Intergovernmental Panel on ClimateChange last year, sea level may rise 1 m over the next50–100 years. The average altitude of Tuvalu is 1.5 m.
UNESCO is giving a voice tosmall island states through its SmallIslands Voice project launched in2002. The Organization is pleased tosee that the sustainable developmentof small island states was givenimportance in Johannesburg (see alsopage 45).
Preparing for disaster
Another theme stressed inJohannesburg of obvious relevance
for UNESCO is the development and strengthening ofactivities to improve natural disaster preparedness andresponse. As Summit follow-up, UNESCO will betargeting both natural and man-made hazards inmegacities and rural areas. In addition to emergency reliefand recovery, it will be engaging further in disasterprevention with vulnerable countries as a focus. Throughjoint international observation and research, countries willbe familiarized with new techniques in surface-based
monitoring and encouraged to use and disseminatesatellite data.
Within an International Consortium on Landslides,UNESCO is launching a new International Programme onLandslides encompassing science, education and culture.Moreover, in the face of ever-increasing damage caused byflooding, the Council of UNESCO’s InternationalHydrological Programme recently adopted a Resolutionproposing the launch of a Joint UNESCO/WMO Programmeon Floods.
Renewable energy target wasn’t to be
The Secretary-General of the United Nations, Kofi Annan,and the government of Brazil were among proponents ofraising the market share of renewable energies to 10%.Solar energy may represent only 0.1% of today’s energydemand, but it is also one of the world’s fastest-growingrenewable energy sources. The photovoltaic solar market forexample is expanding by 15% annually, according to theGlobal Environment Facility, thanks largely to the lowercosts made possible by research (see also pages 23-27).
UNESCO’S POST-JOHANNESBURG STRATEGY
IGOS - or the new space raceThe space race has entered a new phase. Today, it is fuelledby a far more critical goal than that of Cold War politics – thequest to understand the planet’s life-support systems. Theremay be several global initiatives to observe the climate or theoceans but no single agency or organization can afford toimplement one of these systems alone. This is where theIntegrated Global Observing Strategy (IGOS) comes in.
An umbrella organization, IGOS is made up of 14 partnersincluding UNESCO, the World Meteorological Organization(WMO) and the Committee on Earth Observation Satellites(CEOS), which represents 23 space agencies.
IGOS is weaving a global network to collect, compare andsynthesize the data of the various satellites with land-basedobservations. The aim is to finalize the system within thenext two years to prepare for the launch of a constellationof nine Global Precipitation Measurement satellites, whichwill be able to measure the rainfall at any spot on the globeevery three hours.
IGOS is developing a similar strategy to study the impact ofrising carbon dioxide emissions. Carbon dioxide is the mostdangerous greenhouse gas because it can hang in the air fortens and even thousands of years, trapping heat in theatmosphere. To predict how atmospheric carbon dioxidelevels and climate may change in the future, we mustunderstand where and how it moves between the land,oceans and atmosphere in what is known as the globalcarbon cycle.
For further information on this Type 2 initiative, go to www.igospartners.org or contact [email protected]. (see also p. 28)
No-one speaks outagainst biopiracy. Our resources are
taken from us without any
payment, in totaldisregard for
the rights of localpopulations.
Professor CatherineOdora-Hoppers,
University of Pretoria,South Africa
A father with his children during a traditional danceceremony in Vanuatu

5A World of SCIENCE, Vol. 1, No. 1, October–December 2002
Although the hoped-for target isultimately absent from the Plan ofImplementation, governments do committo increasing access to modern energyservices to augment energy efficiency andto fostering the use of renewable energy.They also agree to phase out, whereappropriate, energy subsidies.
Of great interest to UNESCO is thegovernment commitment to supportingthe NEPAD 3 objective of ensuringaccess to energy for at least 35% of theAfrican population within 30 years.UNESCO launched the ten-year WorldSolar Programme in 1996 to helpAfrica in particular gain access toenergy. The Programme includes theGlobal Renewable Energy Educationand Training Programme (GREET).GREET is particularly active in sub-
S a h a r a nAfrica, where 15% of theurban population and 92% ofthe rural population lackelectricity (UNESCO data).
* * *UNESCO is in the process of
putting together its owntransdisciplinary action plan,involving its programmes notonly in natural sciences but alsoin the social sciences, education,culture and communication. Ofparticular interest to UNESCOare the areas emphasized inJohannesburg of education for
sustainable development, freshwater and the oceans, ecosystemmanagement, renewable energy and the ethical dimensions ofsustainable development.
UNESCO looks forward to working with its inter-governmental and non-governmental partners to implementfollow-up to the World Summit on Sustainable Development.
Susan Schneegans4
For details: [email protected]
The Great Apes Survival Project (GRASP) At current rates, the orang-utan may have disappeared from the world’s forests within thenext ten years. It is a voiceless victim of habitat destruction, including that caused by thefires which regularly ravage Borneo’s forests, the orang-utan’s primary habitat. And theorang-utan is not alone. Chimpanzees, gorillas and bonobos are also threatened withextinction. In Africa, poaching and armed conflict pose the greatest threat to their survival.
Faced with the urgency of saving Homo sapiens sapiens’ closest relatives, UNESCO andthe United Nations Environment Programme (UNEP) have launched the Great ApesSurvival Project (GRASP) in partnership with a number of non-governmentalorganizations (NGOs) as a Type 2 initiative. Through GRASP, UNESCO is using its WorldNetwork of Biosphere Reserves and World Heritage Sites to help conserve the Great Apehabitats in Africa and Asia.
For further information on this Type 2 initiative, go to: www.unesco.org/mab/grasp/home.sthmlor contact: [email protected]
‘Boris’, a chimpanzee in Chester Zoo (UK) drawn by
Professor Aterini. His mother wasshot in the wild when
he was a baby
UNESCO calculations of the world’s renewable energy outlook (UNESCO exhibition at the Johannesburg Summit)
It is inhuman that developing
countries must spendabout half their budgets
on internationalfinancial obligations.
The resources should bemade available for
education and socialprogrammes
to ease the extremepoverty which is
a major cause of environmental
damage in developingcountries.
President Noboa of Ecuador
3. New Partnership for Africa’s Development: www.nepad.org4. Editor, A World of Science

This is the sobering prediction of the World WaterDevelopment Report – Water for People, Water for Lifepublished by UNESCO this year on behalf of 24 UnitedNations agencies. The report predicts ‘growing per capitascarcity of water in many parts of the developing world’because of population growth, pollution and expectedclimate change.
Water supplies are falling while the demand per capita isdramatically growing at an unsustainable rate. Over thenext 20 years, the average supply of water is expected todrop worldwide by one-third,’ notes UNESCO Director-General Koïchiro Matsuura. ‘No region will be spared fromthe impact of this crisis which touches every facet of life,from the health of children to the ability of nations to securefood for their citizens’.
So, how has it come to this? Simply because, despitewidely available evidence of the crisis, political commitmentto reverse these trends has been lacking. A string ofinternational conferences over the past 25 years has focusedon a great variety of water issues including ways to providethe basic water supply and sanitation services required in theyears to come. Several targets have been set to improve
water management but ‘hardly any’, says the report, ‘havebeen met. Inertia at leadership level and a world populationnot fully aware of the scale of the problem means we fail totake the needed timely corrective actions’.
Many countries and territories already in crisis
The report ranks over 180 countries and territories in terms ofthe amount of renewable water resources available per capita,meaning all of the water circulating on the surface, in the soilor deeper underground (see table for both ends of the scale).
By the middle of this century, at worst 7 billion people in60 countries will be faced with water scarcity and at best2 billion in 48 countries, depending on factors likepopulation growth and policy-making. Climate change willaccount for an estimated 20% of this increase in globalwater scarcity. Humid areas will probably see more rain,whereas precipitation is expected to decrease and becomemore erratic in many drought-prone regions and even sometropical and sub-tropical regions. Water quality too willworsen with rising pollution levels and water temperatures.
The water crisis ‘is set to worsen despite continuing debateover the very existence of such a crisis’. One litre ofwastewater pollutes about eight litres of freshwater. There is anestimated 12 000 km3 of polluted water worldwide, which ismore than the total amount contained in the world’s ten largestriver basins at any given moment. If pollution keeps pace withpopulation growth, the world will effectively lose 18 000 km3
of freshwater by 2050 – almost nine times the total amountcountries currently use each year for irrigation, which is by farthe largest consumer of the resource. Irrigation currentlyaccounts for 70% of all water withdrawals worldwide.
Using treated wastewater could ease the water crisis.Farmers already use this resource for about 10% of irrigatedland in developing countries and could use more (seeoverleaf Tips for improving water availability).
In terms of water quality, the poor continue to be the worstaffected, ‘with 50% of the population in developingcountries exposed to polluted water sources.’ Asian riversare the most polluted in the world, with three times as manybacteria from human waste as the global average. Moreover,these rivers contain 20 times more lead than those ofindustrialized countries.
‘The future of many parts of the world looks bleak,’ saysthe report, in reference to projected population growth
FRESHWATER
6
Arguably the strongest message to emerge from the International Year of Freshwater is that the globalwater crisis will reach unprecedented levels in the years ahead if nothing is done to rectify the current‘inertia at the leadership level.’
The water crisis: how has it come to this?
Above: Boats stranded in what used to be a deep-water portin south-west Kazakhstan. The Aral Sea has shrunk to abouthalf its original size and what remains is heavily polluted, anecological disaster (see also p.14)Opposite page: Cultivating plants in the desert
A World of SCIENCE, Vol.1, No. 5, October–December 2003

which will continue to be a driving factorin the water crisis. Per capita watersupplies decreased by a third between 1970and 1990, according to the report. Eventhough birth rates are slowing down, theworld’s population should still reach about9.3 billion by 2050.
‘Water consumption has almost doubledin the last 50 years. Meanwhile, waterquality continues to worsen […]. Everyday, 6000 people, mostly children underthe age of five, die from diarrhoealdiseases,’ says the report. ‘These statisticsillustrate the enormity of the problemsfacing the world with respect to its waterresources and the startling disparities thatexist in its utilization.’
‘Globally, the challenge lies in raisingthe political will to implement water-related commitments. Water professionalsneed a better understanding of the broadersocial, economic and political context,while politicians need to be betterinformed about water resource issues.Otherwise, water will continue to be anarea for political rhetoric and loftypromises instead of sorely needed actions.’
Health and economics
The overriding problem of the 21st century is that of waterquality and management. ‘More than 2.2 million people dieeach year from diseases related to contaminated drinkingwater and poor sanitation. Water vector-borne diseases alsotake a heavy toll: about one million people die from malariaeach year and more than 200 million suffer fromschistosomiasis. Yet these terrible losses, with the waste andsuffering they represent, are preventable.’
The international community pledged through the UNMillennium Development Goals (2000) and at the WorldSummit on Sustainable Development (Johannesburg, 2002)to halve the proportion of people without access to safedrinking water and basic sanitation by 2015. To achievethese targets, an additional 1.5 billion people will requireimproved access to water supply (by 2015). This meansproviding services for another 100 million people each year(274,000/day) from 2000 to 2015.
‘The challenge for sanitation is more daunting. Anadditional 1.9 billion people will need improved access,which means another 125 million each year (or 342 000/day)from 2000 to 2015. The report explains that cultural factorsfurther complicate the logistic and financial difficulties inproviding adequate sanitation.
Were current levels of investment to be maintained, allregions in the world could reach or come close to both goals,with the exception of sub-Saharan Africa. But ‘in absoluteterms, the investment needs of Asia outstrip those of Africa,Latin America and the Caribbean combined.’ It is estimatedthat the first interventions would cost about US$ 12.6 billion.
Questions remain as to the source of this investment.‘Financing the Millennium Development Goals will probablybe one of the most important challenges that the internationalcommunity will have to face over the next 15 years’. Thereport outlines debates over water pricing and privatization.
7A World of SCIENCE, Vol.1, No. 5, October–December 2003
The 20 water-richest countries and territories*
(in m3 per person per year)
French Guiana .................... 812,121Iceland................................... 609,319Guyana ................................. 316,689Suriname .............................. 292,566Congo .................................. 275, 679Papua New Guinea ............ 166,563Gabon .................................. 133,333Solomon Islands .................. 100,000Canada ................................... 94,353New Zealand ......................... 86,554Norway ................................... 85,478Belize ...................................... 82,102Liberia ..................................... 79,643Peru ......................................... 74,756Bolivia .................................... 74,743Laos ......................................... 63,184Paraguay ................................ 61,135Chile ........................................ 60,614Equatorial Guinea ................ 56,893Panama .................................. 51,814
The 20 water-poorest countries and territories
(in m3 per person per year)
Kuwait ........................................... 10Gaza Strip ...................................... 52United Arab Emirates ................. 58Bahamas ........................................ 66Qatar .............................................. 94Maldives ...................................... 103Libyan Arab Jamahiriya ............ 113Saudi Arabia ............................... 118Malta ............................................ 129Singapore .................................... 149Jordan .......................................... 179Bahrain ........................................ 181Yemen ......................................... 223Israel ............................................. 276Barbados ..................................... 307Oman ........................................... 388Djibouti ........................................ 475Algeria ......................................... 478Tunisia .......................................... 482Burundi ....................................... 566
* Excluding Greenland (10,767,857 m3) and Alaska (1,563,168 m3)
The two extremes in terms of water availabilty
©Yann
Arthu
s-Bert
rand/U
NESC
O
World
Wate
r Deve
lopme
nt Re
port –
Water
for Pe
ople, W
ater fo
r Life
(2003)

‘Although it is considered essential to involve the privatesector in water resource management, it should be seen as afinancial catalyst – not so much as a precondition – for projectdevelopment […]. Control of the assets and the resourceshould remain in the hands of the government and users.’
Any privatization or water-pricing scheme must includemechanisms to protect the poor. ‘A disturbing fact is thatpoor people with the most limited access to water supplyhave to pay significantly more for water.’ In Delhi (India),for example, vendors charge the poor US$ 4.89 per m3,whereas families with piped connections pay just US$ 0.01,according to a survey published in the report. In Vientiane
(Lao PDR), vendors charge US$ 14.68 per m3, compared tomunicipal tariffs of US$ 0.11.
Hunger unlikely to be halved before 2030…
About 25 000 people die every day from hunger. Anestimated 815 million people suffer from malnutrition:777 million in developing countries, 27 million in countriesin transition and 11 million in industrialized countries. Theabsolute number of malnourished people is dropping at amuch slower rate, despite the fact that ‘food production issatisfying the market demand at historically low prices’.
The international community has pledged through theMillennium Development Goals to halve the proportion ofpeople suffering from hunger by 2015. However, by factoringin a distinction between rain-fed and irrigated crops (a distinction not made in previous estimates), the report isable to present more precise projections concerning the waterrequired to feed the world today and in the future: itconcludes that the target may not be achieved before 2030.According to these new calculations, another 45 million hawill be irrigated by 2030 in 93 developing countries, wheremost of the population growth will take place. About 60% ofall land that could be irrigated will be in use. This will requirea 14% increase in irrigation water.
Of the 170 countries and territories surveyed, 20 arealready using more than 40% of their renewable waterresources for irrigation, ‘a threshold used to flag the level atwhich countries are forced to make difficult choices betweentheir agricultural and urban water supply sectors’. Most ofthese are Arab states. Another 16 countries use more than20%, ‘which can indicate impending water scarcity. By 2030,South Asia will have reached the 40% level on average andthe Near East and North Africa not less than 58%.’
By contrast, sub-Saharan Africa, Latin America and EastAsia are likely to remain far below the critical threshold.These regions will see the bulk of agricultural expansion inthe next 30 years.
Pastures and crops take up 37% of the Earth’s land area.Irrigation is extremely inefficient – close to 60% of thewater used is wasted. This will only improve by anestimated total of 4%. Moreover, About 10% of the world’sirrigated lands have been damaged by waterlogging andsalinization because of poor drainage and irrigationpractices. There is a tremendous need to improve thefinancing of better technology and to promote bettermanagement practices.
…even though food security is growing
On a more positive note, food security is improving globally.Per capita food consumption in developing countries rosefrom 2054 kcal per day in 1965 to 2681 kcal per day in 1998.
8 A World of SCIENCE, Vol. 1, No. 5, October–December 2003
FRESHWATER
Tips for improving wateravailability
Did you know that you can bolster nature’s capacity forreplenishing groundwater simply by letting water seep througha river bank? Or by injecting water underground throughboreholes? These are two examples of tried and true methodswhich have demonstrated their sustainability over time.
The water injection method is currently used in major citieslike Berlin (Germany) where two-thirds of drinking water isbank-infiltrated. And the same process utilized in Berlin* withstate-of-the-art monitoring is commonly used in rural Indiaand southern Africa. In these parts, hand-dug pits and damsare used to collect floodwater or seasonal river flow and storeit safely from evaporation in the form of groundwater whichcan later be pumped for use. These simple, low-cost structurescan ease water scarcity in arid areas of developing countriesthrough the storage of infrequent excess water.
Soil acts as a natural filter of particles in water, breaking downimpurities like pharmaceuticals. In addition to being purifiedduring its passage through the soil, water also leachesbeneficial nutrients, thereby improving its quality. Aquiferseven have the capacity to inactivate harmful micro-organismslike viruses, a prowess which is the object of intensive research.Thanks to the natural biological, chemical and physicalprocesses occurring underground, treated reclaimedwastewater can be used safely for mostly non-potablepurposes, a great asset for arid zones in particular where wateris scarce.
Within a project launched with its partners in 2002, theUNESCO-IHP has published a brochure on how to replenishgroundwater, entitled Managing Aquifer Recharge:http://unesdoc.unesco.org/images/0012/001278/127843e.pdf
You will find details of methods employed specifically in thedrier regions of the world in a booklet UNESCO is currentlypreparing with the International Association ofHydrogeologists on Wise Strategies for Recharge Enhancementin Arid and Semi-arid Areas. The booklet is available at:http://unesdoc.unesco.org/images/0014/001438/143819e.pdf
* www.kompetenz-wasser.de

Average grain yields doubled between 1962 and 1996, from1.4 to 2.8 tons/ha/crop. This means that less than half theamount of arable land is now required to grow the sameamount of grain. ‘By 2030, it is expected that 80% of theincrease in crop production will come from higher yields,increased multiple cropping and shorter fallow periods.’
‘Towards 2050, the world could enjoy access to food forall,’ notes the report. ‘The fact that 815 million are presentlyravaged by chronic undernourishment is not due to a lack ofcapacity to produce the required food but to global andnational social, economic and political contexts that permit,and sometimes cause, unacceptable levels of poverty toperpetuate.’
We are nonchalantly destroying ecosystems
By 2025, it is predicted that water withdrawal will increaseby 50% in developing countries and by 18% in developedcountries.
The report describes a vicious circle unleashed by growingwater demand. By depleting and polluting rivers, lakes andwetlands, we are destroying ecosystems which play anessential role in filtering and assuring freshwater resources. Inthe USA, 40% of water bodies assessed in 1998 were notdeemed fit for recreational use due to nutrient, metal andagricultural pollution. Furthermore only five out of 55 riversin Europe are considered pristine, according to the report and,in Asia, all rivers running through cities are badly polluted.Some 60% of the world’s 227 largest rivers are severelyfragmented by dams, diversions and canals leading to thedegradation of ecosystems.
Turning to the animal life of inland waters, the report claimsthat 24% of mammals and 12% of birds are threatened withextinction. Only about 10% of the world’s fish species, themajority from inland waters, have been studied in detail, yetone-third are at risk. Up to 80 known fish species have becomeextinct since the late 19th century.
When cities become life-threatening
‘When infrastructure and services are lacking, urban areaslacking water infrastructure are among the world’s most lifethreatening environments’. According to a survey of 116cities, urban areas in Africa are the worst served, with only18% of households connected to sewers, followed by Asiawhere the connection rate is just over 40%.
‘The poor of these cities are the first victims of sanitation-related disease, flooding and even a rising rate of water-bornedisease like malaria, which is now among the main causes ofillness and death in many urban areas’. In South Asia, forexample, the Anopheles stephensi mosquito has actuallyadapted its breeding habits around the ubiquitous rooftopwater storage tanks.
‘From a public healthperspective, it is better to providea whole city’s population withsafe supplies to taps within 50 mof their home than to provideonly the richest 20% ofhouseholds with water piped totheir home.’
The report outlines severalreasons as to why cities andtowns should take priority overrural areas when choices must be made. Firstly, the unit costsof the required infrastructure are lower because urban areasprovide significant economies of scale and proximity.Secondly, many cities have a more prosperous economic basethan rural areas, providing greater possibilities for raisingrevenues for water provision. Thirdly, ‘urban areas concentratenot only people and enterprises but also their wastes.’
Industrial countries produce 80% of hazardouswastes
Today, industry accounts for 22% of total water use in theworld: 59% in high-income countries and 8% in low-incomecountries. The report predicts that this average will reach24% by 2025 when industry will be using an estimated1170 km3/year of water. Every year, 300–500 million tons ofheavy metals, solvents, toxic sludge and other wastesaccumulate in water resources from industry. More than 80%of the world’s hazardous waste is produced in the USA andother industrial countries.
The pros and cons of tapping the hydropowerpotential
Hydropower is the most important and widely usedrenewable source of energy, providing about 19%of total electricity production. Industrializedcountries are exploiting about 70% of theirelectricity potential, compared to 15% indeveloping countries. Canada is the largestproducer, followed by the USA and Brazil.Untapped hydro-resources are still abundantin Latin America, India and China.
‘By developing half of this potential,we could reduce greenhouse gasemissions by about 13%,’ says thereport. However, it also points to themany negative impacts of damconstruction, including displacementof local populations andenvironmental damage (like loss ofbiodiversity and wetlands).
Amy Otchet
9A World of SCIENCE, Vol.1, No. 5, October–December 2003
©UNE
SCO/D
. Roge
r
In Haiti, a woman bathesher daughter in theircourtyard
©UNIC
EF/ N
. Touto
unji

One-quarter of our globe’s terrestrial surface is covered by mountain regions, which provide goods and services – such as the provision of clean freshwater – to more than
half of humanity. Though rug-ged in appearance, mountains
are actually highly susceptible to environmental degrada-tion, as anyone knows who has seen the corrosive effects of strip-mining or clear-cut logging on mountain slopes. The main drivers of change in alpine environments are cli-mate, land use and nitrogen deposits.
Taking the temperature of mountainsFuture climate warming is expected to be especially marked in colder environ-ments, such as mountains and northern climes. For the past two years, 350 scientists participating in the European Union-funded Global Change in Mountain Regions (GLOCHAMORE) project involving UNESCO and the Swiss-based Mountain Research Initiative have been developing a network of sites in selected mountain biosphere reserves to observe and study over time the signs of global change in nature and their impact on the people who inhabit these regions. The project was coordi-nated by the University of Vienna (Austria) and comprised 14 partners from eight European countries, plus India. By the time the project wound up last October, some 28 biosphere reserves around the world had been identified and the foundations had been laid for the long-term study of change in these alpine monitoring sites.
Climate change to create water shortages for millions dependent on glaciers
For millions of people in Asia and Latin America who rely on melting snow and glaciers for freshwater supplies, climate change will cause major shortages, says a research team led by Tim Barnett of the US-based Scripps Institute of Oceanography, in a paper published in Nature on 17 November.
In many parts of the world, glaciers are melting at an unprecedented rate. The area of Peru covered by glaciers has shrunk by 25% in the past 30 years. However, ‘perhaps the most critical region in which vanishing glaciers will negatively affect water supply in the next few decades’, say the authors, ‘will be China and parts of Asia, including India, which together form the Himalaya–Hindu Kush region’ populated by about 50–60% of the world’s population.
The Himalaya–Hindu Kush region contains more ice than anywhere else on Earth, apart from the polar regions. The authors write that ‘there is little doubt that the glaciers of the Himalaya-Hindu Kush region
are melting and that the melting is accompanied by a long-term increase of near-surface air temperature’. After 25 years of study, the recently released China Glacier Inventory shows ‘substantial melting of virtually all glaciers, with one of the most marked retreats in the last 13 years (750 m) of the glacier that acts as one of the major sources of the Yangtze River, the largest river in China,…' The authors add that the rate of melting seems to be accelerating.
‘The hydrological cycle of the region is complicated by the Asian monsoon but there is little doubt that melting glaciers provide a key source of water for the region in the summer months: as much as 70% of the summer flow in the Ganges and 50–60% of the flow in other major rivers. In China, 23% of the population lives in the western regions, where glacial melt provides the principal dry season water source’.
The authors conclude that ‘it appears that some areas of the most populated region on Earth are likely to “run out of water” during the dry season if the cur-rent warming and glacial melting trends continue for several more decades. This may be enough time for long-term planning to see just how the region can cope with this problem'.
Source: Nature 438, 303 (2005) and M. Shanahan for SciDev.net
© IN
RE
NA
In the Cordillera Blanca moun-tain range in Latin America, the area covered by glaciers has shrunk markedly over the past 30 years. Seen here is rapidly retreating Yanamarey Glacier in the Huascarán Biosphere Reserve in Peru
©D
. Fag
re
© T
. Sch
aaf/U
NE
SCO
A World of SCIENCE, Vol. 4, No. 1, January – March 200610
MOUNTAINS

11A World of SCIENCE, Vol. 4, No. 1, January – March 2006
Tell-tale signs of climate change
In a survey conducted in 2004 within the GLOCHAMORE project, managers of mountain biosphere reserves reported on their experien-ces of global warming. High on the list of concerns was the econo-mic impact of the changing natural environment. In the Kosciuszko Biosphere Reserve in Australia, for example, where four ski resorts bring the area an estimated A$190 million annually, the winter season is becoming shorter. In Changbaishan Biosphere Reserve in China, lesser snow cover is responsible for a drop in the quantity of water available to farmers for agriculture. In Mount Kenya Biosphere Reserve, flash floods and other hydrological hazards are silting wate-rworks and canals used for irrigation. Local communities are also suffering from water shortages, as in the Kruger to Canyons Biosphere Reserve in South Africa.
The greatest impact of climate warming observed in nature can be seen in vegetation. The Changbaishan Biosphere Reserve reported that ‘the alpine Betula ermannii birch tree has moved upwards towards the tundra ecosystem over the past 20 years. Results show that, for other species, such as the Larix olgensis and Abies nephrolepis, there is an apparent increase in their biomass with climate warming’. In other words, these two plant species are proliferating as a result of the increase in temperature, a phenomenon which will eventually create an ecological imbalance.
The following is a non-exhaustive list of impacts associated with climate change in mountain biosphere reserves. Many of the signs of climate change below are interlinked, reflecting the fact that a single impact of climate change can set off chain reactions with both physi-cal and social dimensions:
• Greater solar ultraviolet radiation• Melting of glaciers (see box on facing page)• Thawing of permafrost soils causing greater weathering (the
breakdown of rocks and minerals on, or just below, the surface, caused by changes in temperature or humidity, etc.)
• As a result of greater weathering, dryer soils, subsidence, siltation, landslides caused by erosion, etc.
• More frequent storms, floods, landslides and avalanches of greater intensity
• Changes in the distribution and numbers of plant and animal species
• A longer growing period for vegetation, with the vegetation lines moving up the mountain
• Less rainfall and snowfall (precipitation) • Drying out of the forest area due to the drop in precipitation• A greater fire hazard due to the drying out of the forest area• Greater competition for more limited natural resources
among the human populations living in the lowlands.
Mountain landscapes are among the most complex and fragile ecosystems on earth. Their mere verticality produces a huge range of habitats, whose composition varies dramatically with short changes in altitude. These differences can be obvious in the tropics or sub-tropics – such as the presence of palm trees at lower altitudes and glaciers at higher ones – or more sub-tle, such as the shifts in insect species as you move up a mountain slope.
Calculating and forecasting the effects of climate change on these environments encompasses a demanding range of scientific inquiry. This is why the scientists participating in the GLOCHAMORE project developed a research strategy encompassing such diverse areas as land-use changes, the cry-osphere (permanent frozen landscapes, from the Greek word Kruos meaning cold) and snow-covered areas, hydrological systems, grasslands and tundra areas, forests and aquatic eco-systems, wildlife, alien plant and animal species and natural hazards (floods, fires, landslides, etc), to name but a few.
One of the recommendations made by scientists partici-pating in GLOCHAMORE is for ‘early warning’ mecha-nisms to be developed to detect invaders and their envi-ronmental impact. As annual temperatures rise over the long-term due to global warming, for example, non-native plant, insect and animal species may more easily invade new ecosystems where there is often no check on their behaviour. This lack of “checks and balances” can play havoc with a mountain ecosystem’s structure and func-tion. Hostile bugs might attack the plants and grasses that anchor a slope’s thin layer of topsoil, for example. Remove the anchor and you get severe erosion and landslides, with their cascading effect on local communities.
A network of alpine observation posts
The GLOCHAMORE project set up a network of observa-tion posts to monitor the effects of changes on the natural world but also on the people living in these colder climes. In the space of two years, the project has developed a plan for environmental and social monitoring in mountain regions that is helping to implement global change research strate-gies in selected UNESCO Biosphere Reserves (see table overleaf). There is no reason why the GLOCHAMORE research strategy could not be applied to other mountain biosphere reserves – there are over 150 in total – or to world heritage sites, such as Mount Kilimanjaro in the United Republic of Tanzania. Some alpine sites have even been accorded dual status, as in the case of Uvs Nuur Basin (Mongolia) and Mount Kenya, which are both biosphere reserves and world heritage sites. It so happens that the impact of climate change on world heritage sites will be the subject of a meeting taking place at UNESCO just two months from now, on 16 and 17 March.
Sky Lake Meteorological Station at an altitude of 2600 m in Changbaishan Biosphere Reserve in China. Other research stations study hydrological factors and seismic and volcanic activity
Scientists can reconstruct climate history from sediment layers and ice cores. These scientists are studying mountain snow pack to reconstruct climate history in Glacier National Park in the State of Montana in the USA

Over the past two years, GLOCHAMORE has defined indica-tors to detect and analyse signals of change in these high-altitude regions and to analyse direct cause–effect relationships in individual ecosystems using carefully chosen markers. These indicators have been ranked in terms of ease of application.
Disturbing evidence of climate change
Glaciers, permafrost and alpine regions are all sensitive to changes in atmospheric temperature, so act as an indicator of global climate change. Warming during the 20th cen-tury has already had a pronounced effect on glacial and
periglacial mountain belts. If this trend continues, experts predict smaller mountain glaciers could melt, areas of frozen ground (permafrost) could thaw and alpine regions could shrink.
Specifically, the network of selected biosphere reserves is observing cryo-spheric indicators, such as snow cover, glaciers, permafrost and solifluction (where freezing and thawing of the ground results in soil-surface slip-page); high-mountain, freshwater ecosystems and watershed hydrology; and terrestrial ecosystems, especially
mountain plant life and certain soil-dwelling animals. They have already uncovered disturbing evidence of climate change (see box on page 11).
UNESCO’s mountain biosphere reserves were chosen as moni-toring sites for the GLOCHAMORE project both because they offer a major advantage for global comparisons and because the ‘biosphere concept’ is particularly well adapted to integra-ted research observing change in both the natural and socio-economic environments.
This is because the biosphere concept acknowledges that people and nature cohabit and that conservation practices have to incorporate this reality. The biosphere reserve concept adopts a zoning approach: strictly protected core areas are surrounded by buffer zones where conservation is emphasized but where people also live and work; and the whole is encir-cled by a transition area promoting sustainable development.
It was the Brundtland Report, Our Common Future, which proposed a definition of sustainable development in 1987 that is now generally recognized as the standard:
Sustainable development is development that meets the needs of the present without compromising the ability of future generations to meet their own needs.
The Brundtland report helped to trigger a wide range of initiatives by the United Nations, including the ‘Earth Summits’ in Rio (Brazil, 1992), which adopted Agenda 21, and in Johannesburg (South Africa, 2002), as well as the Framework Convention on Climate Change, to which the Kyoto Protocol was added in 1997 (see p. 29).
At the Earth Summit in Rio, the United Nations promo-ted UNESCO’s wide network of biosphere reserves as ‘living laboratories’ for conservation efforts. The Rio Summit was the start of a growing awareness of the importance of mountains. A decade later, the United Nations would designate 2002 as the International Year of Mountains. UNESCO’s main contri-bution to the Year would be the launch of the GLOCHAMORE project. Significantly, mountain-related research by the European Union has also gathered momentum in the past decade.
On the International Year of Mountains, see A World of Science 1(2), January 2003
Core zone
Buffer zone
Transition area
People in the Sierra Nevada Biosphere Reserve in southern Spain live in close proximity to the mountain. The mountain serves as a source of revenue via tourism and recreational activities. A ski resort is situated in the buffer zone on the lower slopes
Crossing a river in Katunsky Biosphere Reserve in Altai, Russian Federation
Living laboratories for sustainable development
© T
. Sch
aaf/U
NE
SCO
© J
avie
r Sàn
chez
Gut
ierr
ez
© T
. Sch
aaf/U
NE
SCO
A World of SCIENCE, Vol. 4, No. 1, January – March 200612
MOUNTAINS

Ensuring the long-term viability of mountain monitoring
The choice of monitoring sites was not a random one. Sites were chosen in countries in such a way as to provide representative geographic coverage and different socio-economic backgrounds and cultures. Another criterion for selection was whether or not the site had the necessary infrastructure in place to partake in the project.
The studies undertaken at the chosen locations needed to integrate natural and societal factors, and therefore various scientific disciplines. ‘Through monitoring, one can design a scheme to target indicators that are driven by human action and managers of mountain biosphere reserves can set threshold val-ues, such as for sustainability for example, which can be met by management,’ suggests the report of the project’s first thematic meeting in Vienna in 2004. But a fully integrated study of the so-called ‘nature–society system’ entails finding common denominators and even coining a new language which
practitioners of both the natural and social sciences can understand, the report concludes.
Managers of mountain biosphere reserves will be crucial to the long-term viability of mountain monitoring. They will serve as the custodians of the information and data col-lected by the body of both national and visiting scientists who, themselves, will come and go over the coming decade. By definition, monitoring climate change is a long-term undertaking that calls for comprehensive and constant in situ observation. The involvement of other stakeholders, such as local communities, will also be crucial to maintain-ing a viable ‘observation post’ for climate change.
This article is the work of contributors from the GLOCHAMORE Consortium;
for details: [email protected]
The Perth Declaration moves mountains
During its two years of activity, GLOCHAMORE organized no less than five specialized international workshops. In general, these scientific workshops focused on the drivers of global change and the impact of those changes on ecosystems, ecosystem goods and services, regional economies, health and institutional arrangements. The proceedings
of these workshops are compiled in a series of publications.Scientists examined the most pressing aspects of climate change observed in mountain landscapes, such as sustainable land use and natural resource management, the monitoring of human activity linked to environmental changes and modelling to project the future effects of global war-ming in mountains.The project culminated in an Open Science Conference on Global Change in Mountain Regions in Perth (Scotland) from 2 to 6 October. This meeting built on successful gatherings in Vienna (Austria) and l’Aquila (Italy) in 2004, in Granada (Spain) and Samedan (Switzerland) in 2005 and the project’s kick-off meeting at
the Entlebuch Biosphere Reserve (Switzerland) in November 2003.The Open Science Conference brought together 250 delegates from 47 countries to review the project’s work and define the path ahead. At the conference, scientists issued a clarion call – the Perth Declaration – to governments, funding agencies and private sector to support further research into the effects of climate change on mountain ecosystems and the sustainable management of mountain environments and adjacent lowland communities.
Read the Perth Declaration: www.unesco.org/mab/mountains/news.htm; and the Proceedings of the GLOCHAMORE meetings: www.unesco.org/mab/mountains/publications.htm
The selected mountain biosphere reserves
Altitudinal range (m.a.s.l.)
AfricaTassili N’Ajjer (Algeria) 1 150 – 2 158Mount Kenya 1 600 – 5 199Oasis du Sud (Morocco) 680 – 4 071Kruger to Canyons (South Africa) 200 – 2 050Asia-PacificKosciuszko (Australia) 213 – 2 228 Changbaishan (China) 720 – 2 691Issyk-Kul (Kyrgyzstan) 1 609 – 7 439Nanda Devi (India) 1 800 – 7 817Uvs Nuur Basin (Mongolia) 759 – 3 966Katunskiy (Russian Federation) 765 – 4 506Sikhote-Alin (Russian Federation) 0 – 1 600Teberda (Russian Federation) 1 260 – 4 047EuropeGossenköllersee (Austria) 2 413 – 2 828Gurgler Kamm (Austria) 1 900 – 3 400Berchtesgaden Alps (Germany) 471 – 2 713Sierra Nevada (Spain) 400 – 3 482Lake Torne (Sweden) 340 – 1 610Entlebuch (Switzerland) 600 – 2 350Swiss National Park 1 500 – 3 174Latin AmericaAraucarias (Chile) 800 – 3 124Torres del Paine (Chile) 20 – 3 050Cinturón Andino (Colombia) 1 700 – 5 750Huascarán (Peru) 2 500 – 6 768North AmericaMount Arrowsmith (Canada) 300 – 1 817Glacier National Park (USA) 972 – 3 185Niwot Ridge (USA) 2 866 – 3 780Denali (USA) 122 – 6 194Olympic (USA) 0 – 2 428
Glacier National Park in the USA
© D
anie
l B. F
agre
13A World of SCIENCE, Vol. 4, No. 1, January – March 2006

How fast are glaciers retreating in the moun-tain ranges of Central Asia?
Several studies presented to the international workshop I attended last November show that glaciers in the Central Asian mountain regions of Dzhunghar Alatau and Pamir-Alai are melting very rapidly. Between 1955 and 2000, they lost about 0.6–0.8% per year in surface area and 0.8–1% in volume. These figures leave no doubt that global warming is the main reason for deglaciation and shrinking snow and ice in Central Asia.
Is glacier monitoring satisfactory in Central Asia?
There are too many gaps in monitoring. The November workshop acknowledged that the lack of a monitoring system in Central Asia is responsible for inadequate in-formation on glacier mass dynamics. This is a critical problem in the region, since glaciers are key indicators of global climate change. There is practically no monitoring system, for instance, for snow cover in the high-mountain belt above 3000–3200 m, even though this is where about half of snow is concentrated, according to our research. It is this snow which is the main source of runoff in Central Asia. Most countries in the region do not even have regu-lar monitoring of permafrost soils. This lack of factual information on processes and natural phenomena at high altitudes in cold mountain regions forces scientists to use secondary data, indirect methods and to make assump-tions when constructing forecast models. This explains the lack of consensus among scientists on the impact of climate change on the region’s water resources in general and glaciers in particular.
I believe this was why the workshop participants called for a regional centre on glacier research to be established in Central Asia under the auspices of UNESCO. The centre would promote and coordinate monitoring to improve scientific un-derstanding of climate-driven changes in snow- and icepack in glaciers, in permafrost and in the flow system connecting melt water to rivers and lakes in the lowlands.
Is it true that glaciers will disappear by mid-century?
There is tremendous concern in scientific literature that Central Asian glaciers may disappear by mid-century. Yet, our research pens a slightly more optimistic scenario. For example, glacier retreat in Northern Tien Shan reached a climax in the mid-1970s before slowing down in the early 1980s. A similar scenario has played out in the Gissar-Alai mountain range. To take another example, glacier upsurge has even been reported in the Central Karakoram mountains, where the glacier advanced by up to 2.5 km along the valleys between 1990 and 2000.
Long-term monitoring of the average annual temperature of permafrost near the mountain pass of Zhusalykezen (3400 m) in the Zailiyskiy Alatau mountain range (Northern Tien Shan) indicates a constant rise in temperature between 1974 and 1995. Thereafter, the temperature stabilized at around -0.2oC for more than a decade. Moreover, based on our analysis, which takes into account current global warming trends, the glacier area of the Balkhash Basin may shrink by about one-third but will not disappear completely.
These case studies show that glaciers in Central Asia may not disappear as rapidly as predicted. This said, we need updated monitoring systems to improve our understanding before venturing to make any forecast.
Might glacier lakes turn into hazards by over-flowing or bursting their banks?
Yes, that is quite a likely possibility. The hazard might be caused by glacier melt forming a new lake nearby by a swol-len lake, or even by disturbances in the stability of loose soils. All three processes considerably increase the probability of mud flows.
Is glacier melt to blame for the water short-ages the lowlands are experiencing?
Water resources management in Central Asia is a critical problem, especially in the Aral Sea Basin. Melt water from
Igor Vasilievich Severskiy
Glacier melt and poor policies behind Central Asia’s water woes
Last November, Igor Vasilievich Severskiy was one of 60 experts from 13 countries who called for a regional centre to be established on glacier research, at a workshop run by UNESCO and partners in Almaty (Kazakhstan). Prof. Severskiy heads the Laboratory of Glaciology at Kazakhstan’s Institute of Geography, as well as Kazakhstan’s National Committee within UNESCO’s International Hydrological Programme. He explains why both scientists and policy-makers in Central Asia have a lot to gain from a regional centre on glacier research.
A World of SCIENCE, Vol. 5, No. 2, April – June 2007 15A World of SCIENCE, Vol. 5, No. 2, April – June 200714
GLACIERS
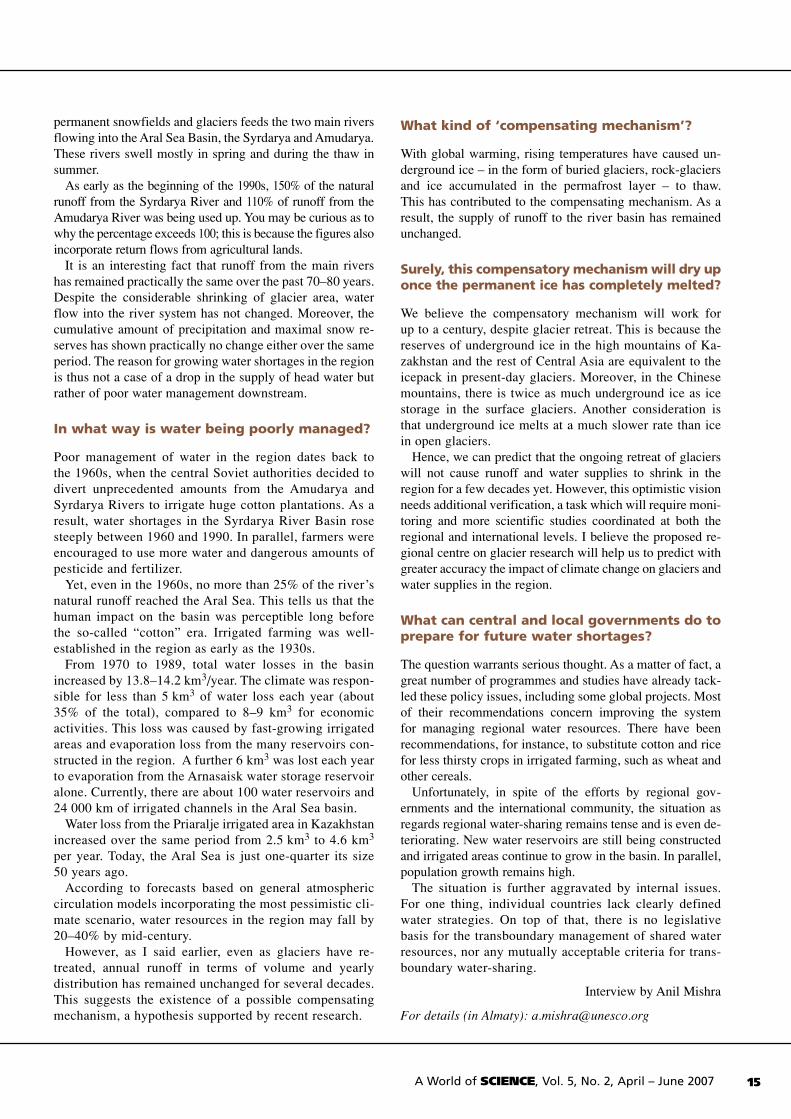
permanent snowfields and glaciers feeds the two main rivers flowing into the Aral Sea Basin, the Syrdarya and Amudarya. These rivers swell mostly in spring and during the thaw in summer.
As early as the beginning of the 1990s, 150% of the natural runoff from the Syrdarya River and 110% of runoff from the Amudarya River was being used up. You may be curious as to why the percentage exceeds 100; this is because the figures also incorporate return flows from agricultural lands.
It is an interesting fact that runoff from the main rivers has remained practically the same over the past 70–80 years. Despite the considerable shrinking of glacier area, water flow into the river system has not changed. Moreover, the cumulative amount of precipitation and maximal snow re-serves has shown practically no change either over the same period. The reason for growing water shortages in the region is thus not a case of a drop in the supply of head water but rather of poor water management downstream.
In what way is water being poorly managed?
Poor management of water in the region dates back to the 1960s, when the central Soviet authorities decided to divert unprecedented amounts from the Amudarya and Syrdarya Rivers to irrigate huge cotton plantations. As a result, water shortages in the Syrdarya River Basin rose steeply between 1960 and 1990. In parallel, farmers were encouraged to use more water and dangerous amounts of pesticide and fertilizer.
Yet, even in the 1960s, no more than 25% of the river’s natural runoff reached the Aral Sea. This tells us that the human impact on the basin was perceptible long before the so-called “cotton” era. Irrigated farming was well-established in the region as early as the 1930s.
From 1970 to 1989, total water losses in the basin increased by 13.8–14.2 km3/year. The climate was respon-sible for less than 5 km3 of water loss each year (about 35% of the total), compared to 8–9 km3 for economic activities. This loss was caused by fast-growing irrigated areas and evaporation loss from the many reservoirs con-structed in the region. A further 6 km3 was lost each year to evaporation from the Arnasaisk water storage reservoir alone. Currently, there are about 100 water reservoirs and 24 000 km of irrigated channels in the Aral Sea basin.
Water loss from the Priaralje irrigated area in Kazakhstan increased over the same period from 2.5 km3 to 4.6 km3 per year. Today, the Aral Sea is just one-quarter its size 50 years ago.
According to forecasts based on general atmospheric circulation models incorporating the most pessimistic cli-mate scenario, water resources in the region may fall by 20–40% by mid-century.
However, as I said earlier, even as glaciers have re-treated, annual runoff in terms of volume and yearly distribution has remained unchanged for several decades. This suggests the existence of a possible compensating mechanism, a hypothesis supported by recent research.
What kind of ‘compensating mechanism’?
With global warming, rising temperatures have caused un-derground ice – in the form of buried glaciers, rock-glaciers and ice accumulated in the permafrost layer – to thaw. This has contributed to the compensating mechanism. As a result, the supply of runoff to the river basin has remained unchanged.
Surely, this compensatory mechanism will dry up once the permanent ice has completely melted?
We believe the compensatory mechanism will work for up to a century, despite glacier retreat. This is because the reserves of underground ice in the high mountains of Ka-zakhstan and the rest of Central Asia are equivalent to the icepack in present-day glaciers. Moreover, in the Chinese mountains, there is twice as much underground ice as ice storage in the surface glaciers. Another consideration is that underground ice melts at a much slower rate than ice in open glaciers.
Hence, we can predict that the ongoing retreat of glaciers will not cause runoff and water supplies to shrink in the region for a few decades yet. However, this optimistic vision needs additional verification, a task which will require moni-toring and more scientific studies coordinated at both the regional and international levels. I believe the proposed re-gional centre on glacier research will help us to predict with greater accuracy the impact of climate change on glaciers and water supplies in the region.
What can central and local governments do to prepare for future water shortages?
The question warrants serious thought. As a matter of fact, a great number of programmes and studies have already tack-led these policy issues, including some global projects. Most of their recommendations concern improving the system for managing regional water resources. There have been recommendations, for instance, to substitute cotton and rice for less thirsty crops in irrigated farming, such as wheat and other cereals.
Unfortunately, in spite of the efforts by regional gov-ernments and the international community, the situation as regards regional water-sharing remains tense and is even de-teriorating. New water reservoirs are still being constructed and irrigated areas continue to grow in the basin. In parallel, population growth remains high.
The situation is further aggravated by internal issues. For one thing, individual countries lack clearly defined water strategies. On top of that, there is no legislative basis for the transboundary management of shared water resources, nor any mutually acceptable criteria for trans-boundary water-sharing.
Interview by Anil Mishra
For details (in Almaty): [email protected]
A World of SCIENCE, Vol. 5, No. 2, April – June 2007 15A World of SCIENCE, Vol. 5, No. 2, April – June 200714

Paradoxically, the dryland climate in the low latitudes has much to recommend it as a place to live and a place to grow crops: clear skies, warm temperatures and long growing seasons. The key to making the desert bloom has always been finding water. With water at such a premium in drylands, the pursuit of new sources has been intense and unrelenting.
Cloud seeding and other schemes
In the 1950s, there was a great belief in what future techno-logy might deliver. The 1950s were the dawning of the era of large dam-building, whereas little attention was paid to groundwater as a major water resource. Water was to come from existing surface sources, from augmenting existing sources through cloud seeding (see photo) and other measu-
res, or from ‘new’ water originating from untapped sources, such as the desalinization of brackish water and seawater.
The intervening years have seen much of what was discussed then play out. Inevitably, though, many things have happened that were not foreseen. The 1950s marked the beginning of a period of unanticipated growth in water consumption in the agricultural sector in particular that has continued until today. Perhaps as a consequence of this rapid growth in consumption, there have also been some fundamental changes in the general perception of water development. While cost–benefit analysis was, and is, done for most water development projects, the scope of what is included among both costs and benefits has been broade-ned significantly since then from strictly economic costs to incorporate environmental and social costs as well.
Despite the fact that groundwater was largely dismissed as a major option in 1956, exploitation of groundwater
resources developed rapidly from the 1950s onward, with most development taking place between 1960 and 1980. This development was mostly con-cerned with immediate returns on investment and not sustai-nability. Now, as the value of water is increasingly realized, markets have emerged as a mechanism for addressing ine-quities in the distribution of water through its direct sale and through the trade of com-modities that represent water, or “virtual water.”
Back in 1956, The Future of Arid Lands5 predic-ted that drylands would receive renewed and sustained interest in coming decades. Drylands have been plagued by underinvestment ever since, regardless of the fact that advancing deserts continue to consume arable land at an alarming rate. Today, one-third of the Earth’s surface is threatened by desertification and arable land is expected to shrink by two-thirds in Africa, one-third in Asia and one-fifth in Latin America by 2025 in relation to 1990.
A publication commissioned by UNESCO to mark the International Year of Deserts and Desertification, The Future of Arid Lands – Revisited, takes a critical look at the unintended consequences of past thinking on dryland ecosystems and the socio- economics of dryland development. What mistakes did we make and how can we learn from them? Due out in 2007, The Future of Arid Lands – Revisited argues for giving a new impetus to dryland research to fill the persistent gaps in our knowledge.
The future of arid lands
Distribution of drylands (light brown), as observed by NASA MODIS in 2001
Cou
rtesy
NA
SA G
od d
ard
Spa
ce F
light
Cen
ter
Repeat satellite images of Almeria in southern Spain in January 1974 (left) and April 2000
© N
ASA
et l
’US
Geo
logi
cal S
urve
y
A World of SCIENCE, Vol. 4, No. 4, October–December 200616
ARID LANDS
16
In considering water development and water use as a whole, the most fundamental difference between 1956 and today is that focus has shifted from developing new water supplies to a more comprehensive effort to manage all water from an integrated perspective, both on the supply and the demand sides, and from a quality point of view.
Modifying the weather and climate change
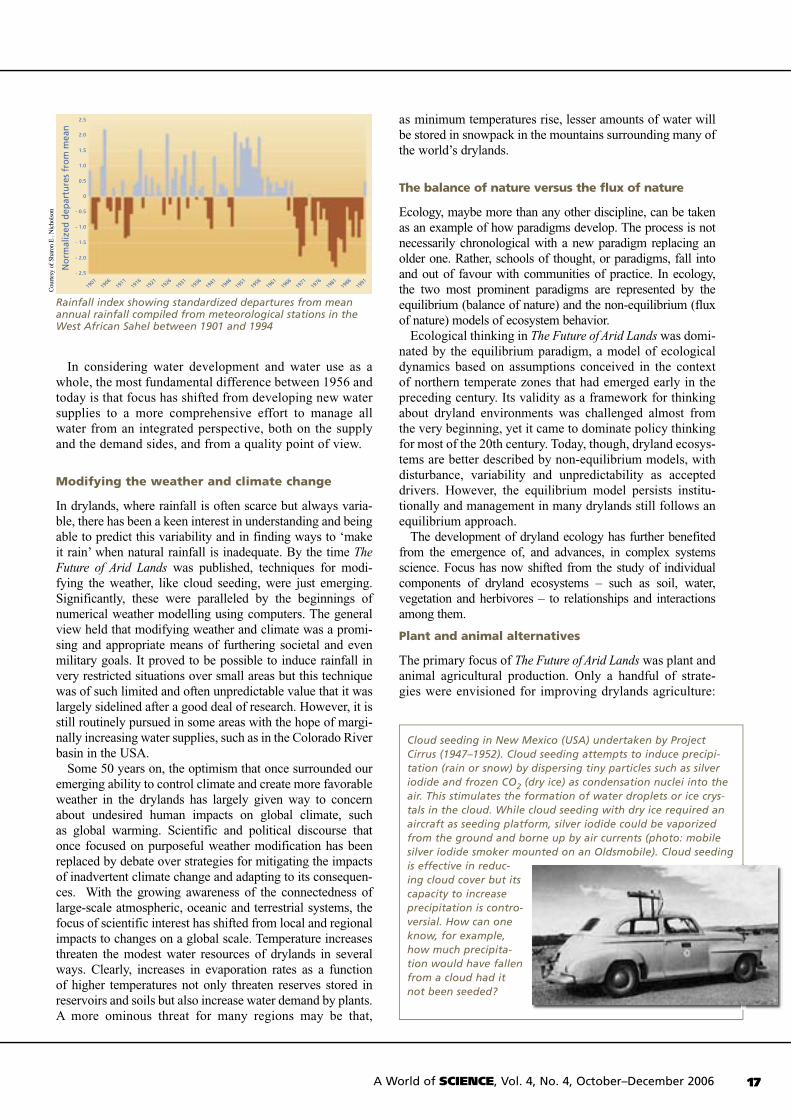
In drylands, where rainfall is often scarce but always varia-ble, there has been a keen interest in understanding and being able to predict this variability and in finding ways to ‘make it rain’ when natural rainfall is inadequate. By the time The Future of Arid Lands was published, techniques for modi-fying the weather, like cloud seeding, were just emerging. Significantly, these were paralleled by the beginnings of numerical weather modelling using computers. The general view held that modifying weather and climate was a promi-sing and appropriate means of furthering societal and even military goals. It proved to be possible to induce rainfall in very restricted situations over small areas but this technique was of such limited and often unpredictable value that it was largely sidelined after a good deal of research. However, it is still routinely pursued in some areas with the hope of margi-nally increasing water supplies, such as in the Colorado River basin in the USA.
Some 50 years on, the optimism that once surrounded our emerging ability to control climate and create more favorable weather in the drylands has largely given way to concern about undesired human impacts on global climate, such as global warming. Scientific and political discourse that once focused on purposeful weather modification has been replaced by debate over strategies for mitigating the impacts of inadvertent climate change and adapting to its consequen-ces. With the growing awareness of the connectedness of large-scale atmospheric, oceanic and terrestrial systems, the focus of scientific interest has shifted from local and regional impacts to changes on a global scale. Temperature increases threaten the modest water resources of drylands in several ways. Clearly, increases in evaporation rates as a function of higher temperatures not only threaten reserves stored in reservoirs and soils but also increase water demand by plants. A more ominous threat for many regions may be that,
as minimum temperatures rise, lesser amounts of water will be stored in snowpack in the mountains surrounding many of the world’s drylands.
The balance of nature versus the flux of nature
Ecology, maybe more than any other discipline, can be taken as an example of how paradigms develop. The process is not necessarily chronological with a new paradigm replacing an older one. Rather, schools of thought, or paradigms, fall into and out of favour with communities of practice. In ecology, the two most prominent paradigms are represented by the equilibrium (balance of nature) and the non-equilibrium (flux of nature) models of ecosystem behavior.
Ecological thinking in The Future of Arid Lands was domi-nated by the equilibrium paradigm, a model of ecological dynamics based on assumptions conceived in the context of northern temperate zones that had emerged early in the preceding century. Its validity as a framework for thinking about dryland environments was challenged almost from the very beginning, yet it came to dominate policy thinking for most of the 20th century. Today, though, dryland ecosys-tems are better described by non-equilibrium models, with disturbance, variability and unpredictability as accepted drivers. However, the equilibrium model persists institu-tionally and management in many drylands still follows an equilibrium approach.
The development of dryland ecology has further benefited from the emergence of, and advances, in complex systems science. Focus has now shifted from the study of individual components of dryland ecosystems – such as soil, water, vegetation and herbivores – to relationships and interactions among them.
Plant and animal alternatives
The primary focus of The Future of Arid Lands was plant and animal agricultural production. Only a handful of strate-gies were envisioned for improving drylands agriculture:
Cloud seeding in New Mexico (USA) undertaken by Project Cirrus (1947–1952). Cloud seeding attempts to induce precipi-tation (rain or snow) by dispersing tiny particles such as silver iodide and frozen CO2 (dry ice) as condensation nuclei into the air. This stimulates the formation of water droplets or ice crys-tals in the cloud. While cloud seeding with dry ice required an aircraft as seeding platform, silver iodide could be vaporized from the ground and borne up by air currents (photo: mobile silver iodide smoker mounted on an Oldsmobile). Cloud seeding is effective in reduc-ing cloud cover but its capacity to increase precipitation is contro-versial. How can one know, for example, how much precipita-tion would have fallen from a cloud had it not been seeded?
2.5
2.0
1.5
1.0
0.5
0
- 0.5
- 1.0
- 1.5
- 2.0
- 2.5
No
rmal
ized
dep
artu
res
fro
m m
ean
1901
1906
1911
1916
1921
1926
1931
1936
1941
1946
1951
1956
1961
1966
1971
1976
1981
1986
1991
Rainfall index showing standardized departures from mean annual rainfall compiled from meteorological stations in the West African Sahel between 1901 and 1994
Cou
rtesy
of S
haro
n E
. N
icho
lson
17A World of SCIENCE, Vol. 4, No. 4, October–December 2006 17
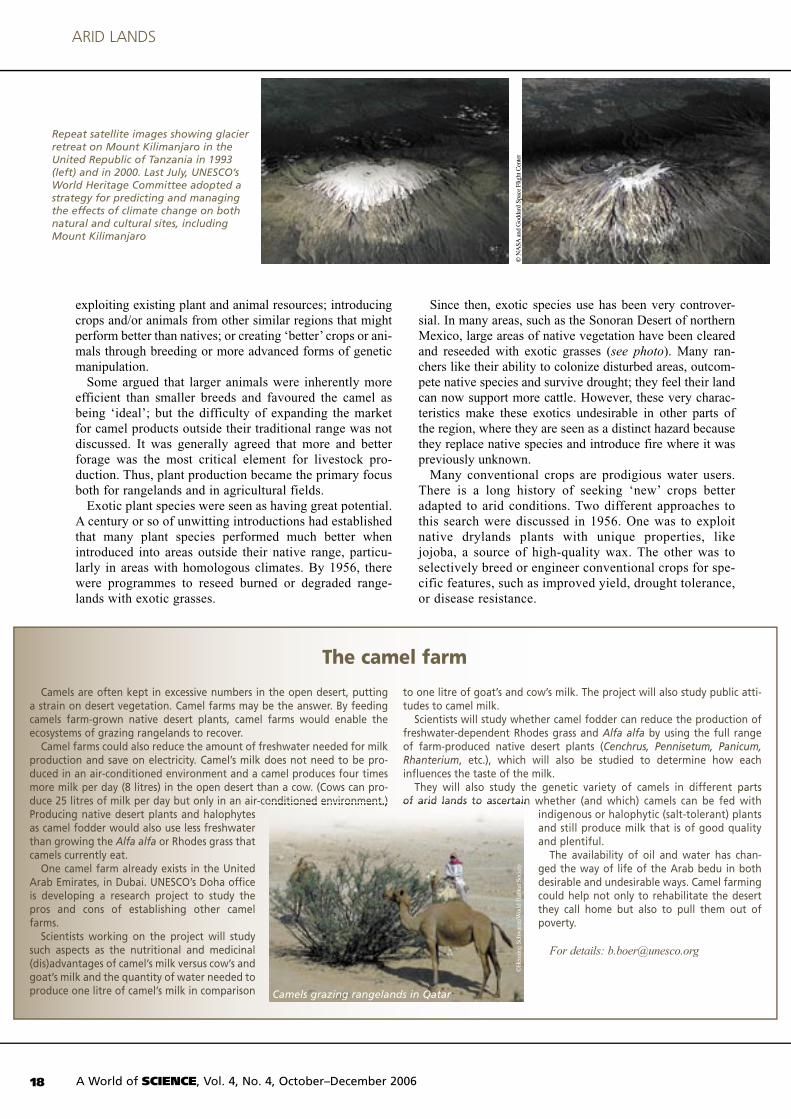
exploiting existing plant and animal resources; introducing crops and/or animals from other similar regions that might perform better than natives; or creating ‘better’ crops or ani-mals through breeding or more advanced forms of genetic manipulation.
Some argued that larger animals were inherently more efficient than smaller breeds and favoured the camel as being ‘ideal’; but the difficulty of expanding the market for camel products outside their traditional range was not discussed. It was generally agreed that more and better forage was the most critical element for livestock pro-duction. Thus, plant production became the primary focus both for rangelands and in agricultural fields.
Exotic plant species were seen as having great potential. A century or so of unwitting introductions had established that many plant species performed much better when introduced into areas outside their native range, particu-larly in areas with homologous climates. By 1956, there were programmes to reseed burned or degraded range-lands with exotic grasses.
Since then, exotic species use has been very controver-sial. In many areas, such as the Sonoran Desert of northern Mexico, large areas of native vegetation have been cleared and reseeded with exotic grasses (see photo). Many ran-chers like their ability to colonize disturbed areas, outcom-pete native species and survive drought; they feel their land can now support more cattle. However, these very charac-teristics make these exotics undesirable in other parts of the region, where they are seen as a distinct hazard because they replace native species and introduce fire where it was previously unknown.
Many conventional crops are prodigious water users. There is a long history of seeking ‘new’ crops better adapted to arid conditions. Two different approaches to this search were discussed in 1956. One was to exploit native drylands plants with unique properties, like jojoba, a source of high-quality wax. The other was to selectively breed or engineer conventional crops for spe-cific features, such as improved yield, drought tolerance, or disease resistance.
The camel farm
Camels are often kept in excessive numbers in the open desert, putting a strain on desert vegetation. Camel farms may be the answer. By feeding camels farm-grown native desert plants, camel farms would enable the ecosystems of grazing rangelands to recover.
Camel farms could also reduce the amount of freshwater needed for milk production and save on electricity. Camel’s milk does not need to be pro-duced in an air-conditioned environment and a camel produces four times more milk per day (8 litres) in the open desert than a cow. (Cows can pro-duce 25 litres of milk per day but only in an air-conditioned environment.) Producing native desert plants and halophytes as camel fodder would also use less freshwater than growing the Alfa alfa or Rhodes grass that camels currently eat.
One camel farm already exists in the United Arab Emirates, in Dubai. UNESCO’s Doha office is developing a research project to study the pros and cons of establishing other camel farms.
Scientists working on the project will study such aspects as the nutritional and medicinal (dis)advantages of camel’s milk versus cow’s and goat’s milk and the quantity of water needed to produce one litre of camel’s milk in comparison
to one litre of goat’s and cow’s milk. The project will also study public atti-tudes to camel milk.
Scientists will study whether camel fodder can reduce the production of freshwater-dependent Rhodes grass and Alfa alfa by using the full range of farm-produced native desert plants (Cenchrus, Pennisetum, Panicum, Rhanterium, etc.), which will also be studied to determine how each influences the taste of the milk.
They will also study the genetic variety of camels in different parts of arid lands to ascertain whether (and which) camels can be fed with
indigenous or halophytic (salt-tolerant) plants and still produce milk that is of good quality and plentiful.
The availability of oil and water has chan-ged the way of life of the Arab bedu in both desirable and undesirable ways. Camel farming could help not only to rehabilitate the desert they call home but also to pull them out of poverty.
For details: [email protected]
duce 25 litres of milk per day but only in an air-conditioned environment.) of arid lands to ascertain whether (and which) camels can be fed with
Repeat satellite images showing glacier retreat on Mount Kilimanjaro in the United Republic of Tanzania in 1993 (left) and in 2000. Last July, UNESCO’s World Heritage Committee adopted a strategy for predicting and managing the effects of climate change on both natural and cultural sites, including Mount Kilimanjaro
© N
ASA
and
God
dard
Spa
ce F
light
Cen
ter
©H
enni
ng S
chw
arze
/Wor
ld H
abita
t Soc
iety
Camels grazing rangelands in Qatar
A World of SCIENCE, Vol. 4, No. 4, October–December 200618
ARID LANDS
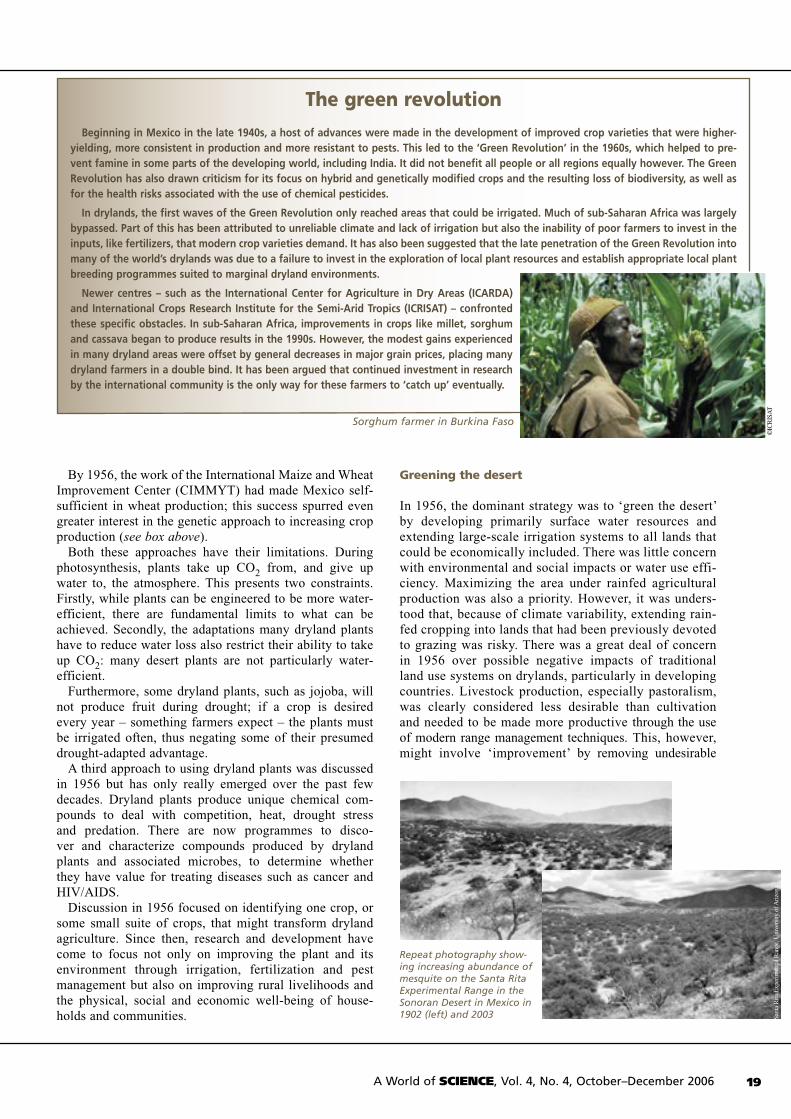
By 1956, the work of the International Maize and Wheat Improvement Center (CIMMYT) had made Mexico self-sufficient in wheat production; this success spurred even greater interest in the genetic approach to increasing crop production (see box above).
Both these approaches have their limitations. During photosynthesis, plants take up CO2 from, and give up water to, the atmosphere. This presents two constraints. Firstly, while plants can be engineered to be more water-efficient, there are fundamental limits to what can be achieved. Secondly, the adaptations many dryland plants have to reduce water loss also restrict their ability to take up CO2: many desert plants are not particularly water-efficient.
Furthermore, some dryland plants, such as jojoba, will not produce fruit during drought; if a crop is desired every year – something farmers expect – the plants must be irrigated often, thus negating some of their presumed drought-adapted advantage.
A third approach to using dryland plants was discussed in 1956 but has only really emerged over the past few decades. Dryland plants produce unique chemical com-pounds to deal with competition, heat, drought stress and predation. There are now programmes to disco-ver and characterize compounds produced by dryland plants and associated microbes, to determine whether they have value for treating diseases such as cancer and HIV/AIDS.
Discussion in 1956 focused on identifying one crop, or some small suite of crops, that might transform dryland agriculture. Since then, research and development have come to focus not only on improving the plant and its environment through irrigation, fertilization and pest management but also on improving rural livelihoods and the physical, social and economic well-being of house-holds and communities.
Greening the desert
In 1956, the dominant strategy was to ‘green the desert’ by developing primarily surface water resources and extending large-scale irrigation systems to all lands that could be economically included. There was little concern with environmental and social impacts or water use effi-ciency. Maximizing the area under rainfed agricultural production was also a priority. However, it was unders-tood that, because of climate variability, extending rain-fed cropping into lands that had been previously devoted to grazing was risky. There was a great deal of concern in 1956 over possible negative impacts of traditional land use systems on drylands, particularly in developing countries. Livestock production, especially pastoralism, was clearly considered less desirable than cultivation and needed to be made more productive through the use of modern range management techniques. This, however, might involve ‘improvement’ by removing undesirable
The green revolution
Beginning in Mexico in the late 1940s, a host of advances were made in the development of improved crop varieties that were higher-yielding, more consistent in production and more resistant to pests. This led to the ‘Green Revolution’ in the 1960s, which helped to pre-vent famine in some parts of the developing world, including India. It did not benefit all people or all regions equally however. The Green Revolution has also drawn criticism for its focus on hybrid and genetically modified crops and the resulting loss of biodiversity, as well as for the health risks associated with the use of chemical pesticides.
In drylands, the first waves of the Green Revolution only reached areas that could be irrigated. Much of sub-Saharan Africa was largely bypassed. Part of this has been attributed to unreliable climate and lack of irrigation but also the inability of poor farmers to invest in the inputs, like fertilizers, that modern crop varieties demand. It has also been suggested that the late penetration of the Green Revolution into many of the world’s drylands was due to a failure to invest in the exploration of local plant resources and establish appropriate local plant breeding programmes suited to marginal dryland environments.
Newer centres – such as the International Center for Agriculture in Dry Areas (ICARDA) and International Crops Research Institute for the Semi-Arid Tropics (ICRISAT) – confronted these specific obstacles. In sub-Saharan Africa, improvements in crops like millet, sorghum and cassava began to produce results in the 1990s. However, the modest gains experienced in many dryland areas were offset by general decreases in major grain prices, placing many dryland farmers in a double bind. It has been argued that continued investment in research by the international community is the only way for these farmers to ‘catch up’ eventually.
©IC
RIS
AT
Repeat photography show-ing increasing abundance of mesquite on the Santa Rita Experimental Range in the Sonoran Desert in Mexico in 1902 (left) and 2003
Sorghum farmer in Burkina Faso
Sant
a R
ita E
xper
imen
tal R
ange
, Uni
vers
ity o
f Ariz
ona
19A World of SCIENCE, Vol. 4, No. 4, October–December 2006
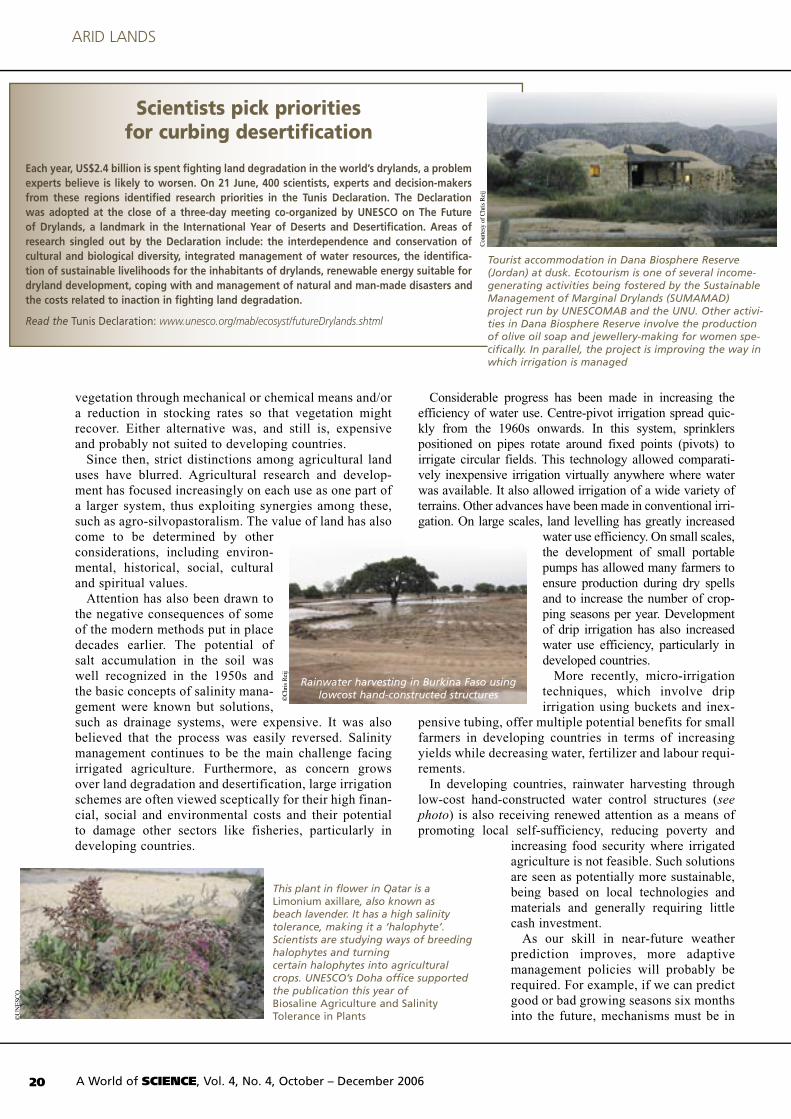
vegetation through mechanical or chemical means and/or a reduction in stocking rates so that vegetation might recover. Either alternative was, and still is, expensive and probably not suited to developing countries.
Since then, strict distinctions among agricultural land uses have blurred. Agricultural research and develop-ment has focused increasingly on each use as one part of a larger system, thus exploiting synergies among these, such as agro-silvopastoralism. The value of land has also come to be determined by other considerations, including environ-mental, historical, social, cultural and spiritual values.
Attention has also been drawn to the negative consequences of some of the modern methods put in place decades earlier. The potential of salt accumulation in the soil was well recognized in the 1950s and the basic concepts of salinity mana-gement were known but solutions, such as drainage systems, were expensive. It was also believed that the process was easily reversed. Salinity management continues to be the main challenge facing irrigated agriculture. Furthermore, as concern grows over land degradation and desertification, large irrigation schemes are often viewed sceptically for their high finan-cial, social and environmental costs and their potential to damage other sectors like fisheries, particularly in developing countries.
Considerable progress has been made in increasing the efficiency of water use. Centre-pivot irrigation spread quic-kly from the 1960s onwards. In this system, sprinklers positioned on pipes rotate around fixed points (pivots) to irrigate circular fields. This technology allowed comparati-vely inexpensive irrigation virtually anywhere where water was available. It also allowed irrigation of a wide variety of terrains. Other advances have been made in conventional irri-gation. On large scales, land levelling has greatly increased
water use efficiency. On small scales, the development of small portable pumps has allowed many farmers to ensure production during dry spells and to increase the number of crop-ping seasons per year. Development of drip irrigation has also increased water use efficiency, particularly in developed countries.
More recently, micro-irrigation techniques, which involve drip irrigation using buckets and inex-
pensive tubing, offer multiple potential benefits for small farmers in developing countries in terms of increasing yields while decreasing water, fertilizer and labour requi-rements.
In developing countries, rainwater harvesting through low-cost hand-constructed water control structures (see photo) is also receiving renewed attention as a means of promoting local self-sufficiency, reducing poverty and
increasing food security where irrigated agriculture is not feasible. Such solutions are seen as potentially more sustainable, being based on local technologies and materials and generally requiring little cash investment.
As our skill in near-future weather prediction improves, more adaptive management policies will probably be required. For example, if we can predict good or bad growing seasons six months into the future, mechanisms must be in ©
UN
ESC
O
Rainwater harvesting in Burkina Faso using lowcost hand-constructed structures
Scientists pick priorities for curbing desertification
Each year, US$2.4 billion is spent fighting land degradation in the world’s drylands, a problem experts believe is likely to worsen. On 21 June, 400 scientists, experts and decision-makers from these regions identified research priorities in the Tunis Declaration. The Declaration was adopted at the close of a three-day meeting co-organized by UNESCO on The Future of Drylands, a landmark in the International Year of Deserts and Desertification. Areas of research singled out by the Declaration include: the interdependence and conservation of cultural and biological diversity, integrated management of water resources, the identifica-tion of sustainable livelihoods for the inhabitants of drylands, renewable energy suitable for dryland development, coping with and management of natural and man-made disasters and the costs related to inaction in fighting land degradation.
Read the Tunis Declaration: www.unesco.org/mab/ecosyst/futureDrylands.shtml
This plant in flower in Qatar is a Limonium axillare, also known as beach lavender. It has a high salinity tolerance, making it a ‘halophyte’. Scientists are studying ways of breeding halophytes and turning certain halophytes into agricultural crops. UNESCO’s Doha office supported the publication this year of Biosaline Agriculture and Salinity Tolerance in Plants
Cou
rtesy
of C
hris
Rei
j
©C
hris
Rei
j
Tourist accommodation in Dana Biosphere Reserve (Jordan) at dusk. Ecotourism is one of several income-generating activities being fostered by the Sustainable Management of Marginal Drylands (SUMAMAD) project run by UNESCOMAB and the UNU. Other activi-ties in Dana Biosphere Reserve involve the production of olive oil soap and jewellery-making for women spe-cifically. In parallel, the project is improving the way in which irrigation is managed
A World of SCIENCE, Vol. 4, No. 4, October – December 2006 21A World of SCIENCE, Vol. 4, No. 4, October – December 200620
ARID LANDS

place to advise and allow farmers and livestock operators to adjust their cropping or stocking strategies accordingly.
The primary objective in 1956 was to do ‘better.’ This implied more water and more agricultural production. Many development threads pursued after 1956 were clearly unsustainable, such as the exploitation of fossil groundwater in North America, North Africa and the Arabian Peninsula. Much of the improvement in system performance over the past 50 years may be technical, such as improved crop varieties but a great deal may also be related to policy, including trade, subsidies and tariffs.
Why invest in drylands research?
Firstly, the problem described by Malthus6 200 years ago has not gone away. Over the next 40 years, the world’s population will increase by 50% to 9 billion. Drylands constitute about 41% of the Earth’s surface and will have to play a greater role in meeting these growing demands over the long term.
Most population growth will occur in developing countries, much of that in drylands and the bulk in urban areas. The challenge will be to develop safe, secure urban water supplies without causing undue harm to the agri-cultural sector – which would further encourage urban migration – or damaging the ability of the environment to provide goods and services for future generations. One opportunity is the reclamation and use of urban wastewa-ter streams. Policy must acknowledge wastewater and stormwater as increasingly important resources.
Secondly, from a more immediate environmental perspective, it can be argued that significant parts of the world’s drylands are the source of potentially serious global problems. Dust from the Saharo-Sahelian region of Africa and the drylands of central Asia is transported over continental scales and is of global concern. Dust from central Asia causes health concerns not only in China and Japan but also in North America. Dust from Africa may be contributing to the decline of coral reefs in the Caribbean.
Botanical gardens are lacking in the Arabian Peninsula, despite their obvious value for conserving plant species ex-situ and the centuries old Islamic tradition of botanical studies.
Together with a team of architects, botanists, engineers, phytochemists and Muslim scholars, UNESCO’s Doha office has designed a project to create a network of botanical gardens which will pay tribute to ancient regional traditions and cultures. These botanical gardens will display living plants mentioned in the Holy Quran, such as date palms, pome-granates, figs and grapes. They will also exhibit plants of importance to Islam, such as the medicinal plants used by the Prophet Mohammed and cited in his Sayings.
The gardens will educate the public about the need to preserve bio-logical diversity. The victim of habitat loss, oil spills and inadequate livestock management practices, the flora of the rapidly developing Arabian Peninsula is in dire need of better protection from human influences.
The plans for the botanical gardens will respect the two major landscaping concepts of the Islamic gardening cultures. The first is based on typical desert environments, such as the Arabian concepts of wadi, baadiya, raudhas, sandy area and oasis. The second is characterized by plan-
ned gardens, such as the Persian concepts of sunken flowerbeds, gulistan (flower garden), bustan (orchard) or the quadripartite chahar bagh.
The core of the gardens will feature an orderly display of plants arran-ged in four quarters and divided by water canals, with a water fountain or basin at its centre. The plan of this core will be enriched by sunken flowerbeds, an ingenious traditional system motivated by the need for irrigation to reduce soil evaporation and plant transpiration.
Around the core, each garden will conserve plants from different regio-nal ecosystems. It will grow plants found on the coast, in mountainous regions, sandy areas, gravel deserts, the wadis, oases and aquatic habi-tats, as well as agricultural plants and halophytes (salt-tolerant plants). The project will be implemented over the coming year. Funds in trust agreements and workplans for each of the gardens are currently being
discussed with potential donors.
For details, contact in Doha: [email protected]
Quranic botanical gardens for the Arabian Peninsula
7Planète SCIENCE, Vol. 4, No. 4, Octobre – décembre 2006
(Left) The Emperor Babur supervising the construction of a garden illumination in the Baburname scroll (Below) Modern garden in Isfahan (Iran) based on the traditional quadripartite concept (chahar bagh)
©I G
uido
Lic
ciar
di
Cou
rtesy
of t
he V
icto
ria a
nd A
lber
t Lib
rary
, Lon
don
A World of SCIENCE, Vol. 4, No. 4, October – December 2006 21A World of SCIENCE, Vol. 4, No. 4, October – December 200620
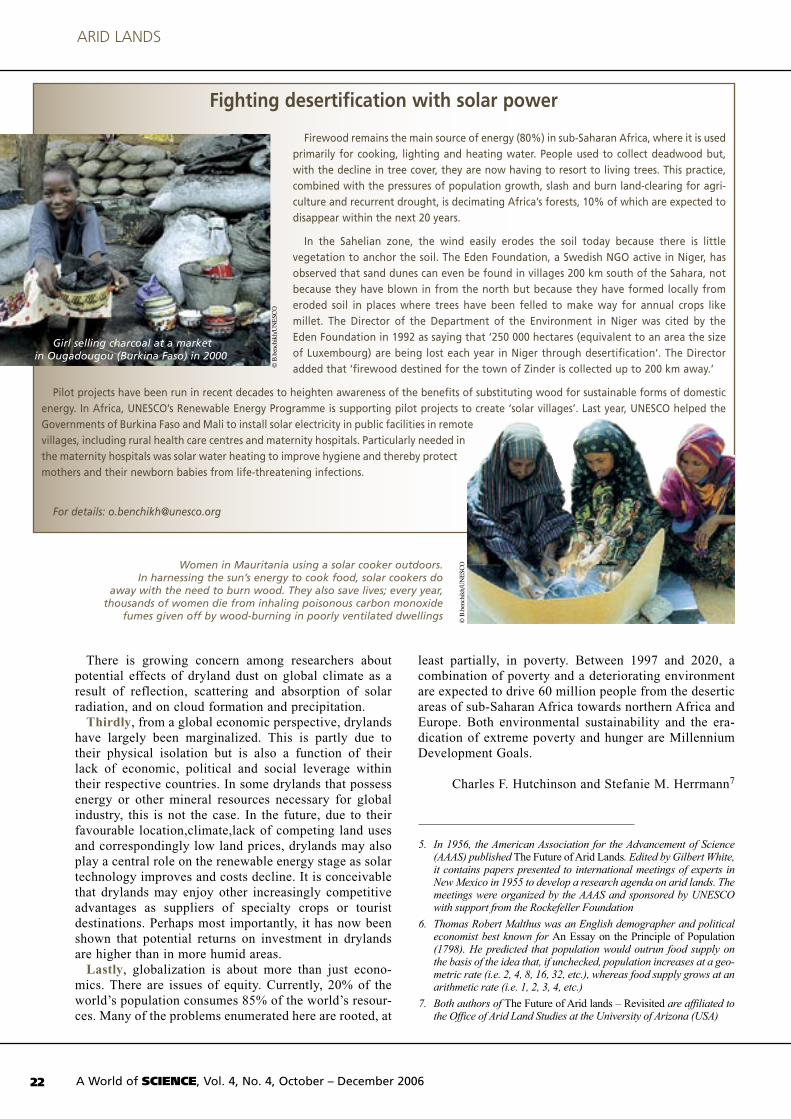
There is growing concern among researchers about potential effects of dryland dust on global climate as a result of reflection, scattering and absorption of solar radiation, and on cloud formation and precipitation.
Thirdly, from a global economic perspective, drylands have largely been marginalized. This is partly due to their physical isolation but is also a function of their lack of economic, political and social leverage within their respective countries. In some drylands that possess energy or other mineral resources necessary for global industry, this is not the case. In the future, due to their favourable location,climate,lack of competing land uses and correspondingly low land prices, drylands may also play a central role on the renewable energy stage as solar technology improves and costs decline. It is conceivable that drylands may enjoy other increasingly competitive advantages as suppliers of specialty crops or tourist destinations. Perhaps most importantly, it has now been shown that potential returns on investment in drylands are higher than in more humid areas.
Lastly, globalization is about more than just econo-mics. There are issues of equity. Currently, 20% of the world’s population consumes 85% of the world’s resour-ces. Many of the problems enumerated here are rooted, at
least partially, in poverty. Between 1997 and 2020, a combination of poverty and a deteriorating environment are expected to drive 60 million people from the desertic areas of sub-Saharan Africa towards northern Africa and Europe. Both environmental sustainability and the era-dication of extreme poverty and hunger are Millennium Development Goals.
Charles F. Hutchinson and Stefanie M. Herrmann7
Women in Mauritania using a solar cooker outdoors. In harnessing the sun’s energy to cook food, solar cookers do
away with the need to burn wood. They also save lives; every year, thousands of women die from inhaling poisonous carbon monoxide
fumes given off by wood-burning in poorly ventilated dwellings
Fighting desertification with solar power
Firewood remains the main source of energy (80%) in sub-Saharan Africa, where it is used primarily for cooking, lighting and heating water. People used to collect deadwood but, with the decline in tree cover, they are now having to resort to living trees. This practice, combined with the pressures of population growth, slash and burn land-clearing for agri-culture and recurrent drought, is decimating Africa’s forests, 10% of which are expected to disappear within the next 20 years.
In the Sahelian zone, the wind easily erodes the soil today because there is little vegetation to anchor the soil. The Eden Foundation, a Swedish NGO active in Niger, has observed that sand dunes can even be found in villages 200 km south of the Sahara, not because they have blown in from the north but because they have formed locally from eroded soil in places where trees have been felled to make way for annual crops like millet. The Director of the Department of the Environment in Niger was cited by the Eden Foundation in 1992 as saying that ‘250 000 hectares (equivalent to an area the size of Luxembourg) are being lost each year in Niger through desertification’. The Director added that ‘firewood destined for the town of Zinder is collected up to 200 km away.’
Pilot projects have been run in recent decades to heighten awareness of the benefits of substituting wood for sustainable forms of domestic energy. In Africa, UNESCO’s Renewable Energy Programme is supporting pilot projects to create ‘solar villages’. Last year, UNESCO helped the Governments of Burkina Faso and Mali to install solar electricity in public facilities in remote villages, including rural health care centres and maternity hospitals. Particularly needed in the maternity hospitals was solar water heating to improve hygiene and thereby protect mothers and their newborn babies from life-threatening infections.
For details: [email protected]
5. In 1956, the American Association for the Advancement of Science (AAAS) published The Future of Arid Lands. Edited by Gilbert White, it contains papers presented to international meetings of experts in New Mexico in 1955 to develop a research agenda on arid lands. The meetings were organized by the AAAS and sponsored by UNESCO with support from the Rockefeller Foundation
6. Thomas Robert Malthus was an English demographer and political economist best known for An Essay on the Principle of Population (1798). He predicted that population would outrun food supply on the basis of the idea that, if unchecked, population increases at a geo-metric rate (i.e. 2, 4, 8, 16, 32, etc.), whereas food supply grows at an arithmetic rate (i.e. 1, 2, 3, 4, etc.)
7. Both authors of The Future of Arid lands – Revisited are affiliated to the Office of Arid Land Studies at the University of Arizona (USA)
Girl selling charcoal at a market in Ougadougou (Burkina Faso) in 2000
A World of SCIENCE, Vol. 4, No. 4, October – December 200622
ARID LANDS
© B
.ben
chik
h/U
NE
SCO
© B
.ben
chik
h/U
NE
SCO

23
Alassane Agalassou is employed by the Agency for the Development of Rural Electrification and DomesticEnergy (AMADER) in Bamako (Mali) to give peri-urbanand rural populations better access to modern electricalservices, such as home lighting, refrigeration, televisionand radio. ‘AMADER is facing the vital challenge ofbringing modernity and hope to the majority of Maliansthrough its decentralized electrification programme’,Agalassou explains. ‘You must understand that, in mycountry, only about 10% of the 11 million inhabitants livein communities with electricity’.
Agalassou intends to use his new knowledge of the economic and technological aspects of solar photovoltaicconversion to design and implement projects that willimprove living conditions and health by making foodproduction and conservation more efficient and morehygienic in a country where temperatures can soar intothe forties.
The summer school targets men and women withtechnical or university training who are involved directly orindirectly in decentralized electrification using solarenergy. The training programme covers both theoretical andapplied aspects of solar energy conversion and is taughtboth by experts and by representatives of industry andspecialized institutions.
Initially, the summer school included visits to researchcentres, industries and installations in France only. Since1992, the financial and practical support of external partnershas made it possible to venture as far afield as Belgium,Germany, Spain, Italy and Morocco for a series of technicalvisits which last a week on average. The remainder of thecourse is taught at UNESCO Headquarters in Paris.
The solar school
Alassane Agalassou is one of 26 technicians, engineers andproject personnel designated by their governments orinstitutions to take part in this year’s edition of UNESCO’sannual summer school organized over a three-week periodevery July. This year’s theme was Solar Electricity for Rural andRemote Areas. In tandem with a series of regional workshops,these annual ‘schools’ on solar electricity are helping to trainskilled personnel, boost public awareness and promoterelevant energy policies.
A World of SCIENCE, Vol. 2, No. 4, October–December 2004
© O
sman
Ben
chik
h/U
NE
SCO
© O
sman
Ben
chik
h/U
NE
SCO
Participants learning to use sizing software to determine theexact energy needed for a given project, during a one-daypractical session at this year’s solar school
Practical training to assess solar radiation and simulate a solarinstallation. This session was organized at the CDER inMorocco during the 2001 summer school
Over the past 15 years, over 500 trainees have ‘graduated’ from the summerschool. They have gone on to become trainers themselves in more than50 countries situated mainly in Africa but also in Europe and beyond,including Bolivia, Brazil, Canada, Colombia, Germany, Guatemala,Lebanon, Turkey and Vietnam.
Electrical cabling of solar panels and theinstallation of solar systems by participants aspart of practical field-work organized by UNESCOin Bamako (Mali) in 2003
RENEWABLE ENERGY

A World of SCIENCE, Vol. 2, No. 4, October–December 2004 24
Modules à la carte
The course is structured by modules to enable specialistsfrom different fields to choose the lecture of interest tothem à la carte. Decision-makers, energy managers andothers are thus able to choose whether they participate in aspecific aspect of practical work, in a technical visit or in a given roundtable discussion.
Mahamat Oumara from Tchad is grateful to have refinedhis knowledge of photovoltaic technologies. But for him, thecontacts he has made through the summer school areequally valauble. His only regret is that, ‘if we had betterequipment in our own laboratories to test essentialmaterials, we could do a better job of spreading thetechnology.’
‘One of the greatest obtacles to developing renewableenergies in our countries’, Oumara adds, ‘is the dearth ofrelevant information at all levels. This affects not onlydecision-makers and users but also those engineers andtechnicians who lack the necessary know-how. The localrural population would benefit from well-trained projectmanagers’, he notes. ‘Good project management extends asystem’s lifespan and leads to cost-savings, not to mentionbetter use and maintenance of the systems once these areinstalled. Similarly, a good engineer will design a betterproject and thereby increase the chances of attractingfunding. He or she will also tailor the system better to theneeds of the end-user, which can translate into cost-savings for the rural population’.
Demystifying solar energy
Along with three other French industrialists, RenéDesserrières of French Solar Manufacturers Photowatt haslectured at the school for the past three years. ‘We alwaysknow about 20% of students,’ he says ‘which can make foranimated discussions about existing installations andcomponent parts between manufacturers and users, whoreally get down to the nitty-gritty.’
Desserrières explains that the summer school is anexcellent complement to other training activities which aremore closely linked to specific projects. ‘The UNESCOcourse is given in another spirit,’ he says. ‘It aims at a higherlevel of engineer and technician. Despatched by theircountries or a local or regional institution, these youngpeople will eventually play an important role in designingand implementing rational energy policies, hopefullyavoiding the errors of the past when it comes to planning andproject management in particular. The summer schoolpromotes a realistic approach which debunks the myths anddemystifies solar energy’. He observes that, ‘Both sides needto treat one another like partners. Some experts in developingcountries regard us as nothing more than the suppliers of atechnology they would like to see transferred without delay.’
What is solar energy?
Solar electricity is the result of the photo-electric (orphotovoltaic) effect discovered in 1839 by the Frenchphysicist Edmond Becquerel. Photovoltaic cells convertthe luminous energy of the sun into electricity. Most ofthe solar cells used are actually made of silicon.
Photovoltaic cells produce a voltage of approximately0.6 volts (V) which is not dependent on the surface ofthe cell, unlike the electric current produced. To obtaina higher voltage, cells are linked up in a series to makea module which is the sum of the individual cells. Themodules produce an unbroken current, the standardvoltage for a commercialised module being 12 V.Depending on the installation needs, the modules canbe connected in series to obtain a higher voltage. Themost frequent voltages used in photovoltaicinstallations are 12 V, 24 V and 48 V. In general, thepower produced by the modules is expressed in Watts(W), which corresponds to 10 W, 50 W, 75 W or 120 Wfor the commercialized ones.
In the early 1960s, solar conversion took off thanks tospatial applications. Since then, solar energy hasexpanded to include such applications as rural anddecentralized electrification, water pumping and healthand telecommunications; in other words, it goeseverywhere the electricity network does not.
At isolated sites, the average cost of a complete solarinstallation (including batteries for storage) variesbetween 15 euros (excluding TVA) per Watt (for powerof 1.5–2 kW) and 40 euros per Watt (for 200–400 W).
Solar-powered refrigerator used to conservevaccines in health-care centres in rural and isolatedareas. This technology was one of the subjects ofthis year’s solar school
© O
sman
Ben
chik
h/U
NE
SCO
RENEWABLE ENERGY

25A World of SCIENCE, Vol. 2, No. 4, October–December 2004
For Desserrières, the manufacture of photovoltaic cellsremains too sophisticated and costly to transfer. ‘Never-theless,’ he relativises, ‘developing countries can produceother components and, by developing solar electricity, reap80% of the benefits, create jobs and improve the standard ofliving in their rural communities.’
Many regional institutions send engineers andtechnicians to UNESCO’s summer school. These includethe Centre for the Development of Renewable Energies(CDER) in Algiers (Algeria) and the National Centre forScientific and Technical Research (CNRST) in Rabat(Morocco). ‘For our higher level people,’ says AbdelazizBennouna, head of the renewable energy laboratory atCNRST, ‘the course is excellent from many points ofview; it keeps us abreast of what is going on in the field,we meet key people, form contacts with top-level facultymembers and, last but not least, meet specialists fromother regions’.
People are in the market for energy
Almost two billion people in rural Africa and elsewherestill lack access to basic electrical services. ‘It is very sadto see, in this new millennium, most of the rural populationin the developing world still using candles and petrollamps’, laments Bennouna. He regrets the lack oftechnological autonomy in even those countries which useand apply renewable energies on a massive scale. ForBennouna, ‘solar cells and silicon are unfortunately notgoing to be produced and manufactured in the foreseeablefuture. The industrial process for solar cell production
Sizing of asolar system andsimulation of an electricbreakdown during the practical trainingorganized as part of the 2001 solar school
Using a platform tosimulate a solarsystem in 2002.
This trainingplatform wasdeveloped by
UNESCO incollaboration
with theFrench
agency,ADEME
Participants visiting a small solar power station on one ofseveral technical visits organized in Spain during the 2001
summer school on the same theme of ‘solar electricity for ruraland remote areas’
© O
sman
Ben
chik
h/U
NE
SCO
© O
sman
Ben
chik
h/U
NE
SCO
© O
sman
Ben
chik
h/U
NE
SCO
calls for high technological know-how and sophisticatedtechnology that needs a large market to be profitable andeconomically viable. ‘
‘This said’, he adds, ‘enormous progress has been made.In some countries today, solar system components arebeing locally manufactured, commercialized and evenexported. In Morocco for instance, solar systems are sold inthe market-place by local merchants along with fruit, spicesand other goods. Mentalities have changed. People are nowin the market for energy; they are purchasing their own‘solar kits’ in much the same way they would buy atelevision set or refrigerator. This is one way in which solartechnology is trickling down to the end-user and becominga household name’.
Osman Benchikh
For details: [email protected];
www.unesco.org/science/bes

A World of SCIENCE, Vol. 2, No. 4, October–December 2004 26
Neither the escalating price of oil8, nor theproblems linked to its geostrategic importanceseems to have caused an ‘electroshock’ in theinternational community in Bonn. Does that makethe conference only a semi-success?
Bonn may yet prove to have been a milestone in the historyof renewable energy. Representatives of 154 countries,including 120 Ministers and several Heads of State, satdown in Bonn to discuss renewable energy issues. In thatsense, the conference did meet its objectives by raisingpublic awareness. Bonn has shown that the internationalcommunity is now seriously considering renewable energyas a rational and credible alternative. This growingawareness has led the international community, and thedeveloped countries in particular, to make a firm
commitment to renewable energyin recent years. In Europe,
wind power grew by morethan 35% annually between1996 and 2003; last year,
the photovoltaic sectorgrew by 33%. Today, the European renewableenergy industry has aturnover of 10 billion
euros and employs200 000 people.
It is true that the final outcome of the Bonn Conference –the political declaration – is weak. Concrete commitmentsare still missing and it sets no targets. I do believe, though,that the history of humanity is a fairly long process and thatsome countries are simply not yet ready to make a moreambitious commitment.
If I may go back for a moment to the World Summit onSustainable Development, in order to set targets, the Summitidentified five key areas for sustainable development: water,energy, health, agriculture and biodiversity. Two years on,what are we saying? That energy is a key component ofdevelopment and that, if countries are serious about sustain-able development, be they developing or developed, they haveno choice but to consider renewable energy as an essentialelement of sustainable development. The very act of organiz-ing this conference, which has drawn a massive participationby government representatives, makes it a success in my eyes.
Could some of those countries which are not yetready to commit be thinking of nuclear power asan alternative to oil?
I don’t think so. In any case, as much as 56% of oil isabsorbed by transportation and you can’t propel a planewith nuclear power – at least for the time being. Even ifelectric buses and cars do exist, they remain a rare sightbecause they can only operate over short distances.
Don’t forget that the technology and use of nuclearenergy call for know-how and capital that remain accessibleto only a small number of industrialized countries.
With global oil consumption expected to rise by 2.5 million barrels a day this year, largely due to China’sgrowing needs, and with oil production struggling to keep up with demand, last June’s conference onrenewable energies in Bonn could not have come at a better time.
In his opening remarks, German Federal Minister for the Environment Jürgen Trittin declared that ‘the age ofrenewables has now begun’. Germany has been the undisputed world leader in wind energy since the early1990s, solar energy being dominated by Japan. In Bonn, Germany reaffirmed its determination to help coun-tries of the South adopt clean forms of energy by pledging to add a further US$500 million per year for fiveyears in interest-free loans to the US$1 billion announced two years earlier at the World Summit on SustainableDevelopment – almost as much as the World Bank. This spectacular initiative is one of many commitments torenewable energy made in Bonn by individual countries, including the Philippines and China, evoked below.
But should we rejoice at a declaration adopted by 154 governments which contents itself with noting thetargets individual countries have set themselves rather than fixing any financial targets of its own?Responsible for renewable energy at UNESCO, Osman Benchikh has his own views on the subject.
Osman Benchikh‘The age of renewables has now begun’
Osman Benchikh
8. The price of oil had already climbed to over US$40 a barrel by the time the Bonnconference took place. By 20 August, it was nudging towards US$50, a 50%increase since the beginning of the year
RENEWABLE ENERGY
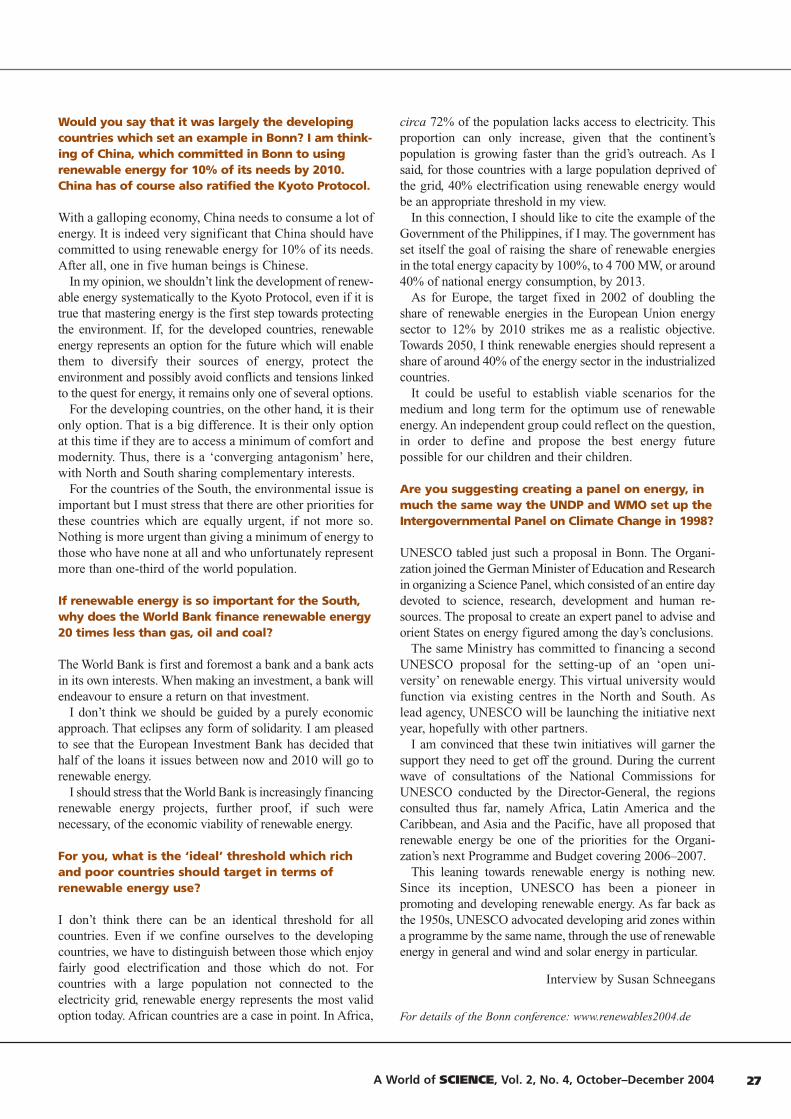
A World of SCIENCE, Vol. 2, No. 4, October–December 2004
Would you say that it was largely the developingcountries which set an example in Bonn? I am think-ing of China, which committed in Bonn to usingrenewable energy for 10% of its needs by 2010.China has of course also ratified the Kyoto Protocol.
With a galloping economy, China needs to consume a lot ofenergy. It is indeed very significant that China should havecommitted to using renewable energy for 10% of its needs.After all, one in five human beings is Chinese.
In my opinion, we shouldn’t link the development of renew-able energy systematically to the Kyoto Protocol, even if it istrue that mastering energy is the first step towards protectingthe environment. If, for the developed countries, renewableenergy represents an option for the future which will enablethem to diversify their sources of energy, protect theenvironment and possibly avoid conflicts and tensions linkedto the quest for energy, it remains only one of several options.
For the developing countries, on the other hand, it is theironly option. That is a big difference. It is their only optionat this time if they are to access a minimum of comfort andmodernity. Thus, there is a ‘converging antagonism’ here,with North and South sharing complementary interests.
For the countries of the South, the environmental issue isimportant but I must stress that there are other priorities forthese countries which are equally urgent, if not more so.Nothing is more urgent than giving a minimum of energy tothose who have none at all and who unfortunately representmore than one-third of the world population.
If renewable energy is so important for the South,why does the World Bank finance renewable energy20 times less than gas, oil and coal?
The World Bank is first and foremost a bank and a bank actsin its own interests. When making an investment, a bank willendeavour to ensure a return on that investment.
I don’t think we should be guided by a purely economicapproach. That eclipses any form of solidarity. I am pleasedto see that the European Investment Bank has decided thathalf of the loans it issues between now and 2010 will go torenewable energy.
I should stress that the World Bank is increasingly financingrenewable energy projects, further proof, if such werenecessary, of the economic viability of renewable energy.
For you, what is the ‘ideal’ threshold which richand poor countries should target in terms ofrenewable energy use?
I don’t think there can be an identical threshold for allcountries. Even if we confine ourselves to the developingcountries, we have to distinguish between those which enjoyfairly good electrification and those which do not. Forcountries with a large population not connected to theelectricity grid, renewable energy represents the most validoption today. African countries are a case in point. In Africa,
circa 72% of the population lacks access to electricity. Thisproportion can only increase, given that the continent’spopulation is growing faster than the grid’s outreach. As Isaid, for those countries with a large population deprived ofthe grid, 40% electrification using renewable energy wouldbe an appropriate threshold in my view.
In this connection, I should like to cite the example of theGovernment of the Philippines, if I may. The government hasset itself the goal of raising the share of renewable energiesin the total energy capacity by 100%, to 4 700 MW, or around40% of national energy consumption, by 2013.
As for Europe, the target fixed in 2002 of doubling theshare of renewable energies in the European Union energysector to 12% by 2010 strikes me as a realistic objective.Towards 2050, I think renewable energies should represent ashare of around 40% of the energy sector in the industrializedcountries.
It could be useful to establish viable scenarios for themedium and long term for the optimum use of renewableenergy. An independent group could reflect on the question,in order to define and propose the best energy futurepossible for our children and their children.
Are you suggesting creating a panel on energy, inmuch the same way the UNDP and WMO set up theIntergovernmental Panel on Climate Change in 1998?
UNESCO tabled just such a proposal in Bonn. The Organi-zation joined the German Minister of Education and Researchin organizing a Science Panel, which consisted of an entire daydevoted to science, research, development and human re-sources. The proposal to create an expert panel to advise andorient States on energy figured among the day’s conclusions.
The same Ministry has committed to financing a secondUNESCO proposal for the setting-up of an ‘open uni-versity’ on renewable energy. This virtual university wouldfunction via existing centres in the North and South. Aslead agency, UNESCO will be launching the initiative nextyear, hopefully with other partners.
I am convinced that these twin initiatives will garner thesupport they need to get off the ground. During the currentwave of consultations of the National Commissions forUNESCO conducted by the Director-General, the regionsconsulted thus far, namely Africa, Latin America and theCaribbean, and Asia and the Pacific, have all proposed thatrenewable energy be one of the priorities for the Organi-zation’s next Programme and Budget covering 2006–2007.
This leaning towards renewable energy is nothing new.Since its inception, UNESCO has been a pioneer inpromoting and developing renewable energy. As far back asthe 1950s, UNESCO advocated developing arid zones withina programme by the same name, through the use of renewableenergy in general and wind and solar energy in particular.
Interview by Susan Schneegans
For details of the Bonn conference: www.renewables2004.de
27

On the face of it, this may seem like nothing new, since many international organizations and programmes are already working to sustain and improve co-ordination of Earth observation systems, such as within the Integrated Global Observing Strategy partnership. However, efforts have been hindered up to now by an ambivalent attitude on the part of governments. Even in the wealthiest countries, technical infrastructure has been eroding for want of a sus-tained commitment to Earth observation and space agencies have been feeling the pinch.
Times are changing. Governments are coming to appreci-ate the importance of Earth observation for planning sustain-able development. This first became apparent at the World Summit on Sustainable Development in Johannesburg (South Africa) in 2002. The G8 meeting in France in June 2003 then went on to identify Earth observation as the high-est scientific priority for the coming years. This in turn led to the first Earth Observation Summit in Washington (USA) the following month where 33 countries and the European Commission committed to preparing a 10-year implemen-tation plan.
A technical Group on Earth Observations (GEO) was formed. Co-chaired by the USA, European Commission, Japan and South Africa, and joined by more than 21 international organizations including UNESCO and its Intergovernmental Oceanographic Commision (IOC), the GEO is to prepare the implementation plan. Now that the Framework has been approved, the next step will be for the GEO to translate this document into a detailed plan for presentation to the third Earth Observation Summit in February 2005.
GEOSS will build on existing systems, including those of individual nations, the joint Global Monitoring for Environment and Security of the European Union and European Space Agency, and initiatives within the United Nations system.
Half of the 47 governments at last April’s Summit rep-resented developing countries. This is logical because countries of diverse financial means have invested in Earth observation satellites, from the USA, Japan and France to India, China, Vietnam, Argentina, Brazil, Algeria, South
Africa and, most recently, Nigeria. Since launching the Low Earth Orbit remote sens-ing micro-satellite Nigeria Sat-1 last October to monitor the envi-ronment and provide information for infrastructure development, Nigeria has been welcomed into the fold of the Disaster Monitoring Constellation grouping Algeria, China, the UK and Vietnam. Natural hazards being unpredictable phenomena, member-ship of the constellation multiplies each country’s chances of being overflown by one of the five satellites at the ‘right’ moment and thereby of reducing reaction time.
It is also logical that countries which do not possess their own satellites should be part of GEOSS. For one thing, they are regularly overflown and remotely sensed by satellites yet currently have only limited access to the data collected, a situation obviously unsatisfactory for them but also for developed countries which themselves have a stake in making Earth observation more inclusive. If we are to understand the natural processes involved in such long-term phenomena as climate variability, desertification or natural hazards and improve prediction, this will demand comprehensive, sustained global observation both by satel-lites and in situ (on land and at sea) over several centuries. We know from instrumental records dating back to 1861, for example, that the increase in surface temperatures in the Northern Hemisphere during the 20th century surpassed that of any other century for at least 1000 years. But we are hampered in making a global assessment by the fact that insufficient records exist for the Southern Hemisphere.
‘For GEOSS to achieve its objectives’, Ambassador Ben Ngubane of South Africa told the April Summit, ‘it is vital that membership include more representatives from deve-loping countries [...] Integration of regional initiatives such as NEPAD into the development of GEOSS will be critical in this regard. It is ultimately essential for the GEO to inter-rogate and resolve issues such as the availability of Earth observation data to developing countries at minimum and affordable costs.’
GLOBAL OBSERVING SYSTEMS
A World of SCIENCE, Vol. 2, No. 3, July–September 200428
A system for managing the planet by 2015
On 25 April 2004, the second Earth Observation Summit in Tokyo (Japan) moved a step closer to a global information system for ‘managing the planet’ with the adoption by Ministers of the Framework for a 10-year implementation plan. While not legally binding, the Framework represents a strong political commitment by 47 governments and the European Commission to putting in place comprehensive, co-ordinated and sustained observation of the Earth by 2015 within a Global Earth Observation System of Systems (GEOSS).
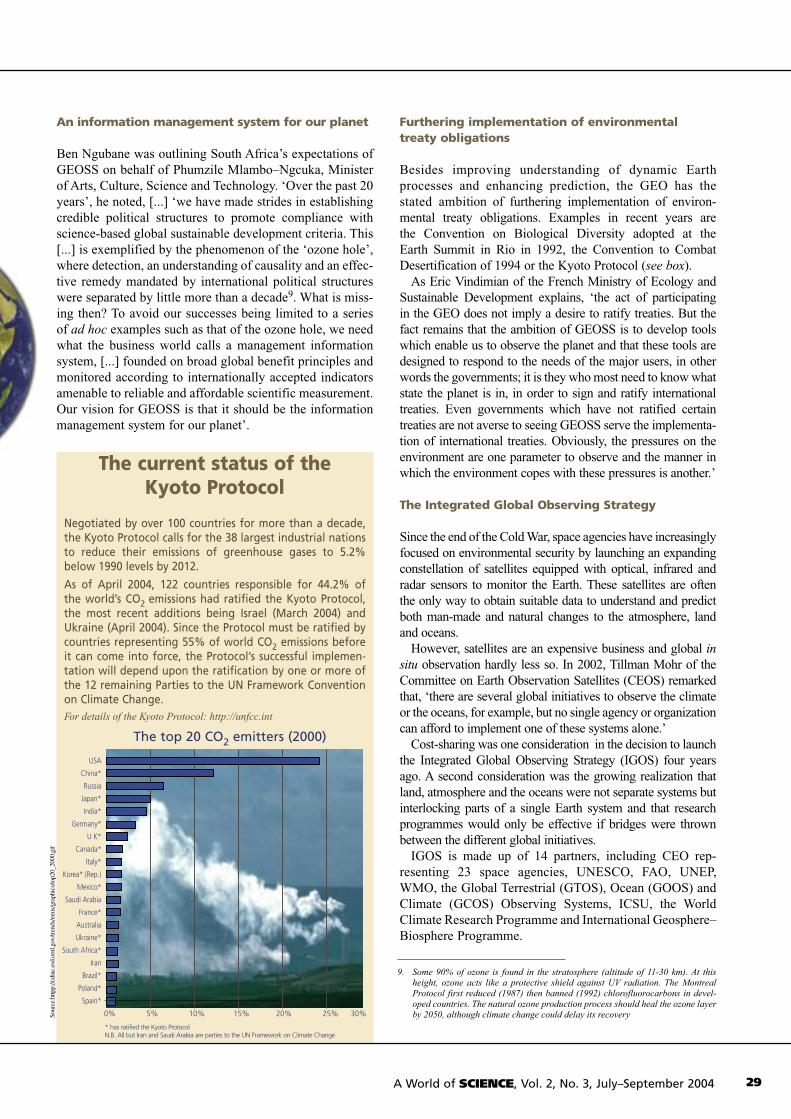
An information management system for our planet
Ben Ngubane was outlining South Africa’s expectations of GEOSS on behalf of Phumzile Mlambo–Ngcuka, Minister of Arts, Culture, Science and Technology. ‘Over the past 20 years’, he noted, [...] ‘we have made strides in establishing credible political structures to promote compliance with science-based global sustainable development criteria. This [...] is exemplified by the phenomenon of the ‘ozone hole’, where detection, an understanding of causality and an effec-tive remedy mandated by international political structures were separated by little more than a decade9. What is miss-ing then? To avoid our successes being limited to a series of ad hoc examples such as that of the ozone hole, we need what the business world calls a management information system, [...] founded on broad global benefit principles and monitored according to internationally accepted indicators amenable to reliable and affordable scientific measurement. Our vision for GEOSS is that it should be the information management system for our planet’.
Furthering implementation of environmental treaty obligations
Besides improving understanding of dynamic Earth processes and enhancing prediction, the GEO has the stated ambition of furthering implementation of environ-mental treaty obligations. Examples in recent years are the Convention on Biological Diversity adopted at the Earth Summit in Rio in 1992, the Convention to Combat Desertification of 1994 or the Kyoto Protocol (see box).
As Eric Vindimian of the French Ministry of Ecology and Sustainable Development explains, ‘the act of participating in the GEO does not imply a desire to ratify treaties. But the fact remains that the ambition of GEOSS is to develop tools which enable us to observe the planet and that these tools are designed to respond to the needs of the major users, in other words the governments; it is they who most need to know what state the planet is in, in order to sign and ratify international treaties. Even governments which have not ratified certain treaties are not averse to seeing GEOSS serve the implementa-tion of international treaties. Obviously, the pressures on the environment are one parameter to observe and the manner in which the environment copes with these pressures is another.’
The Integrated Global Observing Strategy
Since the end of the Cold War, space agencies have increasingly focused on environmental security by launching an expanding constellation of satellites equipped with optical, infrared and radar sensors to monitor the Earth. These satellites are often the only way to obtain suitable data to understand and predict both man-made and natural changes to the atmosphere, land and oceans.
However, satellites are an expensive business and global in situ observation hardly less so. In 2002, Tillman Mohr of the Committee on Earth Observation Satellites (CEOS) remarked that, ‘there are several global initiatives to observe the climate or the oceans, for example, but no single agency or organization can afford to implement one of these systems alone.’
Cost-sharing was one consideration in the decision to launch the Integrated Global Observing Strategy (IGOS) four years ago. A second consideration was the growing realization that land, atmosphere and the oceans were not separate systems but interlocking parts of a single Earth system and that research programmes would only be effective if bridges were thrown between the different global initiatives.
IGOS is made up of 14 partners, including CEO rep-resenting 23 space agencies, UNESCO, FAO, UNEP, WMO, the Global Terrestrial (GTOS), Ocean (GOOS) and Climate (GCOS) Observing Systems, ICSU, the World Climate Research Programme and International Geosphere–Biosphere Programme.
Sour
ce:h
ttpp:
//cdi
ac.e
sd.o
rnl.g
ov/tr
ends
/em
is/g
raph
ics/
top2
0_20
00.g
if
29A World of SCIENCE, Vol. 2, No. 3, July–September 2004
The current status of the Kyoto Protocol
Negotiated by over 100 countries for more than a decade, the Kyoto Protocol calls for the 38 largest industrial nations to reduce their emissions of greenhouse gases to 5.2% below 1990 levels by 2012.
As of April 2004, 122 countries responsible for 44.2% of the world’s CO2 emissions had ratified the Kyoto Protocol, the most recent additions being Israel (March 2004) and Ukraine (April 2004). Since the Protocol must be ratified by countries representing 55% of world CO2 emissions before it can come into force, the Protocol’s successful implemen-tation will depend upon the ratification by one or more of the 12 remaining Parties to the UN Framework Convention on Climate Change.For details of the Kyoto Protocol: http://unfcc.int
USA
China*
Russia
Japan*
India*
Germany*
U K*
Canada*
Italy*
Korea* (Rep.)
Mexico*
Saudi Arabia
France*
Australia
Ukraine*
South Africa*
Iran
Brazil*
Poland*
Spain*
* has ratified the Kyoto ProtocolN.B. All but Iran and Saudi Arabia are parties to the UN Framework on Climate Change
9. Some 90% of ozone is found in the stratosphere (altitude of 11-30 km). At this height, ozone acts like a protective shield against UV radiation. The Montreal Protocol first reduced (1987) then banned (1992) chlorofluorocarbons in devel-oped countries. The natural ozone production process should heal the ozone layer by 2050, although climate change could delay its recovery0% 5% 10% 15% 20% 25% 30%
The top 20 CO2 emitters (2000)
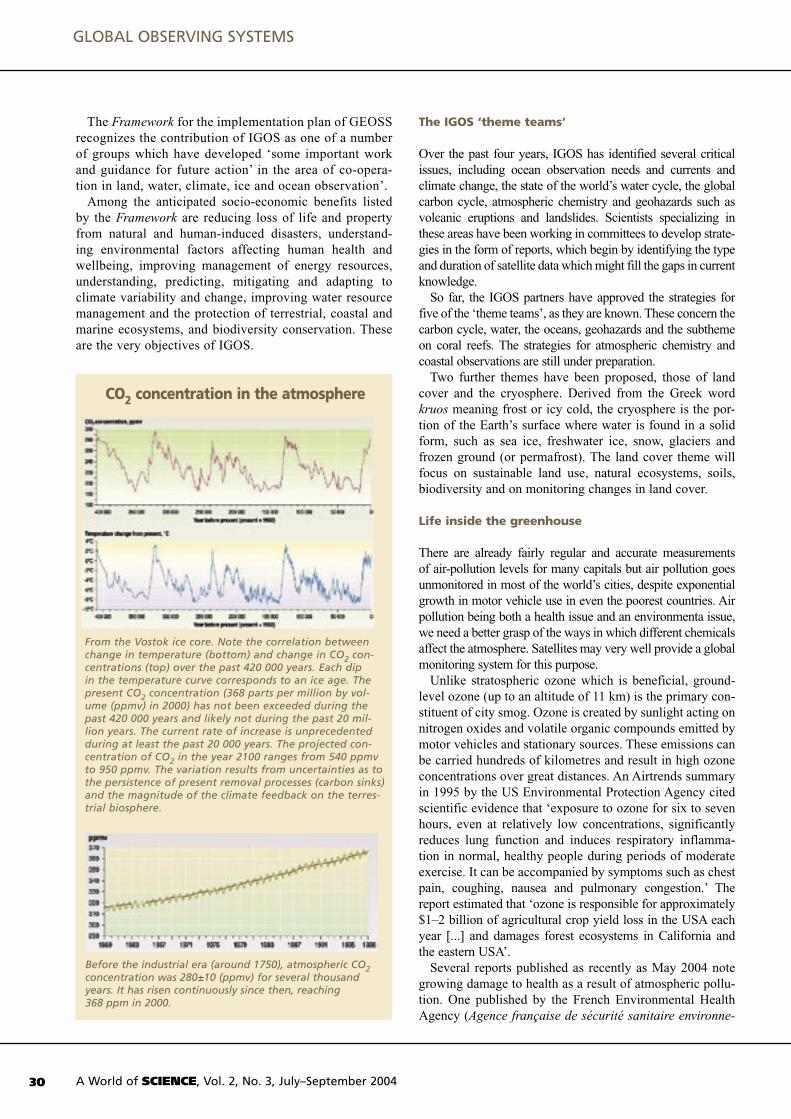
The Framework for the implementation plan of GEOSS recognizes the contribution of IGOS as one of a number of groups which have developed ‘some important work and guidance for future action’ in the area of co-opera-tion in land, water, climate, ice and ocean observation’.
Among the anticipated socio-economic benefits listed by the Framework are reducing loss of life and property from natural and human-induced disasters, understand-ing environmental factors affecting human health and wellbeing, improving management of energy resources, understanding, predicting, mitigating and adapting to climate variability and change, improving water resource management and the protection of terrestrial, coastal and marine ecosystems, and biodiversity conservation. These are the very objectives of IGOS.
The IGOS ‘theme teams’
Over the past four years, IGOS has identified several critical issues, including ocean observation needs and currents and climate change, the state of the world’s water cycle, the global carbon cycle, atmospheric chemistry and geohazards such as volcanic eruptions and landslides. Scientists specializing in these areas have been working in committees to develop strate-gies in the form of reports, which begin by identifying the type and duration of satellite data which might fill the gaps in current knowledge.
So far, the IGOS partners have approved the strategies for five of the ‘theme teams’, as they are known. These concern the carbon cycle, water, the oceans, geohazards and the subtheme on coral reefs. The strategies for atmospheric chemistry and coastal observations are still under preparation.
Two further themes have been proposed, those of land cover and the cryosphere. Derived from the Greek word kruos meaning frost or icy cold, the cryosphere is the por-tion of the Earth’s surface where water is found in a solid form, such as sea ice, freshwater ice, snow, glaciers and frozen ground (or permafrost). The land cover theme will focus on sustainable land use, natural ecosystems, soils, biodiversity and on monitoring changes in land cover.
Life inside the greenhouse
There are already fairly regular and accurate measurements of air-pollution levels for many capitals but air pollution goes unmonitored in most of the world’s cities, despite exponential growth in motor vehicle use in even the poorest countries. Air pollution being both a health issue and an environmenta issue, we need a better grasp of the ways in which different chemicals affect the atmosphere. Satellites may very well provide a global monitoring system for this purpose.
Unlike stratospheric ozone which is beneficial, ground-level ozone (up to an altitude of 11 km) is the primary con-stituent of city smog. Ozone is created by sunlight acting on nitrogen oxides and volatile organic compounds emitted by motor vehicles and stationary sources. These emissions can be carried hundreds of kilometres and result in high ozone concentrations over great distances. An Airtrends summary in 1995 by the US Environmental Protection Agency cited scientific evidence that ‘exposure to ozone for six to seven hours, even at relatively low concentrations, significantly reduces lung function and induces respiratory inflamma-tion in normal, healthy people during periods of moderate exercise. It can be accompanied by symptoms such as chest pain, coughing, nausea and pulmonary congestion.’ The report estimated that ‘ozone is responsible for approximately $1–2 billion of agricultural crop yield loss in the USA each year [...] and damages forest ecosystems in California and the eastern USA’.
Several reports published as recently as May 2004 note growing damage to health as a result of atmospheric pollu-tion. One published by the French Environmental Health Agency (Agence française de sécurité sanitaire environne-
A World of SCIENCE, Vol. 2, No. 3, July–September 200430
From the Vostok ice core. Note the correlation between change in temperature (bottom) and change in CO2 con-centrations (top) over the past 420 000 years. Each dip in the temperature curve corresponds to an ice age. The present CO2 concentration (368 parts per million by vol-ume (ppmv) in 2000) has not been exceeded during the past 420 000 years and likely not during the past 20 mil-lion years. The current rate of increase is unprecedented during at least the past 20 000 years. The projected con-centration of CO2 in the year 2100 ranges from 540 ppmv to 950 ppmv. The variation results from uncertainties as to the persistence of present removal processes (carbon sinks) and the magnitude of the climate feedback on the terres-trial biosphere.
Before the industrial era (around 1750), atmospheric CO2 concentration was 280±10 (ppmv) for several thousand years. It has risen continuously since then, reaching 368 ppm in 2000.
CO2 concentration in the atmosphere
GLOBAL OBSERVING SYSTEMS
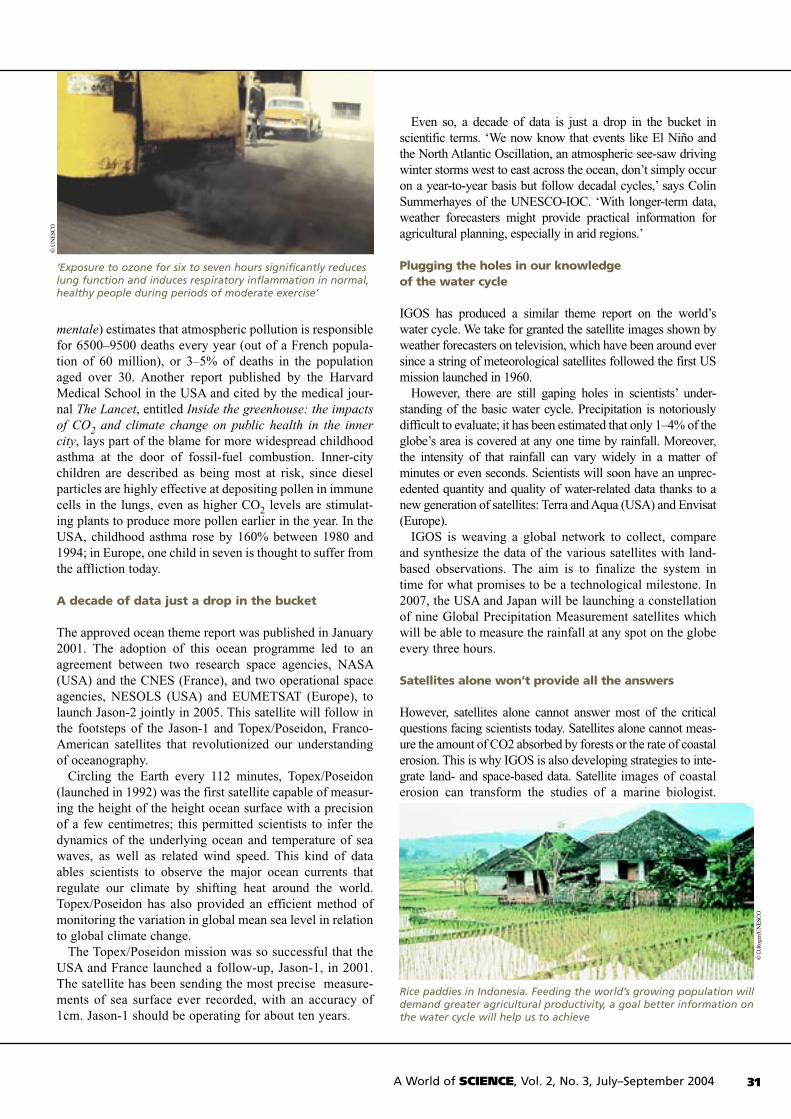
mentale) estimates that atmospheric pollution is responsible for 6500–9500 deaths every year (out of a French popula-tion of 60 million), or 3–5% of deaths in the population aged over 30. Another report published by the Harvard Medical School in the USA and cited by the medical jour-nal The Lancet, entitled Inside the greenhouse: the impacts of CO2 and climate change on public health in the inner city, lays part of the blame for more widespread childhood asthma at the door of fossil-fuel combustion. Inner-city children are described as being most at risk, since diesel particles are highly effective at depositing pollen in immune cells in the lungs, even as higher CO2 levels are stimulat-ing plants to produce more pollen earlier in the year. In the USA, childhood asthma rose by 160% between 1980 and 1994; in Europe, one child in seven is thought to suffer from the affliction today.
A decade of data just a drop in the bucket
The approved ocean theme report was published in January 2001. The adoption of this ocean programme led to an agreement between two research space agencies, NASA (USA) and the CNES (France), and two operational space agencies, NESOLS (USA) and EUMETSAT (Europe), to launch Jason-2 jointly in 2005. This satellite will follow in the footsteps of the Jason-1 and Topex/Poseidon, Franco- American satellites that revolutionized our understanding of oceanography.
Circling the Earth every 112 minutes, Topex/Poseidon (launched in 1992) was the first satellite capable of measur-ing the height of the height ocean surface with a precision of a few centimetres; this permitted scientists to infer the dynamics of the underlying ocean and temperature of sea waves, as well as related wind speed. This kind of data ables scientists to observe the major ocean currents that regulate our climate by shifting heat around the world. Topex/Poseidon has also provided an efficient method of monitoring the variation in global mean sea level in relation to global climate change.
The Topex/Poseidon mission was so successful that the USA and France launched a follow-up, Jason-1, in 2001. The satellite has been sending the most precise measure-ments of sea surface ever recorded, with an accuracy of 1cm. Jason-1 should be operating for about ten years.
Even so, a decade of data is just a drop in the bucket in scientific terms. ‘We now know that events like El Niño and the North Atlantic Oscillation, an atmospheric see-saw driving winter storms west to east across the ocean, don’t simply occur on a year-to-year basis but follow decadal cycles,’ says Colin Summerhayes of the UNESCO-IOC. ‘With longer-term data, weather forecasters might provide practical information for agricultural planning, especially in arid regions.’
Plugging the holes in our knowledge of the water cycle
IGOS has produced a similar theme report on the world’s water cycle. We take for granted the satellite images shown by weather forecasters on television, which have been around ever since a string of meteorological satellites followed the first US mission launched in 1960.
However, there are still gaping holes in scientists’ under-standing of the basic water cycle. Precipitation is notoriously difficult to evaluate; it has been estimated that only 1–4% of the globe’s area is covered at any one time by rainfall. Moreover, the intensity of that rainfall can vary widely in a matter of minutes or even seconds. Scientists will soon have an unprec-edented quantity and quality of water-related data thanks to a new generation of satellites: Terra and Aqua (USA) and Envisat (Europe).
IGOS is weaving a global network to collect, compare and synthesize the data of the various satellites with land-based observations. The aim is to finalize the system in time for what promises to be a technological milestone. In 2007, the USA and Japan will be launching a constellation of nine Global Precipitation Measurement satellites which will be able to measure the rainfall at any spot on the globe every three hours.
Satellites alone won’t provide all the answers
However, satellites alone cannot answer most of the critical questions facing scientists today. Satellites alone cannot meas-ure the amount of CO2 absorbed by forests or the rate of coastal erosion. This is why IGOS is also developing strategies to inte-grate land- and space-based data. Satellite images of coastal erosion can transform the studies of a marine biologist.
‘Exposure to ozone for six to seven hours significantly reduces lung function and induces respiratory inflammation in normal, healthy people during periods of moderate exercise’
Rice paddies in Indonesia. Feeding the world’s growing population will demand greater agricultural productivity, a goal better information on the water cycle will help us to achieve
© D
.Rog
er/U
NE
SCO
31A World of SCIENCE, Vol. 2, No. 3, July–September 2004
© U
NE
SCO
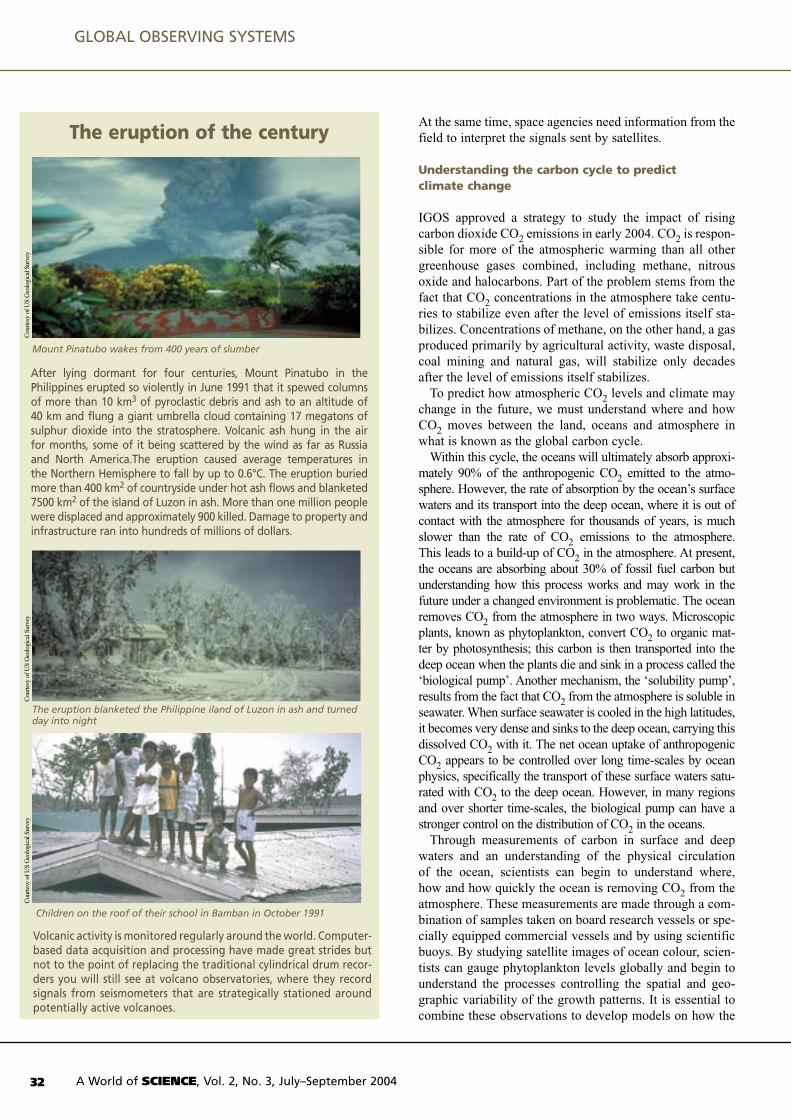
At the same time, space agencies need information from the field to interpret the signals sent by satellites.
Understanding the carbon cycle to predict climate change
IGOS approved a strategy to study the impact of rising carbon dioxide CO2 emissions in early 2004. CO2 is respon-sible for more of the atmospheric warming than all other greenhouse gases combined, including methane, nitrous oxide and halocarbons. Part of the problem stems from the fact that CO2 concentrations in the atmosphere take centu-ries to stabilize even after the level of emissions itself sta-bilizes. Concentrations of methane, on the other hand, a gas produced primarily by agricultural activity, waste disposal, coal mining and natural gas, will stabilize only decades after the level of emissions itself stabilizes.
To predict how atmospheric CO2 levels and climate may change in the future, we must understand where and how CO2 moves between the land, oceans and atmosphere in what is known as the global carbon cycle.
Within this cycle, the oceans will ultimately absorb approxi-mately 90% of the anthropogenic CO2 emitted to the atmo-sphere. However, the rate of absorption by the ocean’s surface waters and its transport into the deep ocean, where it is out of contact with the atmosphere for thousands of years, is much slower than the rate of CO2 emissions to the atmosphere. This leads to a build-up of CO2 in the atmosphere. At present, the oceans are absorbing about 30% of fossil fuel carbon but understanding how this process works and may work in the future under a changed environment is problematic. The ocean removes CO2 from the atmosphere in two ways. Microscopic plants, known as phytoplankton, convert CO2 to organic mat-ter by photosynthesis; this carbon is then transported into the deep ocean when the plants die and sink in a process called the ‘biological pump’. Another mechanism, the ‘solubility pump’, results from the fact that CO2 from the atmosphere is soluble in seawater. When surface seawater is cooled in the high latitudes, it becomes very dense and sinks to the deep ocean, carrying this dissolved CO2 with it. The net ocean uptake of anthropogenic CO2 appears to be controlled over long time-scales by ocean physics, specifically the transport of these surface waters satu-rated with CO2 to the deep ocean. However, in many regions and over shorter time-scales, the biological pump can have a stronger control on the distribution of CO2 in the oceans.
Through measurements of carbon in surface and deep waters and an understanding of the physical circulation of the ocean, scientists can begin to understand where, how and how quickly the ocean is removing CO2 from the atmosphere. These measurements are made through a com-bination of samples taken on board research vessels or spe-cially equipped commercial vessels and by using scientific buoys. By studying satellite images of ocean colour, scien-tists can gauge phytoplankton levels globally and begin to understand the processes controlling the spatial and geo-graphic variability of the growth patterns. It is essential to combine these observations to develop models on how the
The eruption of the century
After lying dormant for four centuries, Mount Pinatubo in the Philippines erupted so violently in June 1991 that it spewed columns of more than 10 km3 of pyroclastic debris and ash to an altitude of 40 km and flung a giant umbrella cloud containing 17 megatons of sulphur dioxide into the stratosphere. Volcanic ash hung in the air for months, some of it being scattered by the wind as far as Russia and North America.The eruption caused average temperatures in the Northern Hemisphere to fall by up to 0.6°C. The eruption buried more than 400 km2 of countryside under hot ash flows and blanketed 7500 km2 of the island of Luzon in ash. More than one million people were displaced and approximately 900 killed. Damage to property and infrastructure ran into hundreds of millions of dollars.
Mount Pinatubo wakes from 400 years of slumber
Cou
rtesy
of U
S G
eolo
gica
l Sur
vey
A World of SCIENCE, Vol. 2, No. 3, July–September 200432
The eruption blanketed the Philippine iland of Luzon in ash and turned day into night
Children on the roof of their school in Bamban in October 1991
Volcanic activity is monitored regularly around the world. Computer-based data acquisition and processing have made great strides but not to the point of replacing the traditional cylindrical drum recor-ders you will still see at volcano observatories, where they record signals from seismometers that are strategically stationed around potentially active volcanoes.
Cou
rtesy
of U
S G
eolo
gica
l Sur
vey
Cou
rtesy
of U
S G
eolo
gica
l Sur
vey
GLOBAL OBSERVING SYSTEMS
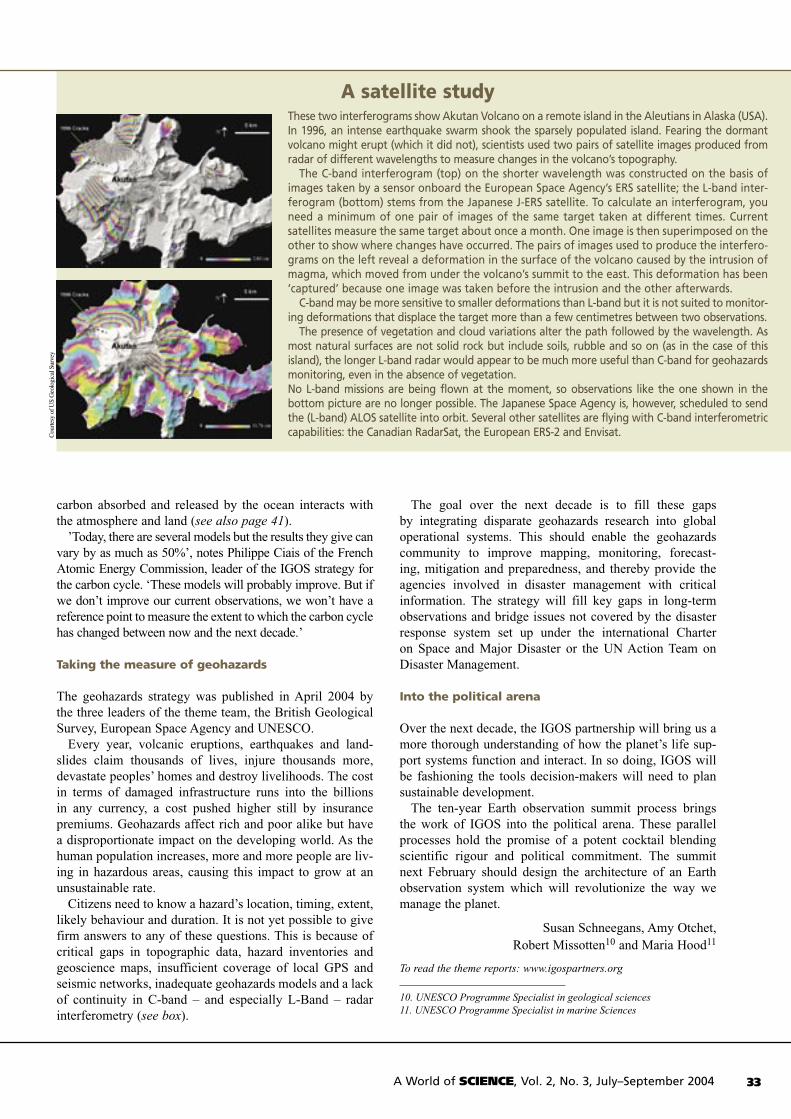
carbon absorbed and released by the ocean interacts with the atmosphere and land (see also page 41).
’Today, there are several models but the results they give can vary by as much as 50%’, notes Philippe Ciais of the French Atomic Energy Commission, leader of the IGOS strategy for the carbon cycle. ‘These models will probably improve. But if we don’t improve our current observations, we won’t have a reference point to measure the extent to which the carbon cycle has changed between now and the next decade.’
Taking the measure of geohazards
The geohazards strategy was published in April 2004 by the three leaders of the theme team, the British Geological Survey, European Space Agency and UNESCO.
Every year, volcanic eruptions, earthquakes and land-slides claim thousands of lives, injure thousands more, devastate peoples’ homes and destroy livelihoods. The cost in terms of damaged infrastructure runs into the billions in any currency, a cost pushed higher still by insurance premiums. Geohazards affect rich and poor alike but have a disproportionate impact on the developing world. As the human population increases, more and more people are liv-ing in hazardous areas, causing this impact to grow at an unsustainable rate.
Citizens need to know a hazard’s location, timing, extent, likely behaviour and duration. It is not yet possible to give firm answers to any of these questions. This is because of critical gaps in topographic data, hazard inventories and geoscience maps, insufficient coverage of local GPS and seismic networks, inadequate geohazards models and a lack of continuity in C-band – and especially L-Band – radar interferometry (see box).
The goal over the next decade is to fill these gaps by integrating disparate geohazards research into global operational systems. This should enable the geohazards community to improve mapping, monitoring, forecast-ing, mitigation and preparedness, and thereby provide the agencies involved in disaster management with critical information. The strategy will fill key gaps in long-term observations and bridge issues not covered by the disaster response system set up under the international Charter on Space and Major Disaster or the UN Action Team on Disaster Management.
Into the political arena
Over the next decade, the IGOS partnership will bring us a more thorough understanding of how the planet’s life sup-port systems function and interact. In so doing, IGOS will be fashioning the tools decision-makers will need to plan sustainable development.
The ten-year Earth observation summit process brings the work of IGOS into the political arena. These parallel processes hold the promise of a potent cocktail blending scientific rigour and political commitment. The summit next February should design the architecture of an Earth observation system which will revolutionize the way we manage the planet.
Susan Schneegans, Amy Otchet,Robert Missotten10 and Maria Hood11
To read the theme reports: www.igospartners.org
10. UNESCO Programme Specialist in geological sciences11. UNESCO Programme Specialist in marine Sciences
33A World of SCIENCE, Vol. 2, No. 3, July–September 2004
A satellite studyThese two interferograms show Akutan Volcano on a remote island in the Aleutians in Alaska (USA). In 1996, an intense earthquake swarm shook the sparsely populated island. Fearing the dormant volcano might erupt (which it did not), scientists used two pairs of satellite images produced from radar of different wavelengths to measure changes in the volcano’s topography.
The C-band interferogram (top) on the shorter wavelength was constructed on the basis of images taken by a sensor onboard the European Space Agency’s ERS satellite; the L-band inter-ferogram (bottom) stems from the Japanese J-ERS satellite. To calculate an interferogram, you need a minimum of one pair of images of the same target taken at different times. Current satellites measure the same target about once a month. One image is then superimposed on the other to show where changes have occurred. The pairs of images used to produce the interfero-grams on the left reveal a deformation in the surface of the volcano caused by the intrusion of magma, which moved from under the volcano’s summit to the east. This deformation has been ‘captured’ because one image was taken before the intrusion and the other afterwards.
C-band may be more sensitive to smaller deformations than L-band but it is not suited to monitor-ing deformations that displace the target more than a few centimetres between two observations.
The presence of vegetation and cloud variations alter the path followed by the wavelength. As most natural surfaces are not solid rock but include soils, rubble and so on (as in the case of this island), the longer L-band radar would appear to be much more useful than C-band for geohazards monitoring, even in the absence of vegetation.No L-band missions are being flown at the moment, so observations like the one shown in the bottom picture are no longer possible. The Japanese Space Agency is, however, scheduled to send the (L-band) ALOS satellite into orbit. Several other satellites are flying with C-band interferometric capabilities: the Canadian RadarSat, the European ERS-2 and Envisat.C
ourte
sy o
f US
Geo
logi
cal S
urve
y
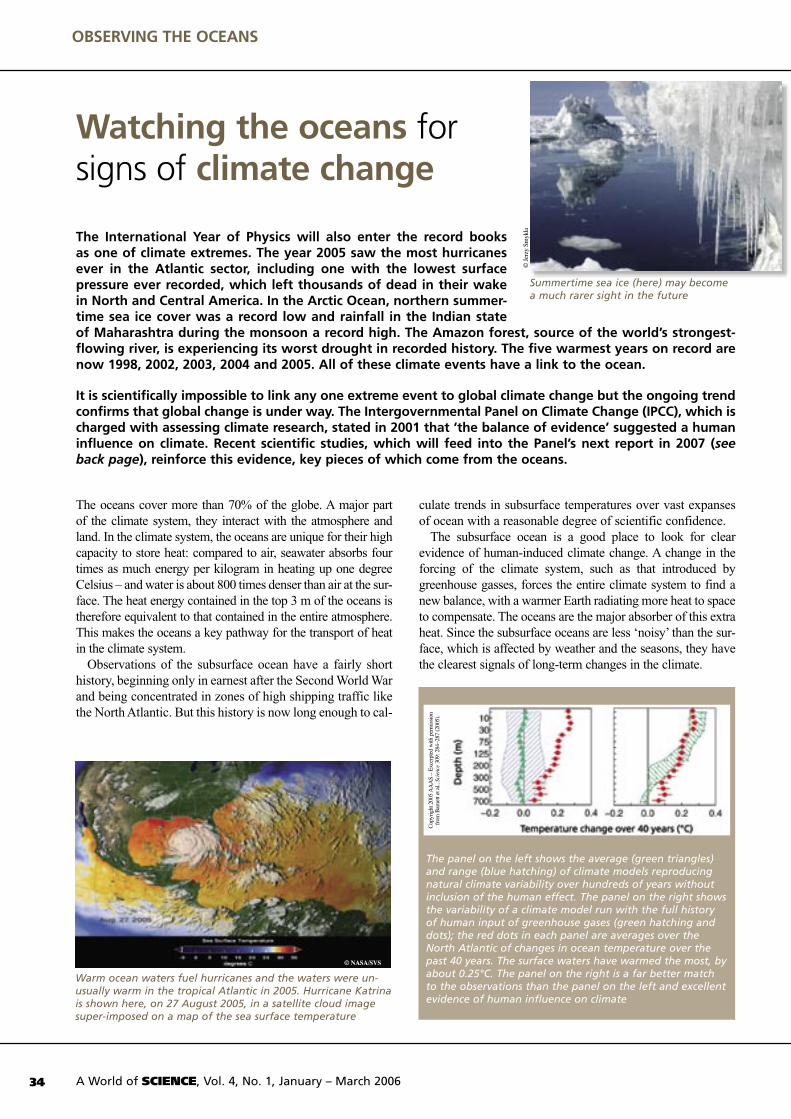
The oceans cover more than 70% of the globe. A major part of the climate system, they interact with the atmosphere and land. In the climate system, the oceans are unique for their high capacity to store heat: compared to air, seawater absorbs four times as much energy per kilogram in heating up one degree Celsius – and water is about 800 times denser than air at the sur-face. The heat energy contained in the top 3 m of the oceans is therefore equivalent to that contained in the entire atmosphere. This makes the oceans a key pathway for the transport of heat in the climate system.
Observations of the subsurface ocean have a fairly short history, beginning only in earnest after the Second World War and being concentrated in zones of high shipping traffic like the North Atlantic. But this history is now long enough to cal-
culate trends in subsurface temperatures over vast expanses of ocean with a reasonable degree of scientific confidence.
The subsurface ocean is a good place to look for clear evidence of human-induced climate change. A change in the forcing of the climate system, such as that introduced by greenhouse gasses, forces the entire climate system to find a new balance, with a warmer Earth radiating more heat to space to compensate. The oceans are the major absorber of this extra heat. Since the subsurface oceans are less ‘noisy’ than the sur-face, which is affected by weather and the seasons, they have the clearest signals of long-term changes in the climate.
Watching the oceans for signs of climate change
The International Year of Physics will also enter the record books as one of climate extremes. The year 2005 saw the most hurricanes ever in the Atlantic sector, including one with the lowest surface pressure ever recorded, which left thousands of dead in their wake in North and Central America. In the Arctic Ocean, northern summer-time sea ice cover was a record low and rainfall in the Indian state of Maharashtra during the monsoon a record high. The Amazon forest, source of the world’s strongest- flowing river, is experiencing its worst drought in recorded history. The five warmest years on record are now 1998, 2002, 2003, 2004 and 2005. All of these climate events have a link to the ocean.
It is scientifically impossible to link any one extreme event to global climate change but the ongoing trend confirms that global change is under way. The Intergovernmental Panel on Climate Change (IPCC), which is charged with assessing climate research, stated in 2001 that ‘the balance of evidence’ suggested a human influence on climate. Recent scientific studies, which will feed into the Panel’s next report in 2007 (see back page), reinforce this evidence, key pieces of which come from the oceans.
Cop
yrig
ht 2
005
AA
AS
– E
xcer
pted
with
per
mis
sion
fr
om B
arne
tt et
al.,
Science
309
: 284
–287
(200
5).
OBSERVING THE OCEANS
Warm ocean waters fuel hurricanes and the waters were un-usually warm in the tropical Atlantic in 2005. Hurricane Katrina is shown here, on 27 August 2005, in a satellite cloud image super-imposed on a map of the sea surface temperature
© NASA/SVS
Summertime sea ice (here) may become a much rarer sight in the future
The panel on the left shows the average (green triangles) and range (blue hatching) of climate models reproducing natural climate variability over hundreds of years without inclusion of the human effect. The panel on the right shows the variability of a climate model run with the full history of human input of greenhouse gases (green hatching and dots); the red dots in each panel are averages over the North Atlantic of changes in ocean temperature over the past 40 years. The surface waters have warmed the most, by about 0.25°C. The panel on the right is a far better match to the observations than the panel on the left and excellent evidence of human influence on climate
© J
erzy
Sm
ykla
A World of SCIENCE, Vol. 4, No. 1, January – March 200634

Conclusive evidence from the oceans
In an article published in Science in July 2005, Tim Barnett and his colleagues showed that the observed patterns of ocean warming over the past 40 years could not be explained by natural variability but instead were a good match with the climate predictions incorporating the human effect on climate (see figure), findings which disagree with measurements taken elsewhere.
The study has helped to boost scientific confidence in the ability of modern land–ocean–atmosphere climate models to simulate climate change. In large part, the scientific debate over whether human activity has provoked climate change is over. Exactly how it will change remains a question.
Even if the human emissions of greenhouse gases were to stop today, the global climate would keep changing for decades to come, due to the level of greenhouse gases currently in the atmosphere and the thermal inertia of the climate system. The climate will stabilize again only when the Earth heats up enough or greenhouse gases get absorbed into other parts of the climate system. The oceans have absorbed about 50% of historical greenhouse gas production, with potentially dramatic effects on ocean ecosystems (see page 41).
Climate impacts driven from the ocean
Since the oceans are a major reservoir of heat in the cli-mate system, prediction of short-term climate variations – those felt over days or months – is highly dependent on the interaction between the ocean and atmosphere. The cli-mate records achieved this year are best understood using models that include the physics of ocean circulation. It is the extremes in rainfall and temperature which most affect humans, provoking floods, landslides, drought and shifts in the seasons which affect food production and tourism.
A record-breaking hurricane season
Unusually warm ocean conditions in the tropical Atlantic in 2005 contributed to the strength of hurricanes during the
hurricane season, the most damaging season in recorded his-tory. Hurricane Katrina last August devastated the US Gulf Coast (see images). Rainfall associated with Hurricane Stan in early October triggered severe flooding and landslides that killed up to 2000 people in Guatemala and other coun-tries in Central America. Seven of the 14 hurricanes that formed were major and three were of the highest strength12. Meteorologists ran out of names for Atlantic hurricanes for the first time, resorting to the Greek alphabet and ending with Hurricane Epsilon.
The strong winds of a hurricane evaporate enormous quan-tities of water vapour from the ocean surface. The evapora-tion is strongest over ocean water with the greatest heat reserves. Climate change models incorporating hurricanes show an increase in the intensity of hurricanes – but not in their number – as the oceans warm. The debate is still ongo-ing as to whether the current warming of the tropical Atlantic is due to climate change or natural variability but global warming has already led to an increase in ocean temperatures.
A parched Amazon
While Central and North America flooded, the Amazon forest was experiencing its worst-ever recorded drought. Lakes and lagoons have dried up, river channels are no longer navigable, farming and fishing have been disrupted, the delicate tropical rain forests are burning, and stagnant water left
12. Category Five, with winds in excess of 249 km/hr
The fierce winds and extreme low pressure of Hurricane Katrina forced enormous storm surges, flooding a territory half the size of France. They breached a number of the levees protecting the coastal city of New Orleans, built mostly below sea level. Over 1 million people had to be evacuated, like the children in this photo, and more than 1200 people lost their lives. It is estimated that reconstruction will cost the USA over US$100 billion.
A dry mangrove swamp in Bragança, Brazil, in early 2005. The Amazon is experiencing severe drought, also due to the warm tropical Atlantic
© A
na C
ristin
a V
ieira
Fol
ha
Too close for comfort. This view from the cockpit of the ring of thunderstorms surrounding the eye of Hurricane Katrina (known as an eyewall) was captured aboard a NOAA hurricane hunter aircraft a day before the powerful storm came crashing ashore. The heaviest rain and strongest winds are found in the eyewall, whose energy comes from heat from the ocean
© N
OA
A
© K
. Nie
mi/U
S X
Coa
st G
uard
Dig
ital
35A World of SCIENCE, Vol. 4, No. 1, January – March 2006

in riverbeds is causing disease-carrying mosquitoes to proliferate. The same warming of the tropical Atlantic is thought to be to blame, as greater evaporation and rising air over the ocean has forced the air to descend over the Amazon, displacing the rains.
Monsoons driven by ocean heat
A similar balance of ocean and land evaporation drives the monsoon, a periodic wind which can be likened to a very strong sea breeze. The strongest of the monsoons occurs over the northern Indian Ocean, with the winds blowing from the southwest during one half of the year and from the northeast during the other half.
Tropical monsoon rainfall is driven by the difference in the heat capacity of the oceans and land. In summer under strong sunshine, the temperature on land rises much more quickly than the temperature at the sea surface. The warm air over land rises, drawing moist air from over the oceans inland and feeding strong rainfall. Both the amount of heat stored in the ocean and the difference in temperature between ocean and land affect the intensity of monsoons.
Melting ice and rising seas
The oceans are of course central to sea-level rise caused both by the expansion of warming oceans and the melting of glaciers (see box, p. 10) and ice caps. The global aver-age sea level has been increasing by about 2 mm per year. But the increase is not entirely uniform; as the climate changes, the average winds and ocean circulation have also changed, creating localized changes in sea level.
How will things change in the future? Will there be stronger hurricanes across the tropics? How likely is it that Europe will cool? Will disappearing sea ice finally open the fabled Northwest Passage to shipping? Will Tuvalu disappear beneath the waves? Will the mighty Amazon be reduced to a trickle? And could the climate change suddenly? (see box on facing page)
The ocean conveyor belt
The average temperature between the equator and the poles differs because of the tilt of the Earth’s surface relative to the sun. However, this difference is much weaker than one would expect. This is because the oceans and atmo-sphere carry heat to the poles, ensuring a more comfortable balance (for humans at least), by cooling temperatures at the equator and warm-ing them at the poles.
The ocean transports about half of this heat via shallow and deep currents collectively known as the ocean conveyor belt (thermohaline circu-lation, see figure). One of the busiest ocean highways is the wind-driven Gulf Stream and North Atlantic Current, which warms Europe to its east. These surface currents transport tens of millions of cubic metres of warm tropical water north-wards every second. Since mid-latitude weather systems generally move from west to east, New York in the USA is cooler than Naples in Italy, even though they are the same distance from the equator.
Evaporation to the atmosphere leaves behind saltier and cooler (and therefore denser) water. The waters below the upper layer everywhere in the world are filled with the densest cold and salty waters, formed mostly in the polar North Atlantic by extreme winter evaporation and heat loss; most of the sub-surface ocean is just a few degrees above freezing.
Carried in deep southward flows away from its source and, eventually, over thousands of years, spreading to the other oceans, the wind and tides bring this deep water back to the surface. There it is warmed by the sun and freshened by rain. Eventually, the water heads back to the poles again in the surface ocean to repeat the cycle.
Climate models with scenarios of human-induced change nearly all show that the ocean conveyor belt will slow down as the climate warms.
© Jayne Doucette / WHOI
The path followed by the ocean conveyor belt
OBSERVING THE OCEANS
Left: the warm surface water of the North Atlantic flows northward (red lines), replacing the southbound flow of cold, deep water (blue lines). This transports heat northward, warming the winds blowing eastward over Europe (large red arrow). A large addition of freshwater from melting land ice (right) would prevent seawater from sinking in the North Atlantic. The northward oceanic heat transfer could then stop, making the winds blowing over Europe much cooler, despite global warming (large blue arrow)
A F R I C A
S P A I N
N O R T H A M E R I C A
ADDITIONAL F RESH WATER
A F R I C A
S P A I N
N O R T H A M E R I C A
ADDITIONAL FRESH WATER
A F R I C A
S P A I N
N O R T H A M E R I C A
A F R I C A
S P A I N
N O R T H A M E R I C AWith additional fresh waterToday
© J
ack
Coo
k / W
HO
I
A World of SCIENCE, Vol. 4, No. 1, January – March 200636
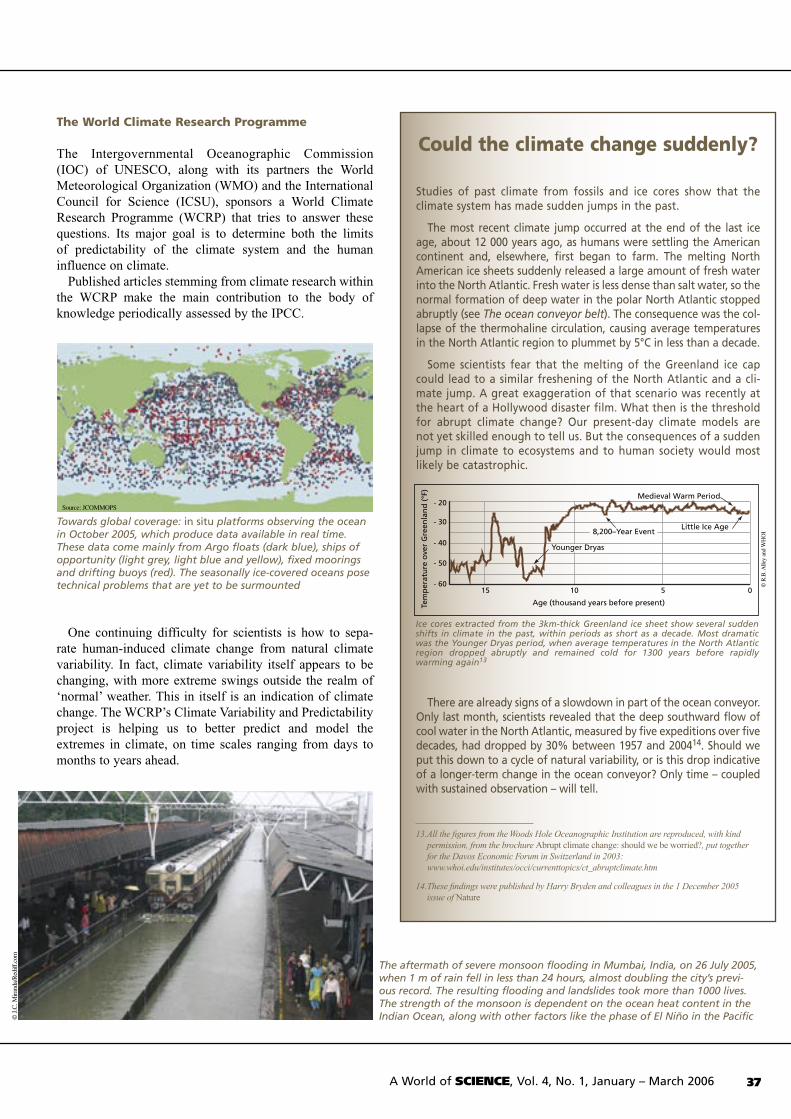
The World Climate Research Programme
The Intergovernmental Oceanographic Commission (IOC) of UNESCO, along with its partners the World Meteorological Organization (WMO) and the International Council for Science (ICSU), sponsors a World Climate Research Programme (WCRP) that tries to answer these questions. Its major goal is to determine both the limits of predictability of the climate system and the human influence on climate.
Published articles stemming from climate research within the WCRP make the main contribution to the body of knowledge periodically assessed by the IPCC.
One continuing difficulty for scientists is how to sepa-rate human-induced climate change from natural climate variability. In fact, climate variability itself appears to be changing, with more extreme swings outside the realm of ‘normal’ weather. This in itself is an indication of climate change. The WCRP’s Climate Variability and Predictability project is helping us to better predict and model the extremes in climate, on time scales ranging from days to months to years ahead.
Source: JCOMMOPS
Towards global coverage: in situ platforms observing the ocean in October 2005, which produce data available in real time. These data come mainly from Argo floats (dark blue), ships of opportunity (light grey, light blue and yellow), fixed moorings and drifting buoys (red). The seasonally ice-covered oceans pose technical problems that are yet to be surmounted
Could the climate change suddenly?
Studies of past climate from fossils and ice cores show that the climate system has made sudden jumps in the past.
The most recent climate jump occurred at the end of the last ice age, about 12 000 years ago, as humans were settling the American continent and, elsewhere, first began to farm. The melting North American ice sheets suddenly released a large amount of fresh water into the North Atlantic. Fresh water is less dense than salt water, so the normal formation of deep water in the polar North Atlantic stopped abruptly (see The ocean conveyor belt). The consequence was the col-lapse of the thermohaline circulation, causing average temperatures in the North Atlantic region to plummet by 5°C in less than a decade.
Some scientists fear that the melting of the Greenland ice cap could lead to a similar freshening of the North Atlantic and a cli-mate jump. A great exaggeration of that scenario was recently at the heart of a Hollywood disaster film. What then is the threshold for abrupt climate change? Our present-day climate models are not yet skilled enough to tell us. But the consequences of a sudden jump in climate to ecosystems and to human society would most likely be catastrophic.
There are already signs of a slowdown in part of the ocean conveyor. Only last month, scientists revealed that the deep southward flow of cool water in the North Atlantic, measured by five expeditions over five decades, had dropped by 30% between 1957 and 200414. Should we put this down to a cycle of natural variability, or is this drop indicative of a longer-term change in the ocean conveyor? Only time – coupled with sustained observation – will tell.
13. All the figures from the Woods Hole Oceanographic Institution are reproduced, with kind permission, from the brochure Abrupt climate change: should we be worried?, put together for the Davos Economic Forum in Switzerland in 2003: www.whoi.edu/institutes/occi/currenttopics/ct_abruptclimate.htm
14. These findings were published by Harry Bryden and colleagues in the 1 December 2005 issue of Nature
�������������������������������
����
����
����
����
������ �� � �
��������������������
������������������������������
�����������������������������������
�������������
Ice cores extracted from the 3km-thick Greenland ice sheet show several sudden shifts in climate in the past, within periods as short as a decade. Most dramatic was the Younger Dryas period, when average temperatures in the North Atlantic region dropped abruptly and remained cold for 1300 years before rapidly warming again13
The aftermath of severe monsoon flooding in Mumbai, India, on 26 July 2005, when 1 m of rain fell in less than 24 hours, almost doubling the city’s previ-ous record. The resulting flooding and landslides took more than 1000 lives. The strength of the monsoon is dependent on the ocean heat content in the Indian Ocean, along with other factors like the phase of El Niño in the Pacific
© R
.B. A
lley
and
WH
OI
© J
.C. M
irand
a/R
ediff
.com
37A World of SCIENCE, Vol. 4, No. 1, January – March 2006

Observing the oceans to understand them
The IOC of UNESCO and its flagship programme, the Global Ocean Observing System (GOOS), make up the UN arm responsible for sustained global ocean observations. An IOC group of experts, the Ocean Observations Panel for Climate (OOPC), helps to define the standards and goals of the global climate component of GOOS and the tools for monitoring and evaluating the system.
Through a joint technical commission with the WMO for oceanography and marine meteorology (JCOMM), the IOC is also actively coordinating these global networks through an in situ (in the water) platform support centre (JCOMMOPS) located in Toulouse, France, which continu-ally monitors the thousands of floats, ships and fixed moor-ings transmitting oceanographic data.
OBSERVING THE OCEANS
© E
SA
Give and take: competing climate feedbacks
Scientists who grapple with trying to understand the complex climate system have found a simple way to describe the pat-terns of interaction that they observe: as feedbacks. Feedbacks can either reinforce the current state of the climate system or lead it to run away.
An example of a stabilizing feedback (called a negative feed-back) is the interaction between solar radiation, the sea surface temperature, and clouds in the tropics. The ocean warms from solar heating, warming and humidifying the atmosphere above. The strong winds of a hurricane evaporate enormous quantities of water vapour from the ocean surface. Energy from the latent heat released when this vapour then condenses into raindrops is injected into the storm, further increasing its strength. These clouds shield the ocean surface, which cools. In this way, the climate system creates a natural barrier to endless
heating of the ocean. The opposite is also true: coo-ler oceans mean fewer clouds and more solar radiation reaching the sur-face. A negative feedback moves things towards an equilibrium.
An example of a run-away feedback (called a positive feedback) is the interaction between solar radiation and ice in the polar regions. Ice is a very efficient reflector of sun-light, bouncing a signifi-cant fraction of its energy back into space. If the ice melts and is replaced by darker ocean or land surfaces, less sunlight is reflected, heating the sur-
face. The heating will further melt ice. It is this which makes the polar regions particularly sensitive to climate change.
The balance of feedbacks, and whether a positive feedback can temporarily gain the upper hand over the stabilizing nega-tive feedbacks, describes the evolution and natural variability of the climate.
The best-known interaction of climate feedbacks involving the ocean is El Niño, a temporary shift of the warmest waters in the tropical Pacific towards the east, with patterns of atmospheric uplift and rainfall following, bringing drought to Indonesia and Australia, excessive rainfall to Peru and Ecuador, and changed storm patterns over much of the globe.
Will El Niño change as the global climate changes? Many scientists believe it will or that it already has but predicting El Niños remains a difficult task.
A slice of temperatures the Pacific ocean, cut east–west at the equator and looking northwards, as visualized from the tropical array of fixed moorings in the Pacific. Normally, air rises over a pool of the warmest water in the western Pacific (top image), drawing the surface winds from the east that maintain this warm pool by piling up warm water. During an El Niño event (bottom image), something weakens the surface winds, which allows the warm water to slump eastward. The centres of rising air follow eastward, further weakening the surface wind and allowing the warm water to slump further, a positive feedback. The result is a change in the tropical Pacific on the ocean side and global changes in the atmospheric circulation
Satellites provide global coverage of the oceans and are a key element of GOOS. This is an artist’s impression of the European SMOS satellite, which will measure surface salinity from 2007 onwards
Convective clouds in the tropics cast shadows over the warm ocean below
© NASA/SVS
A World of SCIENCE, Vol. 4, No. 1, January – March 200638

Satellites: scratching the surface
Ocean satellite missions have revolutionized ocean-ography; they are critical for global coverage of surface temperature, ocean eddies (the sea’s weather systems), surface wind and ocean colour as an indicator of bio- logical activity.
The oceans pose a serious impediment to satellite observations however. As the conductivity of salt water makes them almost impervious to electromagnetic radia-tion, only the skin of the ocean is visible from space. To observe the global oceans fully, measurements need to
be taken in the oceans themselves, from dif-ferent types of auton-omous platforms and research ships.
Robotic sentinels of the deep
The most rapidly growing of these in situ networks is the Argo profiling float network. Argo floats are robotic, self-con-tained oceanographic measuring devices that park in the deep ocean, 2 km below the surface. Changing their buoyancy once
every 10 days by shifting oil out to an external bladder, they rise to the surface. On the way up, they collect infor-mation on temperature and salinity (some also measure oxygen), which they then transmit by satellite at the surface.
By the end of 2005, the four-year old Argo project had seeded the oceans with more than 2000 floats, two-thirds of its way to its initial goal of 3000 floats, roughly one per every 100 000 km2. When the batteries fail after about four years, the floats cannot rise to the surface. Most will eventually sink to the bottom. Argo floats are widely dis-tributed in the world’s oceans, thanks to the coordinated efforts of more than 20 participating countries. In some areas, the floats are now returning more information on the subsurface ocean in one year than can be found in the entire historical database before Argo.
A modern message in a bottle
Inspired by shipwreck survivors who sometimes cast mes-sages sealed in a bottle to the waves, US scientist and states-man Benjamin Franklin used message-carrying bottles in the mid-1700s to compile an atlas of currents off the east coast of North America.
In 1929, German scientists released a message that could be read without breaking the bottle in the South Indian Ocean. It was read and re-released a number of times. Caught up in the strong circumpolar current, it had travelled more than 25 000 km by 1935.
Today, a modern equivalent of these messages in a bot-tle – surface drifting buoys – ply the surface currents of the world, transmitting their electronic reports of surface temperature, currents and often barometric pressure. These buoys provide a ground truth for satellite estimates of the sea surface temperature and are the best witnesses of ocean surface currents, themselves driven by winds and ocean eddies. They also improve weather forecasts by reporting on the surface pressure.
The scientific goal set by OOPC for the surface drifting buoy network was to have one in every 300 000 km2 box of ocean, or 1250 in total. That goal was reached in September 2005, when Global Drifter 1250 was launched at a special ceremony held in conjunction with the Second Session of JCOMM in Halifax, Canada. It is the first of the in situ global ocean observing networks to reach the goal it was designed for, a major milestone.
But scientists can’t just declare victory and go home; the drifting buoy network needs constant replenishing as floats fail and drift out of regions of current divergence. Moreover, the planned global in situ ocean observation network of floats, profilers, moorings, sea level gauges and volunteer and research ships is currently only about 55% complete.
One of 70 fixed moorings in the tropical Pacific which monitor and forecast El Niño events within the global ocean observing system. The last El Niño event occurred in 2002–2003
A message in a bottle:Global Drifter 1250, symbolically complet-ing the first component of GOOS, is deployed in September 2005 in Canadian waters
© NOAA
© N
OA
A
An Argo profiling float being deployed from the Canadian coast guard ship John P. Tully in the Gulf of Alaska
© Canada DFO–MPO
39A World of SCIENCE, Vol. 4, No. 1, January – March 2006
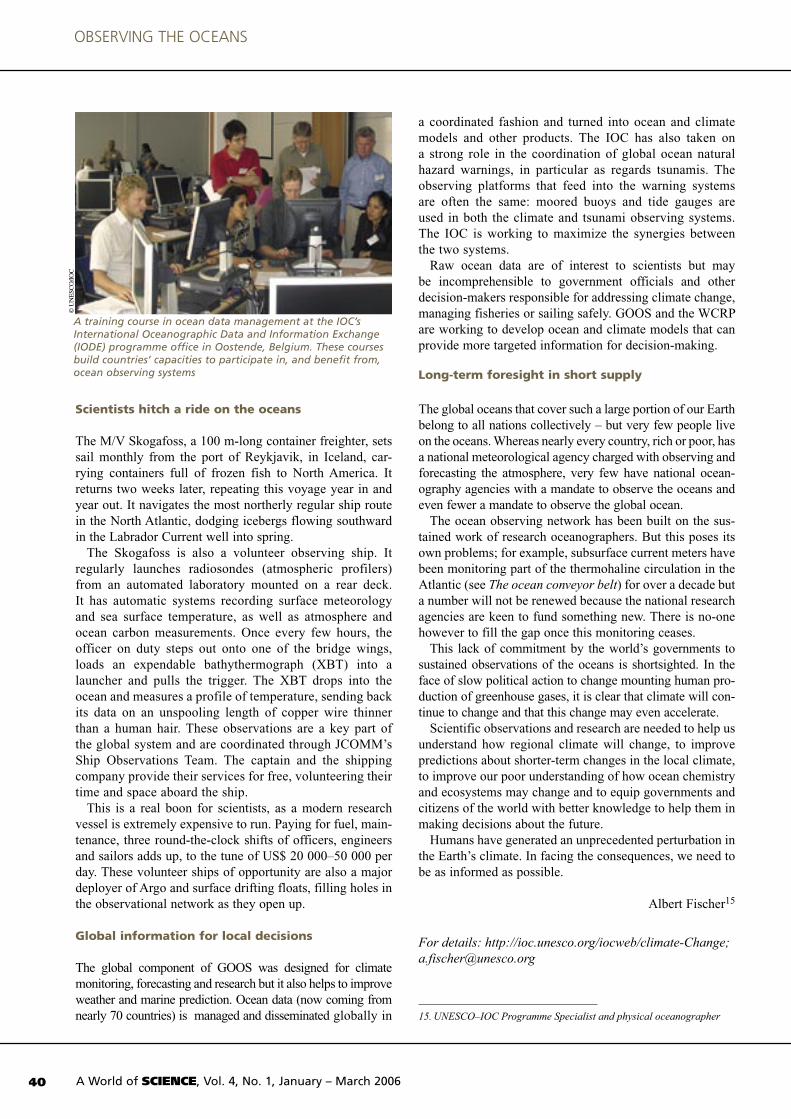
Scientists hitch a ride on the oceans
The M/V Skogafoss, a 100 m-long container freighter, sets sail monthly from the port of Reykjavik, in Iceland, car-rying containers full of frozen fish to North America. It returns two weeks later, repeating this voyage year in and year out. It navigates the most northerly regular ship route in the North Atlantic, dodging icebergs flowing southward in the Labrador Current well into spring.
The Skogafoss is also a volunteer observing ship. It regularly launches radiosondes (atmospheric profilers) from an automated laboratory mounted on a rear deck. It has automatic systems recording surface meteorology and sea surface temperature, as well as atmosphere and ocean carbon measurements. Once every few hours, the officer on duty steps out onto one of the bridge wings, loads an expendable bathythermograph (XBT) into a launcher and pulls the trigger. The XBT drops into the ocean and measures a profile of temperature, sending back its data on an unspooling length of copper wire thinner than a human hair. These observations are a key part of the global system and are coordinated through JCOMM’s Ship Observations Team. The captain and the shipping company provide their services for free, volunteering their time and space aboard the ship.
This is a real boon for scientists, as a modern research vessel is extremely expensive to run. Paying for fuel, main-tenance, three round-the-clock shifts of officers, engineers and sailors adds up, to the tune of US$ 20 000–50 000 per day. These volunteer ships of opportunity are also a major deployer of Argo and surface drifting floats, filling holes in the observational network as they open up.
Global information for local decisions
The global component of GOOS was designed for climate monitoring, forecasting and research but it also helps to improve weather and marine prediction. Ocean data (now coming from nearly 70 countries) is managed and disseminated globally in
a coordinated fashion and turned into ocean and climate models and other products. The IOC has also taken on a strong role in the coordination of global ocean natural hazard warnings, in particular as regards tsunamis. The observing platforms that feed into the warning systems are often the same: moored buoys and tide gauges are used in both the climate and tsunami observing systems. The IOC is working to maximize the synergies between the two systems.
Raw ocean data are of interest to scientists but may be incomprehensible to government officials and other decision-makers responsible for addressing climate change, managing fisheries or sailing safely. GOOS and the WCRP are working to develop ocean and climate models that can provide more targeted information for decision-making.
Long-term foresight in short supply
The global oceans that cover such a large portion of our Earth belong to all nations collectively – but very few people live on the oceans. Whereas nearly every country, rich or poor, has a national meteorological agency charged with observing and forecasting the atmosphere, very few have national ocean-ography agencies with a mandate to observe the oceans and even fewer a mandate to observe the global ocean.
The ocean observing network has been built on the sus-tained work of research oceanographers. But this poses its own problems; for example, subsurface current meters have been monitoring part of the thermohaline circulation in the Atlantic (see The ocean conveyor belt) for over a decade but a number will not be renewed because the national research agencies are keen to fund something new. There is no-one however to fill the gap once this monitoring ceases.
This lack of commitment by the world’s governments to sustained observations of the oceans is shortsighted. In the face of slow political action to change mounting human pro-duction of greenhouse gases, it is clear that climate will con-tinue to change and that this change may even accelerate.
Scientific observations and research are needed to help us understand how regional climate will change, to improve predictions about shorter-term changes in the local climate, to improve our poor understanding of how ocean chemistry and ecosystems may change and to equip governments and citizens of the world with better knowledge to help them in making decisions about the future.
Humans have generated an unprecedented perturbation in the Earth’s climate. In facing the consequences, we need to be as informed as possible.
Albert Fischer15
For details: http://ioc.unesco.org/iocweb/climate-Change; [email protected]
15. UNESCO–IOC Programme Specialist and physical oceanographer
A training course in ocean data management at the IOC’s International Oceanographic Data and Information Exchange (IODE) programme office in Oostende, Belgium. These courses build countries’ capacities to participate in, and benefit from, ocean observing systems
© U
NE
SCO
/IOC
A World of SCIENCE, Vol. 4, No. 1, January – March 200640
OBSERVING THE OCEANS
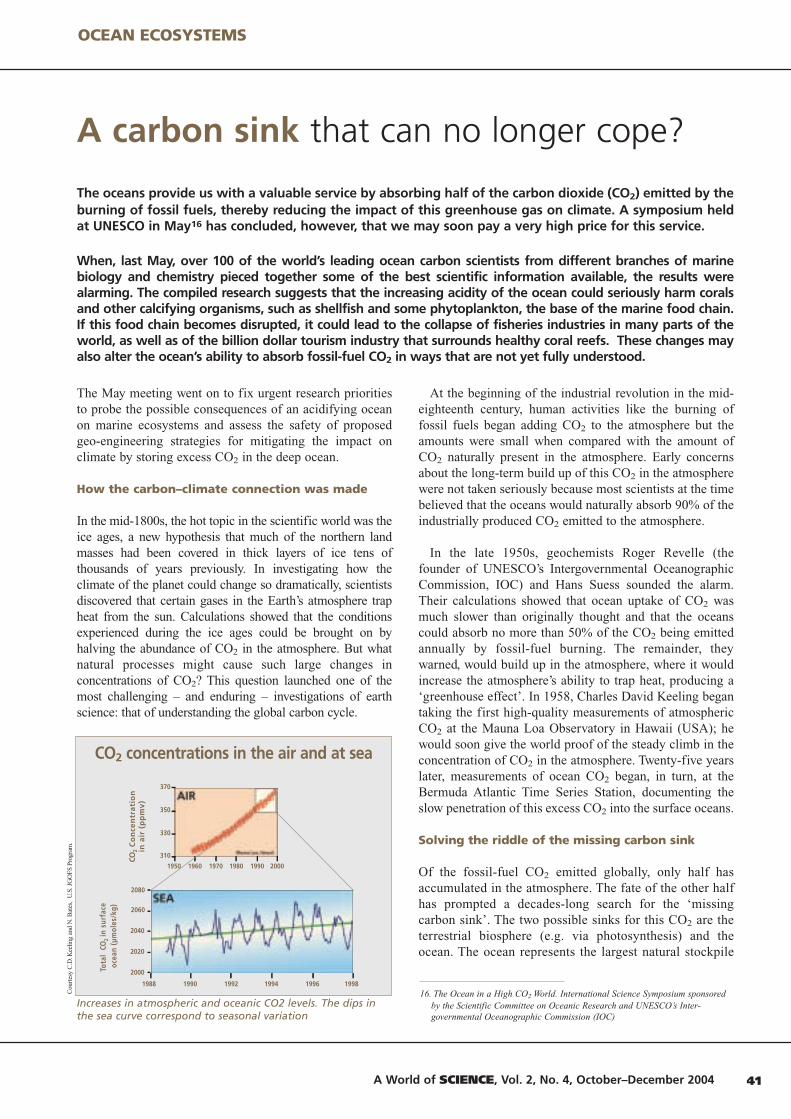
41A World of SCIENCE, Vol. 2, No. 4, October–December 2004
OCEAN ECOSYSTEMS
The May meeting went on to fix urgent research prioritiesto probe the possible consequences of an acidifying oceanon marine ecosystems and assess the safety of proposedgeo-engineering strategies for mitigating the impact onclimate by storing excess CO2 in the deep ocean.
How the carbon–climate connection was made
In the mid-1800s, the hot topic in the scientific world was theice ages, a new hypothesis that much of the northern landmasses had been covered in thick layers of ice tens ofthousands of years previously. In investigating how theclimate of the planet could change so dramatically, scientistsdiscovered that certain gases in the Earth’s atmosphere trapheat from the sun. Calculations showed that the conditionsexperienced during the ice ages could be brought on byhalving the abundance of CO2 in the atmosphere. But whatnatural processes might cause such large changes inconcentrations of CO2? This question launched one of themost challenging – and enduring – investigations of earthscience: that of understanding the global carbon cycle.
At the beginning of the industrial revolution in the mid-eighteenth century, human activities like the burning offossil fuels began adding CO2 to the atmosphere but theamounts were small when compared with the amount ofCO2 naturally present in the atmosphere. Early concernsabout the long-term build up of this CO2 in the atmospherewere not taken seriously because most scientists at the timebelieved that the oceans would naturally absorb 90% of theindustrially produced CO2 emitted to the atmosphere.
In the late 1950s, geochemists Roger Revelle (thefounder of UNESCO’s Intergovernmental OceanographicCommission, IOC) and Hans Suess sounded the alarm.Their calculations showed that ocean uptake of CO2 wasmuch slower than originally thought and that the oceanscould absorb no more than 50% of the CO2 being emittedannually by fossil-fuel burning. The remainder, theywarned, would build up in the atmosphere, where it wouldincrease the atmosphere’s ability to trap heat, producing a‘greenhouse effect’. In 1958, Charles David Keeling begantaking the first high-quality measurements of atmosphericCO2 at the Mauna Loa Observatory in Hawaii (USA); hewould soon give the world proof of the steady climb in theconcentration of CO2 in the atmosphere. Twenty-five yearslater, measurements of ocean CO2 began, in turn, at theBermuda Atlantic Time Series Station, documenting theslow penetration of this excess CO2 into the surface oceans.
Solving the riddle of the missing carbon sink
Of the fossil-fuel CO2 emitted globally, only half hasaccumulated in the atmosphere. The fate of the other halfhas prompted a decades-long search for the ‘missingcarbon sink’. The two possible sinks for this CO2 are theterrestrial biosphere (e.g. via photosynthesis) and theocean. The ocean represents the largest natural stockpile
The oceans provide us with a valuable service by absorbing half of the carbon dioxide (CO2) emitted by theburning of fossil fuels, thereby reducing the impact of this greenhouse gas on climate. A symposium heldat UNESCO in May16 has concluded, however, that we may soon pay a very high price for this service.
When, last May, over 100 of the world’s leading ocean carbon scientists from different branches of marinebiology and chemistry pieced together some of the best scientific information available, the results werealarming. The compiled research suggests that the increasing acidity of the ocean could seriously harm coralsand other calcifying organisms, such as shellfish and some phytoplankton, the base of the marine food chain.If this food chain becomes disrupted, it could lead to the collapse of fisheries industries in many parts of theworld, as well as of the billion dollar tourism industry that surrounds healthy coral reefs. These changes mayalso alter the ocean’s ability to absorb fossil-fuel CO2 in ways that are not yet fully understood.
A carbon sink that can no longer cope?
16. The Ocean in a High CO2 World. International Science Symposium sponsoredby the Scientific Committee on Oceanic Research and UNESCO’s Inter-governmental Oceanographic Commission (IOC)
CO2 concentrations in the air and at sea
1988 1990 1992 1994 1996 1998
Tota
l CO
2 in
surf
ace
oce
an (
µmol
es/k
g)
CO2
Co
nce
ntr
ati
on
in a
ir (
pp
mv
)
1950 1960 1970 1980 1990 2000
370
350
330
310
2080
2060
2040
2020
2000
Increases in atmospheric and oceanic CO2 levels. The dips inthe sea curve correspond to seasonal variation
Cou
rtes
y C
.D.K
eelin
g an
d N
.Bat
es,
U.S
.JG
OFS
Prog
ram
.

A World of SCIENCE, Vol. 2, No. 4, October–December 2004 42
OCEAN ECOSYSTEMS
of carbon and has a dynamic interaction with theatmosphere over 70% of the planet’s surface. The onlydirect method of calculating the amount of CO2 absorbedby the ocean is through direct measurements on a globalscale. From 1990 to 1998, a multinational researchprogramme called the World Ocean CirculationExperiment/Joint Global Ocean Flux Study amassed datafrom nearly 10 000 stations around the world’s oceansfrom 95 separate expeditions and produced the first globalsurvey of carbon distribution in the ocean.
Recent results from the global survey have solved themystery of the missing carbon sink: the data show that theoceans have taken up approximately 118 billion tons of theCO2 emitted since 1800, roughly 48% of the total; currently,
some 20–25 million tons of CO2
are being added to the oceansdaily, calculates the study,which was published in Science inJuly17. Without the ocean sink,atmospheric CO2 would be muchhigher and its climatic impactsmore severe18. But scientists arenow faced with a new question,‘Will the oceans continue to take
up almost half of the CO2 emitted to the atmosphere, even ina warmer climate with changed ocean mixing patterns?’A second global survey and several international researchprogrammes were launched in 2003 to find out.
Acid ocean?
A second and perhaps more pressing question is, ‘How arethese higher levels of ocean CO2 going to affect oceanecosystems?’ Today, there is growing concern that thisnatural service provided by the oceans may have a steepecological cost, the acidification of the oceans.
As CO2 dissolves in seawater, the pH of the water decreases,making it more acidic. Since the beginning of the industrialrevolution, the pH has dropped globally by 0.12 pH units19.
While these pH levels are not particularly alarming, the rateof change and the downward trend is cause for concern. Tothe best of our knowledge, theoceans have never experiencedsuch a rapid acidification. By theend of this century, if con-centrations in the atmospherecontinue to rise exponentially, wemay expect to see changes in pHthat are three times greater and100 times faster than thoseexperienced during the transitionsfrom glacial to interglacial periods.Such large changes in ocean pH have probably not beenexperienced on the planet for the past 21 million years.
Marine ecosystems under threat
Corals, calcareous phytoplankton, mussels, snails, seaurchins and other marine organisms use calcium carbonate(CaCO3) in seawater to construct their shells or skeletons. Asthe pH decreases, such as when water is more acidic, itbecomes more difficult for organisms to secrete CaCO3 toform their skeletal material. It is this effect that has marinescientists concerned: since the oceans have neverexperienced such a rapid acidification, it is not clear howocean chemistry will change or how ecosystems will adapt.
The penetration of CO2 into the ocean occurs very slowlybut scientists can accelerate this process in the laboratory orin field experiments to study the effects that increasing CO2
may have on marine ecosystems in the coming decades.One method is to set up floating corrals (mesocosms) in theocean that encircle natural populations of phytoplanktonand to manipulate the CO2 concentration in the air abovethe corral to study the effects of varying levels of CO2 onthe ecosystem. Since the lifespan of phytoplankton is of theorder of one week, scientists can observe the effects onmany generations over a short period of time.
From laboratory and mesocosm experiments conducted todate, almost all calcifying organisms have shown decreasedcalcification in more acidic environments. This is true forboth the smallest single-celled organisms and for reef-building corals. Under such conditions, calcareous phyto-plankton, which constitutes part of the basis of the marinefood chain, will form thinner skeletons and thus experiencedifficulties in growth and reproduction. This, in turn, mayhave profound effects on the marine food web, causing shiftsin fish population size or geographic location.
The oceans
have taken up
118 billion tons of
the CO2 emitted
since 1800; currently,
20–25 million tons of
CO2 are being added
to the oceans daily
By the end of this
century, changes
in pH may be
three times greater
and 100 times
faster than during
the transitions from
glacial to inter-
glacial periods.
Experiments in a floating corral (or mesocosm) in thisNorwegian fjord help to understand how marine ecosystemswill behave in a more acidic environment
Phot
os c
ourt
esy
of P
rofe
ssor
Ulf
Rie
bese
ll, L
eibn
iz-
Inst
itut f
ür M
eere
swis
sen-
scha
ften,
IFM
-GE
OM
AR
17. Sabine et al. (2004) The Oceanic Sink for Anthropogenic CO2, Science, 305, 367–371
18. The cost of avoiding CO2 emissions is currently US$40–60 per ton of CO2 (Interna-tional Energy Agency Greenhouse Gas Research and Development Programme). Byabsorbing 118 billion tons of fossil fuel since the beginning of the industrial revolu-tion, the ocean has provided a natural ecosystem service of the order of US$6 trillion
19. The lower the pH, the more acidic the solution. Natural seawater has a range of7.7–8.2 pH units

43A World of SCIENCE, Vol. 2, No. 4, October–December 2004
Coral reefs face two challenges from increasingatmospheric CO2. Firstly, higher CO2 concentrations in theatmosphere are linked to warmer global temperatures,which in turn lead to warmer water temperatures. Corals arevery sensitive to temperature change: a 1–2º C change inlocal temperature above their normal summer maximumcan lead to a phenomenon called ‘bleaching’, whereby thecorals expel their vital algal symbionts (algae which live insymbiosis with the coral), leaving the coral tissuestranslucent. In 1998, a single bleaching event led to the lossof almost 20% of the world’s living coral. Corals canrecover from these events but repeatedepisodes are likely to weaken the coralecosystem, making them more susceptible todisease and causing a loss of biodiversity. Thesecond challenge faced by corals is theincreasing acidity of the water caused byhigher CO2 concentrations. Lowered calcifi-cation rates affect the reef’s ability to grow itscarbonate skeleton, leading to slower growthof the reef and a more fragile structuralsupport, which makes the reef more vulnerableto erosion. By the middle of this century, theestimated reduction in calcification rates maylead to a situation where we are losing more reef area toerosion than can be rebuilt through new calcification.
Higher marine life forms, such as invertebrates and evensome fish, may be affected by lower pH environmentsthrough acidosis (an increase in carbonic acid in bodyfluids) leading to lowered resistance, metabolicdepression, behavioural depression affecting physicalactivity and reproduction, and asphyxiation.
While these projections of our future oceans may seemlike doomsday scenarios, we will probably never seedramatic, rapid changes. Instead, there will be slow,progressive shifts in the equilibrium conditions of marineecosystems over many decades. Scientists will be watchingfor indications that these ecosystem changes are occurring.
Dodging the impacts
Many scientists believe that stabilizing atmospheric CO2
concentration at 550 parts per million (ppm) may avoidthe worst impacts on climate. Atmosphericconcentration of CO2 is currently ~380 partsper million (ppm) and, if no precautionaryaction is taken, is expected to reach 550 ppmby the middle of this century. Stabilizing CO2
at 550 ppm will be a global challenge on anunprecedented scale. According to theIntergovernmental Panel on Climate Change(IPCC), the most authoritative source forscientific assessments of climate change, thismay not be achieved through emissions re-ductions alone but rather through a carefullycrafted portfolio of actions that also includes
investments to develop low-cost, low-carbon or no-carbonenergy sources, improvements in energy efficiency andcarbon management options. The latter include storingcarbon in the terrestrial biosphere (e.g. planting trees,limiting deforestation), or capturing the CO2 emitted froman industrial source and storing it in geological formationsor in the deep ocean. The IPCC is currently assessingthese options for their feasibility, efficacy and safety, andcalling for more research wherever information is
insufficient to make a soundpolicy decision.
Scientists participating in theUNESCO symposium were asked to examine the issue of the potential efficiency and eco-logical impacts of using the oceanpurposefully to store atmosphericCO2. Much relevant research has been conducted in the pastdecade but the potentialeffectiveness and risks of oceancarbon sequestration have beenneither thoroughly discussed norassessed. Moreover, the scienceitself has become trapped in a tugof war between environmentalgroups and commercial entre-preneurs seeking financialcompensation for artificiallysequestering carbon in the ocean.Frustrated scientists have askedthe IOC to provide a safe-haven
Invertebrates and
even some fish
may be affected by
lower pH environments,
leading to lowered
resistance, metabolic
depression, behavioural
depression affecting
physical activity and
reproduction, and
asphyxiation.
Scanning electron microscopy photo-graphs of two calcifying phyto-planktonunder pCO2 conditions of today (pCO2
from 280 ppm to 380 ppm) and underthe high CO2 conditions expected by theend of this century. Experimental resultsshow that increased CO2 con-centrationslead to malformations of calciumcarbonate shells
Phot
os c
ourt
esy
of P
rofe
ssor
Ulf
Rie
bese
ll,
Lei
bniz
-Ins
titut
für M
eere
swis
sen-
scha
ften,
IFM
-GE
OM
AR
. A
dapt
ed a
nd re
prin
ted
with
per
mis
sion
of N
atur
e (w
ww
.nat
ure.
com
): R
iebe
sell
et a
l. (2
000)
Red
uced
cal
cifi
catio
n of
mar
ine
phyt
opla
nkto
n in
resp
onse
to in
crea
sed
atm
osph
eric
CO
2 N
atur
e 40
7, 3
64-3
67.
High CO2 world(pCO2: 580–720 ppm)
Today’s world(pCO2: 280–380 ppm)
How does phytoplankton react to high levels of CO2 ?
Calcidiscus leptoporus
Gephyrocapsaoceanica

OCEAN ECOSYSTEMS
A World of SCIENCE, Vol. 2, No. 4, October–December 2004 44
Phot
os c
ourt
esy
of D
r Ove
Hoe
gh-G
uldb
erg,
C
entre
for M
arin
e St
udie
s, U
nive
rsity
of Q
ueen
slan
d, A
ustra
lia
for scientific discussions, free from the influences ofspecial interest groups.
Storage strategies and research requirements
Debate centres on two methods of using the ocean to storeexcess CO2. One strategy is to induce and enhance artificiallythe growth of carbon-fixing plants in the surface ocean. Whenthese organisms die, they sink to the deep ocean, carrying thecarbon with them. In many regions, phytoplankton growth islimited by lack of an essential micro-nutrient, iron. Over thepast decade, eight small-scale experiments have shown thatintroducing iron to iron-poor regions can stimulatephytoplankton growth to 20–30 times the natural rate.
Symposium participants agreed that iron fertilizationexperiments have been, and will continue to be, importantfor understanding the links between marine ecosystems andthe global carbon cycle. However, all available researchindicates that iron fertilization would be a very inefficientmethod for sequestering atmospheric CO2, both from theviewpoint of the limited amount of carbon that could besequestered by this method and the likelihood that, even ifiron limitations were eliminated, other nutrients andenvironmental factors would eventually limit growth.
Another method of ocean carbon sequestration is tocapture CO2 from industrial sources, compress it into a liquidand store it in natural reservoirs out of contact with theatmosphere, such as deep geological formations or the deepocean. Many important questions remain about theefficiency and impacts of injecting liquid CO2 into the deepocean and experimental data are extremely limited. Theefficiency of this method would depend on the location anddepth of the injection, since the goal is to keep the injectedCO2 out of contact with the atmosphere for as long aspossible, while minimizing environmental damage aroundthe area of the injection. Reproducing the temperature,pressure and the biological communities found in the deep
ocean in a laboratory is extremely difficult. Carrying outsmall-scale experiments in situ in the deep ocean is no simplematter either, often requiring the use of deep-sea remotelyoperated vehicles or special instruments that must be loweredto great depths from a research vessel.
To further complicate matters, several attempts to performexperiments in situ have been blocked by environmentalgroups over concerns that these experiments represent thefirst step towards industrial-scale dumping. This has been avery divisive issue within the scientific community itself,with many strongly opposed to ocean carbon sequestration,even to the extent of suggesting that the community shouldnot pursue research on the subject.
Unfortunately, because of the ocean’s large naturalcapacity to store CO2, ocean carbon sequestration willcontinue to interest commercial companies, some of whommay attempt to promote this technique without regard forpotential environmental impacts. Symposium participantsagreed that, even in the face of strong ethical opposition,investigations into the technical and economic feasibility ofimplementing this mitigation strategy are likely to continue.The international scientific community must be ready torespond accurately and without bias to questions of potentialenvironmental impacts, long-term efficiency or benefits ofthis technique, weighing ocean carbon sequestration againstother options and the critical need to stabilize atmosphericCO2 at a concentration that will avoid the majority of impactson human life and welfare.
Keeping watch
The ultimate objective of the UN Framework Convention onClimate Change is ‘to achieve stabilization of greenhouse gasconcentrations in the atmosphere at a level that would pre-vent dangerous anthropogenic interference with the climatesystem.’ Whereas ‘dangerous anthropogenic interferencewith climate’ has been widely discussed, no such debate hastaken place over acceptable oceanic CO2 levels. As a result,there are no standards to apply to judge what oceanic CO2
levels should be considered tolerable for marine life or howproposed carbon management strategies might moderate orexacerbate effects on ocean chemistry and biology.
The IOC will maintain its Watching Brief on ocean carbonsequestration science and will continue to bring together theinternational and intergovernmental scientific community todevelop unbiased policy-relevant scientific information foruse by scientists, policy makers and the general public.
Maria Hood20
Read the report of the symposium and the IOC Watching Brief :http://ioc.unesco.org/iocweb/co2panel/
Increasing CO2 and sea temperatures can rapidly change coralreefs from healthy ecosystems into virtual graveyards ofbleached and decaying coral
20. UNESCO Programme Specialist in marine sciences
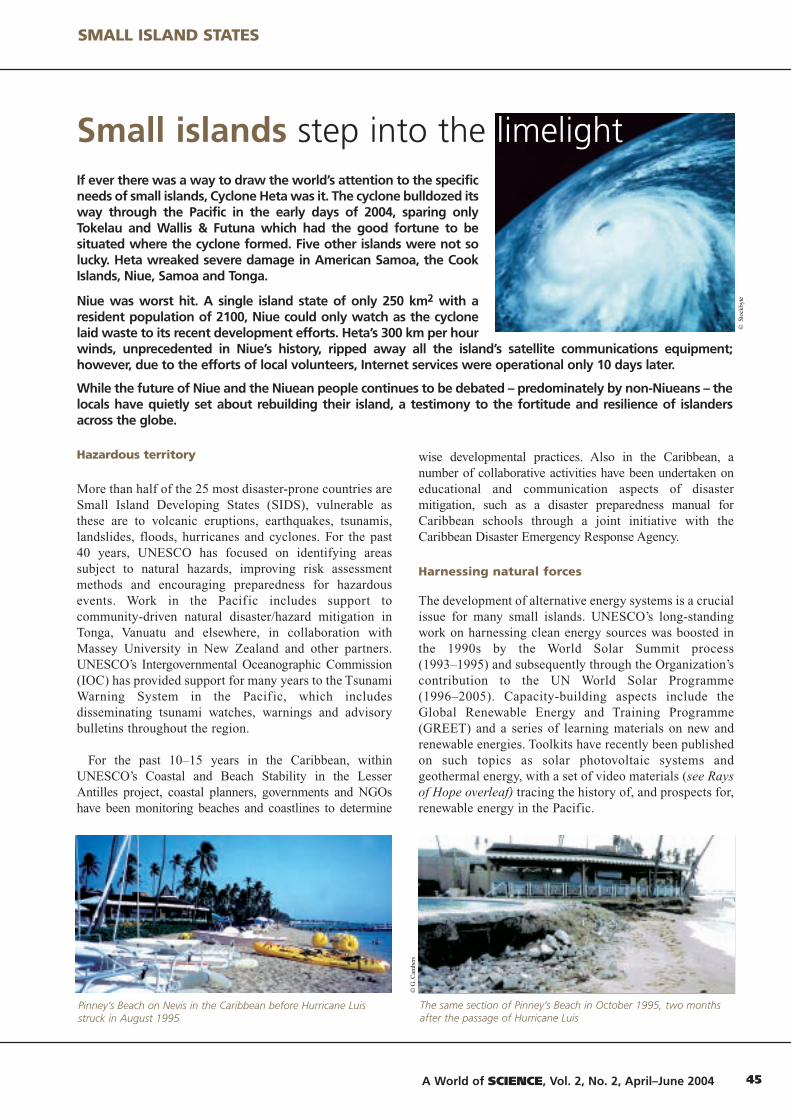
45A World of SCIENCE, Vol. 2, No. 2, April–June 2004
Hazardous territory
More than half of the 25 most disaster-prone countries areSmall Island Developing States (SIDS), vulnerable asthese are to volcanic eruptions, earthquakes, tsunamis,landslides, floods, hurricanes and cyclones. For the past40 years, UNESCO has focused on identifying areassubject to natural hazards, improving risk assessmentmethods and encouraging preparedness for hazardousevents. Work in the Pacific includes support tocommunity-driven natural disaster/hazard mitigation inTonga, Vanuatu and elsewhere, in collaboration withMassey University in New Zealand and other partners.UNESCO’s Intergovernmental Oceanographic Commission(IOC) has provided support for many years to the TsunamiWarning System in the Pacific, which includesdisseminating tsunami watches, warnings and advisorybulletins throughout the region.
For the past 10–15 years in the Caribbean, withinUNESCO’s Coastal and Beach Stability in the LesserAntilles project, coastal planners, governments and NGOshave been monitoring beaches and coastlines to determine
wise developmental practices. Also in the Caribbean, anumber of collaborative activities have been undertaken oneducational and communication aspects of disastermitigation, such as a disaster preparedness manual forCaribbean schools through a joint initiative with theCaribbean Disaster Emergency Response Agency.
Harnessing natural forces
The development of alternative energy systems is a crucialissue for many small islands. UNESCO’s long-standingwork on harnessing clean energy sources was boosted inthe 1990s by the World Solar Summit process(1993–1995) and subsequently through the Organization’scontribution to the UN World Solar Programme(1996–2005). Capacity-building aspects include theGlobal Renewable Energy and Training Programme(GREET) and a series of learning materials on new andrenewable energies. Toolkits have recently been publishedon such topics as solar photovoltaic systems andgeothermal energy, with a set of video materials (see Raysof Hope overleaf) tracing the history of, and prospects for,renewable energy in the Pacific.
SMALL ISLAND STATES
The same section of Pinney’s Beach in October 1995, two monthsafter the passage of Hurricane Luis
©St
ockb
yte
If ever there was a way to draw the world’s attention to the specificneeds of small islands, Cyclone Heta was it. The cyclone bulldozed itsway through the Pacific in the early days of 2004, sparing onlyTokelau and Wallis & Futuna which had the good fortune to besituated where the cyclone formed. Five other islands were not solucky. Heta wreaked severe damage in American Samoa, the CookIslands, Niue, Samoa and Tonga.
Niue was worst hit. A single island state of only 250 km2 with aresident population of 2100, Niue could only watch as the cyclonelaid waste to its recent development efforts. Heta’s 300 km per hourwinds, unprecedented in Niue’s history, ripped away all the island’s satellite communications equipment;however, due to the efforts of local volunteers, Internet services were operational only 10 days later.
While the future of Niue and the Niuean people continues to be debated – predominately by non-Niueans – thelocals have quietly set about rebuilding their island, a testimony to the fortitude and resilience of islandersacross the globe.
©G
.Cam
bers
Pinney’s Beach on Nevis in the Caribbean before Hurricane Luisstruck in August 1995
Small islands step into the limelight
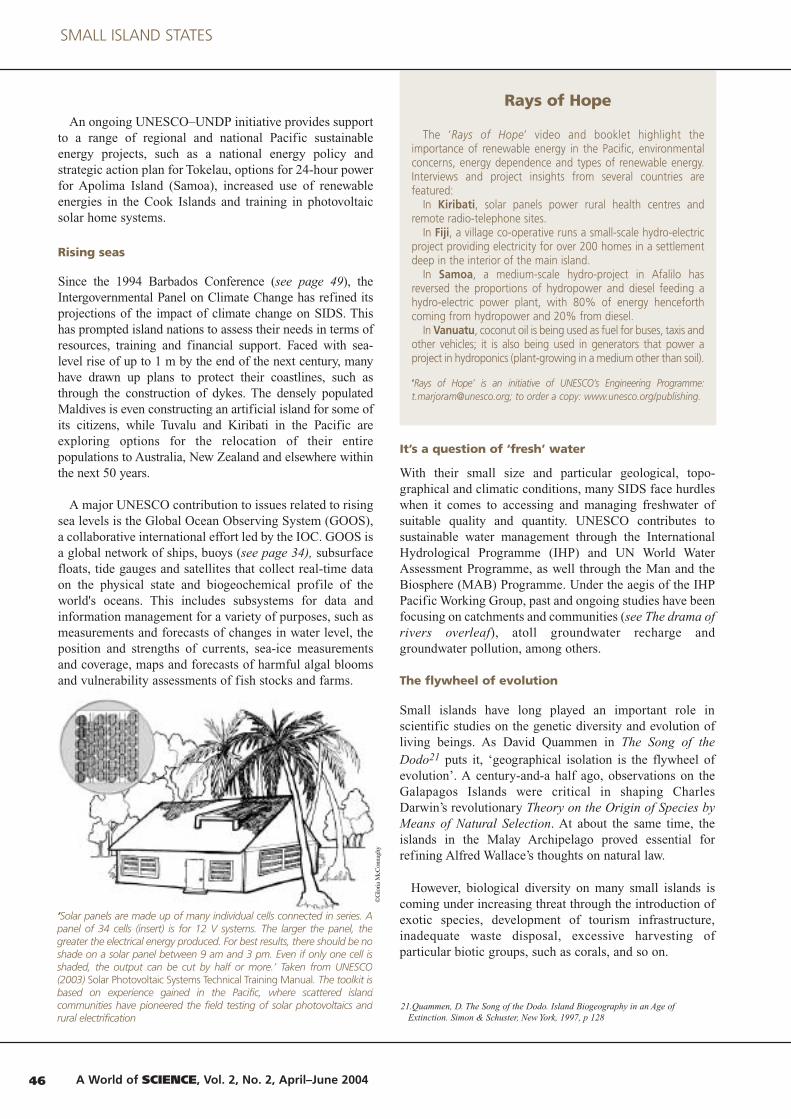
A World of SCIENCE, Vol. 2, No. 2, April–June 2004 46
An ongoing UNESCO–UNDP initiative provides supportto a range of regional and national Pacific sustainableenergy projects, such as a national energy policy andstrategic action plan for Tokelau, options for 24-hour powerfor Apolima Island (Samoa), increased use of renewableenergies in the Cook Islands and training in photovoltaicsolar home systems.
Rising seas
Since the 1994 Barbados Conference (see page 49), theIntergovernmental Panel on Climate Change has refined itsprojections of the impact of climate change on SIDS. Thishas prompted island nations to assess their needs in terms ofresources, training and financial support. Faced with sea-level rise of up to 1 m by the end of the next century, manyhave drawn up plans to protect their coastlines, such asthrough the construction of dykes. The densely populatedMaldives is even constructing an artificial island for some ofits citizens, while Tuvalu and Kiribati in the Pacific areexploring options for the relocation of their entirepopulations to Australia, New Zealand and elsewhere withinthe next 50 years.
A major UNESCO contribution to issues related to risingsea levels is the Global Ocean Observing System (GOOS),a collaborative international effort led by the IOC. GOOS isa global network of ships, buoys (see page 34), subsurfacefloats, tide gauges and satellites that collect real-time dataon the physical state and biogeochemical profile of theworld's oceans. This includes subsystems for data andinformation management for a variety of purposes, such asmeasurements and forecasts of changes in water level, theposition and strengths of currents, sea-ice measurementsand coverage, maps and forecasts of harmful algal bloomsand vulnerability assessments of fish stocks and farms.
It’s a question of ‘fresh’ water
With their small size and particular geological, topo-graphical and climatic conditions, many SIDS face hurdleswhen it comes to accessing and managing freshwater ofsuitable quality and quantity. UNESCO contributes tosustainable water management through the InternationalHydrological Programme (IHP) and UN World WaterAssessment Programme, as well through the Man and theBiosphere (MAB) Programme. Under the aegis of the IHPPacific Working Group, past and ongoing studies have beenfocusing on catchments and communities (see The drama ofrivers overleaf), atoll groundwater recharge andgroundwater pollution, among others.
The flywheel of evolution
Small islands have long played an important role inscientific studies on the genetic diversity and evolution ofliving beings. As David Quammen in The Song of theDodo21 puts it, ‘geographical isolation is the flywheel ofevolution’. A century-and-a half ago, observations on theGalapagos Islands were critical in shaping CharlesDarwin’s revolutionary Theory on the Origin of Species byMeans of Natural Selection. At about the same time, theislands in the Malay Archipelago proved essential forrefining Alfred Wallace’s thoughts on natural law.
However, biological diversity on many small islands iscoming under increasing threat through the introduction ofexotic species, development of tourism infrastructure,inadequate waste disposal, excessive harvesting ofparticular biotic groups, such as corals, and so on.
‘Solar panels are made up of many individual cells connected in series. Apanel of 34 cells (insert) is for 12 V systems. The larger the panel, thegreater the electrical energy produced. For best results, there should be noshade on a solar panel between 9 am and 3 pm. Even if only one cell isshaded, the output can be cut by half or more.’ Taken from UNESCO(2003) Solar Photovoltaic Systems Technical Training Manual. The toolkit isbased on experience gained in the Pacific, where scattered islandcommunities have pioneered the field testing of solar photovoltaics andrural electrification
©G
loria
McC
onna
ghy
21.Quammen, D. The Song of the Dodo. Island Biogeography in an Age ofExtinction. Simon & Schuster, New York, 1997, p 128
Rays of Hope
The ‘Rays of Hope’ video and booklet highlight theimportance of renewable energy in the Pacific, environmentalconcerns, energy dependence and types of renewable energy.Interviews and project insights from several countries arefeatured:
In Kiribati, solar panels power rural health centres andremote radio-telephone sites.
In Fiji, a village co-operative runs a small-scale hydro-electricproject providing electricity for over 200 homes in a settlementdeep in the interior of the main island.
In Samoa, a medium-scale hydro-project in Afalilo hasreversed the proportions of hydropower and diesel feeding ahydro-electric power plant, with 80% of energy henceforthcoming from hydropower and 20% from diesel.
In Vanuatu, coconut oil is being used as fuel for buses, taxis andother vehicles; it is also being used in generators that power aproject in hydroponics (plant-growing in a medium other than soil).
‘Rays of Hope’ is an initiative of UNESCO’s Engineering Programme:[email protected]; to order a copy: www.unesco.org/publishing.
SMALL ISLAND STATES
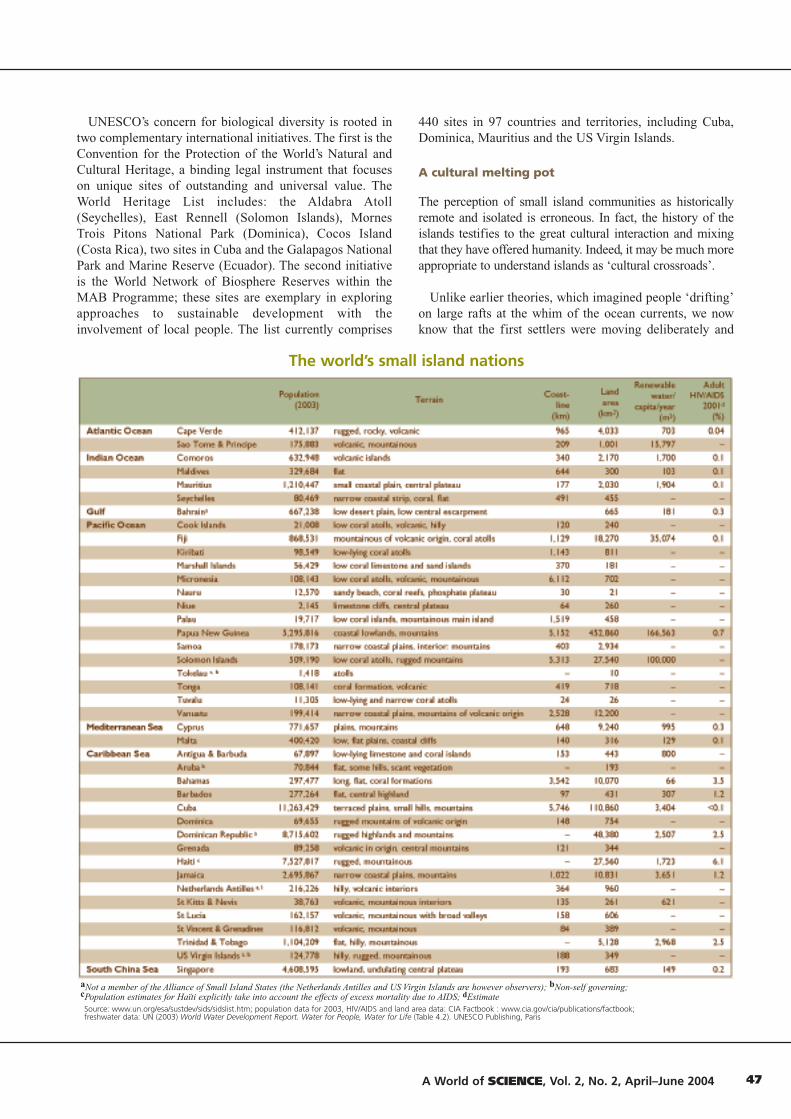
47A World of SCIENCE, Vol. 2, No. 2, April–June 2004
UNESCO’s concern for biological diversity is rooted intwo complementary international initiatives. The first is theConvention for the Protection of the World’s Natural andCultural Heritage, a binding legal instrument that focuseson unique sites of outstanding and universal value. TheWorld Heritage List includes: the Aldabra Atoll(Seychelles), East Rennell (Solomon Islands), MornesTrois Pitons National Park (Dominica), Cocos Island(Costa Rica), two sites in Cuba and the Galapagos NationalPark and Marine Reserve (Ecuador). The second initiativeis the World Network of Biosphere Reserves within theMAB Programme; these sites are exemplary in exploringapproaches to sustainable development with theinvolvement of local people. The list currently comprises
440 sites in 97 countries and territories, including Cuba,Dominica, Mauritius and the US Virgin Islands.
A cultural melting pot
The perception of small island communities as historicallyremote and isolated is erroneous. In fact, the history of theislands testifies to the great cultural interaction and mixingthat they have offered humanity. Indeed, it may be much moreappropriate to understand islands as ‘cultural crossroads’.
Unlike earlier theories, which imagined people ‘drifting’on large rafts at the whim of the ocean currents, we nowknow that the first settlers were moving deliberately and
The world’s small island nations
aNot a member of the Alliance of Small Island States (the Netherlands Antilles and US Virgin Islands are however observers); bNon-self governing; cPopulation estimates for Haïti explicitly take into account the effects of excess mortality due to AIDS; dEstimateSource: www.un.org/esa/sustdev/sids/sidslist.htm; population data for 2003, HIV/AIDS and land area data: CIA Factbook : www.cia.gov/cia/publications/factbook; freshwater data: UN (2003) World Water Development Report. Water for People, Water for Life (Table 4.2). UNESCO Publishing, Paris

A World of SCIENCE, Vol. 2, No. 2, April–June 2004 48
knowingly amongst the vast body of water that is thePacific Ocean. Those ‘bits’ of land in the sea, the islands,were their meeting points, their ‘crossroads’. With thisunderstanding, UNESCO launched ‘Vaka Moana: theOcean Roads’ under the auspices of the World Decade ofCultural Development, with the intention of reinforcinglinkages between Pacific peoples through a betterknowledge of their common historical links anddependence on the ocean, and the promotion of all forms ofart which have the common theme of the sea.
Promoting cultural heritage
In terms of the conservation of cultural heritage, moreimportant perhaps to many SIDS than tangible propertiesand sites is what is known as ‘intangible cultural heritage’.This embraces all forms of traditional and popular or folkculture originating in a given community transmitted orallyor by gesture, including customs, languages, music, dance,rituals, festivities, traditional medicine and pharmacopoeia.
Several UNESCO cross-cutting activities are underwayin island settings on the use of cultural assets for raisingliving standards and preserving cultural heritage. Theseschemes include the promotion in the Pacific region oftraditional crafts as a way to open up job opportunities forthe poorest youth. In the Caribbean, the YouthPATHinitiative seeks to involve rural youth in natural and culturalheritage tourism and other income-generating initiatives.Activities focus on such attractions as a nesting turtle site,
a former slave village, a fishing–whaling settlement.Underpinning the whole regional project is the notion of theCaribbean Sea as a connective link between island cultures,in temporal as well as spatial terms.
Transmission of traditional knowledge
Local and indigenous knowledge is another dimension ofcultural diversity that takes on special significance in smallisland situations. Traditional marine resource management inthe Pacific has been the focus of several UNESCO eventssince the 1980s. In recent years, UNESCO work on localknowledge has been boosted through discussions on ‘scienceand other systems of knowledge’ linked to the UNESCO–ICSU World Conference on Science (Budapest, June 1999).
One significant outcome has been the launching of theproject on Local and Indigenous Knowledge Systems in aGlobal Society (LINKS). In mid-2004, LINKS will bereleasing a CD-ROM on traditional navigation in thePacific, which will serve primarily as an educational toolfor schools highlighting to students the significance ofstick charts for teaching swell patterns, stone circles forillustrating star compasses and other indigenousknowledge practices. LINKS is also working through aVanuatu-based project to encourage primary andsecondary pupils to incorporate indigenous knowledgewithin their own communities and schools.
The fight against HIV/AIDS
Being a dynamic cultural crossroad can also negativelyimpact upon a country’s aspirations. One serious concern inthis regard is HIV/AIDS. Studies, especially those in theCaribbean, have underlined the cultural dimension in theprevention of HIV/AIDS and in caring for its victims, as wellas the critical role of education in limiting the spread andimpact of the epidemic. Multidisciplinary cooperation andbroad partnerships are crucial for the prevention ofHIV/AIDS, as are innovative uses of media andcommunication tools in building targeted public awarenessand fostering behaviour change, particularly among youth.
The drama of rivers
For the past three years in the Epule community in Vanuatu,there has been a ban on fishing in the local river and on someof the associated reefs. This has met with resistance from thelocals even though they have long suspected that their river wasbeing polluted by logging, farming and a growing villagepopulation. The village chief hopes the locals will ultimatelycome to accept the ban.
The desire to impress upon the local ni-Vanuatu people thatthe ultimate responsibility for the management of waterresources lay with them inspired the IHP to join forces recentlywith the local theatre groups Haulua and Won Smol Bag(bislama for ‘one small bag’). The theatre groups put on playsfor the local communities highlighting types of behaviour whichare harmful to the river and contrary to laws and codes ofpractice within Vanuatu, such as logging within 50 m of a river.
The script for the River Play was developed in closecollaboration with the Department of Geology, Mines andWater Resources. The performances were well received byvillage audiences at a number of locations. Most importantly,during the lively discussions which followed each performance,many villagers offered to participate in prevention andrestoration activities, such as tree-planting along streams andrivers, or the monitoring of catchments.
For further information on the IHP’s Catchments and Communities project: www.unesco.org/water
Traditional navigation in the Pacific; foliage in the boat riggingprovides a simple means of following subtle changes in the directionand strength of the wind
©U
NE
SCO
/Chr
isto
pher
Mer
cier
SMALL ISLAND STATES

49A World of SCIENCE, Vol. 2, No. 2, April–June 2004
Connecting islands to the global community
With limited numbers of tertiary institutes based in smallislands – thereby exacerbating island ‘brain drain’– one of theburgeoning areas of higher education is expected to bedistance learning modules and programmes through greaterapplication of ICTs. In a similar way, Community Multi-media Centres (CMCs) encourage community empowermentand address the digital divide by combining communitybroadcasting with Internet and related technologies. The aimis to transform existing community radio stations into CMCs,complete with PCs, faxes, telephones, and email and Internetservices. Initial participants include radio stations inBarbados, Cuba, Jamaica, and Trinidad & Tobago.
Small Islands Voice (SIV23) is an inter-regional initiativein the Caribbean Sea and Indian and Pacific island regions.It uses ICTs and existing media to encourage general publicdiscussion and involvement in sustainable developmentactivities at a local level. Young islanders are also assuredtheir ‘space to speak’ via the SIV Internet youth forum24,which has generated debate on diverse subjects rangingfrom whaling and asbestos in schools to recycling andgrowing levels of gang violence.
Implementation of the UN Barbados Programme of Actionhas had mixed results. Many living in small islands have noknowledge of the BPoA and how it relates to their everydaylife. However, various initiatives have been improving life inSIDS. These include the Alliance of Small Island States andthe UN-based information network, SIDSNET. Along withsister agencies, UNESCO is contributing to the overall goal ofsustainable island development, in the belief that these islandstates are not ‘islands in a far sea’ but ‘a sea of islands’25.
Claire Green26 and Malcom Hadley27
22.UNESCO’s International Institute of Educational Planning and the University ofthe West Indies, 2003; and the Regional Strategy on Education and HIV/AIDSfor the Caribbean, UNESCO Kingston and IIEP
23.www.smallislandsvoice.org
24.www.sivyouth.org – username: view; password: only
25.Hau’ofa, E. (1993) Our Sea of Islands. In: A New Oceania. Rediscovering OurSea of Islands. University of the South Pacific, Fiji, and Beake House, p. 7
26.UNESCO Coastal Regions and Small Islands platform: www.unesco.org/csi
27.Former Editor, Nature and Resources (UNESCO quarterly)
In the Caribbean, UNESCO is working with a range ofpartners to encourage effective policies and practices forHIV/AIDS mitigation and prevention within formal andnon-formal education. One example is a pilot project inJamaica involving UNESCO, the Ministry of Education andother educational institutions in the country22.
Sustainable development cannever be realized without youth
Immediately prior to, and during, the international BPoA reviewmeeting in Mauritius in January 2005, young islanders from all SIDSwill meet to discuss their concerns about small island living, shareexperiences, promote cultural under-standing, participate in debatesand side-events and present their outcomes to the main meeting.This initiative, dubbed ‘Youth Visioning for Island Living’, whileproposed by the Ministry of Education and Scientific Research ofMauritius, is being facilitated initially by UNESCO as a joint effortbetween its Coastal Regions and Small Islands Platform and itsSection for Youth, and supported by a variety of national, regionaland inter-regional organizations and donors.
Go to: www.unesco.org/csi/smis/siv/vision-action.htm
Bequia Community High School in St Vincent & the Grenadines, contributingonline to the Small Islands Voice youth Internet forum
©U
NE
SCO
/Her
man
Bel
mar
‘Front-line zones’on the road to Mauritius
‘The world’s small island developing states are front-linezones where, in concentrated form, many of the main
problems of environment and development are unfolding’.
United Nations Secretary-General, Kofi Annan,New York, September 1999
Rio, June 1992. The international community at the EarthSummit recognized that small islands are ‘a special case forenvironment and development’. This understanding paved theway for small island developing states to come together as a groupto discuss their specific concerns.
Barbados, April – May 1994, ‘Small Islands: Big Issues’. TheGlobal Conference on the Sustainable Development of SmallIsland Developing States. The Agenda 21 adopted at Rio spawnedthe Barbados Programme of Action (BPoA). BPoA lists 15 priorityareas for specific action, including climate change and sea-levelrise; natural and environmental disasters; waste management;coastal and marine resources; and tourism.
Johannesburg, September 2002. The World Summit onSustainable Development reaffirmed that SIDS are a special casein terms of both environment and development. Among therecommended follow-up actions, the Johannesburg summitcalled for a full and comprehensive review of the BPoA.
Mauritius, 10–14 January, ‘Small Islands, Big Stakes’. As decidedby the UN General Assembly, a full and comprehensive 10-yearreview of the implementation of the BPoA will be undertakenand emerging issues will be identified for follow-up.
For further information on UNESCO’s contribution to BPoA:www.portal.unesco.org/islandsBplus10; on the SIDS Network and theAlliance of Small Island States: www.sidsnet.org/aosis

For thousands of years, the Altai Mountains have been an important passage between the Mongolian and Kazakh steppes. The area is a rich source of archaeological informa-tion on commercial routes and other exchanges between populations. The Silk Road lies nearby and, buried in the graves of the Scythians, one can find Chinese vases, Persian carpets, Indian silks...
The term ‘Scythian’ is a generic term for the various populations which inhabited the Eurasian Steppe during the Iron Age and thus does not cover a single civilization. The Scythian economy was based on a semi-nomadic way of life.
People moved about with the seasons, taking their herds of horses, yaks, sheep and goats with them and always return-ing to home base in the summer. This way of life has partly survived until today. As a result, no large villages or cities have ever been built and ancient settlements are a rare find. The primary source of archaeological information about the Scythians thus comes from the burial mounds, or kurgans.
Buried with gold and horses
The Scythians were skilled warriors on horseback. Masters of horse breeding, they were traders but also feared for their raids on neighbouring territories. Some of these raids took them as far afield as Babylon or Eastern Europe.
The horses followed the Scythians into their tombs. The bodies of sacrificed horses have been found in the graves, together with artefacts and utensils made of wood, leather,
cloth, silk, metal and gold. The ornaments are exquisitely made and in many cases exception-ally well-preserved.
Many of the tombs are buried in permafrost, which maintains temperatures at between 0°C and -20°C. As the Scythian populations inhabited the entire Eurasian Steppe stretch-ing from the Black Sea to Mongolia, the frozen tombs
are a unique source of information about one of the most intriguing cultures of their time.
Hundreds of frozen tombs lie scattered across the Altai moun-tains straddling Russia, Kazakhstan, Mongolia and China. A major archaeological find dating back to the 1920s, these tombs belong to the lost Scythian culture which flourished 2500 years ago. Inside the tombs lie bodies which have often been so well preserved in the frozen ground that even the tattoos on their skin remain intact.
Grave robbers and fortune hunters have been the tombs’ traditional enemies but, today, a new threat hangs over them. Climate change is causing the permafrost in this part of Siberia to thaw. In a race against time, UNESCO and the University of Ghent in Belgium are helping teams in Russia and Kazakhstan to pinpoint the location of the remaining tombs from space, to help local conservationists protect them.
Saviours from space for Siberia’s frozen tombs
A very fine feline image made of wood and cov-ered in gold leaf, as found in a grave in Berel in east Kazakhstan. In the background, you can see a perfectly preserved horse’s hoof, complete with skin and hair. The bodies of horses were not mummified, so their internal organs remain. The content of a horse’s stomach can tell us a lot about vegetation, climate etc.
©Ig
nace
Bou
rgeo
is
View of a coffin and sarcophagus in Berel in 2000 before they were hoisted out of the grave by the teams of Zeinolla Samashev from the Kazakh Institute of Archaeology and Henri-Paul Francfort from the Centre national de recherche scientifique (CNRS) in France. Once removed from its rest-ing place, the wooden tomb was treated immediately with chemicals to prevent it from disintegrating after being exposed to the air and dryness. Wood samples were also taken for the purpose of dating the find. This is done by comparing the growth rings on the timber
© H.-P. Francfort/CNRS
A World of SCIENCE, Vol. 4, No. 3, July – September 2006 3A World of SCIENCE, Vol. 4, No. 3, July – September 20062 A World of SCIENCE, Vol. 4, No. 3, July – September 200650
CULTURAL HERITAGE
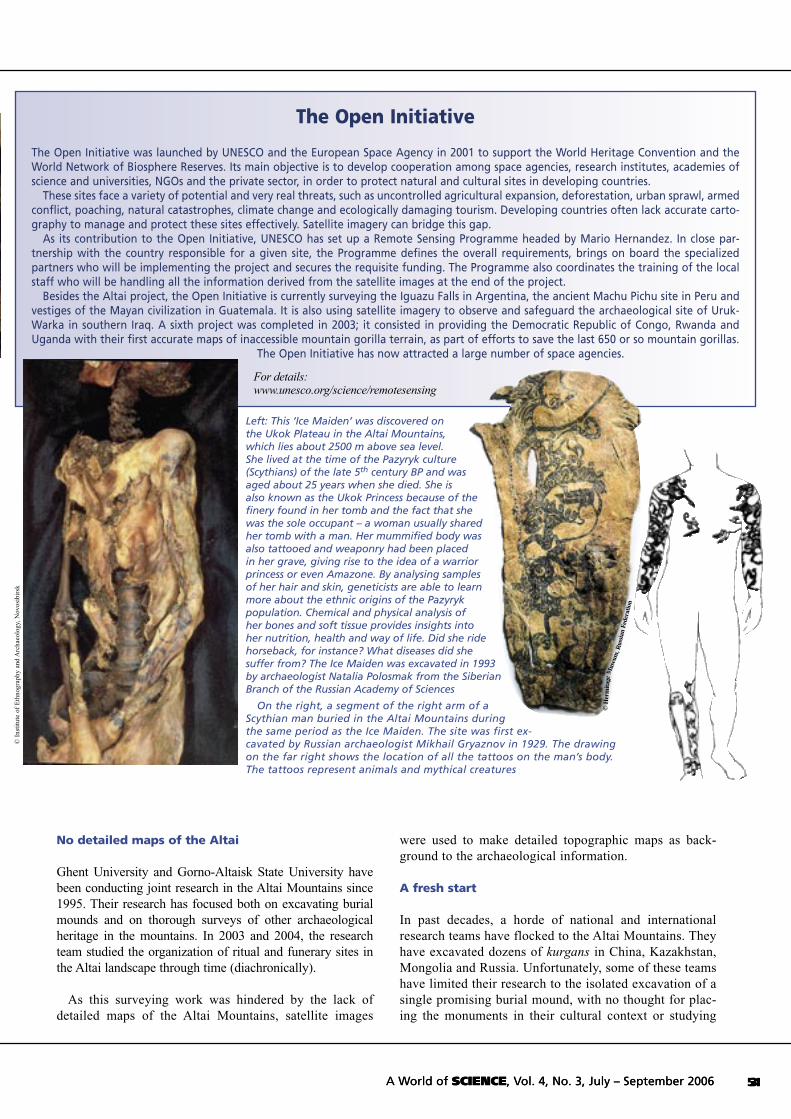
The Open Initiative
The Open Initiative was launched by UNESCO and the European Space Agency in 2001 to support the World Heritage Convention and the World Network of Biosphere Reserves. Its main objective is to develop cooperation among space agencies, research institutes, academies of science and universities, NGOs and the private sector, in order to protect natural and cultural sites in developing countries.
These sites face a variety of potential and very real threats, such as uncontrolled agricultural expansion, deforestation, urban sprawl, armed conflict, poaching, natural catastrophes, climate change and ecologically damaging tourism. Developing countries often lack accurate carto- graphy to manage and protect these sites effectively. Satellite imagery can bridge this gap.
As its contribution to the Open Initiative, UNESCO has set up a Remote Sensing Programme headed by Mario Hernandez. In close par-tnership with the country responsible for a given site, the Programme defines the overall requirements, brings on board the specialized partners who will be implementing the project and secures the requisite funding. The Programme also coordinates the training of the local staff who will be handling all the information derived from the satellite images at the end of the project.
Besides the Altai project, the Open Initiative is currently surveying the Iguazu Falls in Argentina, the ancient Machu Pichu site in Peru and vestiges of the Mayan civilization in Guatemala. It is also using satellite imagery to observe and safeguard the archaeological site of Uruk-Warka in southern Iraq. A sixth project was completed in 2003; it consisted in providing the Democratic Republic of Congo, Rwanda and Uganda with their first accurate maps of inaccessible mountain gorilla terrain, as part of efforts to save the last 650 or so mountain gorillas.
The Open Initiative has now attracted a large number of space agencies.
Left: This ‘Ice Maiden’ was discovered on the Ukok Plateau in the Altai Mountains, which lies about 2500 m above sea level. She lived at the time of the Pazyryk culture (Scythians) of the late 5th century BP and was aged about 25 years when she died. She is also known as the Ukok Princess because of the finery found in her tomb and the fact that she was the sole occupant – a woman usually shared her tomb with a man. Her mummified body was also tattooed and weaponry had been placed in her grave, giving rise to the idea of a warrior princess or even Amazone. By analysing samples of her hair and skin, geneticists are able to learn more about the ethnic origins of the Pazyryk population. Chemical and physical analysis of her bones and soft tissue provides insights into her nutrition, health and way of life. Did she ride horseback, for instance? What diseases did she suffer from? The Ice Maiden was excavated in 1993 by archaeologist Natalia Polosmak from the Siberian Branch of the Russian Academy of Sciences
On the right, a segment of the right arm of a Scythian man buried in the Altai Mountains during the same period as the Ice Maiden. The site was first ex-cavated by Russian archaeologist Mikhail Gryaznov in 1929. The drawing on the far right shows the location of all the tattoos on the man’s body. The tattoos represent animals and mythical creatures
© I
nsti
tute
of
Eth
nogr
aphy
and
Arc
haeo
logy
, Nov
osib
irsk
No detailed maps of the Altai
Ghent University and Gorno-Altaisk State University have been conducting joint research in the Altai Mountains since 1995. Their research has focused both on excavating burial mounds and on thorough surveys of other archaeological heritage in the mountains. In 2003 and 2004, the research team studied the organization of ritual and funerary sites in the Altai landscape through time (diachronically).
As this surveying work was hindered by the lack of detailed maps of the Altai Mountains, satellite images
were used to make detailed topographic maps as back-ground to the archaeological information.
A fresh start
In past decades, a horde of national and international research teams have flocked to the Altai Mountains. They have excavated dozens of kurgans in China, Kazakhstan, Mongolia and Russia. Unfortunately, some of these teams have limited their research to the isolated excavation of a single promising burial mound, with no thought for plac-ing the monuments in their cultural context or studying
© H
erm
itage
Mus
eum
, Rus
sian
Fed
erat
ion
For details: www.unesco.org/science/remotesensing
A World of SCIENCE, Vol. 4, No. 3, July – September 2006 3A World of SCIENCE, Vol. 4, No. 3, July – September 20062 51A World of SCIENCE, Vol. 4, No. 3, July – September 2006

the position of the sites in the landscape as a whole. More-over, attempts have been made in the past to come up with protection measures and conservation management plans for the kurgans but none of these has ever got far beyond the drawing board.
The project put together by Ghent University with the support of UNESCO and a generous contribution of €330,000 from the Flemish Community of Belgium now fills this gap. The project sets out to inventory all the frozen tombs in the Altai Mountains, together with other archaeological heritage, over a two-year period beginning in 2005. To do this, the University of Ghent is deriving maps from satellite imagery that show the detailed topog-raphy of the region and the resting place of each kurgan. In parallel, the project is assessing climate change in the Altai and analysing the threats which climate change poses to the frozen tombs.
Of robbers and roads
For many of the tombs alas, help will come too late. They have been destroyed by grave robbers and fortune hunters, some many centuries ago, others only recently. As a deter-rent, the Russian government now demands a research permit before a kurgan can be excavated.
Other tombs have escaped the robbers, only to have their long sleep disturbed by roadworks. The construction of roads is gradually opening up this formerly inaccessible territory. When they were in Dzhazator in 2005, for exam-ple, the team from Ghent saw several sites that had been disturbed by roadworks.
In this case, however, something can be done to protect the tombs. Having a detailed inventory of the location of all the archaeological monuments in the area will help local authorities plan infrastructure development, such as the path a pipeline should follow. The inventory will also
prove invaluable to the authori-ties in regulating emerging tourist activities, such as rafting, alpi-nism or camping, and in building awareness of the need to preserve the kurgans.
A more insidious threat
The other threat to the frozen tombs is weather-related. As the Altai Mountains are situated on the border of the vast permafrost zone covering much of Siberia, permafrost in the Altai is very vulnerable to climate change. With the permafrost that preserves the kurgans now gradually thaw-ing, the frozen tombs and their precious contents will soon no longer be packed in the ice that has preserved them for so long. Measurements taken at weather stations, borehole monitoring and research on glaciers all indicate that the climate in the Altai is changing considerably. Permafrost in the region could disappear completely by the middle of this century. After 2500 years of perfect conservation, the remaining kurgans and the insights they provide into the ancient nomad Scythian culture could be lost for ever.
This ornament resembling a reindeer was found on a horse harness in Berel. All the ornaments preserved in permafrost for centuries must be treated with chemicals immediately after being recovered, or they will crumble with exposure to the air. It would thus be pointless for modern-day grave robbers to steal the artefacts, as they would walk away empty-handed
Here, a photo of Tuyuksu Glacier in Northern Tien Shan in July 1997. The glacier has retreated 362 m since 1955. No complete map showing the retreat of permafrost in the Altai mountains over time has ever been made, although the International Permafrost Association is looking for funding to monitor and map the permafrost of the entire Altai mountain range
©H
.-P. F
ranc
fort/
CN
RS
©S.
Mar
chen
ko/A
lask
a Fa
irban
ks U
nive
rsity
Map of the research areas covered in 2003, 2004 and 2005. This map was made using RADAR images from the Shuttle Radar Topography Mission
©W
. Ghe
yle/
Uge
nt
A World of SCIENCE, Vol. 4, No. 3, July – September 200652
CULTURAL HERITAGE

Satellites to the rescue
Within its ‘Open Initiative’, UNESCO has brought in additional expertise to complement that of the University of Ghent in remote sensing (see box p. 51). It was UNESCO, for instance, which brought in the Jet Propulsion Laboratory, a research centre of the US National Aeronautics and Space Agency (NASA), to provide the University of Ghent with ASTER satellite images to monitor the status of
the glaciers in the Altai Mountains (see A beginner’s guide to remote sensing). The glaciers will need to be monitored continuously over several decades to determine which of them are retreating or advancing, a clear sign of climate change. Indirectly, this may provide insights into the rate at which permafrost is thawing. Armed with this information, local con-
servationists will be able to establish priorities for preserving each of the tombs. They will be able to determine, for example, which tombs lie in the areas where the permafrost is thawing fastest.
The kurgans are literally packed in ice. After burial, each tomb was covered with stones which formed a permeable mound. Rainfall was able to penetrate the tomb where it froze. Over time, this process created an iceblock which preserved the tomb and its entire contents. As modern approaches to archaeology seek to avoid excavating tombs, scientists are studying ways of preserving the tombs in situ, such as by creating a system of ‘air condi-tioning’ that would keep the tombs frozen.
Thanks to data from the CORONA reconnaissance satellite and the precise measurements taken using a Global Positioning System (GPS) receiver, the problem of the lack of detailed maps has been overcome. The CORONA satellite provides ground resolution of 1.8 m, which is good enough for the purposes of topographi-cal mapping. It is also detailed enough to detect most archaeological structures more than 2–3 m in diameter, such as kurgans and other funerary or ritual monuments (see A beginner’s guide to remote sensing).
During the survey campaigns of 2003 and 2004, the University of Ghent was able to generate detailed topo-graphic maps and height models (3D models) derived from CORONA satellite imagery of a total surface area of 600 km2. It is possible to obtain a height model by combining two images of the same area using
A beginner’s guide to remote sensing
Remote sensing is the science of deriving informa-tion about the Earth from images acquired at a distance. The most common forms of remote sensing are aerial photography and satellite imagery.
Remote sensing makes such extensive use of photogrammetry that it can become difficult to separate the two terms. Photograms may come in the shape of photographs or imagery stored elec-tronically on tape or on disk; they may be video images or images taken using CCD cameras and other radiation sensors like scanners.
Satellite-based remote sensing usually targets the Earth’s surface, chan-ges in land cover, the oceans, snow and ice but it does also observe other areas, such as the atmosphere, the climate and recently even Mars and outer space.
Satellites may point to a fixed point on the Earth when they are in a geo- stationary orbit, as in the case of meteorological satellites, or they may cover almost the entire planet, as when they fly on an almost polar orbit. Each satellite ‘scans’ the Earth, capturing digital information that is trans-mitted to stations on the ground.
The following remote sensors are cited on these pages:
ASTER stands for Advanced Spaceborne Thermal Emission and Reflection Radiometer. ASTER is an imaging instrument flying on the Terra platform. ASTER is being used to obtain detailed maps of land surface temperature, reflectance and elevation. The thermal bands of ASTER’s digital sensors are able to give an overview of ground temperatures on a large scale.
CORONA is a satellite which dates back to the 1960s and is no longer operational. It was originally a ‘spying eye’ of the American military. In line with US policy, which makes it possible to release selected military informa-tion into the public domain after a time, the images recorded by CORONA were released in 1996 and 2002. CORONA orbited the Earth at an altitude of 160–200 km, depending on the mission.
Landsat crosses the Equator from North to South at an altitude of 705 km. This satellite operates on a repetitive 16-day cycle and completes just over 14 orbits of the Earth a day at a speed of 7.5 km per second. Landsat 7 was launched at the same time as Terra, 27 years after NASA launched the first Landsat spacecraft within its Earth Observing System. The aim is to produce an uninterrupted record of the Earth’s land surface for scientists and engineers working for state or local governments, agribusi-ness, the military, in commercial fields, academia or global change research and so on. Recently, Landsat 7 has been failing.
View of the Terra satellite plat-form launched in 1999 as part of NASA's Earth Observing System
© N
ASA
Sour
ce: B
. Van
Bev
er, U
nive
rsity
of
Gen
t
53A World of SCIENCE, Vol. 4, No. 3, July – September 2006

photo-grammetric computer software (see A beginner’s guide to remote sensing). This enabled the Ghent team to doc-ument over 3000 archaeologi-cal monuments. The data were all fed into a database linked up to a Geographical Information System (GIS). The latter is a computer application which stores, views and analyses maps and other geographical information. Although the database and GIS are being used for research purposes, the database will also be offered to the Russian conservationists to help them manage development of the area and above all protect its archaeological heritage.
Since 2005, the University of Ghent has been carrying out a thorough inventory of the archaeological heritage of parts of the Russian and Kazakh Altai Mountains using satellite imagery, in partnership with Gorno-Altaisk State University and the Margulan Institute of Archaeology in Almaty. Satellite images are being used to create a cartographical archaeological inventory that fuses traditional field work, satellite image interpretation and GPS.
Dzhazator Valley in the south of the Altai Republic of the Russian Federation was chosen for the first mapping cam-paign from 8 July to 18 August last year. Over this six-week period, 1687 different archaeological structures were located and described. These structures were spread over 192 sites and an area of 284 km². The entire Dzhazator Valley was mapped in detail using CORONA satellite images. Part of the expedition focused on defining good ground control points for Aster and Landsat satellite images. These ground control points are being used to georeference the satellite images and produce height models and orthophotographs. The latter are aerial photographs which remove the distortions of points on the ground caused by relief, tilt and perspective.
This is only the beginning
The project will need to extend over Russia’s border into the neighbouring countries of Kazakhstan, China and Mongolia to map the archaeological heritage and moni-tor climate change throughout the Altai Mountains. This year, the University of Ghent is surveying the Valley of Kara-Kaba in east Kazakhstan and studying the effects of climate change on glaciers, together with the Margulan Institute of Archaeology of Almaty and geocryologist Sergei Marchenko from the International Permafrost Association. For this segment of the project, UNESCO will be bring-ing on board another Open Initiative partner, the Chinese Academy of Sciences.
Given the need for uninterrupted monitoring of climate change over long periods of time, this will be only the beginning...
Wouter Gheyle with the collaboration of Jean Bourgeois, Jessica Bunning and Mario Hernandez28
For details: [email protected]; www.archaeology.ugent.be/altai/; www.altai-republic.ru/; [email protected]; http://whc.unesco.org/; www.unesco.org/science/remotesensing
28. Jean Bourgeois is full professor and Wouter Gheyle is a scientific researcher at the Department of Archaeology and Ancient History of Europe at Ghent University in Belgium. Mario Hernandez is Head of UNESCO’s Remote Sensing Programme and Jessica Bunning is a Programme Assistant at UNESCO
Archaeologist Kaatje De Langhe and geographer Matthijs Vanommeslaeghe are standing on a well-preserved burial mound, typical of a Scythian kurgan in its undisturbed state. Here, they are measuring the location of this burial mound using a complex Global Positioning System (GPS) receiver during the 2005 campaign
Left: Satellite image taken in 1969 from a height of more than 150 km showing four Scythian burial sites. Note the parallel alignments of small dots, starting from the river bank, representing burial mounds in Yustid Valley. The sites were excavated by V. D. Kubarev in the 1980s and documented by the Ghent team in 2004. Right: Photo taken from a hilltop of aligned Scythian burial mounds
©W
. Ghe
yle/
Uge
nt
©W
. Ghe
yle/
Uge
nt
A World of SCIENCE, Vol. 4, No. 3, July – September 200654
CULTURAL HERITAGE

55A World of SCIENCE, Vol. 5, No. 3, July – September 2007
Australia is currently in the throes of its worst drought in living memory, with all but the far northwest affected. Between 1910 and 1999, the country saw an average increase in temperature of 0.7°C, most of which occurred after 1950. Projections by the Australian Commonwealth Scientific and Industrial Research Organization (CSIRO) based on climate models indi-cate an increase in average annual temperatures ranging from 0.4°C to 2.0°C by 2030 and as much as 1.0°C to 6.0°C by 2070. Evaluating future trends in rainfall remains more dif-ficult. This change in climate regime raises a special concern for forests, where the impact of higher tempera-tures could heighten the risk of more frequent, intense and destructive wildfires, and decimate biodiversity.
The Greater Blue Mountains and The Wet Tropics of Queensland are two of the sites profiled in Case Studies on Climate Change and World Heritage, published by UNESCO’s World Heritage Centre in April. Separated by over 2700 km, these two Australian sites are poles apart in many ways: the former ecosystem is made up of temperate eucalypt forests, the latter of tropical rainforests and mangroves. Yet both will be highly vulnerable to Australia’s warmer and drier climate in the 21st century.
The Greater Blue Mountains Area owes its blue haze to the highly flammable eucalyptus oil released into the atmosphere in response to heat. More than 100 eucalypt taxa have been recorded here
The heat is on for Australia’s forests
In 2003, Lesley Hughes from Sydney's Macquarie University argued that it was difficult to plot the impact of climate change in Australia on the broad range of species, due to the lack of sufficient baseline data from which to work. Studies carried out since however on vulnerable alpine and forest ecosystems point to a significant reduction in the numbers of many species and the probable extinction of some.
Perhaps the most vulnerable vertebrate species is the Mountain Pygmy Possum (Burramys parvus), whose life cycle requires sustained alpine snow cover. It is estimated
that a 1°C rise in temperature would eliminate its bioclimate and a 2°C increase would eliminate the bioclimate of five other alpine species. Given that migration to an environment that has more snow cover is not an option, it is likely that such species will be driven to extinction.
In drier woodland ecosystems of Western Australia, a 0.5°C increase in temperature would reduce the habitat of all frogs and mammals by 28% and a 1°C increase would see the shrub species Dryandra become extinct or shrink to small pockets. Again, with only a 1°C increase in temperature, Hilbert et al29 estimate that highland
rainforest will decrease by around 50%. This is critical, given the importance of these ecosystems for many of the country’s endemic vertebrates.
Moreover, the fragmen-tation of habitat associated with small protected areas like World Heritage sites often provides limited op-portunities for migration to more compatible envi-ronments.
The Greater Blue Mountains World Heritage Area is home to the endangered Brush-tailed rock wallaby (left) and Tiger Quoll (right). Their habitats and life-support systems could be profoundly impacted upon by climate change and the increased frequency and intensity of forest fires
© S
ean
Mc L
ean
© M
el W
illia
ms
© J
im T
hors
ell/I
UC
N P
hoto
Lib
rary
The heat is on for Australia’s forests Australia’s forests Australia’s forests Australia’s forests
© M
el W
illia
ms
© M
el W
illia
ms
© S
ean
Mc L
ean
© S
ean
Mc L
ean
NATURAL HERITAGE

NATURAL HERITAGE
One of the world’s most fire-dependent forests
The eucalypt forests of Australia, including those of the Greater Blue Mountains in the southeastern state of New South Wales (see map overleaf), are among the most fire-dependent forest ecosys-tems in the world.
The Greater Blue Moun-tains World Heritage Area consists of over 1 million ha of sandstone plateaux, escarpments and gorges covered largely by temperate eucalypt forests. Comprised of eight protected areas, the site was inscribed on the World Heritage List in 2000 for its representation of the evolutionary adaptation and diversification of eucalypts in post-Gondwana isolation on the Australian continent (see box).
Another justification for the site’s inscription on the World Heritage List is that it hosts 120 rare or threatened species, including 114 endemic taxa and evolutionary relict species like the Wollemi pine, which have persisted in highly re-stricted microsites.
Eucalyptus oil highly flammable
The blue haze of the Greater Blue Mountain Area, from which it derives its name, is caused by the highly flammable eucalyptus oil being released into the atmosphere in response to heat. Many species of eucalypt, banksias and other native flora have become so adapted to fire that they only release their seeds after burning has taken place, the ash compensating for the often nutrient-poor soils.
There is usually a high rate of regrowth of eucalypts and banksias within the first three years following a major fire. However, a second hot fire, during that stage in the regeneration process, can lead to severe stress and a loss of species diversity by killing plants before they have matured sufficiently to produce seeds.
Consequently, if the interval of intense bush fires moves from long cycles of 10–20 years to below 6 years, there will be a significant decline in the diversity of the major eucalypt species and other flora of the region, a change that would have serious consequences for the ecosystem integ-rity of the area.
Studying fire behaviour
Several strategies are being developed to protect the Greater Blue Mountains from the adverse impact of wildfires in the context of a changing climate. The first is to implement more informed policies through greater research into fire behaviour and its ecological impact, especially following the terribly destructive fires of 2002 that led to the establishment of a Bushfire Cooperative Research Centre in December 2003.
The second strategy concerns the use of controlled or mosaic burning to limit the risk of intense and ecologi-
cally destructive fires, appropriately designed to take into account the specific ecosystems involved. As the Greater Blue Mountains border the rapidly expanding suburban boundaries of Sydney – Australia’s largest city with a pop-ulation of 4.3 million – there is a real risk of conflicting policy priorities between the protection of urban property and biodiversity conservation.
The gradual emergence of fire-adapted species
In Australian ecosystems, like others that have evolved in rela-tion to ‘Mediterranean type’ climatic conditions, fire has been the selective mechanism over a very long time-frame. However, in Australia, fire became a more important factor around 100 000 years ago, with the drying of the environment at the end of a major ice age.
This resulted in the decline of the country’s megafauna (large animal species) and the emergence of more fire-adapted species. Fire was to become an even more significant feature of the land-scape with the arrival of the first Aboriginal inhabitants around 60 000 years ago, who used fire to manage the landscape.
These two factors meant that the fire-sensitive species, such as beeches, pines, tree ferns and sheoaks, along with wet rain-forest species, gave way to the more fire-dependent eucalypts and banksias. This was also associated with the emergence of sclerophyll forests31 and greater erosion of topsoil leading to the silting of coastal regions and the emergence of mangroves. For the Aboriginal population, the use of ‘fire stick farm-ing’ to manage and clear the landscape was both a means of preventing extremely de-structive fires and controlling the movement of game. Such cultural practices as mosaic burning over many thousands of years were to shape profoundly the Australian landscape.
Rising temperatures could force species up the mountain
Rising temperatures may threaten flora and fauna in the very limited parts of the Greater Blue Mountains that are wetter and at a higher altitude, by forcing species to move up the mountains and reducing the availability of water. Yet one of the attributes of the site relevant to its listing under natural criteria is the vari-
Significant loss of biodiversity is projected to occur by 2020 in some ecologically rich sites, including the Great Barrier Reef and Queensland
Wet Tropics. Other sites at risk include the Kakadu wetlands,
southwest Australia, sub-Antarctic islands and the alpine areas.
IPCC (2007)30
Two red-barked snow gums (Eucalyptus pau-ciflora). Unique to Australia's southeastern alpine regions, snow gums are especially threat-ened by climate change©
Dav
id P
inn
As a result of reduced precipitation and increased evaporation, water-security problems are projected to
intensify by 2030 in southern and eastern Australia.
IPCC (2007)
A World of SCIENCE, Vol. 5, No. 3, July – September 200756

57A World of SCIENCE, Vol. 5, No. 3, July – September 2007
ability of vegetation in response to decreasing temperature across an altitude range of 100 m to 1400 m.
For example, the upland swamps of the Greater Blue Mountains contain some unique species that are adapt-ed to seasonally waterlogged soils. These species are at risk of being displaced by species tolerant of drier soils. Upland swamps also provide habitat for the endangered skink Elamprus leuraensis and the Giant Dragonfly. Their ability to retain and slowly release water also contributes to the survival of threatened plants, such as Microstrobus fitzgeraldii and Epacris hamiltonii, which have adapted to permanently moist habitats. Swamps currently at the lower end of the suitable rainfall spectrum would be most vulnerable to contraction due to changes in rainfall and/or evaporation associated with climate change.
Evidence of climate change still anecdotal
Much of the evidence of the impact of climate change on the ecosystems of the Greater Blue Mountains is anecdotal for the moment and has not been supported by adequate, systematic research. It is reported for example that at least one eucalypt species, Eucalyptus corpulens, related to the Snow Gums of the alpine regions, no longer grows in the Blue Mountains region. Some horticulturists and botanists attribute this to cli-mate change.
There is also evi-dence of a lasting impact of the intense bush fires of 2002–2003, where normal regrowth of euca-lypts has not occurred in the upper Greater Blue Mountains region.
The spread of the soil pathogen Phytophthora is hav-ing a serious impact on a number of plant species in the mountains. Plant stress due to drought, erosion and the movement of soil due to extreme weather are believed to be some of the causes for its spread and impact on many vulnerable plant communities. There is evidence of greater long-term stress on hanging swamps32 and the invertebrate species that depend upon these swamps, due to hotter and drier conditions. However, it is difficult to substantiate the claim that climate change is the cause, due to the lack of adequate research.
A better understanding for better protection
Several research projects into the impact of climate change on the Greater Blue Mountains are being conducted under the auspices of the Australian Greenhouse Office, the New South Wales Department of Environment and Conservation and the Blue Mountains World Heritage Institute. The topics under study include the impact of climate change on biodiversity and ecosystem functions (terrestrial and aquatic), synergistic effects on other threats like invasive species and risks posed by bushfires to people and property.
The Wet Tropics: a biodiversity hotspotA second case study in Australia concerns The Wet Tropics of Queensland World Heritage Area, which stretches along the nor-theastern coast of Australia for some 450 km (see map). It is made up of tropical lowland and upland rainforests and thickets, vegeta-tion complexes, mangroves and sclerophyll forests and woodlands. These ecosystems host a particularly extensive and diverse array of plant and animal species, including a high proportion considered as endemic, evolutionarily significant, rare or threatened (see box). It was these features which justified its inscription on the World Heritage List in 1988.
This remarkable ecosystem is threatened by rapid changes in tem-perature and rainfall, as many species in this area are unable to keep pace with rapid climate change.
For about half of the species modelled, a warming of 3.5 °C – cor-responding to the average projected scenario – may lead to the total loss of their core environment; for the remaining species, range sizes are likely to be reduced on average to 11% of the cur-rent area. Even a 1°C increase in mean air temperature will lead to a significant decline in range size for almost every endemic verte-brate in the Wet Tropics of Queensland.
Vertebrates living in these isolated tropical mountain rainforests may become trapped with nowhere to go, in response to the pro-jected changes in climate. Many species could be lost in the Wet Tropics of Queensland within the next 50–100 years, including a number of frogs, mammals, birds and skinks. The extent of biodi-versity loss will depend on the rate and timing of climate change.
Australia’s Marine and Tropical Scientific Research Facility is conduc-ting research to formulate feasible, proactive management initia-tives on a regional scale in response to projected climate change. This research programme, which benefits from substantial funding from the Australian government, will refine present climate change models and scenarios to verify which species and ecological commu-nities are most at risk, the long-term effects of these threats and their geographical distribution, how climate change might interact with other threats such as clearing, fragmentation, fire, weeds and feral animals; and whether, or where, some areas may provide con-tinued habitat, or new areas of habitat, in the future.
Concerning the Wet Tropics World Heritage Area specifically, the James Cook University in Townsville, Queensland, has established a Centre for Tropical Biodiversity and Climate Change Research that will focus its efforts on the impact of climate change on the biota of the Wet Tropics of Queensland.
A relict species of the Gondwanan unique to Australia and Papua New Guinea, the Southern cassowary (Casuarius casuarius johnsonii) is endangered by habitat loss. It is the third-largest bird in the world after the ostrich and emu – adults grow up to 1.8 m tall and weigh about 60 kg. Cassowaries feed on the fruits of over 150 rainforest tree species in the Wet Tropics, passing viable seeds in large dense scats (faeces). By dispersing seeds over more than 1 km, they make a key contribution to the rainforest's rich biodiversity
Production from agriculture and forestry by 2030 is projected to
decline over much of southern and eastern Australia ... due to increased
drought and fire.
IPCC (2007)
© P
aul
IJse
nd
oo
rn©
Pau
l IJ
sen
do
orn
© P
aul
IJse
nd
oo
rn
A relict species of the Gondwanan unique to Australia and Papua New Guinea, the Southern cassowary (Casuarius casuarius johnsonii) is endangered by habitat loss. It is the third-largest bird in the world after the ostrich and emu – adults grow up to 1.8 m tall and weigh about 60 kg. Cassowaries feed on the fruits of over 150 rainforest tree species in the Wet Tropics, passing viable seeds in large dense scats (faeces). By dispersing seeds over more than 1 km, they make a key contribution to the rainforest's rich biodiversity
A relict species of the Gondwanan unique to Australia and Papua New Guinea, the Southern cassowary (Casuarius casuarius johnsonii) is endangered by habitat loss. It is the third-largest bird in the world after the ostrich and emu – adults grow up to 1.8 m tall and weigh about 60 kg. Cassowaries feed on the fruits of over 150 rainforest tree species in the Wet Tropics, passing viable seeds in large dense scats (faeces). By dispersing seeds over more than 1 km, they make a key contribution to the rainforest's rich biodiversity
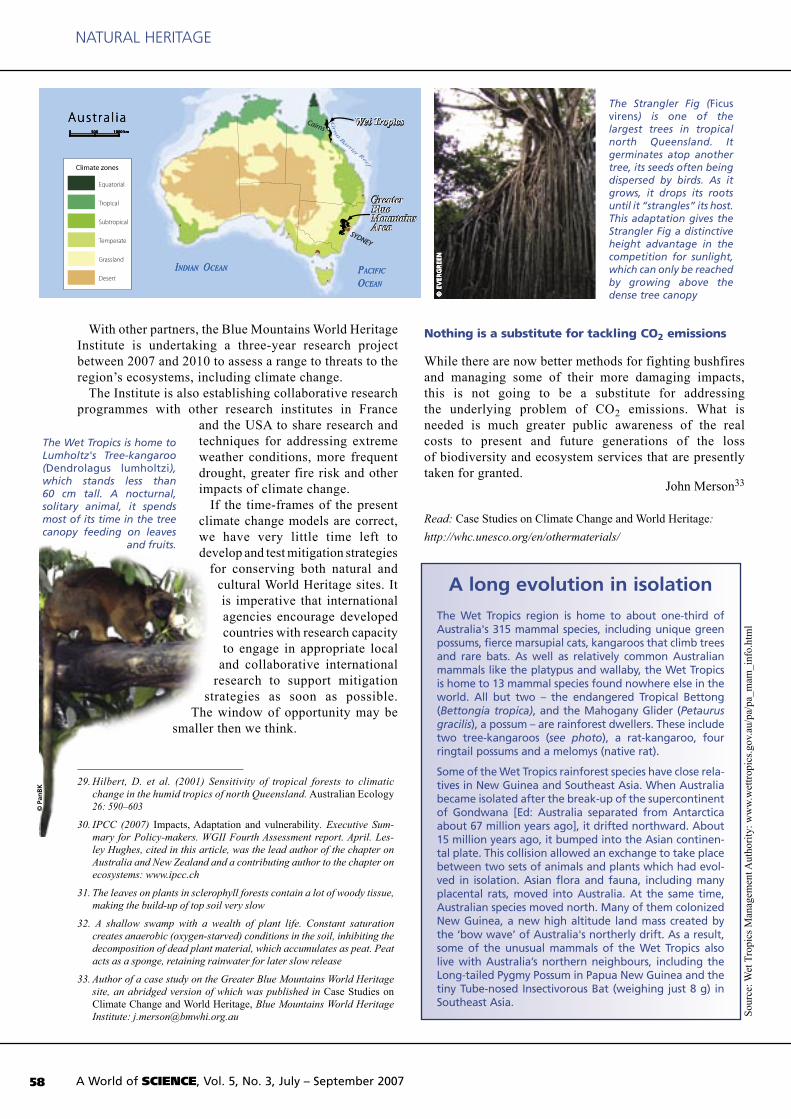
With other partners, the Blue Mountains World Heritage Institute is undertaking a three-year research project between 2007 and 2010 to assess a range to threats to the region’s ecosystems, including climate change.
The Institute is also establishing collaborative research programmes with other research institutes in France
and the USA to share research and techniques for addressing extreme weather conditions, more frequent drought, greater fire risk and other impacts of climate change.
If the time-frames of the present climate change models are correct, we have very little time left to develop and test mitigation strategies
for conserving both natural and cultural World Heritage sites. It is imperative that international agencies encourage developed countries with research capacity to engage in appropriate local
and collaborative international research to support mitigation
strategies as soon as possible. The window of opportunity may be
smaller then we think.
Nothing is a substitute for tackling CO2 emissions
While there are now better methods for fighting bushfires and managing some of their more damaging impacts, this is not going to be a substitute for addressing the underlying problem of CO2 emissions. What is needed is much greater public awareness of the real costs to present and future generations of the loss of biodiversity and ecosystem services that are presently taken for granted.
John Merson33
Read: Case Studies on Climate Change and World Heritage:
http://whc.unesco.org/en/othermaterials/
29. Hilbert, D. et al. (2001) Sensitivity of tropical forests to climatic change in the humid tropics of north Queensland. Australian Ecology 26: 590–603
30. IPCC (2007) Impacts, Adaptation and vulnerability. Executive Sum-mary for Policy-makers. WGII Fourth Assessment report. April. Les-ley Hughes, cited in this article, was the lead author of the chapter on Australia and New Zealand and a contributing author to the chapter on ecosystems: www.ipcc.ch
31. The leaves on plants in sclerophyll forests contain a lot of woody tissue, making the build-up of top soil very slow
32. A shallow swamp with a wealth of plant life. Constant saturation creates anaerobic (oxygen-starved) conditions in the soil, inhibiting the decomposition of dead plant material, which accumulates as peat. Peat acts as a sponge, retaining rainwater for later slow release
33. Author of a case study on the Greater Blue Mountains World Heritage site, an abridged version of which was published in Case Studies on Climate Change and World Heritage, Blue Mountains World Heritage Institute: [email protected]
A long evolution in isolation
The Wet Tropics region is home to about one-third of Australia's 315 mammal species, including unique green possums, fierce marsupial cats, kangaroos that climb trees and rare bats. As well as relatively common Australian mammals like the platypus and wallaby, the Wet Tropics is home to 13 mammal species found nowhere else in the world. All but two – the endangered Tropical Bettong (Bettongia tropica), and the Mahogany Glider (Petaurus gracilis), a possum – are rainforest dwellers. These include two tree-kangaroos (see photo), a rat-kangaroo, four ringtail possums and a melomys (native rat).
Some of the Wet Tropics rainforest species have close rela-tives in New Guinea and Southeast Asia. When Australia became isolated after the break-up of the supercontinent of Gondwana [Ed: Australia separated from Antarctica about 67 million years ago], it drifted northward. About 15 million years ago, it bumped into the Asian continen-tal plate. This collision allowed an exchange to take place between two sets of animals and plants which had evol-ved in isolation. Asian flora and fauna, including many placental rats, moved into Australia. At the same time, Australian species moved north. Many of them colonized New Guinea, a new high altitude land mass created by the ‘bow wave’ of Australia's northerly drift. As a result, some of the unusual mammals of the Wet Tropics also live with Australia’s northern neighbours, including the Long-tailed Pygmy Possum in Papua New Guinea and the tiny Tube-nosed Insectivorous Bat (weighing just 8 g) in Southeast Asia.
The Wet Tropics is home to Lumholtz's Tree-kangaroo (Dendrolagus lumholtzi), which stands less than 60 cm tall. A nocturnal, solitary animal, it spends most of its time in the tree canopy feeding on leaves
and fruits.
Sour
ce: W
et T
ropi
cs M
anag
emen
t Aut
hori
ty: w
ww
.wet
trop
ics.
gov.
au/p
a/pa
_mam
_inf
o.ht
ml
The Strangler Fig (Ficus virens) is one of the largest trees in tropical north Queensland. It germinates atop another tree, its seeds often being dispersed by birds. As it grows, it drops its roots until it “strangles” its host. This adaptation gives the Strangler Fig a distinctive height advantage in the competition for sunlight, which can only be reached by growing above the dense tree canopy©
EV
ERG
REE
N
SYDNEY
CairnsWet TropicsWet Tropics
GreaterBlueMountainsArea
GreaterBlueMountainsArea
Wet TropicsWet Tropics
GreaterBlueMountainsArea
GreaterBlueMountainsArea
Austra l ia0 500 1000 km
INDIAN OCEAN PACIFIC
OCEAN
Great B
arrier Reef
SYDNEY
CairnsAustra l ia0 500 1000 km
INDIAN OCEAN PACIFIC
OCEAN
Equatorial
Tropical
Subtropical
Temperate
Grassland
Desert
Climate zones
Austra l ia0 500 1000 km
INDIAN OCEAN PACIFIC
OCEAN
Equatorial
Tropical
Subtropical
Temperate
Grassland
Desert
Climate zones
Equatorial
Tropical
Subtropical
Temperate
Grassland
Desert
Climate zones
© E
VER
GR
EEN
© E
VER
GR
EEN
© P
anB
K
A World of SCIENCE, Vol. 5, No. 3, July – September 200758
NATURAL HERITAGE
59
FURTHER READING
To order a sales publication: www.unesco.org/publishing
ENCYCLOPEDIA
Encyclopedia of Life Support SystemsOnline encyclopedia launched by UNESCO in 2002 with sponsorship by EOLSS Publishers in the UK. Equivalent to 200 printed volumes, with contributions from thousands of scholars in over 100 countries. Internet-based and regularly updated, with free e-subscription for universities in least developed countries. Exists in English only.Over 2300 articles focus on climate change-related issues, including the economics of potential climate change, the cost of response strategies, the effect of global warming on: forests, biodiversity, agriculture, water mana-gement, sea-level rise; the impact on fisheries of melting polar ice caps, etc. To register for free access: www.eolss.net/eolss_subuldc.aspx; for details: [email protected]
BOOKS
Case studies on Climate Change and World HeritageProduced by UNESCO World Heritage Centre (2007). Exists in English only, 80 pages.Features 26 case studies of natural and cultural sites inscribed on UNESCO’s World Heritage List which are threatened by climate change. These case studies are representative of the dangers faced by the 830 sites inscribed on the List. Download: http://whc.unesco.org/en/othermaterials/
Water: a Shared Responsibility2nd World Water Development Report. UNESCO Publishing and Berghahn Books. Published within World Water Assessment Programme hosted by UNESCO and involving 24 UN agencies (2006). ISBN: 92-3-104006-5, 56.00 €. As a CD-ROM: 36.00 €. Exists in English and Spanish. Discusses, inter alia, the effect of climate change on water resources and food production, and climate change and atmospheric pollution. Argues for integrating hydropower and other forms of sustainable energy production to reduce dependence on fossil fuel power stations, emissions from which exacerbate the problems of climate variability and change. Download full report: www.unesco.org/water/wwap
The Gulf StreamBy Bruno Voituriez. UNESCO-IOC Ocean Forum Series. UNESCO Publishing (2006). ISBN: 92-3-203995-8, 18.00�€. Exists in English, French and Spanish, 210 pages.What is the Gulf Stream? Relates the scientific discovery of the Gulf Stream, the phenomena behind it, its role in determining climate and its impact on marine ecosystems in the North Atlantic.
The Future of Arid Lands – RevisitedCommissioned by UNESCO-MAB. Charles F. Hutchinson and Stefanie M. Herrmann from the University of Arizona (USA) discuss the state of scientific knowledge on dryland ecosystems some fifty years after the The Future of Arid Lands, edited by Gilbert F. White. Due out in November 2007. For details, go to page 16 or to: www.unesco.org/mab/ecosyst/drylands/Pub.shtml; or write to: [email protected]
Groundwater and Climate ChangeCompilation of case studies from around the world. Due out in early 2008, prior to a conference on Groundwater and Climate in Africa co-organized by UNESCO-IHP, IAHS and IAH in Kampala (Uganda) from 25 to 28 June 2008. For details: [email protected]
BOOKLETS
Policy Briefs Series of six-page booklets launched in 2006 by UNESCO- MAB and ICSU’s Scientific Committee on Problems of the Environment (SCOPE), English only.Several booklets in this new series address climate-change related issues, including The Carbon Cycle and Human Alteration of the Nitrogen Cycle – Threats, Benefits and Opportunities. Published in May 2007, the latter explains that ‘over a 100-year period, N2O has a global warming potential 296 times larger than an equal mass of CO2; it also contributes to stratospheric ozone depletion.’ Download: www.unesco.org/mab/biodiv/biodivSC.shtml#assessments
GRAPHICProject presentation booklet by UNESCO-IHP (2006). Exists in English only, 20 pages.Introduces Groundwater Resources Assessment under the Pressures of Humanity and Climate Change (GRAPHIC), a project launched by the UNESCO-IHP in 2004 which will continue until at least 2013. Examines the impact of climate change on groundwater resources around the world
and policy and management issues. Describes the different methods for assessing the impact over time. Download: http://unesdoc.unesco.org/images/0015/001507/150730E.pdf
Science in Africa UNESCO’s contribution to Africa’s Plan for S&T to 2010Division for Science Policy and Sustainable Development (2007). Exists in English and French, 32 pages.In tackling such problems as biodiversity loss, poor access to energy, desertification and food and water insecurity, Africa is conscious that the success of many of its programmes will depend upon its capacity to adapt to climate change and climate variability. Distributed by UNESCO to Heads of State and Government at the African Union Summit in January 2007. Download: www.unesco.org/science/science_africa.shtml or request a copy from: [email protected]; [email protected]
Island Agenda 2004+ Coping with change and sustaining diversities in small islandsBooklet produced by UNESCO’s Coastal Regions and Small Islands Platform (2004). Exists in English and French, 48 pages.In 1989, the Alliance of Small Island States adopted the Malé Declaration proclaiming that ‘sea-level rise threatens the very survival of some small island states’ and pressing the international community to take effective measures to reduce the greenhouse effect. Describes UNESCO’s role today in helping small island states cope with cli-mate change and embrace sustainable development. Distributed at the Barbados +10 conference in Mauritius in January 2005 (see also p.45). Download: www.unesco.org/csi/B10/mim.htm
FOR SCHOOLS
Explaining the Climate By Guy Jacques.UNESCO Publishing/ Nouvelle Arche de Noé Publishing (2005). ISBN: 92-3-203990-7, 6.00 €. Exists in English, French and Spanish, 48 pages. Introduces climatology to younger readers keen to learn how the climate will affect their future. All topics are dealt with in an easily understandable manner, from the effects of latitude to those of altitude, from the history of climates to the geography of great climatic regions, and from meteorolo-gists’ instruments to the Kyoto Protocol.
Explaining the EarthBy Philippe Bouysse. Produced by UNESCO-IGCP. Discovering the World series. UNESCO Publishing/Nané Publishing (2006). ISBN: 978-92-3-104015-3. Exists in English and French, 8.00 €, 48 pages.Targets 11-16 years-olds. Presents basic aspects of the Earth sciences: our planet's place in the Universe and in our Solar System, the structure of the Earth, plate tectonics, the role of the atmosphere and hydrosphere, the for-mation of reliefs, the ice ages and natural hazards.
Tell me about the OceansBy Patricia Chairopoulos. Discovering the World series. UNESCO Publishing (2003). ISBN: 978-92-3-103872-3. Exists in Arabic, English, French and Spanish, 4.60 €, 48 pages.Describes the beginnings of the world’s oceans, their role in regulating world climate and the rich resources within.
Educational Kit on DesertificationProduced by UNESCO-MAB in collaboration with the UN Convention to Combat Desertification. Distributed to schools in least developed countries since 2003 and on sale since 2004. UNESCO Publishing. 30.00 €. ISBN: 92-3- 103892-3. Exists in Arabic, Chinese, English, French, German, Hindi, Mongol, Russian and Spanish.Targets primary school teachers and their pupils aged 10-12 years in deser-tification-affected countries. Each kit comprises a teacher’s guide, case stu-dies and three copies of the comic book, The School where the Magic Tree grows and a poster. For details: www.unesco.org/mab/ecosyst/drylands.shtml
Teaching Resource Kit for Dryland Countries Produced by UNESCO-MAB. Targets primary and secondary school teachers worldwide. Based on an innovative approach appealing to the creativity and artistic sensibilities of pupils aged 6-15 approximately (2007). A sample of the kit is available in English and French: www.unesco.org/mab/ecosyst/drylands/docs/kitArt_E.pdf
Coming soon
Coming soon
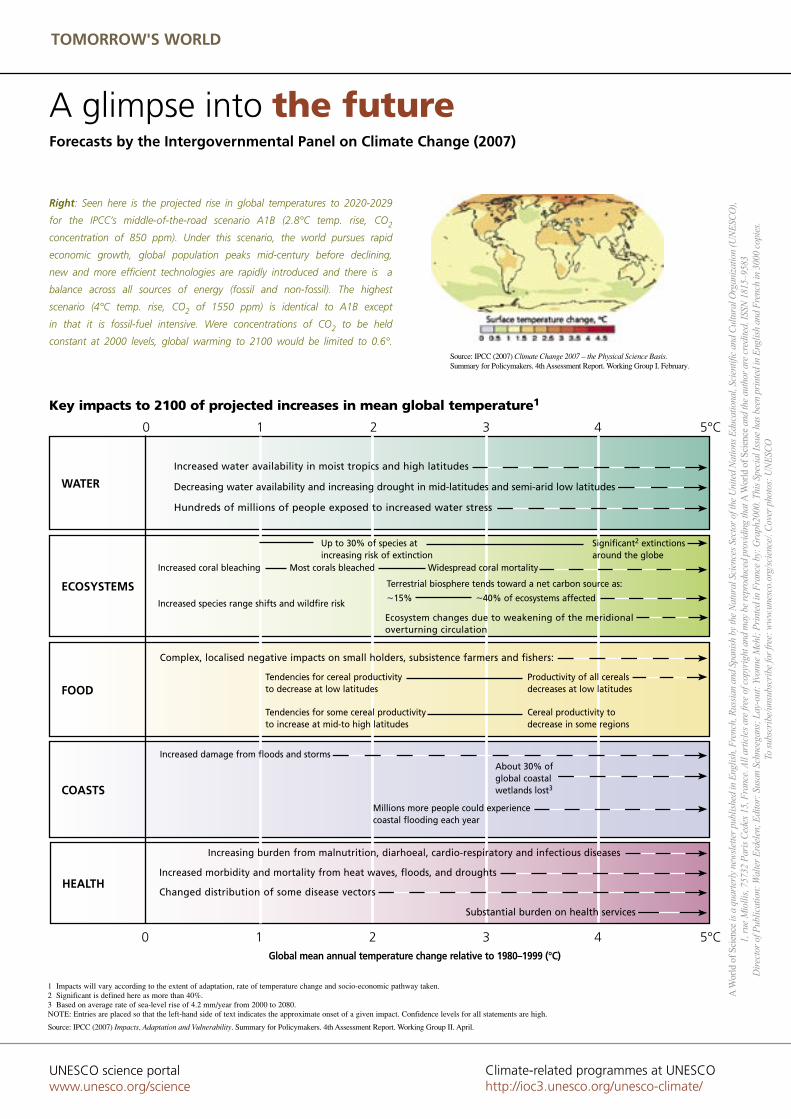
WATER
ECOSYSTEMS
FOOD
COASTS
HEALTH
Increased water availability in moist tropics and high latitudes
Decreasing water availability and increasing drought in mid-latitudes and semi-arid low latitudes
Hundreds of millions of people exposed to increased water stress
0 1 2 3 4 5°C
Up to 30% of species at Significant2 extinctions increasing risk of extinction around the globe
0 1 2 3 4 5°C
Increased coral bleaching Most corals bleached Widespread coral mortality
Terrestrial biosphere tends toward a net carbon source as:
~15% ~40% of ecosystems affected
Ecosystem changes due to weakening of the meridional overturning circulation
Complex, localised negative impacts on small holders, subsistence farmers and fishers:
Tendencies for cereal productivity Productivity of all cereals to decrease at low latitudes decreases at low latitudes
Tendencies for some cereal productivity Cereal productivity to to increase at mid-to high latitudes decrease in some regions
Increased species range shifts and wildfire risk
Increased damage from floods and storms About 30% of global coastal wetlands lost3
Millions more people could experience coastal flooding each year
Increasing burden from malnutrition, diarhoeal, cardio-respiratory and infectious diseases
Increased morbidity and mortality from heat waves, floods, and droughts
Changed distribution of some disease vectors
Substantial burden on health services
1 Impacts will vary according to the extent of adaptation, rate of temperature change and socio-economic pathway taken.2 Significant is defined here as more than 40%.3 Based on average rate of sea-level rise of 4.2 mm/year from 2000 to 2080.NOTE: Entries are placed so that the left-hand side of text indicates the approximate onset of a given impact. Confidence levels for all statements are high.
Source: IPCC (2007) Impacts, Adaptation and Vulnerability. Summary for Policymakers. 4th Assessment Report. Working Group II. April.
Key impacts to 2100 of projected increases in mean global temperature1
Climate-related programmes at UNESCOhttp://ioc3.unesco.org/unesco-climate/
Right: Seen here is the projected rise in global temperatures to 2020-2029
for the IPCC’s middle-of-the-road scenario A1B (2.8°C temp. rise, CO2
concentration of 850 ppm). Under this scenario, the world pursues rapid
economic growth, global population peaks mid-century before declining,
new and more efficient technologies are rapidly introduced and there is a
balance across all sources of energy (fossil and non-fossil). The highest
scenario (4°C temp. rise, CO2 of 1550 ppm) is identical to A1B except
in that it is fossil-fuel intensive. Were concentrations of CO2 to be held
constant at 2000 levels, global warming to 2100 would be limited to 0.6°.
A glimpse into the futureForecasts by the Intergovernmental Panel on Climate Change (2007)
Source: IPCC (2007) Climate Change 2007 – the Physical Science Basis. Summary for Policymakers. 4th Assessment Report. Working Group I. February.
UNESCO science portalwww.unesco.org/science
TOMORROW'S WORLD
A W
orld
of S
cien
ce is
a q
uart
erly
new
slet
ter
publ
ishe
d in
Eng
lish,
Fre
nch,
Rus
sian
and
Spa
nish
by
the
Nat
ural
Sci
ence
s Se
ctor
of t
he U
nite
d N
atio
ns E
duca
tiona
l, Sc
ient
ific
and
Cul
tura
l Org
aniz
atio
n (U
NE
SCO
),
1, r
ue M
iolli
s, 7
5732
Par
is C
edex
15,
Fra
nce.
All
artic
les
are
free
of c
opyr
ight
and
may
be
repr
oduc
ed p
rovi
ding
that
A W
orld
of S
cien
ce a
nd th
e au
thor
are
cre
dite
d. IS
SN 1
815–
9583
D
irec
tor
of P
ublic
atio
n: W
alte
r E
rdel
en; E
dito
r: S
usan
Sch
neeg
ans;
Lay
-out
: Yvo
nne
Meh
l; P
rint
ed in
Fra
nce
by: G
raph
2000
. Thi
s Sp
ecia
l Iss
ue h
as b
een
prin
ted
in E
nglis
h an
d F
renc
h in
300
0 co
pies
. To
sub
scri
be/u
nsub
scri
be fo
r fr
ee: w
ww.
unes
co.o
rg/s
cien
ce/.
Cov
er p
hoto
s: U
NE
SCO
Global mean annual temperature change relative to 1980–1999 (°C)