october 2013 views expressed are those of the author … series are based on current exchange rates...
TRANSCRIPT

October 2013 Views expressed are those of the author and do not necessarily reflect the position of the Federal Reserve Bank of New York or the Federal Reserve System.

Social Networks in the Global Banking Sector ◦ Joel Houston, Jongsub Lee, and Felix Suntheim
◦ Transmission altered by historic ties among board members.
◦ Suggested subtitle: what does the old boy network do?
Euro area cross-border banking: before and after the global financial crisis ◦ Pierluigi Bologna and Marianna Caccavaio
◦ Patterns of cross-border funding retrenchment depend on bank-sovereign links, flight to quality, country-institution features
Testing Hot Money as Transmission Channel..to EMs ◦ Ana-Maria Fuertes, Kate Phylaktis, and Chen Yan
◦ Sizeable temporary component in equity and bond flows, but not bank credit up to 1990s. Later, cross-border credit has temporary dominates permanent component.
2

Background on the evolution of global banking
While each paper addresses cross-border capital flows, related international macro/finance literature gives context
◦ Business cycle and interest rate co-movements are enhanced by financial globalization.
◦ Crisis dynamics and vulnerabilities change
◦ Global banks engaged in different types of flows, counterparties, evolving over time with establishment of affiliates
Changing nature of global banking has altered the mix of cross-border and local claims, and counterparties involved.
3

Some degree of “flightiness” expected.
All 3 papers inform this sensitivity.
Interesting collection of thoughtful observations.
Different drivers – distance: physical, institutional, personal.
Drivers differ
across types – bank versus equity, bonds
across normal and crisis times
across types of banking flows
Do we know even to draw policy lessons?
4

for internal use only

6
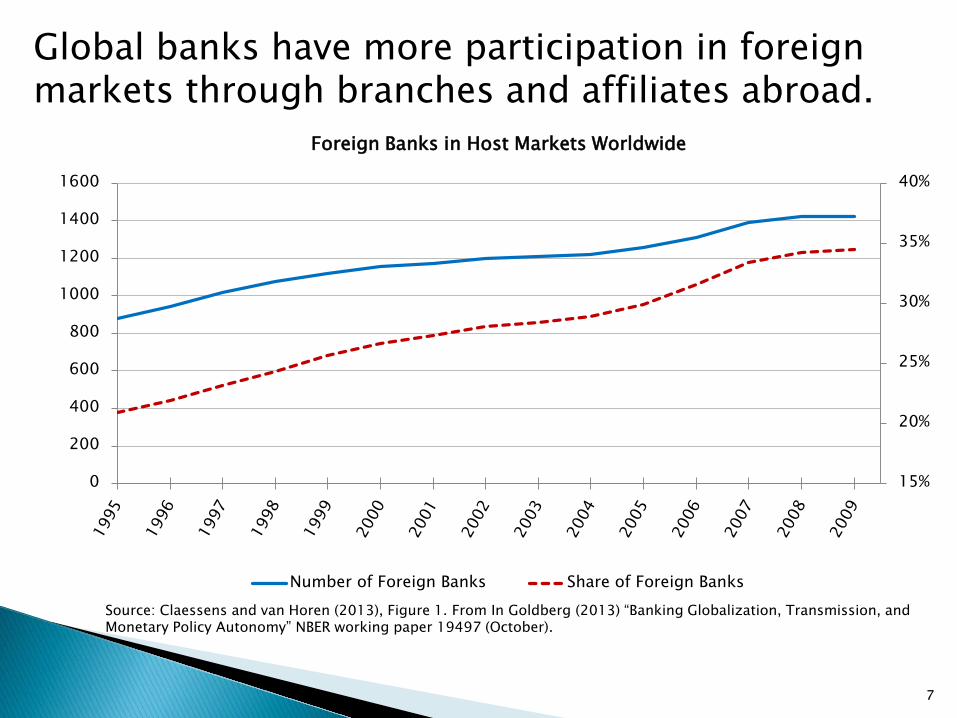
After gradual rise, rapid growth in 2000s of banks' international positions relative to global GDP.
0%
10%
20%
30%
40%
50%
60%
70%Ratio of Bank International and Foreign Claims to Global GDP1
International Claims/GDP Foreign Claims/GDP1 The series are based on current exchange rates vis-à-vis the US dollar. International claims comprise cross-border claims and local claims in foreign currencies. Foreign claims comprise cross-border claims and local claims in all currencies. Interoffice accounts are excluded. BIS International Claims show a 4 Trillion USD increase in 1999 due to the inclusion of reporting countries as vis-a-vis countries (see http://www.bis.org/statistics/breakstablescons.pdf) Sources: IMF World Economic Outlook Database for Global GDP; BIS Consolidated Banking Statistics. Reproduced from CGFS No. 41 (2010). In Goldberg (2013) “Banking Globalization, Transmission, and Monetary Policy Autonomy” NBER working paper 19497 (October).
7
15%
20%
25%
30%
35%
40%
0
200
400
600
800
1000
1200
1400
1600
Foreign Banks in Host Markets Worldwide
Number of Foreign Banks Share of Foreign BanksSource: Claessens and van Horen (2013), Figure 1. From In Goldberg (2013) “Banking Globalization, Transmission, and Monetary Policy Autonomy” NBER working paper 19497 (October).
Global banks have more participation in foreign markets through branches and affiliates abroad.

8
0200400600800
1,0001,2001,4001,6001,8002,000
Intra-bank and Interbank flows of US banks1
Intrabank Flows Interbank FlowsSource: FFIEC 009 and BIS Consolidated Banking Statistics. In In Goldberg (2013) “Banking Globalization, Transmission, and Monetary Policy Autonomy” NBER working paper 19497 (October). 1 Intra-bank flows are computed as the sum of net due to (from) of affiliates (in absolute value), from FFIEC 009. Interbank flows are computed as the sum of foreign claims of the U.S. vis-a-vis rest of world and of rest of world vis-a-vis the U.S., from BIS. A break appears in the Intrabank Flows in 2009 due to the new inclusion of the Goldman Sachs Group, Morgan Stanley, Barclays Group US, CIT Group, American Express, and Ally Financial into the FFIEC 009 reporting panel.
In Millions of USD
As a result, intra-bank flows have grown in importance: now similar in scale to interbank flows.

9
0123456789
10
International Banking: Derivatives, Credit Commitments, and Guarantees
Credit Commitments Derivatives Guarantees
Source: BIS Consolidated Banking Statistics, ultimate risk basis. In Goldberg (2013) “Banking Globalization, Transmission, and Monetary Policy Autonomy” NBER working paper 19497 (October).
In Trillions of USD
Other developments: More global bank positions in derivatives, credit commitments, and guarantees

10
-400
-300
-200
-100
0
100
200
300
400
Cross-border lending to banks and non-banks in emerging markets, 1996-2012
Source: BIS Locational Statistics. Figures are adjusted for exchange rate effects. In Goldberg (2013) “Banking Globalization, Transmission, and Monetary Policy Autonomy” NBER working paper 19497 (October).
Lending to banks
Lending to the non-bank sector
Rolling four-quarter sum in Billions of USD
Cross-border interbank lending is most volatile component, esp. with banks, with bigger swings.
-100
0
100
200
300
400
500
600
700
800
-100
0
100
200
300
400
500
600
700
800
1998 2000 2002 2004 2006 2008 2010 2012*
Billi
ons
of U
SD
Foreign Direct Investment
Bank Loans
Portfolio Equity
Net Debt Securities
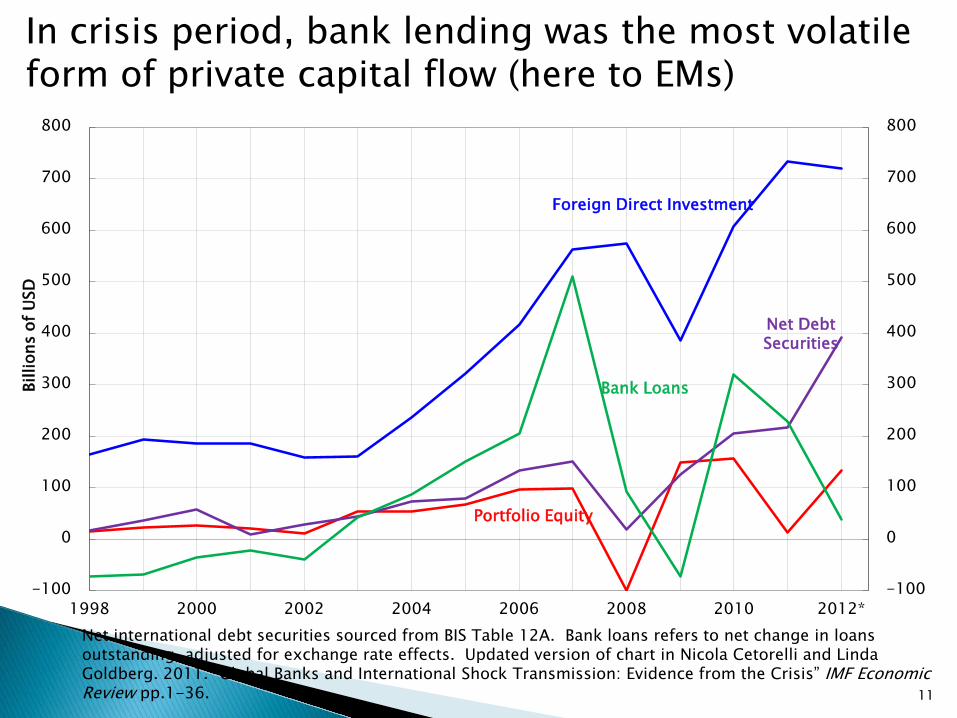
In crisis period, bank lending was the most volatile form of private capital flow (here to EMs)
Net international debt securities sourced from BIS Table 12A. Bank loans refers to net change in loans outstanding, adjusted for exchange rate effects. Updated version of chart in Nicola Cetorelli and Linda Goldberg. 2011. “Global Banks and International Shock Transmission: Evidence from the Crisis” IMF Economic Review pp.1-36. 11

◦ Global banks manage liquidity globally (Cetorelli-Goldberg JF 2012).
◦ Across countries, cross-border more volatile than local claims, ex ante banks’ health matters for transmission (Cetorelli–Goldberg IMF ER 2011)
◦ Branches around the world are differentiated in exposure to parents through internal funding transfers depends on overall business model of each global bank branch role as investment or funding locations (Cetorelli-Goldberg JIE
2012)
◦ Global banking: reduces financial frictions; access to internal capital markets implies lower counter-party risk, more information, and weaker barriers to mobility. Net effect on flightiness mixed (Goldberg 2013)
“Banking Globalization and Monetary Transmission”. 2012. Journal of Finance. Vol. LXZII no 5 (October) 1811-1843.
“Global Banks and International Shock Transmission: Evidence from the Crisis”. 2011. International Monetary Fund Economic Review, Spring, vol. 59 pages 41-76.
“Liquidity Management of U.S. Global Banks: Internal Capital Markets in the Great Recession”. 2012. Journal of International Economics vol. 88 issue 2 (November) 299-311.
“Banking Globalization, Transmission, and Monetary Policy Autonomy.” 2013. NBER working paper 19497 (October).
12

for internal use only
Fascinating and original paper. (“Old boy network”)
Networks facilitate information flows (trust, valuable soft info), but also foster group think (less investment in info acquisition).
Board member linkages: educational, professional ◦ Trending up until crisis, differences over time, across banks, countries
◦ Highest for BHCs, Investment Banks [Govt Credit Institutions (#few)]
14
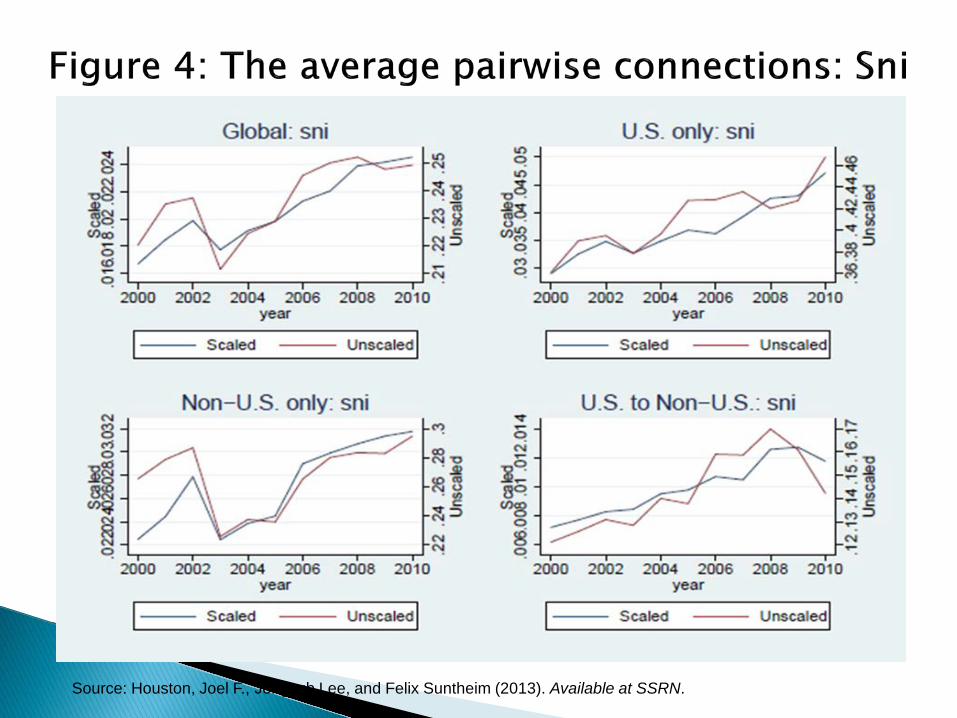
Source: Houston, Joel F., Jongsub Lee, and Felix Suntheim (2013). Available at SSRN.

Fascinating and original paper. (“Old boy network”)
Networks facilitate information flows (trust, valuable soft info), but also foster group think (less investment in info acquisition).
Board member linkages: educational, professional ◦ Trending up until crisis, differences over time, across banks, countries
◦ Highest for BHCs, Investment Banks [Govt Credit Institutions (#few)]
◦ Hard to make sense of order of magnitude: is this really significant?
Interesting: social networks positive correlate with various metrics of firm-performance similarities – in syndicated lending and equity values …. Although sharp reversal in crisis.
16

Source: Houston, Joel F., Jongsub Lee, and Felix Suntheim (2013). Available at SSRN.

Fascinating and original paper. (“Old boy network”)
Networks facilitate information flows (trust. valuable soft info), but also foster group think (less investment in info acquisition).
Board member linkages: educational, professional ◦ Trending up until crisis, differences over time, across banks, countries
◦ Highest for BHCs, Investment Banks [Govt Credit Institutions (#few)]
◦ Hard to make sense of order of magnitude: is this really significant?
Interesting: social networks positive correlate with various metrics of firm-performance similarities – in syndicated lending and equity values …. Although sharp reversal in crisis.
Why? Will the results withstand other controls (Gravity type)?
Centrality in network tied to systemic risk: weak. Why?
18

Excellent documentation of the integration and fragmentation patterns within the euro area.
(already well exposited)
Generalized pattern plus physical and financial distance played big role in integration;
Later, fragmentation and retrenchments are higher for banking flows associated with bilateral concentrations of positions and performance.
What drives flows in does not determine what flows remain later, through crises.
19

Source: Bologna, Pierluigi, and Marianna Caccavaio (2013) “Euro area cross-border banking: before and after the global financial crisis.”

Suggestion: tie these results more closely to research and policy debates.
For example, generate results on form of global banking:
Differences on entry and exit: in crises were local claims stable, and retrenchments differentiated only in cross-border?
Test these flows separately, and test for substitution across types of flows. Are there differences across counterparties? ◦ Consistent with arguments about stability, information, and less
flightiness with this type of integration?
◦ Any read on welfare consequences?
How can the results be used to inform policy toward international financial flows and global banks?
21

A thoughtful and rigorous decomposition of the patterns in flows vis-à-vis EM recipients, from US senders.
Which are hot money? Here: temporariness and reversibility
As in all things, what is hot changes over time (25 years).
◦ Bank credit used to be more stable (Sarno and Taylor), but the counterparties and composition have since evolved.
Part 1. Interesting results from unobserved components models.
◦ International bank credit is hotter in recent decades, coinciding with the period of banking sector globalization.
◦ Portfolio (equity and bond) flows -- not much change.
◦ Now, all types of capital flows are subject to reversals.
22

Push factors (investor fears, liquidity risk, interest rate risk) Pull factors (host country features like financial sector depth, GDP growth, country indebtedness capital controls). Need more discussion of methodology ◦ are the temporary and permanent components being explained by
factors, or are the tests picking up what is left after accounting for the factors?
Would be interesting to see separate results for forms of bank flows - x-border, local, internal capital markets types of counterparties ◦ relate back to themes like the information intensity of flows, and
financial frictions
bond and equity flows Fascinating work!
23

Thank you!
24