october 2014 flow & level state of technology report ... · the incredible fiber-optic...
TRANSCRIPT

State of technology RepoRt
Flow & Level InstrumentationThe Latest Technology Trends, Back-to-Basics
Tutorials, and Application Stories—All Together
in One Convenient eBook
october 2014

You’re searching for an efficient measurement solution? No problem with KROHNE.
As one of the world’s market leaders for measurement instrumentation, we’ve been serving our customers in the process industries for more than 85 years with innovations that set the standard for our markets.
KROHNE has the widest range of technologies and unique expertise. Our know-how applies to general applications, and also to requirements that demand tailor-made solutions.
There’s practically no fluid that our devices can’t measure reliably and securely: Aggressive or abrasive; high or low temperature, pressure or viscosity; media mixtures with high solids content or high purity fluids as well as saturated or superheated steam.
KROHNE – process measurement engineering is our world.
[email protected]: 1-800-FLOWINGhttp://us.krohne.com
Always a good solution
Coriolis Flow Ultrasonic
Flow
Magnetic Flow Variable Area
TDR Radar Level
FMCW Radar Level
Click on meter for product details...

3
Table of ContentsFlow and Level Measurement Still a Subtle Engineering Task 7
Trends in TechnologyPrevent Tank Farm Overfill Hazards 9
Advances in Flow Instrumentation 14
Adaptive Level Control 18
The Incredible Fiber-Optic Flowmeter 24
Level Reaches New Heights 27
Flow Charts New Waters 31
Back to the BasicsBeginner’s Guide to Differential Pressure Level Transmitters 35
Back to the Basics: Magnetic Flowmeters 40
The Right Tool for Tricky Measurement Jobs 43
Bidirectional Flow Measurement 47
Back to Basics: Ultrasonic Continuous Level Measurement 51
Stick It! 55
The Lowdown on Radar Level Measurement 58
Technology in ActionSaving Steam Saves Money 61
Radar Technology for Level Measurement 64
Ultrasonic Flowmeters Make Chiller Control Easier 68
Water Is Money. Accuracy Matters 70

www.vega-americas.com
1-800-FOR-LEVEL
@vega_americas
VEGAPULS Through-air Radar Technology for
Continuous Level Measurement
▪ Maintenance-free operation offers a simple solution for continuous level measurement of bulk solids
▪ Highly sensitive electronics filter out false signals from dust, noise, and buildup
▪ Combination of speed, excellent support, and reliable performance ensures VEGA is the right partner for your level measurement needs
Simple. Accurate. Reliable.

5
Advertiser IndexKrohne 2www.krohne.com
Vega Americas 4www.vega-americas.com
Orion Instruments 6www.orioninstruments.com
Emerson - Rosemount 8www.rosemount.com/fullpotential
FCI 13www.fluidcomponents.com/ST100
Lumenite 16www.lumenite.com/level
Sierra Instruments 17www.sierrainstruments.com
ABB 23www.abb.com/flow
Siemens 26www.usa.siemens.com/lr250
Lumenite 29www.lumenite.com/level
Moore Industries 30www.miinet.com/safetyseries
Kobold Instruments 34www.koboldusa.com
Precision Digital 39www.predig.com/modbus

4
316 SS Construction IP66/68
a better way to view
LEVEL
viewing angle140°
+ 200 ft. (60 m)
Magnetic Level Indicator &Magnetostrictive Level Transmitter#1
www.orioninstruments .com
High-visibility level indicators from Orion Instruments are custom-engineered and built tough for
the most demanding applications. Contact us to find out how maintenance frequency, cost of
ownership, personnel safety, and reliability can all be improved over traditional sight glass gauges.
The readers of Control Magazine have preferred Orion Instruments for 6 consecutive years.

7
Despite ongoing advances in instrumentation technology, specifying a flowmeter or level gauge that will reliably perform over the anticipated range of process condi-
tions often remains a complex and subtle engineering task. Dozens of niche instrumentation technologies have been
developed over the past several decades to exploit nearly ev-ery conceivable physical phenomenon that might be cor-related with level or flow.
Our reader surveys indicate that where possible and prac-tical, users continue to move away from mechanical and electromechanical instruments towar electronic transmit-ters with few or no moving parts to stick or wear. Hence the growing popularity of Coriolis, electromagnetic, vortex and ultrasonic flowmeters in recent years. Dramatic advances in ultrasonic technology in particular have spiked their broader use even in gas custody transfer applications. Thermal dis-persion mass flowmeters, too, remain an imporant option for a specialized range of gas measurement applications.
On the level measurement side, this non-mechanical trend is indicated by the increased use of radar, ultrasonic and even sonic profiling gauges that offer a three-dimen-sional view of solids level in tanks and bins. Fiber optic probes developed for undersea oil and gas applications are measuring flowrate and composition with temperature and pressure to boot. Guided-wave radar, too, is an increasingly popular technology that falls into that category of minimal moving parts: only the float is free to move along a wave-guide probe.
But the number one flow and level measurement technol-ogy actually measures neither. Indeed, the differential pres-sure transmitter remains the most commonly applied flow and level measurement device—in no small part because engineers are so familiar with it.
Sure, a differential pressure cell paired with an orifice plate or other primary element can make for a relatively complicated installation (although pre-integrated assem-blies are making this less troublesome) as well as incur an energy-consuming pressure drop penalty, but for many users the dependability and familiarity of a differential pressure cell still wins out over other considerations.
Accuracy and other desirable performance specifications are of overriding importance in some applications, but play second fiddle to technology familiarity and trouble-free op-eration in others. And while more of today’s users pay at least lip service to lifecycle costs, initial purchase price remains a key consideration.
The continued preference for differential pressure flow-meters and level gauges, and well as the ongoing viability of numerous niche technologies, demonstrate the complex interplay of criteria that go into a instrumentation purchase decision.
For example, despite the overall trend toward non-me-chanical instruments for process measurements, there ex-ists a countervailing trend in favor of mechnical devices for safety applications such as pump protection or tank overfill prevention. Here, differentiated technology plays a role in establishing the independence of safety protection layers. A mechanical switch or magnetic level indicator provides as-surance against common cause failures when used in con-junction with an electronic gauge.
The balance of this State of Technology Report is a com-pendium of the latest trends articles, back-to-basics tutori-als, and application stories recently published in the pages of Control. And while it doesn’t cover every corner of the application space, we hope you find it useful.
—The Editors
Flow and Level Measurement Still a Subtle Engineering TaskAll other things equal, familiarity and trouble-free operation often trump technical specifications
when specifying flowmeters and level gauges.

The Emerson logo is a trademark and a service mark of Emerson Electric Co. © 2013 Emerson Electric Co.
Discover new efficiencies and achieve unmatched throughput with Rosemount® instrumentation. Turn to Emerson measurement experts and Rosemount instrumentation to get more production out of your current equipment, maintain a smarter workflow and operate at your full potential. Our specialists will show you how to use stable, accurate instruments to minimize measurement drift and confidently run your facility as close as possible to critical levels. And with intuitive diagnostic tools and wireless transmitters, you can gather more detailed insights into the health of your entire process without adding infrastructure, so you can stay optimized longer and avoid downtime. To learn how Emerson can help you hit your production targets and maximize the capacity of your assets with measurement instrumentation, see case studies at Rosemount.com/fullpotential
YOU CAN DO THATI get measured on hitting my production targets. I need to get more out of my assets so I can meet my performance goals.
View video with our take on efficiency.

9
Prevent Tank Farm Overfill HazardsCatastrophic incidents have led to useful rules for systems that help avoid them.
by William L. Mostia, PE
Driving around petrochemical plants, oil fields or fuel dis-tribution terminals or facilities, it’s common to see large tank farms with vessels of various forms and shapes—
cylinders, spheres, bullets and spheroids. These tanks can store feedstocks, intermediates and final products. For refiner-ies, many of these tanks are used for what are called oil move-ments, which blend various products together to provide the many grades of gasoline, diesel and other refinery products required by the market and government regulations.
Process unit tank farms are typically a bit separate from the process units, located in bunds or diked areas, and spread over a large acreage. Fuel distribution terminals, which commonly straddle pipelines, are physically similar and may butt up against residential and light industrial ar-eas, as can some plant tank farms. Many of these tank farms started out as remote sites, but plant expansions have some-times met external industrial and residential sprawl to in-crease the potential consequences of a disastrous event.
It’s safe to say that thousands of filing, emptying and trans-ferring operations go on each month in these tank farms—maybe even every day. The overwhelming majority are done safely, but some result in overfills, which have led in a few cases to major incidents. Data compiled by a reputable oper-ator in the United States estimated that an overfill occurred once in every 3,300 filling operations (“Atmospheric Storage Tanks,” Risk Engineering Position Paper 01, Marsh Ltd.).
Looking over the past couple of decades, we have had some notable tank overfill incidents: Laem Chabang, Thai-land, in 1999 (seven dead); Buncefield, UK, in 2005 (43 injured), and the Cataño oil refinery in Bayamón, Puerto Rico, (three injured). All these involved spectacular explo-sions and fires with extensive damage to the facility.
As it turns out, tank farm overfills that lead to a fire and
explosion may not be considered common, but they’re cer-tainly not rare. A study of storage tank accidents for the pe-riod of 1960-2003 covered 242 tank farm accidents. Fifteen overfill incidents were reported, of which 13 resulted in a fire and explosion (“A Study of Storage Tank Accidents,” James Changa and Cheng-Chung Lin, Journal of Loss Pre-vention in the Process Industries, 19 [2006], p.51–59). The numbers of tank farm overfill incidents were probably under reported in this study, but still, tank farm overfill incidents in the study occurred on average every three years. One in-teresting fact that arose while looking at overfill incidents is that they mostly occurred off day shift, which is very advan-tageous in regard to people occupancy/exposure, but where supervision is typically more relaxed, and there is less gen-eral oversight.
What really brought tank farm overfills to the forefront was an industry-changing incident that occurred on Dec. 11, 2005, at the Buncefield oil storage and transfer depot, Hemel Hempstead, UK. A gasoline tank overflowed, leading to an unconfined vapor cloud explosion that was deemed to be un-precedented—the largest ever explosion in peacetime Eu-rope. It was fortunate that the explosion occurred in the early morning hours on the weekend, for while the damage was extensive, no fatalities occurred. However, 43 people were injured. Had the 6:01 a.m. blast happened during working hours on a weekday, it could have been far, far worse.
On Oct. 23, 2009, another large overfill event led to a fire and explosion at the Cataño oil refinery in Bayamón, Puerto Rico, injuring three and resulting in the Caribbean Petro-leum Corp. having to file for bankruptcy. Another tank farm overfill also occurred in Kuwait, resulting in a fire and ex-plosion (“Overfill + Ignition = Tank Farm Fire,” Presenta-tion for HSE Moments/Alerts, bit.ly/1rHCPrB).
trends in technology

10
While not due to an overfill event, but showing the poten-tial consequences, a 2009 tank farm fire and explosion in Jaipur, India, killed 12 people, injured more than 200 and completely destroyed the tank farm.
Poor Instrumentation, Bad PracticesThe Buncefield tank that overflowed had both a level gauge and an independent high-level shutdown, neither of which worked. Kuwait also had a level gauge and independent high-level alarm—neither functioned. In Puerto Rico, the liquid level in the tank could not be determined because the facility’s computerized level monitoring system was not fully operational. It seems there is a potential pattern: poor instrument maintenance, poor testing practices, lack of op-erational discipline—take your pick. Since tank farms do not “make money,” many times they can suffer when mainte-nance budgets are constrained.
Another interesting thing to come out of the Buncefield U.K. Control of Major Accident Hazards (COMAH) report, “Buncefield: Why Did It Happen?” (COMAH, 02/11), was the practice of Buncefield operators “working to alarms.” Both API 2350-January 1996 and 2005 state that, “High-level detectors and/or automatic shutdown/diversion systems on tanks contain-ing Class I and Class II liquids (2005 only) shall not be used for control of routine tank fining operations.” The 2012 version specifically prohibits this practice, but poor operational disci-pline always seems to trump standards and procedures.
The practice is not new in the process industries, but may deserve more looking into, as it may be more common than one might think, particularly where there are automatic shutdowns protecting transfers into a tank or other process operations. Trust in the protection systems is a form of faith-based risk-taking founded on prior experience, and gener-ally represents normalization of non-conformance to proce-dures resulting from poor or slack operating discipline. How do your operators really operate your tank farm transfers?
The U.K. issued a number of comprehensive reports and recommendations regarding Buncefield that are worthwhile
reading (www.buncefieldinvestigation.gov.uk/reports/index.htm under Reports). From a standards perspective, after Buncefield, the U.K. Health and Safety Executive (HSE) required the competent authority and operators of Bunce-field-type sites to develop and agree on a common method-ology to determine safety integrity level (SIL) requirements for overfill prevention systems in line with the risk assess-ment principles in BS EN 61511, Part 3. They should then apply the BS EN 61511, Part 1 for SIL-related systems that come out of the risk assessment. In 2009, the HSE issued the reports, “A Review of Layers of Protection Analysis (LOPA) Analyses of Overfill of Fuel Storage Tanks” and “Safety and Environmental Standards for Fuel Storage Sites.”
Meanwhile, on the west side of the Atlantic, API RP 2350 3rd Edition, “Overfill Protection for Storage Tanks in Petroleum Facilities,” which covers atmospheric tanks stor-ing Class I (flammable) and Class II (combustible) petro-leum liquids, was issued in January 2005, the same year as
Figure 1: In December 2005 a gasoline tank at the Buncefield oil
storage and transfer depot, Hemel Hempstead, U.K., overflowed.
The resulting unconfined vapor cloud explosion was the largest
ever in peacetime Europe.
PrEciPiTaTing EvEnT
UK
Gov
ernm
ent
trends in technology

11
Buncefield. The third edition of API 2350 was prescriptive in nature and a compilation of best practices that had over the years expanded its reach to these categories.
From an instrumentation perspective, API 2350 had mini-mal requirements for safety instrumentation and no require-ment for evaluation of the safety risk, even though ANSI/ISA S84 (1996, 2003) and IEC 61511 (2004) were in place at that time. This standard divided facilities into attended and unat-tended operations. For attended facilities, there were no re-quirements for level detectors on the tanks, while unattended facilities required continuous monitoring, alarms and an au-tomatic shutdown if the operator response time was not ade-quate, or the operation was fully automatic. This highlights a cautionary note that one should always remember: All stan-dards provide minimum requirements, not maximum. Fol-lowing good engineering practice and in most cases com-mon sense (an old friend who some say has passed on, bit.ly/1oRKeQZ ) should not be hijacked by “minimum” safety requirements in a standard, particularly for cost reasons.
Because of the Buncefield explosion, the API 2350, 4th Ed., (2012) committee took the lessons learned to heart and introduced a number of new risk- and performance-based requirements, which brought it closer conformance to the SIS standards. (See sidebar, “Buncefield’s Legacy: API 2350’s New Requirements.”)
Technology Can HelpPlacing instrumentation on widely geographically distributed tanks, particularly on existing tanks, can be a challenge both technically and in cost, but technology has advanced signifi-cantly in the past 10 years. We can easily digitally transmit multiple sensor inputs across a pair of wires, reducing wiring costs, using any one of the more than 50 fieldbuses available, a number which are third party-approved safety protocols (for example, Profisafe, Foundation fieldbus, ASIsafe).
Tank farm remoteness and geographical distribution of-ten make them suitable for wireless monitoring applica-tions, which can be easily added to existing tanks. These
can also be solar-powered. There are wireless applications for tank monitoring systems available using IEEE 802.15.4 (ISA 100.11a and WirelessHART), wireless cellular net-works and global satellite networks. Another developing technology is mobile wireless applications, which allow tank farm field operators, in addition to the control room operator, to monitor tank levels.
Available automated safety shutdown systems geared to the tank farm environment range from local, high-reliabil-ity shutdown systems connected by Modbus to centralized
Because of Buncefield, the API 2350 4th Edition (2012) commit-
tee took the lessons learned to heart and introduced a number of
new risk- and performance-based requirements, which brought
it closer conformance to the SIS standards. Some of API 2350’s
new requirements are:
1. A overfill management system is required;
2. A risk assessment shall be used by the owner and operator
to categorize risks associated with potential tank overfills;
3. The definition of a set of operating parameters, including
critical high level (CH), high-high level (HH), maximum work-
ing level (MW) and automated overfill prevention system
(AOPS) activation level;
4. More emphasis on operator response time for level alarms;
5. Operators are required to categorize each tank under con-
sideration for overfill prevention based on tank level instru-
mentation and operator surveillance procedures;
6. Emphasis on proof-testing of independent alarms and
AOPS;
When an AOPS is required, the standard provides two options
for implementation, depending on whether the installation is existing
or new. For existing installations, Appendix A of the standard pro-
vides an acceptable, essentially prescriptive approach that contains
aspects of ANSI/ISA 84.00.01-2004 (IEC 61511 modified). For new
installations, ANSI/ISA 84.00.01-2004 (IEC 61511 modified) must be
followed.
BuncEfiElD’s lEgacy: nEw aPi 2350 rEquirEmEnTs
trends in technology

12
systems to using safety PLCs. Tank level and inventory management system technologies also have advanced.
Improvements have been made in guided-wave radar (GWR), through-the-air radar and traditional level measure-ment technologies. One of the main issues remains, which is how to proof-test these to meet API 2350 and ANSI/ISA 84.00.01 (IEC 61511 modified).
On June 10, the FAA authorized BP to use a commercial drone, supplied by Aerovironment Inc. (www.avinc.com), at its Prudhoe Bay, Alaska, site to fly aerial surveys over Alaska’s North Slope. The same type of drone has been used in test flights by ConocoPhillips. It seems like a reasonable predic-tion that in the not-too-distant future, drones could be used to fly continuous circuits above a refinery or chemical plant, use visual and IR sensors, pattern recognition and analytical technology to detect abnormal conditions in the facility, and report them to the control room and field operators. This technology could easily be applied to tank farms.
Heed API 2350API 2350 has been updated to be better in line with the in-dustry standard ANSI/ISA 84.00.01-2004 (IEC 61511 mod-ified), which is virtually identical to IEC 61511. To make our tank farms safe, we should apply the same safety rigor of assessment that we apply to our process units to our tank farms to ensure that a significant safety, environmental and/or financial incident does not occur in the future.
This API 2350 standard is listed as a “recommended practice,” but do not be fooled. In the United States and in other countries that recognize API standards as recommended and generally ac-cepted good engineering practice (RAGAGEP), if you have an incident in your refinery or fuel distribution tank farm, you will be held to this standard or the burden of proof otherwise. Chem-ical plants should meet NFPA 30, but may also be held to API 2350 overfill requirements as RAGAGEP.
One area that API 2350 does not address in tank farms is the use of combustible gas detectors and fire detectors. Open-path gas detectors could be particularly effective, as
they can have a path length up to 200 meters, and point-source gas detectors can be effective inside bunds, since many of the gases involved are heavier than air.
Fire detectors are not as effective for overfill situations, but can help prevent pool fires from spreading to other tanks by detecting rim fires and jet fires. While this seems to be a case of reaction rather than prevention, the sooner you can act to bring an developing incident to heel, even if you can’t prevent it, the less the consequences will be.
It would seem important to minimize the potential of an electrical ignition source by properly, electrically classifying tank farm areas and ensuring that electrical equipment and instrumentation meet (and maintain) the classification.
This discussion only covered atmospheric tanks in tank farms, which obviously can create a hazard. One of the big-gest hazards in a refinery tank farm typically comes from butane or other compressed gas spheres, which by some esti-mation can range up there with a hydrofluoric acid leak haz-ard in a refinery. But that is a discussion for another day.
william l. mostia, PE, fellow, sis-TEcH solutions, is a frequent contributor to control.
Figure 2. On June 10, the FAA authorized BP to use a commercial
drone, supplied by Aerovironment Inc. (www.avinc.com), at its Prud-
hoe Bay, Alaska, site to fly aerial surveys over Alaska’s North Slope.
sPill sPoTTEr
BP
trends in technology

The most versatile thermal mass gas flow meter… now and in the future.
Calibrations for more than 200 different gases 4 - 20 mA, HART, Foundation ™ fieldbus,
PRofibus, Modbus Temperature service to 850 °f / 454 °C Pipe sizes from 1″ to 99″ [25 mm to 2500 mm]
100:1 up to 1000:1 turndown 4-function: flow rate, total flow,
temperature and pressure best-in-class digital / graphical display Global agency approvals for Ex locations

14
Advances in Flow Instrumentationby Béla Lipták
in my May column, I described some new fiber-optic f lowmeters used for subsea measurement of multi-phase f lows (oil, water, methane). Now I will describe
some other, more recent advances in the field of f low instrumentation that have occurred partly because of the need for transporting and accurately metering large quantities of oil and natural gas.
Head-Type Flowmeters When measuring flow by any differential pressure gener-ating element, the measurement error is the sum of the sensor error, which is usually about one percent of actual flow (%AR), and the error of the d/p cell, which used to be around 0.25% to 0.5% of full scale (%FS). Therefore, in the past, if we wanted to keep the total error at minimum flow under 3%AR, the flow turndown (rangeability) had to be limited to about 4:1. Figure 1 shows the relationship between the turndowns in terms of flow and the corre-sponding turndown requirement of the ΔP transmitter.
Today, the maximum turndown capability of a smart, digital ΔP transmitter is nearly 200:1. Because of the square root relationship, this means that the f low range-ability is 14:1 (142 = 196). With a ΔP measurement error of 0.065%FS, the d/p cell error is 12.74% AR at the min-imum ΔP (196x 0.065 = 12.74%). Because of the square root relationship, this minimum ΔP error corresponds to a minimum f low error of √ 12.74% = 3.6%AR. Adding to this ΔP error, the 1%AR error of the sensor (the preci-sion of its discharge coefficient CD), gives us a total er-ror of only 4.6%AR at minimum f low. Naturally, the full 14:1 turndown can only be realized if at minimum f low (100/14 = 7% of full scale), the f low is still turbulent (RE > 8,000).
In addition to the tremendous increase in the accuracy of the state-of-the-art d/p cells, these smart units are provided
with local displays, self diagnostics, alarms, memory boards for data acquisition and storage for hundreds of thousands of data points for displaying of trends, total flows, and to provide cell phone connectivity. They can be mounted to the sensor or connected wirelessly (IEEE802.11), allowing the sensor to be located in hard-to-access areas, while the d/p cell is in an easy-to-access location.
Figure 1: At a ΔP turndown of 196:1, the flow turndown is 14:1, and at the mini-
mum flow (100/14 = 7%), the total error is kept under 5%of actual flow (AR).
100
90
80
70
60
50
40
30
20
10
3 : 1
9 : 1
16 :
1
36 :
1
100
: 119
6 : 1
4 : 16 : 1
10 : 1
14 : 1Flow rangeability
% Flow10 20 30 40 50 60 70 80 90 100
DigiTal accuracy givEs HigHEr TurnDown
trends in technology

15
While the Venturi flowmeter is still the favorite when it comes to pressure recovery and accuracy, some of the other head-type flowmeter features also are competing on the hy-drocarbon and other markets. For example:
• Conditioning orifice meters with wireless transmission (Figure 2);
• Regular and Venturi wedge meters for fluids containing sand or slurries;
• Averaging Pitot tube inside a flow nozzle combined with pressure/temperature sensors to calculate mass flow of natural gas;
• V-shaped cones. These cones require individual calibra-tion, but their conditioning effect reduces the straight-run requirement; and
• Flow transmitters with pressure and temperature sen-sors can calculate mass flow of known molecular weight gases (Figure 3).
Eme
rso
n R
ose
mo
unt
Figure 2: Wireless orifice flowmeters are appropriate for some hard-
to-reach applications in oil-and-gas markets.
Playing in THE HyDrocarBon sPacE
Eme
rso
n R
ose
mo
unt
Figure 3: Flow transmitter with pressure and temperature sensors
calculates mass flow of known molecular weight gases.
THE TEmPEraTurE of flow
Eme
rso
n/D
anie
l
Figure 4: Bi-directional, multi-path, ultrasonic mass flowmeter for gas
service.
Two-way ulTrasonics
trends in technology

One should note that, in case of large f lows, the unre-covered (permanent) pressure loss caused by the meter is an important consideration. This permanent loss is the worst in case of sharp restrictions (orifice ~ 70%) and the best with smooth transitions (Venturi ~ 15%), while something like the V-shaped cone causes an intermedi-ate amount of permanent loss (~ 40%).
Other Flowmeter TypesIn addition to head-type f lowmeters, intense activity in the hydrocarbon industry has catalyzed advances in other f lowmeter families. In custody transfer applica-tions, for example, the accurate and reliable Coriolis f lowmeter is still the favorite, but other technologies are
also competing for that market, for example, this bi-di-rectional, multi-path, ultrasonic mass f lowmeter for gas service (Figure 4). Similarly, at the drilling end of the hy-drocarbon production process, a number of multiphase (oil, water, methane) f lowmeters have been introduced, for example, the water cut meter, which uses five NIR wavelengths to distinguish water, oil and gas and the un-dersea multiphase f lowmeter, which calculates the total f low and its oil, water and gas content by simultaneous measurements of variables. These units are designed for operation at some miles of depth under the ocean.
Béla lip ták , PE, control consul tant , is also edi tor of the ins trument Engineers’Handbook and is seeking new co-authors for the coming new edi t ion of tha t
mul t i-volume work . He can be reached a t l ip takbela@aol .com.
trends in technology

NEVERbefore possible.
The World’s Most Accurate ThermalMass Flow Meter.From Sierra’s beginning over fortyyears ago, Founder Dr. John G. Olinwas driven by his vision to design theworld’s most accurate thermal massflow meter. Two revolutionary tech-nologies—QuadraTherm® andqTherm™, have made his vision a reality.
QuadraTherm SensorThis revolutionary new four-sensor design isolates forced convection(the critical variable for measuringgas mass flow rate) by neutralizingunwanted heat-transfer components,like sensor stem conduction, one ofthe major causes of false flow reading inaccuracies.
qTherm BrainqTherm is a proprietary algorithm setthat uses QuadraTherm sensor inputsto solve the First Law of Thermody-namics (Heat Energy In = Heat EnergyOut) for thermal dispersion technol-ogy. Accuracy never before possible is the remarkable result!
QuadraTherm 640i/780i
Accuracy: +/- 0.5% of Reading
Multivariable: Mass flow rate, temperature & pressure
Revolutionary QuadraTherm®
four-sensor design
DrySense™ no-drift sensor with lifetime warranty
qTherm™ living, learning “Brain” manages all inputs
Dial-A-Pipe™: Change pipe size
Dial-A-Gas™: Change gas type
qTherm Gas Library: 18 gases & mixtures (growing & improving)
Global Agency Approvals: ATEX, IECEx, CE, cFMus
Digital Communications Solutions: HART, Profibus DP, MODBUS, RTU,Foundation Fieldbus
sierrainstruments.comNorth America / 800.866.0200
Europe / +31 72 5071400Asia-Pacific / +8621 5879 8521/22
®
H I G H A C C U R A C Y : F O U R - S E N S O R : M A S S F L O W M E T E R
QuadraTherm_640i_Putnam_Layout 1 8/26/14 3:26 PM Page 1

18
Adaptive Level ControlExploring the Complexities of Tuning Level Controllers and How an Adaptive Controller Can Be
Used in Level Applications
By Greg McMillan, Sridhar Dasani and Dr. Prakash Jagadeesan
The tuning of level controllers can be challenging be-cause of the extreme variation in the process dynam-ics and tuning settings. Control systems studies have
shown that the most frequent root cause of unacceptable variability in the process is a poorly tuned level control-ler. The most common tuning mistake is a reset time (in-tegral time) and gain setting that are more than an order of magnitude too small.
In this article we first provide a fundamental under-standing of how the speed and type of level responses varies with volume geometry, f luid density, level mea-surement span and f low measurement span for the gen-eral case of a vessel and the more specific case of a con-ical tank. Next we clarify how tuning settings change with level dynamics and loop objectives. Finally, we in-vestigate the use of an adaptive controller for the conical tank in a university lab and discuss the opportunities for all types of level applications.
General Dynamics for Vessel LevelThere have been a lot of good articles on level control dynamics and tuning requirements. However, there of-ten are details missing on the effect of equipment design, process conditions, transmitter calibration and valve siz-ing that are important in the analysis and understand-ing. Here we offer a more complete view with derivations in Appendix A, available on the ControlGlobal website (www.controlglobal.com/1002_LevelAppA.html).
Frequently, the f lows are pumped out of a vessel. If we consider the changes in the static head at the pump suction to have a negligible effect on pump f low, the discharge f lows are independent of level. A higher level does not force out more f low, and a lower level does not
force out less f low. There is no process self-regulation, and the process has an integrating response. There is no steady state. Any unbalance in f lows in and out causes the level to ramp. When the totals of the f lows in and out are equal, the ramp stops. For a setpoint change, the ma-nipulated f low must drive past the balance point for the level to reach the new setpoint. If we are manipulating the feed f low to the volume, the feed f low must be driven lower than the exit f low for a decrease in setpoint. The ramp rate can vary by six orders of magnitude from ex-tremely slow rates (0.000001%/sec) to exceptionally fast rates (1%/sec). The ramp rate of level in percent per sec-ond for a 1% change in f low is the integrating process gain (%/sec/% = 1/sec). The integrating process gain (Ki
) for this general case of level control, as derived in Ap-pendix A, is:
Ki = Fmax / [(ρ * A) Lmax ] Eq. 1
Since the PID algorithm in nearly all industrial con-trol systems works on input and output signals in per-cent, the tuning settings depend upon maximums. The f low maximum (Fmax) and level maximum (Lmax) in Equa-tion 1 must be in consistent engineering units (e.g. me-ters for level and kg/sec for f low). The maximums are the measurement spans for level and f low ranges that start at zero. Most of the published information on process gains does not take into account the effect of measure-ment scales and valve capacities. The equation for the integrating process gain assumes that there is a linear relationship between the controller output and feed f low that can be achieved by a cascade of level to f low control or a linear installed f low characteristic. If the controller
trends in technology

19
output goes directly to position a nonlinear valve, the equation should be multiplied by the slope at the oper-ating point on the installed characteristic plotted as per-cent maximum capacity (Fmax) versus percent stroke.
Normally, the denominator of the integrating pro-cess gain that is the product of the density (ρ), cross-sec-tional area (A) and level span (mass holdup in the con-trol range) is so large compared to the f low rate that the rate of change of level is extremely slow. For horizontal tanks or drums and spheres, the cross-sectional area var-ies with level. In these vessels, the integrating process gain is lowest at the midpoint (e.g. 50% level) and high-est at the operating constraints (e.g. low- and high-level alarm and trip points).
Most people in process automation realize that a con-troller gain increased beyond the point at which oscil-lations start can cause less decay (less damping) of the oscillation amplitude. If the controller gain is further increased, the oscillations will grow in amplitude (the loop becomes unstable). Consequently, an oscillatory response is addressed by decreasing the controller gain. What most don’t realize is that the opposite correction is more likely needed for integrating processes. Most level loops are tuned with a gain below a lower gain limit. We are familiar with the upper gain limit that causes relatively fast oscillations growing in amplitude. We are not so cognizant of the oscillations with a slow period and slow decay caused by too low of a controller gain. The period and decay gets slower as the controller gain is decreased. In other words, if the user sees these oscil-lations and thinks they are due to too high a controller gain, he or she may decrease the controller gain, mak-ing the oscillations worse (more persistent). In the sec-tion on controller tuning, we will see that the product of the controller gain and reset time must be greater than a limit determined by the process gain to prevent these slow oscillations.
In some applications, exceptionally tight level control, through enforcement of a residence time or a material bal-ance for a unit operation, is needed for best product quality. The quantity and quality of product for continuous reactors
and crystallizers depend on residence times. For fed-batch operations, there may be an optimum batch level. The variability in column temperature that is an inference of product concentration in a direct material balance control scheme depends on the tightness of the overhead receiver level control. Since these overhead receivers are often hor-izontal tanks, a small change in level can represent a huge change in inventory and manipulated reflux flow.
In other applications, level control can be challenging due to shrink and swell (e.g. boiler drums and column sumps) or because of the need for the level to f loat to avoid upsetting the feed to downstream units (e.g. surge tanks). If the level controller gain is decreased to reduce the reaction to inverse response from shrink and swell or to allow the level to f loat within alarm limits, the reset time must be increased to prevent slow oscillations.
Adaptive level controllers can not only account for the effect of vessel geometry, but also deal with the changes in process gain from changes in f luid density and non-linear valves. Even if these nonlinearities are not signifi-cant, the adaptive level control with proper tuning rules removes the confusion of the allowable gain window, and prevents the situation of level loops being tuned with not enough gain and too much reset action.
Figure 1. Conical Tank in MIT Anna University Lab with an industrial DCS.
trends in technology

20
Specific Dynamics for Conical Tank LevelConical tanks with gravity discharge f low are used as an inexpensive way to feed slurries and solids such as lime, bark and coal to unit operations. The conical shape pre-vents the accumulation of solids on the bottom of the tank. The Madras Institute of Technology (MIT) at Anna University in Chennai, India, has a liquid conical tank controlled by a distributed control system (DCS) per the latest international standards for the process industry as shown in Figure 1. The use of a DCS in a university lab offers the opportunity for students to become proficient in industrial terminology, standards, interfaces and tools. The DCS allows graduate students and professors to ex-plore the use of industry’s state-of-the-art advanced con-trol tools. Less recognized is the opportunity to use the DCS for rapid prototyping and deployment of leading edge advances developed from university research.
The conical tank with gravity f low introduces a severe nonlinearity from the extreme changes in area. The de-pendence of discharge f low on the square root of the static head creates another nonlinearity and negative feedback. The process no longer has a true integrating response. In Appendix A online (www.controlglobal.com/1002_Leve-lAppA.html), the equations for the process time constant (τp) and process gain (Kp) are developed from a material balance applicable to liquids or solids. The equations are approximations because the head term (h) was not iso-lated. Since the radius (r) of the cross-sectional area at the surface is proportional to the height of the level as depicted in Figure 2, it is expected that the decrease in process time constant is much larger than the decrease in process gain with a decrease in level.
π * r2
3 * C * h1/2τp =
Eq. 2
Kp = h1/2 * Fmax
C * Lmax Eq. 3
Controller Tuning RulesThe lambda controller tuning rules allow the user to pro-vide a closed-loop time constant or arrest time from a lambda factor (λf) for self-regulating and integrating pro-cesses, respectively. The upper and lower controller gain limits are a simple fall out of the equations and can be readily enforced as part of the tuning rules in an adap-tive controller.
For a self-regulating process the controller gain (Kc) and reset time (Ti) are computed as follows from the pro-cess gain (Kρ), process time constant and process dead time (θp):
Kc =Ti
Kp * ( λf * τp + θp ) Eq. 4
Ti = τp Eq. 5
Figure 2. Conical tank detail.
Conical tank
Variable-�ow pump
Hand valve
h
r
Fmax
Reservoir
trends in technology

21
The upper gain limit to prevent fast oscillations occurs when the closed loop time constant equals to the dead time.
Kc <τp
Kp * 2 * θp Eq. 6
For an integrating process the controller gain (Kc) and reset time (Ti) are computed as follows from the integrat-ing process gain (Ki) and process deadtime (θp):
Kc =Ti
Ki * [(λf /Ki) + θp ]2
Eq. 7
Ti = 2 * (λf /Ki ) + θp Eq. 8
The upper gain limit to prevent fast oscillations occurs when the closed loop arrest time equals the dead time:
Kc < 3
Ki * 4 * θp Eq. 9
The lower gain limit to prevent slow oscillations occurs when the product of the controller gain and reset time is too small.
Figure 3. Performance of linear PID level controller for a conical tank.
trends in technology

22
Kc * Ti > 4Ki
Eq. 10
Opportunities for Adaptive Control of Conical Tank LevelA linear PID controller with the ISA standard structure was tuned for tight level control at 50% level for a de-tailed dynamic simulation of the conical tank. Figure 3 shows that for setpoints ranging from 10% to 90%, a de-crease in process time constant greater than the decrease in process gain at low levels causes excessive oscillations.
An adaptive controller integrated into the DCS was used to automatically identify the process dynamics (process model) for the setpoint changes seen in Figure 3. The adaptive con-troller employs an optimal search method with re-centering that finds the process dead time, process time constant, and process gain that best fits the observed response. The trigger for process identification can be a setpoint change or peri-odic perturbation automatically introduced into the control-ler output or any manual change in the controller output made by the operator.
The process models are categorized into five regions as indicated in Figure 4. The controller gain and reset set-tings computed from the lambda tuning rules are then automatically used as the level moves from one region to another. This scheduling of the identified dynamics and calculated tuning settings eliminates the need for the adaptive controller to re-identify the process nonlinear-ity and tuning for different level setpoints. It was found that the use of lambda time, rather than lambda factors, with protection against going outside the controller gain limits helps provide a more consistent tuning criterion. As seen in Figure 5, the adaptive level controller elimi-nates the oscillations at low levels, and provides a more consistent level response across the whole level range.
Adaptive level controllers can eliminate tuning prob-lems from the extreme changes in level control dynamics associated with different equipment designs and operat-ing conditions. The integrated tuning rules prevent the user from getting into the confusing situations of upper and lower gain limits and the associated fast and slow
oscillations. The smoother and more consistent response allows the user to optimize the speed of the level loop from fast manipulation of column ref lux and reactor or crystallizer feed to slow manipulation of surge tank dis-charge f low control.
greg mcmillan is a consultant and controlTalk columnist. sridhar Dasani is a graduate ofmadras institute of Technology (miT) anna university in chennai india. Dr. PrakashJagadeesan is an assistant professor at madras institute of Technology (miT) anna university in chennai india.
Figure 4. Process models automatically identified for operating regions.
Figure 5. Performance of adaptive PID level controller for conical tank.
trends in technology

ABB Measurement Productswww.abb.com/flow
CoriolisMaster. Measurement made easy.
The new CoriolisMaster from ABB is one of the most compact coriolis mass flowmeters on the market. With no up or downstream piping requirements it can be installed in the tightest spaces, enabling applications not possible before. Its smaller size and simplicity saves you precious time in installation, set up and maintenance. Enjoy!
Learn more and download a FREE flow handbook.www.abb.com/flow

24
The Incredible Fiber-Optic Flowmeterby Béla Lipták
last year, when I was asked about the publication date of the 5th edition of my handbook, I answered 2014. Today, my answer is late 2015, and if you ask me next
year, my answer might also shift. Why? Because of the ex-plosion of inventions and international competition during the past decade to meet the needs of the new processes from deep-sea drilling to solar hydrogen, or in automating new nuclear power plants that will operate underwater.
Here I will discuss f low measurement, about which a decade ago I would have said everything that can be dis-covered already had been. I will describe only one new f low detector, but there are others.
We Have Entered a New AgeThe stone age ended, not because we ran out of stone, but because we discovered that bronze tools were better than stone ones. Similarly, the hydrocarbon/nuclear age will end, not because we run out of these materials, but because we will slowly discover that inexhaustible, safe and clean energy is better. Yet, it will take another gener-ation or two to make this transformation.
I call this transition time the “scraping the bottom of the barrel” period. During this period, some nations will be waging wars over what oil and gas is left, while one will use some of its budget to develop green energy technology.
So what’s the challenge for our profession? It is to help both. Here I will concentrate on the first group and fo-cus only on the oil and gas f low measurement advances that are occurring in fracking and undersea production processes.
Offshore Drilling and Fiber-Optic FlowmetersOil or natural gas production is a multiphase stream
consisting of oil, water, gas and sand. When drilling a couple of miles deep under the ocean or fracking a cou-ple miles below the groundwater layer in North Dakota, it’s good to know if the total f low rate or the composition of the product changes. This is very important for safety reasons.
Measurement of the multiphase f luid rate and f luid composition is also important for production efficiency reasons and for zonal allocation of gas production in multi-zone well completions. It also supports identifica-tion and localization of injection or production anom-alies in real time, determination of well productivity index, reduction of the need for surface well tests and surface facilities, etc.
That Was Then, This is NowIn the past, the f low rate and composition of the product was determined by above-ground separators and, after separation, the oil, water and gas f lows were separately measured. These separators were not only slow (often in-termittent), but they also usually separated only a small bypass stream, which was not necessarily representative. This technique was also expensive and took up a lot of space. Thus, replacing the separators with in-line, sub-sea, multiphase f lowmeters was a major advance both in terms of safety and efficiency.
Most of today’s multiphase flow rate measurements use Venturi tubes and nuclear densitometers. They have no moving parts, don’t require much maintenance, and use so-phisticated flow models to interpret multiple measurements (flow, density, pressure and temperature) into dynamic, mul-tiphase flow and composition determinations. The sub-sea multiphase flowmeters are “marinized,” packaged and
trends in technology

25
deployed by specialist subsea companies to replace topside well test separators, and serve not only the management of individual wells, but also reservoir management and alloca-tion metering.
Fiber-Optic FlowmetersThe latest technology in subsea flow metering uses down-hole fiber-optic (FO) cables mounted on the surface of the production pipe. On the right of Figure 1, the FO cable connecting the distributed optical temperature sensors (DTS) is shown in red, and the cable connecting the dis-tributed optical pressure sensors (DPS) is shown in blue. They interrogate multiple pressure and temperature sen-sors mounted on the outside surface of the production pipe.
These optical sensors take advantage of the fact that light in vacuum travels at velocity (C), and when it reaches the surface of a substance, it slows to velocity (V). The re-fractive index n of a particular substance equals the ratio of these two speeds (n = C/V). Therefore, the refractive index determines how much of the light is refracted when it hits the interface of a particular substance.
The refractive index (n) also determines the critical angle of ref lection, the angle at which total ref lection occurs, and the material behaves like a mirror. There-fore, if one is able to prepare an optical filter grating ele-ment that transmits all wavelengths except one, a wave-length-specific mirror is obtained.
The method, allowing a number of sensors to be inter-rogated by a single FO cable, uses a fiber Bragg grating (FBG). FBGs are constructed from segments of optical fi-bers. Each of these fiber segments reflects one particular wavelength of light and transmits all others. The FGB can therefore be used to provide in-line optical filters, each of which blocks or reflects a different specific wavelength.
This system is usually referred to as a distributed Bragg reflector. Figure 2 shows the structure of an FBG system. The refractive index profile of the fiber core shows the change of the refractive indexes (n0, n1, n2 …) along the core, and the spectral response at the bottom shows how the incident broadband signal is split into the transmitted and reflected components at the Bragg wavelength (λB).
Optical Pressure and Temperature SensorsThe fluid (a mix of gas, water and oil) passing through the production pipe travels at some average temperature and pressure. Both of these variables oscillate around some aver-age value. These fluctuations (the noise superimposed over the average values of the pressure and temperature of the fluid) carry valuable information because they are caused by eddy currents, gas bubbles, specific gravity changes compo-sition variations, etc. that occur very quickly.
The differential pressure between two detectors, for exam-ple, is related to the volumetric flow passing through the pipe, while the time it takes for a particular fluctuation to travel from one detector to another relates to the velocity of the fluid. The extremely fast optical pressure and temperature de-tectors pick up these oscillations and forward them to the so-phisticated algorithms at the receiving end of the FO cable, which interpret them into flow rate and composition.
Béla l ip ták , PE , au tomat ion, safe t y and energy consul tan t , is a lso edi tor of the ins t rument Engineers’ Handbook . He can be reached a t l ip takbela@aol .com.
Figure 2: Fiber-optic cable with a core containing gratings (n0 to n3)
that transmit all wavelengths except one (λB), which is specific to them
and which it reflects. Thereby, the receiver algorithm “knows” which
wavelengh is coming from which optical sensor, and can read many
sensors at the same time.
Core refractive index
Optical �ber
Fiber coreFiber core
Spectral response
Input Transmitted Re�ected
�B
���
all THE wavElEngTHs BuT onE
trends in technology

usa.siemens.com/lr250
SITRANS LR250 is your choice for liquid level measurement in storage and process vessels. With its new fl anged encapsulated antenna, corrosive and other aggressive materials are no problem for this transmitter. Reliability and improved safety? We do that. Higher temperatures or pressures? Those too. Welcome to liquid level perfection.
• Simple installation• Minimal maintenance• Suitable for temperatures up to 338 °F• True inventory management• Reliable level measurement • Flexible communications• Proven performance
SITRANS LR250 – your radar solution for liquids and slurries
usa.siemens.com/lr250
© 2
01
4 S
iem
ens
Ind
ust
ry,
Inc.
LR250_Ad_ControlMag_AUGUST_2014_Version2.indd 1 8/16/2014 9:04:16 AM

27
Level Reaches New HeightsEver-improving instruments and relaxed regulations are allowing workhorse technologies to
excel in dynamic, sticky, multiphase and politically sensitive applications.
by Jim Montague
w indows, f loats, displacers, magnets, sonics, radar, lasers and nuclear devices have met or at least partly satisfied each new level measurement chal-
lenge over the years, and most continue to be refined even now. However, new problems are always arriving, prompting new ways to look into tanks without opening them.
Tank Vessel Meets Ship VesselFor example, BP Exploration (www.bp.com) in Houston, Texas, recently replaced unreliable level transmitters on a f loating, production, storage and off-loading (FPSO) ship with guided-wave radar (GWR) transmitters from Emerson Process Management (www.emersonprocess.com). Operating about 100 miles off Africa’s west coast, BP’s FPSO processes and stores oil for export. The ship is 310 meters long, can store 1.77 million barrels of oil, and can process up to 240,000 barrels per day.
Changing process conditions, foam and vapor, and dirty, sticky f luids had made it difficult to measure level on the FPSO. Its original GWR transmitters weren’t compatible with the FPSO’s Foundation fieldbus (FF) network, and their limited ability to detect low-dielectric hydrocarbons required coaxial probes to increase surface signal strength. However, these probes were prone to sticky build-up, leading to unplanned downtime.
As a result, BP Exploration replaced the existing GWRs with Rosemount 5300 GWRs with signal-processing that ensures detection of low-dielectric f luids, and can send and receive cleaner, stronger signals (Figure 1). This al-lows use of single-lead probes that increase tolerance to solids build-up and coating, and eliminate trips due to false readings. Also, the Rosemount 5300’s FF interface
made installation and configuration quicker and easier. After the Rosemount 5300 GWRs were installed, the FP-SO’s process data confirmed the accuracy and reliability
Figure 1. BP Exploration is using guided wave radar (GWR) transmit-
ters from Emerson Process Management on its floating, production,
storage and off-loading (FPSO) vessel to secure accurate and reliable
level measurements in challenging process conditions about 100 miles
off the coast of Africa.
lEvEl on THE HigH sEas
Eme
rso
n Pr
oce
ss M
anag
em
ent
trends in technology

28
of the instruments and their suitability for its widely vary-ing process conditions.
Reining in Reactivity While its tank isn’t out on the ocean, U.K.-based Robin-son Brothers (www.robinsonbrothers.co.uk) probably has an even more difficult level measurement challenge—se-curing level indications for highly reactive carbon disul-fide (CS2). The company uses CS2 at its Midlands spe-cialty chemicals plant, but it must store the CS2 under a layer of water to prevent it from igniting. This means the level of the interface between the water and CS2 needs constant monitoring, so any related instruments are safe-ty-critical.
Robinson previously used a simple, magnetic, f loat-based device to measure the CS2 and water level, but it didn’t link to any wider control system, So, Robinson sought help from ICA Services (www.icaservices.co.uk), an instrumentation specialist in Manchester, U.K. ICA recommended using ABB’s (www.abb.com) AT100 mag-netostrictive level transmitter, which provides continuous level indication, transmits analog and/or digital signals
for monitoring or control, and can boost its resolution to more than 100 times greater than a conventional reed switch-type device (Figure 2). Most importantly, AT100
In a long-awaited and helpful regulatory update, the U.S. Federal
Communications Commission (FCC) reported Jan. 15 that it’s ad-
opted rules allowing “level probing radars” (LPRs) to operate any-
where in the country without a license.
The Measurement, Control & Automation (MCAA, www.
measure.org) reports it worked closely with the FCC through-
out the regulatory process, and the FCC’s technical office
drafted a Notice of Proposed Rulemaking in 2012 to revise its
former rules to allow unlicensed LPRs in “any type of tank or
open-air installation.”
The report and order are located at http://hraunfoss.fcc.gov/
edocs_public/attachmatch/FCC-14-2A1.pdf. They will be pub-
lished shortly in the Federal Register, and will become effective
30 days after that.
Specifically, the order modifies Part 15 of the FCC’s rules for
LPRs to operate on an unlicensed basis in the 5.925 to 7.250 GHz,
24.05 to 29.00 GHz and 75 to 85 GHz bands, and revises the mea-
surement procedures to provide more accurate and repeatable
measurement protocols for these devices. The rules now require
measuring emissions in the main beam of the LPR antenna, and
adjusting emission limits to account for attenuation that occurs
upon reflection of those emissions. The new limits will still protect
any nearby receivers from encountering interfering signal levels.
The FCC’s order also granted MCAA’s request to continue an op-
tion for certifying LPRs under Section 15.209’s more flexible emis-
sion limits because some LPRs need wider bandwidths than the
new rules allow.
In addition, by changing these technical testing requirements,
the new FCC rules partially harmonize U.S. rules for LPRs with
the similar European Telecommunications Standards Institute’s
(ETSI) Technical Standard for LPR devices, which also bases its
measurements on main-beam emission limits. MCAA also sought
this because it will improve the global competitiveness of U.S.
level instrumentation manufacturers.
fcc allows unlicEnsED “lEvEl ProBing raDar” in oPEn air
Figure 2. U.K.-based Robinson Brothers is using a magnetorestrictive
level transmitter from ABB to meet strict safety standards for handling
highly reactive carbon disulfide (CS2).
carEful wiTH cHEmicals
AB
B
trends in technology

also meets the most-extreme ATEX Exd IIC T6 protec-tion standard and toughest SIL1 performance standards. “Our new system provides process signals that output to both our local and site monitoring systems, and it meets our internal requirement for SIL1-capable instrumenta-tion,” says Tom Rutter, Robinson’s E&I manager.
Low-Power, FDT and FCC Aid LevelWhile ongoing technical advances get the main spot-light in level measurement, organizational efforts have helped, too. Boyce Carsella, consultant at Magnetrol (www.magnetrol.com), reports level measurement’s mi-gration to lower-power sources has enabled it to serve in new and hazardous applications, while electronic device
descriptions (EDDs) standardized by the FDT Group (www.fdtgroup.org) are bringing level instruments closer to plug and play.
“Radar and guided-wave radar are the most successful level measurement technologies today because they’re non-contact, unaffected by atmosphere, and can handle the widest range of applications,” says Carsella. “How-ever, radar’s popularity will be helped even more by the FCC’s adding to its Part 15 rules on ‘level probing radar,’ which will allow it to be applied outside or on open tanks [see sidebar]. This will open up many applications, such as water/wastewater or other plants with outdoor or open vessels.”
Jim Montague is Control ’s execut ive edi tor
Trends in Technology

Get this and other white papers, datasheets and videos to learn about our safety products at:Or call 800-999-2900
,at:www.miinet.com/safetyseries
7.875”
Like a good goalkeeper, a Safety Instrumented System (SIS) is your dependable “last line of defense.” This means you need reliable Functional Safety products to anchor your team.
You can count on Moore Industries with FS Functional Safety Series products designed for Safety Instrumented Systems and to IEC 61508 standards. Our alarm trips, relays, isolators and splitters help your SIS perform at its highest level. With approval from exida for use in SIL 3 and SIL 2 environments, you can install our products with con dence.
Looking to add more reliability to your SIS roster? Our FS Functional Safety Series products...
• Are exida certi ed with reviewed FMEDA reports
• Warn of and prevent potentially hazardous conditions
• Add layers of protection to existing safety systems
• Isolate an SIS from a basic process control system
• Share, split and pass valuable HART data
Great teams are con dent their keeper will make the big save with the game on the line. Shouldn’t you feel the same about your safety instrumentation?
When Your SIS is Your Last Line of Defense
Moore Industries Is ThereMMMMMMMMMMMMMMMMMMMMMMMMMMMMMMMMMMMoooooooooooooooooooooooooooooooooooooooooooooooooooooooooooooooooooooooooorrrrrrrrrrrrrrrrrrrrrrrrrrrrrrrrrrrreeeeeeeeeeeeeeeeeeeeeeeeeeeeeeeeeeeeee IIIIIIIIIIIIIIIIIIIIIIIIIIIIInnnnnnnnnnnnnnnnnnnnnnnnnnnnnnnnnnnnnddddddddddddddddddddddddddddddddddddddduuuuuuuuuuuuuuuuuuuuuuuuuuuuuuuuuuuussssssssssssssssssssssssssssssssssssssttttttttttttttttttttttttttttttttttttttrrrrrrrrrrrrrrrrrrrrrrrrrrrrrrrrrrrrriiiiiiiiiiiiiiiiiiiiiiiiiiiiiiieeeeeeeeeeeeeeeeeeeeeeeeeeeeeeeeeeeeeeeessssssssssssssssssssssssssssssssssssss IIIIIIIIIIIIIIIIIIIIIIIIIIIIsssssssssssssssssssssssssssssssssssssss TTTTTTTTTTTTTTTTTTTTTTTTTTTTTTTThhhhhhhhhhhhhhhhhhhhhhhhhhhhhhhhhhhhheeeeeeeeeeeeeeeeeeeeeeeeeeeeeeeeeeeeeeerrrrrrrrrrrrrrrrrrrrrrrrrrrrrrrrrrreeeeeeeeeeeeeeeeeeeeeeeeeeeeeeeeeeeeee
Demand Moore Reliability
Tank Over ll Protection Application White Paper
CONTROLmag_2014-09_SafetyFamAd_FlowTechReport_FullPg_Moore_Industries.pdf
QR code: http://www.miinet.com/Portals/0/PDFs/Logic_Solver_for_Tank_Over ll_Protection_White_Paper_Moore_Industries.pdf
Scan the codeand go directly to the white paper
10.5”
•••••

31
Flow Charts New WatersFlowmeters, controllers and their supporting components and software are adding new
functions that are allowing them to take on some new and unusual tasks and applications.
By Jim Montague
i t shouldn’t be surprising, but adding innovations and new capabilities to familiar technologies can make them show up in some unexpected places. For instance, most of the
basic parameters of flow sensing and control are well known, but continual advances in flow conditioning and manage-ment are enabling them to be implemented in some unusual applications and settings, and be applied by users that hadn’t considering using them before or couldn’t afford them.
For example, while it might be surprising to see a bunch of Coriolis flowmeters sprouting on top of a filling machine, that’s exactly what GF S.p.A. (www.gf-industries.it) in Parma, Italy, did recently to reduce filling times, improve accuracy and repeatability, and enable tighter filling tolerances on its advanced filling equipment (Figure 1). GF’s filling machines are used in pharmaceutical, food and medical applications to precisely measure compounds for injections, infusions, oph-thalmic preparations, syrups and detergent solutions.
GF previously used filling methods based on time-pressure instruments, as well as piston-syringe and peristaltic (roller type) pumps, on machines for its pharmaceutical customers. Besides seeking to improve filling speed and accuracy, GF also wanted to enable users to change media without replacing the measuring instrument, and enable in-line sterilization without disassembling the machine, according to Marco Serventi, GF’s sales manager. GF met its goals by using Micro Motion Elite and H-Series flowmeters and Model FMT filling mass trans-mitters from Emerson Process Management (www.emerson-process.com). Also, the rangeability of these Coriolis flowme-ters allows different media in the range of 0.5 g to 5 kg to be dispensed without changing mechanical components.
“We were able to improve system response time and reduce batch cycle times by taking advantage of integrated valve control from the transmitter, rather than the traditional pulse output set
up through a PLC,” explains Serventi. “The reliability and ac-curate results provided by the Micro Motion instruments have now been validated by GF customers over a number of success-ful applications.”
Nuclear and Underwater Likewise, NRG Laboratory’s (www.nrg-labs.com) facility in the Netherlands makes nuclear medical isotopes and tests materials for nuclear power plants. It uses flow metering to measure its nuclear laboratory and reactor’s basin cooling system, which uses a medium called “demiwater.”
When its old vortex flowmeter wore out and a replacement wasn’t available, NRG Lab began searching for a substitute with long-life electronics, low maintenance costs, small foot-print, good underwater performance and the ability to with-stand radiation. Eventually, NRG Lab settled on McCrom-eter’s (www.mccrometer.com) differential pressure V-Cone flowmeter with built-in flow conditioning for accuracy to +0.5% of the flow rate with +0.1 repeatability. It suits tight ret-rofit installations because it only requires a minimal 0-3 pipe diameters upstream and 0-1 diameters downstream.
NRG Lab reports its V-Cone flowmeter performs better than its former vortex flowmeter, requires no maintenance such as changing cables, and enhances safety by avoiding having any electronics near the reactor vessel.
Aiding Lubrication Applications To help give its new lubricant bottom-loading bay more ef-ficient and safer driver-initiated loading, Shell Lubricant Center (www.shell.co.uk) at Stanlow refinery in Ellesmere Port, Cheshire, U.K., recently deployed 10 Promass 83F Co-riolis mass flowmeters from Endress+Hauser (www.endress.com). The flowmeters use Profibus DP communications,
trends in technology

32
and this provides added density and temperature data, re-duces cabling and I/O requirements, and links seamlessly with Shell’s inventory control system. Because Shell’s tank-ers load according to volume, knowing product density is crucial due to changes cause by temperature fluctuations.
Also, the driver-initiated loading functions are more efficient because drivers no longer have to wait for manual link-ups to pumps; load qualities and grades are validated automatically; and this streamlines and cuts the required steps by 50%. “Driv-er-initiated loading has proven to be a real benefit all round,” says Chris Turner, Shell Lubricant’s E&I engineer. “All the
data provided by Profibus, such as diagnostic information, helps us maintain smooth operation and system integrity, and the Promass flowmeters are low-maintenance, accurate, secure and user-friendly.”
Likewise, Novelis’ (www.novelis.com) aluminum flat-roll-ing mill in Lüdenscheid, Germany, needs to constantly lubri-cate the 13,000 tons of aluminum rolls it makes each year with high-quality oil. However, this oil often thins during produc-tion, which can reduce lubrication, damage the rolls, and stop production. Oil thinning is accompanied by a minimum den-sity change of around 0.8 grams per liter (g/l).
coriolis collEcTion
Figure 1: Italy-based filling machine builder GF S.p.A. is using Micro Motion Coriolis flowmeters to reduce filling times, improve accuracy and
repeatability, and enable tighter filling tolerances on its filling machines.
Pho
to c
our
tesy
of E
me
rso
n Pr
oce
ss M
anag
em
ent
trends in technology

33
To prevent these problems, Novelis recently installed Co-riolisMaster FCB300 mass flowmeters from ABB (www.abb.com), which can perform density measurements at up to 0.5 g/l in field adjustments. This means fluctuations in density can be detected much earlier, and Novelis can take counter-measures to prevent damage to the rolls. Besides high-pre-cision density measurement, FCB350 also gives the rolling mill a smooth density signal, so unique trends can be ob-served.
Optimized Oxygen = Stronger SteelWhile a steel plant might not seem like the most logical place for a flowmeter, a closer look at More s.p.l (www.more-oxy.com) in Gemona del Friuli, Italy, reveals the electric arc furnaces it supplies to mini-mills are using vortex flowmeters to minimize fuel and oxygen consumption, optimize steel quality, prevent rework and reduce costs (Figure 2). More also supplies auxiliary steelmaking equipment, including sidewall injector systems used with chemical energy packages such as oxygen, carbo-naceous fuels, lime and other fine compounds. These chem-icals are injected into the furnace during the manufacturing process to improve steel quality, and provide additional energy from exothermic reactions, helping to reduce overall energy consumption.
More had been using differential pressure flowmeters to measure critical oxygen flows in its furnaces, but they made it difficult to handle changing process requirements and meet user demands for more accurate control. The com-pany needed more accurate instruments with a broader mea-surement range, so it evaluated vortex flowmeters, and im-plemented Emerson’s Rosemount 8800 vortex flowmeters, which are designed to addresses the limits of traditional vor-tex flowmeters. For example, its Adaptive Digital Signal Pro-cessing (ADSP) signal filtering and a mass-balanced sensor design maximize measurement reliability, and eliminate the impact of vibrations on measurement accuracy. Also, to meet demands for greater flexibility in furnace installations, Rose-mount 8800’s 25:1 rangeability helps optimize gas heaters, providing greater opportunities to vary steel characteristics for different applications.
“By implementing Emerson’s vortex technology, we’ve
been able to build electric arc furnace solutions that guaran-tee optimum furnace efficiency for users,” says Roberto Ur-bani, More’s purchasing manager. “We’ve been able to op-timize furnace efficiency in terms of productivity and steel quality. Over-oxidation is no longer an immediate concern, which extends furnace lifecycles. Energy consumption and ambient pollution were also reduced.”
Jim montague is control ’s execut ive edi tor.
Figure 2: More s.r.l. has deployed Rosemount 8800 vortex flowmeters
to help reduce energy consumption and optimize fuel provided to its
arc furnaces.
oPTimizED arc furnacEPh
oto
co
urte
sy o
f Em
ers
on
Pro
cess
Man
age
me
nt
trends in technology

• • • •
• • • •
• • • •
• • • •

35
Beginner’s Guide to Differential Pressure Level TransmittersThe Not-So-Straightforward Basics of This Measurement Technique
By David W. Spitzer
g IGO means “garbage in, garbage out.” This phrase applies in industrial automation because using faulty measurements can fool even the best control system.
One remedy that can help avoid a GIGO scenario is to understand the measurement technique and its limita-tions to the extent that its application can be reasonably evaluated. Differential pressure level measurement is one of those key measurements you need to understand to avoid the dreaded GIGO.
The importance of level measurement cannot be over-stated. Incorrect or inappropriate measurements can cause levels in vessels to be excessively higher or lower than their measured values. Low levels can cause pump-ing problems and damage the pump, while high lev-els can cause vessels to overf low and potentially create safety and environmental problems. Vessels operating at incorrect intermediate levels can result in poor operating conditions and affect the accounting of material.
The level of a liquid in a vessel can be measured di-rectly or inferentially. Examples of direct level measure-ment include f loat, magnetostrictive, retracting, capac-itance, radar, ultrasonic and laser level measurement technologies. Weight and differential pressure technol-ogy measure level inferentially. All have problems that can potentially affect the level measurement.
Differential pressure level measurement technology infers liquid level by measuring the pressure generated
by the liquid in the vessel. For example, a water level that is 1000 millimeters above the centerline of a differential pressure transmitter diaphragm will generate a pressure of 1000 millimeters of water column (1000 mmWC) at the diaphragm. Similarly, a level of 500 millimeters will generate 500 mmWC. Calibrating this differential pres-sure transmitter for 0 to 1000 mmWC will allow it to measure water levels of 0 to 1000 millimeters.
Note that this example presumes that the liquid is wa-ter. Liquids with other specific gravities will generate other differential pressures and cause inaccurate mea-surements. Continuing with the previous example, the same 500-millimeter level of another liquid with a spe-cific gravity of 1.10 at operating conditions in the above vessel will generate 550 mmWC of pressure at the trans-mitter. As such, the differential pressure transmitter cal-ibrated for water would measure 50 millimeters higher than the actual 500 millimeter liquid level. Conversely, if the liquid has a specific gravity that is lower than that of water, this transmitter will measure lower than the actual level. This example illustrates that differential pressure technology does not measure level, but rather infers level.
Three CalculationsAll is not lost because the calibration of the differential pres-sure transmitter can be modified to compensate for a dif-ferent specific gravity. This technique used to calculate the
Back to Basics

36
new calibration is useful for both straightfor-ward and more complex installations.
Figure 1 shows the vessel both at 0% and 100% level. The pressure generated by the liquid at the level transmitter diaphragm is the liquid height times the specific gravity. The pressure is 1.10*(0 mm) when the vessel at 0% and 1.10*(1000 mm) when the vessel at 100%. Therefore, the transmitter should be calibrated 0 to 1100 mmWC to measure liq-uid levels of 0 mm to 1000 mm.
A somewhat more complex application is illustrated in Figure 2. In this application, for process reasons, we need to take the mea-surement from 200 mm to 1000 mm above the nozzle. In addition, the transmitter is located 500 mm below the nozzle. Note that the technique of sketching con-ditions at both 0% and 100% level is the same as performed in Figure 1. At 0% level, the pressure at the transmitter is 1.10*(500 +200 mm), or 770 mmWC. At 100% level, the pressure at the transmitter is 1.10*(500+1000 mm) or 1650 mmWC. Therefore, the transmitter should be calibrated 770 to 1650 mmWC to measure liquid levels of 200 mm to 1000 mm above the nozzle.
Figure 3 illustrates the use of a differential pressure transmitter with diaphragm seals to sense the pressures at the nozzles in a pressurized vessel. In this application, the low-pressure diaphragm is located above the liquid to compensate for the static pressure in the vessel. Other complications include the densities of liquid and capil-lary fill f luid and 0% and 100% levels that do not corre-spond to the nozzle positions.
Using similar techniques as in the previous examples, at 0% level, the pressures at the high and low sides of the trans-mitter are {1.10*(200 mm) + (3 bar)} and {1.05*(1300 mm)
+ (3 bar)} respectively. Therefore, the differential pressure transmitter will subtract the high side from the low side and measure {1.10*(200 mm) + (3 bar)} minus {1.05*(1300 mm) + (3 bar)}, or -1145 mmWC.
At 100% level, the pressures at the high and low sides of the transmitter are {1.10*(1000 mm) + (3 bar)} and {1.05*(1300 mm) + (3 bar)} respectively. Similarly, the differential pressure transmitter subtracts the high side from the low side to measure {1.10*(1000 mm) + (3 bar)} minus {1.05*(1300 mm) + (3 bar)}, or -265 mmWC. Therefore, the transmitter should be calibrated -1145 mmWC to -265 mmWC to measure liquid levels of 200 to 1000 millimeters above the lower nozzle.
Note that the static pressure in the vessel does not af-fect the calibration because it appears on both sides of the differential pressure transmitter where it effectively cancels out. Further analysis also will reveal that locat-ing the differential pressure transmitter at different ele-vations does not affect the calibration.
These same techniques can be used to determine the
Back to Basics
Figure 1. The level transmitter for these vessels should be calibrated 0 to 1100 mmWC to
measure liquid levels of 0 to 1000 millimeters.
0% Level
SG = 1.10
LT
1000 mm
SG = 1.10
100% Level
LT0 mm
0% Level
SG = 1.10
1000 mm
SG = 1.10
100% Level
200mm
LT
500 mm 500 mm
0% Level
SG = 1.10
1000 mm
SG = 1.10
100% Level
1300 mm
LT
1300 mm
LT
SG = 1.05(Fill)
SG = 1.05(Fill)
Pressure = 3 bar
LT
200 mm

37
Back to Basics
calibrations for interface level measure-ments. Note that these techniques in-volve applying hydraulics to the installa-tion and application. Nowhere do we use terms such as elevation, suppression and span. The use of these terms can easily confuse and mislead the practitioner.
What IfsWhat if the liquid density changes during operation? What if the change is due to changes in the composition of the liquid? What if the change is due to temperature changes? What if the vessel is filled with a different liquid that has a different specific gravity? These are important questions that should be asked (and answered) when con-sidering the use of differential pressure level measurement instruments. Repeating, differential pressure measure-ment does not measure liquid level—it infers liquid level—so specific gravity changes can affect the performance of the level measurement. In practice, the specific gravity of many liquids is known and relatively stable, so that differ-ential pressure techniques are commonly applied to many liquid level measurement applications.
Spanning SpecificationsThe differential pressure transmitter should be operated within its published specifications to maintain accuracy. The span of a transmitter is the difference between the 100% and 0% calibration values. Differential pressure transmitters have specified minimum and maximum spans. For example, a given differential pressure trans-mitter may be calibrated with spans between (say) 400 mmWC and 4000 mmWC. In addition, the transmitter
zero may also be raised or lowered by up to, for example, 4000 mmWC. Calibrations that do not meet the trans-mitter specifications are potentially subject to significant error. The calibrations in the examples were 0 to 1100, 770 to 1650, and -1145 to -265 mmWC, respectively. Each has a span greater than 400 mmWC and less than 4000 mmWC. In addition, their zeros are not raised or lowered by more than 4000 mmWC. Therefore, all of these cali-brations are within the transmitter specifications.
However, the calibrated span specified for another transmitter model of the same manufacture may be be-tween 100 mmWC and 1000 mmWC, and allow the zero to be changed by 1000 mmWC. This transmitter would not be applicable to the first and third examples where the span is 1100 mmWC, and the zero is lowered by 1145 mmWC, respectively. However, it could be used in the second example where the span is 880 mmWC, and the zero is raised by 770 mmWC. Using this lower range
Figure 2. This transmitter should be calibrated 770 to 1650 mmWC to measure liquid
levels of 200 mm to 1000 mm above the nozzle.
0% Level
SG = 1.10
LT
1000 mm
SG = 1.10
100% Level
LT0 mm
0% Level
SG = 1.10
1000 mm
SG = 1.10
100% Level
200mm
LT
500 mm 500 mm
0% Level
SG = 1.10
1000 mm
SG = 1.10
100% Level
1300 mm
LT
1300 mm
LT
SG = 1.05(Fill)
SG = 1.05(Fill)
Pressure = 3 bar
LT
200 mm

38
transmitter (1000 mmWC) will usually be more accurate because of the smaller absolute errors associated with other specifications such as temperature, pressure and ambient temperature affects. Therefore, all being equal, it’s generally desirable to use the lower range transmitter to reduce measurement error.
The maximum f low rate of f lowmeters is often speci-fied to be significantly higher than the design f low rate to allow for transients and increased plant throughput over time. In level measurement, the vessel size is fixed, so using a higher range differential pressure transmitter provides no similar benefit and typically results in addi-tional measurement error that can be avoided by using a lower range transmitter.
Using the available information properly is another po-tential problem. Some years ago, distributed control system inputs were incorrectly configured to correspond to the maximum transmitter spans. Aside from using incorrect
values, the levels should have been expressed in percent. Using absolute level measurement units such as inches, feet, millimeters or meters increases the potential for error because operators must remember the height of each ves-sel to put the level measurement in context with the vessel. This can easily become overwhelming and cause operator errors because plants often have hundreds of vessels. For example, a vessel operating at 2.8 meters does not readily indicate a problem to the operator even though the vessel overflows at 3.0 meters. On the other hand, the operator can easily determine that a vessel operating at 93% level might warrant attention and that a vessel operating at 97% may need immediate attention.
Differential pressure measurement is a workhorse of in-dustrial level measurement that’s been used for decades and will continue to be used for decades to come.
David w. spitzer is a principal in spitzer and Boyes and a regular control contributor.
Back to Basics
Figure 3. In this case, the differential pressure transmitter subtracts the high side from the low side, so it should be calibrated -1145 to -265 mmWC
to measure liquid levels of 200 to 1000 millimeters above the lower nozzle.
0% Level
SG = 1.10
LT
1000 mm
SG = 1.10
100% Level
LT0 mm
0% Level
SG = 1.10
1000 mm
SG = 1.10
100% Level
200mm
LT
500 mm 500 mm
0% Level
SG = 1.10
1000 mm
SG = 1.10
100% Level
1300 mm
LT
1300 mm
LT
SG = 1.05(Fill)
SG = 1.05(Fill)
Pressure = 3 bar
LT
200 mm

1-800-343-1001 • www.predig.com/modbus
Take Advantage of Your Modbus SignalBy using the Modbus signal from your existing multivariable level transmitters, you will unleash a whole new dimension of display possibilities. Paired with a new Precision Digital Modbus Scanner you can display multiple variables including level, interface level, density, temperature and more. Best of all, you can leave the climbing to us.
Why Modbus Scanners? > Scan up to 16 PVs > Easy instrallation & setup > Display level in feet & inches* > SafeTouch® thru-glass buttons* > Display PV and tag name > 4-20 mA retransmission
* Available on select meters
PRECISION DIGITAL CORPORATION Since 1974
densitylevel volumeinterface level temperature
Series
Leave the Climbing to UsInstall a Precision DigitalModbus® Scanner as aTank-Side Indicator

40
Ever since the invention in the 1790s of the Wolt-man-style mechanical turbine f lowmeter, we’ve been looking for the one f lowmeter that will work in every
application. Unfortunately, there are 12 f low measure-ment technologies in common use for a very good rea-son. No single f low technology works well, or even ac-ceptably, in all applications.
Of the more broadly based f low technologies, the one that works in the most applications, across most industries and with higher accuracy than even differential pressure is the electromagnetic f lowmeter, or magmeter. Accord-ing to Jesse Yoder at Flow Research (www.f lowresearch.com), the total global market for f lowmeters is roughly $4.7 billion, and magnetic f lowmeters account for a little less than 20% of that total. Magmeters are used in every process industry vertical. They are designed for handling almost all water-based chemicals and slurries and are fur-nished with corrosion- and abrasion-resistant linings and even clean-in-place (CIP) designs.
Magmeters also are made in the widest size range of any f lowmeter technology because they can be scaled up almost infinitely. The first use of the technology was in the huge sluices that drained the Zuider Zee in the Netherlands in the 1950s, and typically vendors supply a size range from ½ in. (12 mm) to 36 in. (914 mm), with several vendors supplying extended sizes up to 120 ins. (3048 mm). Several vendors sell sizes below ½ in. as well. How it is possible to scale up and down this broadly is di-rectly related to the technology.
How a Magmeter WorksIn 1831, Michael Faraday formulated the law of elec-tromagnetic induction that bears his name. As used in an electromagnetic f lowmeter, coils are placed parallel to f low and at right angles to a set of electrodes in the sides of the pipe, generating a standing magnetic field (see Figure 1). The pipe must be non-magnetic and lined with a non-magnetic material, such as plastic, rubber or Tef lon. When the f luid (which must be conductive and free of voids) passes through the coils, a small voltage is induced on the electrodes, proportional to the def lection of the magnetic field. This def lection is the sum of all of the velocity vectors impinging on the magnetic field.
Modern magmeters operate on a switched DC field principle to zero out ambient electrical noise and noise actually in the process f luid. They turn the field off, mea-sure the voltage that’s still induced on the electrodes, then turn the field back on and subtract the off-state volt-age from the on-state voltage. They do this several times a second, which reduces zero drift to almost nothing.
What this means is that the voltage induced on the electrodes is directly proportional to the average veloc-ity in the pipe and is, therefore, significantly more ac-curate than any other velocity-based measurement prin-ciple that only looks at a point or line velocity. In fact, the magnetic f lowmeter is generally considered the most accurate wide-application f lowmeter in current use, ap-proaching the accuracy of positive displacement f low-meters. They’re often used for custody transfer when the
Back to the Basics: Magnetic FlowmetersClose to being “Prince Flowmeter Charming,” magmeters do it (nearly) all.
by Walt Boyes
Back to Basics
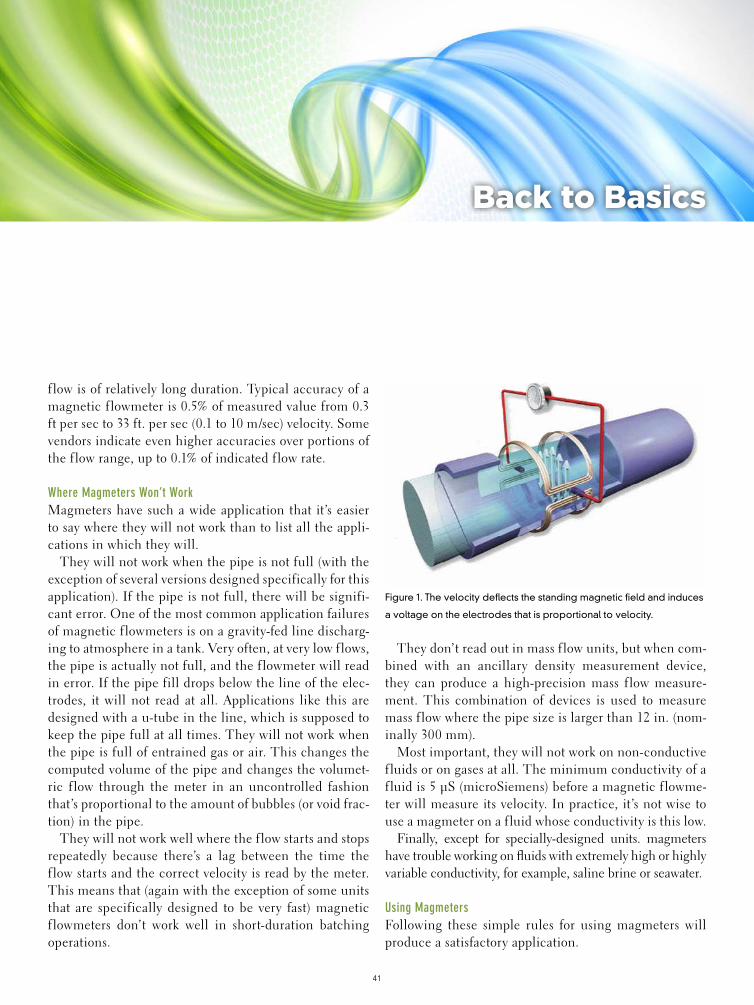
41
f low is of relatively long duration. Typical accuracy of a magnetic f lowmeter is 0.5% of measured value from 0.3 ft per sec to 33 ft. per sec (0.1 to 10 m/sec) velocity. Some vendors indicate even higher accuracies over portions of the f low range, up to 0.1% of indicated f low rate.
Where Magmeters Won’t WorkMagmeters have such a wide application that it’s easier to say where they will not work than to list all the appli-cations in which they will.
They will not work when the pipe is not full (with the exception of several versions designed specifically for this application). If the pipe is not full, there will be signifi-cant error. One of the most common application failures of magnetic f lowmeters is on a gravity-fed line discharg-ing to atmosphere in a tank. Very often, at very low f lows, the pipe is actually not full, and the f lowmeter will read in error. If the pipe fill drops below the line of the elec-trodes, it will not read at all. Applications like this are designed with a u-tube in the line, which is supposed to keep the pipe full at all times. They will not work when the pipe is full of entrained gas or air. This changes the computed volume of the pipe and changes the volumet-ric f low through the meter in an uncontrolled fashion that’s proportional to the amount of bubbles (or void frac-tion) in the pipe.
They will not work well where the f low starts and stops repeatedly because there’s a lag between the time the f low starts and the correct velocity is read by the meter. This means that (again with the exception of some units that are specifically designed to be very fast) magnetic f lowmeters don’t work well in short-duration batching operations.
They don’t read out in mass f low units, but when com-bined with an ancillary density measurement device, they can produce a high-precision mass f low measure-ment. This combination of devices is used to measure mass f low where the pipe size is larger than 12 in. (nom-inally 300 mm).
Most important, they will not work on non-conductive f luids or on gases at all. The minimum conductivity of a f luid is 5 μS (microSiemens) before a magnetic f lowme-ter will measure its velocity. In practice, it’s not wise to use a magmeter on a f luid whose conductivity is this low.
Finally, except for specially-designed units. magmeters have trouble working on fluids with extremely high or highly variable conductivity, for example, saline brine or seawater.
Using MagmetersFollowing these simple rules for using magmeters will produce a satisfactory application.
Back to Basics
Figure 1. The velocity deflects the standing magnetic field and induces
a voltage on the electrodes that is proportional to velocity.

42
Straight Run. Magnetic f lowme-ters need less straight run than most f lowmeters, often as little as three diameters upstream of the electrode plane (the centerline of the meter body, usually), and no diameters of straight run downstream. But some-times, a better choice is to go with as much straight run as you can get. For example, spiraling f low (swirl in the pipe) can propagate for hundreds of diameters after a three-dimensional turn in piping. Spiraling f low causes severe inaccuracy in a magmeter, sometimes as much as 40% of mea-sured value.
Vertical Mounting. One way to make sure you have a fully developed f low profile moving through the me-ter is to mount your magmeter so that the f low is through the meter in the vertical direction. This helps in cases of spiraling f low and also helps re-duce air entrainment.
Right Sizing. Although a magme-ter will operate over the entire range from 0.3 fps to 33 fps (0.09 to 10 me-ters per second) velocity, it isn’t wise to install a magmeter that’s going to operate permanently at the lower end of that range. This can cause buildup of solids inside the f low tube and sometimes on the electrodes them-selves. If buildup occurs inside the f low tube, the calculated volume is now in error, and if buildup occurs on the electrodes, the insulating proper-ties of the buildup can either reduce
the voltage or break the circuit en-tirely. Either will cause inaccurate readings. It’s better to size the f low-meter for a normal f low that’s about 60% of maximum for that pipe size, and if necessary, install a properly de-signed meter run.
Proper Grounding. The pipe sec-tion of the magmeter needs to be non-conductive for the circuit to work. The electronics are suscepti-ble to interference if they’re f loating above ground. Magmeter vendors all have grounding procedures, which you ignore at your peril.
Temperature and Pressure. Mag-netic f lowmeters are designed to work at moderate temperatures and pres-sures and should not be stressed. Mag-netic f lowmeters should not be oper-ated where a vacuum can be pulled inside the f low tube when there is a pressed-in polyurethane or Tef lon lining, because the vacuum can pull the lining right out of the meter, caus-ing potential hazard. Both Teflon and polyurethaneare de-rated for pressure at the upper end of their temperature range and will deform if overheated.
Magnetic f lowmeters have become one of the most widely used f low tech-nologies in the 50 years since their first introduction. They’re simple, easy to maintain, and because they have no moving parts, they can oper-ate for years without maintenance.
wal t Boyes is a pr incipal wi th spi t zer & Boyes.
Back to Basics
Figure 2. Some basic rules of thumb for
using magmeters
Good
Better
3D upstream, 1D downstream
10D upstream, 5D downstream
Discharge intoan open tank is not a gooddesign
Yes No
Flow
Flow

43
The Right Tool for Tricky Measurement JobsGamma nuclear level gauges handle the toughest applications.
by Walt Boyes
let’s say you have a reactor vessel. It is 6 ft. (1.8 m) in di-ameter, glass-lined, has a big agitator in it, and has both a jacket made of 1-in. (25-mm) copper cooling coils and
a 4-in. (100-mm) layer of insulation covered with thin steel lagging. Worse yet, there are no accessible entrances into the top of the vessel that aren’t already being used for some-thing. For the process to work, you must measure the level in the vessel with significant precision. You’ve even tried weigh cells, but there isn’t enough precision to just weigh the con-tents of the reactor, with all that tare weight. Oh yeah, and you can’t stop the reactor to modify it, and since it is a glass-lined and code-stamped vessel, you can’t drill any holes in it either. What do you do?
Or, suppose you’re making glass for a variety of products. The glass is produced by melting silica sand, glass frit from recycled bottles and some trace minerals in a very hot fur-nace with firebrick walls that are over 1 ft (300 mm) thick. The glass is too hot to pump, so it must flow by gravity down a firebrick-lined channel to where it is cast or molded or ex-truded. Your requirement is that you have to measure the level of the molten glass and control it to ±0.0005 in. (±0.013 mm), or the process doesn’t work. Glass castings have holes called holidays in them, and extruded glass, whether tube or sheet, has flaws and holes. What do you do?
You are responsible for the air pollution control system for a very large coal-fired power plant. You have electrostatic precipitators that remove the fly ash from the stack gas be-fore it gets released into the atmosphere, causing interna-tional pollution incidents and costing your utility millions in air-pollution-control violation fines. But the hoppers that hold the precipitated fly ash keep plugging up, and fly ash is very hot and also acts like concrete and sticks to everything. You need some way to tell when the hoppers are full, so you
can empty and clean them, but anything you stick into the hopper just gums up and fails so fast that you have given up. What do you do?
Sound familiar? Nearly every plant, from mining to waste-water and every process vertical in between, has a level ap-plication that is both critical and difficult, if not impossible, to measure.
Enter the Gamma Level GaugeSince the 1950s, the answer to all of these applications has been the proper application of a gamma level gauge. Gamma gauges work based on both the inverse-square law—radiated energy decreases with the square of distance—and the fact that dense materials absorb gamma energy—1 in. (25 mm) of steel, for example, cuts the energy from a gamma beam by 50%.
Very early on, engineers came up with the idea that ris-ing material or liquid would change the amount of energy reaching a detector on the other side of the vessel from an emitting source. In the case of a point level switch measure-ment (Figure 1), rising material would simply trigger a relay if the energy beam were interrupted. In the case of a con-tinuous level measurement (Figure 2), the rising material would cause a decrease in the intensity of the energy beam reaching the detector that could be calibrated to be propor-tional to the rise in level, and when the level fell, then the energy would likewise increase.
Designing to FitIn order to figure out how much energy will reach the de-tector, essentially all you have to do is to add up the densi-ties and thicknesses of all the materials between the energy source and the detector, and make the energy beam intense
Back to Basics

44
enough to pass through all that material and reach the de-tector. Safety requires that the intensity of the energy beam be designed to be as small as possible and still make the measurement.
“Modern detector designs have made it possible to use sig-nificantly lower activity sources than in previous years,” says Mick Schwartz, business unit manager of Berthold Tech-nologies USA LLC (www.berthold.com), a manufacturer of gamma level gauging products. “This means that the risk of exposure to gamma energy for personnel is minimized and amenable to proper safety precautions. Gamma energy does not cause any of the measured product or the vessel to be-come radioactive.”
All manufacturers of gamma level gauges have software that makes the calculation of energy source size straight-forward. You or the vendor plug in the numbers for the thicknesses and densities of the material, not forgetting the air gap between the walls of the vessels—air has den-sity, and energy decreases with the square of distance—and the software spits out an optimized energy source size and, in most cases, the appropriate housing design and detector selection.
Gauging in the Real WorldSo let’s look at how to do the level application in the jack-eted vessel we talked about earlier. This is not quite as easy as putting a source and a detector across from each other because there are vessel internals, including an ag-itator, that have to be missed. The way to do this applica-tion is to “shoot a chord” of the vessel’s diameter—that is, put the source and detector off to one side of the diam-eter. Because the thicknesses that the energy beam will shoot through will be greater, the source activity that will be required will be greater by some amount than shooting the diameter would be. The blades of the agitator need to be considered, and, if possible, eliminated by shoot-ing the chord between the blades and the vessel wall. If that isn’t possible, many gamma level gauges can be programmed to ignore the repetitive density fluctuation caused by blades swinging into and out of the beam. It just makes the signal noisy.
Now let’s look at the glass level gauge. There’s a lot of fire-brick on either side of the glass channel, so it may be nec-essary to drill holes in the firebrick to reduce its thickness. This will cause the temperature on the outside to rise, so the
Figure 2. Rising material decreases the intensi-
ty of the energy beam.
conTinuous lEvEl mEasurEmEnT
Figure 3. Here the apex of the triangle is
aimed at the point detector.
sTriP sourcE anD PoinT DETEcTor
Figure 1. Rising material triggers a relay if the
energy beam is interrupted.
gamma PoinT lEvEl swiTcH
Back to Basics

45
detector must be water-cooled to bring the internal tempera-ture of the electronics down to the normal range.
There are three geometries that can be used in contin-uous gamma level measurement. The most common is a point source that is collimated to produce a right-trian-gle-shaped beam with the 90º angle at the top of the detec-tor. Next is a strip source that is characterized to produce a similar shaped beam, but with the apex of the triangle at the point detector (Figure 3). Third, there is the geometry of a strip source and a strip detector. This geometry is often used for highly precise level measurement on small diameter ves-sels or pieces of pipe, such as vertical risers.
In point level applications (Figure 4), the source produces a narrowly collimated conical beam that is aimed across the vessel at the point detector. In most point level applica-tions, the reason a gamma gauge is being used is because the inner walls of the vessel are subject to vibration, corro-sion, abrasion, or fouling or coating with material. Fly ash hoppers are classic examples of this kind of application. The energy activity of the source must be sized, so that the point level gauge continues to work correctly through a reasonable thickness of fouling or coating, perhaps as much as a couple of inches.
How to Measure a Tank of Tomato PasteLarry Fontes, maintenance and production supervisor at Ingomar Packing Co. (www.ingomarpacking.com) in Los Banos, Calif., uses a gamma level gauge on a very difficult food industry application. “We were using a dual remote di-aphragm seal system with chemical T diaphragm seals and a 4-20 mA DC HART transmitter to control a valve, which would control the level in a holding tank,” Fontes says. “The holding tank is 38 in. (nominal 1 m) in diameter and about 30 ft (9.1 m) tall. The product inside the tank is tomato paste with a specific gravity of about 1.134 at 210 ºF to 215 ºF (a little over 100 ºC) at a flow rate of approximately 250 gallons per minute.”
“After a 100-day processing season,” Fontes continues, “the diaphragm seals would become coated due to the tem-perature of the product, and the level indication would begin to drift as the diaphragm was unable to pick up the change in pressure as the level changed.”
Fontes reports that the problem became so severe that product spilled out the vent on top of the tank, while the transmitter reported little or no change in percent level.
Fontes looked into other level technologies, including ra-dar. “I was looking for a level system that wouldn’t be af-fected by the properties of the product due to the thermal processing,” he says. “We had used a [gamma] device to measure soluble solids from Berthold Technologies, so I was somewhat familiar with the technology. Berthold worked with the consulting engineer we had contracted for the ex-pansion of our aseptic processing system. [Process Resource Inc.. www.processresource.com]
“Berthold provided onsite start-up and training for myself and several of our operators,” Fontes goes on. “The installa-tion was made much easier with the help of all the individu-als from Berthold. We operate the gauge under the general license in the Code of Federal Regulations.”
And how has it worked out? “Since the installation of the Berthold level gauge (Figure 5) in 2007,” Fontes reports, “we have had instances during a couple of processing seasons that would have resulted in the same issues as before. The dual diaphragm system level indication began to drift, while the gamma level gauge remained constant.”
Figure 4. A narrowly collimated conical beam is aimed across the
vessel at the point detector.
PoinT lEvEl swiTcH in a HoPPEr
Back to Basics

46
Fontes concludes, “The Berthold level gauge installa-tion was part of a $1.3 million expansion to the flash cooler, which is part of our aseptic processing.
The Business of Using Gamma Level GaugesSimilar to every other device that uses nuclear byproduct material, even the smoke detectors in your house, gamma level gauges are required to be licensed. This means that applications, paperwork and rules have to be known, un-derstood, followed and kept current. However, once you are set up to do this, licensing can be relatively simple and not too onerous.
“Many gamma level gauges can be distributed under the
general license in most states in the United States,” says Ber-thold Technologies’ radiation safety officer (RSO), Mark Morgan, “but the general license does not exist in other countries, and the U.S. NRC plans to do away with it in one to three years anyway, in favor of specific licensing. The NRC plans to make the specific license procedure simpler and more streamlined.”
The general license has less paperwork, but has restric-tions on gauge geometry, exposure levels, shielding, and other environmental health and safety issues. The other kind of license, used globally as well as in the United States is called a “specific license.” This means that you, as the gauge owner, are licensed to do several specific things with the gamma level gauge you own.
So what does this mean for operations and mainte-nance? Maintenance on the electronics, including the detector, can be done by any plant-qualified instrument tech or maintenance tech. No license is required by per-sons doing that level of maintenance. Since a gamma en-ergy source is basically a steel-jacketed lead box with a capsule the size of a horse-pill inside of it, maintenance on source housings is minimal. A trained, licensed per-son is required to change the geometry of the gauge or to move it.
And when you aren’t using it anymore, you are required to dispose of it properly—not just send it to a junkyard. Most manufacturers of gamma gauging instruments will accept a returned source, take title to it (so you and your management don’t have to keep track of it forever), and send you a document saying that you are no longer re-sponsible for it.
Knowing these simple rules in advance can mitigate man-agement’s reluctance to undertake a new regulatory duty.
So There You Have ItGamma level gauges are a good long-term solution to many of the most difficult level applications you will run into. They will operate with fewer maintenance headaches and, in some cases, operate where nothing else will.
wal t Boyes is a pr incipal wi th process measurement consul tancy spi t zer & Boyes.
Figure 5. During a 100-day processing season, the gamma level gauge
remained constant.
conTinuous lEvEl gaugE on TomaTo-fillED column
Back to Basics

47
f low measurement plays a critical role in chemical, petrochemical, oil and gas plants. Criticality of f low measurement in the plants has become a major compo-
nent in the overall economic success or failure of given pro-cesses. Accurate flow measurements ensure the safety of the process and profits in plants. Better measurement can only be achieved by selecting the best/most suitable flow technol-ogy for each flow application. Sometimes the accuracy re-quired by the end users is the most significant factor for the specific application. The challenge is to find out the value of the product stream being measured, thus providing the most reliable and cost-effective solution to the end users. Instru-ment engineers should convince the end user to not install a flowmeter that is more expensive than the yearly value of the stream and the potential loss of money caused by inac-curacies.
A diverse range of flowmeters, along with the turndown factors, is available for various flow applications, such as regular flow control (steam, gas, utilities, etc), process flow rates, fiscal or custody-transfer metering, and others. Most of these applications will be unidirectional, but some will be bidirectional.
The measurement of unidirectional flow rate is possible with all types of flow technologies, but the bidirectional flow measurement capability is required to measure the flow rates within the same flow loop in opposite directions. This sometimes creates difficult situations, challenges, process interruptions and/or measurement inaccuracies that can sig-nificantly affect the production and profitability of the plant.
We will further discuss the selection of the appropriate metering for bidirectional situations and applications, lim-itations, advantages and disadvantages, maintenance and in-stallation costs.
Bidirectional Flow MeasurementBidirectional f low lines are not very common in refin-eries and petrochemical plants, but if they are needed, they are always difficult. For bidirectional f low, the pip-ing scheme uses the same line to accomplish delivery and/or control functions for f lows moving in opposite di-rections (forward or reverse f low), depending upon the process conditions and objectives.
Examples of bidirectional f low are• Raw water feed to two or more water treatment plants,• Bidirectional steam lines supplying steam from one
unit to another unit in the plant,• Utility and circulating pumping of dielectric f luid
into underground electrical cables in order to dissi-pate heat generated by high-voltage power lines,
• Gas injected or withdrawn from the gas storage field or reservoir,
• Purging and blanketing of nitrogen in plants, and• Chilled water plant decoupling headers.
Bidirectional Flow Measurement Using Volumetric Flowmeter OptionsThe selection process of bidirectional f low metering de-pends on application requirements, process demand, end-user accuracy requirements and physical design constraints of the f lowmeter itself. Various f lowmeters are available with bidirectional f low capabilities, such as DP transmitters with an orifice, the Venturi or wedge element, Coriolis, ultrasonic, vortex, pitot, turbine and magnetic f lowmeters.
Instances where a bidirectional f low measurement is required include
• Possibility of having two different f low rates in either
Bidirectional Flow MeasurementThe right flowmeter Is a balance between technical needs and cost-efficiency.
by Ruchika Kalyani
Back to Basics

48
direction, due to the process and design conditions, and both f lows need to be measured,
• Reverse-f low accuracy is required by end user or by the process,
• The need to measure reverse f low in the process,• Bidirectional f low measurement using dual DP
transmitter options.For bidirectional f low measurement between two pro-
cess units in a process plant, for example, when two steam units are linked to each other, at the time of deficiency of steam in one unit, the other unit will supply the required steam to the deficient unit and vice versa. If reverse and forward f low rates are identical in both directions, and precise accuracy is not required, then dual transmitters, one for each f low direction, are the best solution for mea-suring the steam f lows in/out of the plant. Two DP trans-mitters with an orifice plate, along with temperature compensation, can be used for the bidirectional f low. In this case, a non-beveled, square-edge type orifice plate should be used, and the two edges of the orifice should comply with specifications for the upstream edge men-tioned in the ISO 5167 standard. It’s also necessary to make sure of the full “upstream” straight lengths on both sides of the f low instrument. This must be clearly com-municated to the piping design team during design re-views and before construction begins.
With this combination, do not expect high accuracy and turndown. This combination will provide the lowest installed cost with acceptable accuracy, as it is easy to maintain and replace. Also, this dual transmitter combi-nation option will be ideal in cases where the transmitter will experience reverse f low once every four or five years for a four- or five-day period.
Bidirectional Flow Measurement with a Single DP TransmitterA single DP f low transmitter coupled to a primary element option, such as the special orifice plate mentioned above, can
also be adopted for cheap reverse-f low measurement. This arrangement will cut down the expense of installing an-other (second) DP transmitter, orifice plate, additional hardware, meter installation requirements and the com-plexity of signal switching.
The square root function is complicated by the one-transmitter option because reconfiguration of the transmitter signal (4-12 mA and 12-20 mA) requires added function blocks and, subsequently, corresponding function blocks or logic at the distributed control system (DCS) side.
In cases where it’s only a matter of knowing the re-verse f low direction, and accuracy is not important, then the existing DP set without configuration can be used. At zero f low, 4mA is shown, and an output less than 4 mA can be used to alarm for reverse f low even when the square root function is on.
With newer, smarter f lowmeter techniques, transmit-ters are equipped with a feature that allows reconfigura-tion of the DP transmitter range, such as split-range out-put signal (4-20 mA) to the system side (DCS, PLC). The bidirectional function, such as square root functions, can be directly applied to the transmitter by either installing special bidirectionality software at the control system side, or by using the built-in capability of the f lowmeter to be used in both forward and reverse f low directions.
With equal or unequal f low rates, f low direction will be indicated as the output value (4-12mA = Reverse and 12-20 mA = Forward). With equal f lows, zero f low point is established based on the DP range of forward and re-verse f low, and for unequal f low rates, zero f low point will be a calculated value.
Bidirectional Flow Measurement with Vortex FlowmetersThe other option of two vortex flowmeters can also be used for steam bidirectional flow if higher accuracy is re-quired than can be achieved using the orifice solution.
Back to Basics

49
However, this application is limited to smaller line sizes because vortex meters are more economical up to 4-in. (100-mm) pipe size. Beyond this size, orifice plates are more economical. In addition, the selection of a vor-tex-shedding flowmeter may increase the maintenance and installation cost.
Wherever higher accuracy is required, vortex f lowme-ters are not a good option, as vortices shed by both bluff bodies propagate really far beyond the pipe and may af-fect the other meters’ readings. Another drawback is that the straight pipe run distance required between two vor-tex meters is unpredictable. For example, in the case of no obstructions, the meter required the run of 10 D (di-ameters) to 15 D, and if there is a control valve in either direction, the meter may require a higher run of 25 D to 30 D or even more. In comparison to the options of dual transmitters for bidirectional f low measurement between the two process units, DP f low measurement may be the most cost-effective solution.
Bidirectional Flow Measurement with Turbine and Magnetic FlowmetersBidirectional f low measurement is always a challenge when there are changes in process parameters, such as viscosity, conductivity, etc. It is always worth keeping these specific situations in mind while selecting any f lowmeter technology, but with bidirectional f lowmeter applications, it is especially important. DP type meters are usually not really well-suited to handle these process parameter variations.
Again, an example is utility pumping and circulat-ing plants pumping dielectric f luid into underground electrical cables in order to dissipate heat generated by high-voltage power lines. This application requires f low rate monitoring upstream and downstream because it involves dielectric f luid; therefore, it requires viscosity compensation as the temperature of the dielectric f luid
changes. In this application, turbine f lowmeters can pro-vide the solution for bidirectional f low measurement with moderate accuracy. However, drawbacks associated with this technology include a poor response of the f low-meter at low f lows due to bearing friction; lack of suit-ability for high-viscosity f luids because the high friction of the f luid causes excessive losses; as well as the require-ment for regular maintenance and calibration to main-tain its accuracy.
The magnetic f lowmeter can also be used for bidirec-tional f low measurement. It has the advantages of no pressure drop, linear output, short inlet/outlet pipe runs (five diameters upstream of the electrode plane and two diameters downstream), and good turndown. Magnetic f lowmeters are relatively expensive and are mainly lim-ited to conductive f luid applications, such as acids, bases and slurries, as well as water. A pre-requisite for this type of f lowmeter is that the f luid is electrically conductive with an absolute minimum conductivity of 2-5 µSiemens.
Bidirectional Gas Flow Measurement with Ultrasonic FlowmetersAt gas storage fields or natural gas reservoirs, accurate gas f low measurements are required for tasks such as in-jection and withdrawal of gas from these reservoirs. Res-ervoirs are used as buffers between suppliers and con-sumers. In order to maintain the balance for the entire reservoir, it’s necessary to monitor bidirectional f low at the wellhead.
For this purpose, conventional DP f lowmeters with an orifice are far from a suitable solution, as they lack ac-curacy and reliability. Orifice plates are subject to wear and tear. Secondly, regular inspections and maintenance are required. While measuring the dirty gas, the pressure taps of the orifice plates are particularly exposed to clog-ging due to the solid particles which may be present in the dirty gas. These will definitely distort the accuracy of measurement.
Back to Basics

50
In these cases, an ultrasonic f lowmeter may be a far better solution because this type of f lowmeter has no pressure drop, no f low blockage, no moving parts, and is suitable for high-volume bidirectional f low and also for low-f low measurements where other types of f lowmeters do not provide the required results.
The advantage of using the clamp-on gas f lowmeter transducer on the outside of the pipe is that it doesn’t require any pipe work or any kind of process interrup-tion. With this type of f lowmeter even a little moisture content present in the gas can’t significantly affect the measurement.
The reliability, negligible maintenance with highest accuracy and long-term cost of ownership are the major benefits of this technology.
Bidirectional Flow Measurement with Coriolis Mass FlowmetersIn the process industries, Coriolis technology has set the standard for f low and density measurements. This tech-nology is used for various applications, such as mass bal-ance, monitoring of f luid density and custody transfer, but also to reduce maintenance, and for bidirectional f low measurements.
In refineries, there are bidirectional applications, such as import and export of product, product transfer to stor-age and to petrochemical plants, and where the accurate measurement is more important than cost.
Coriolis mass f lowmeters can be used for accurate and reliable measurements of all streams in and out of the plant. This is critical for accounting and profitability. End users should take into account that inaccurate mea-surements sometimes may cause them to give away more product than they are being paid for. This can result in a significant loss of profit.
Conpared to the traditional use of volumetric f low technology for bidirectional measurements, the use of Coriolis mass f lowmeters eliminates various well-known
drawbacks of volumetric technologies, such as the re-quirement for significant upstream and downstream straight piping length and the reduction of potential er-rors that occur in compensation for temperature, pres-sure, viscosity or specific gravity. The Coriolis mass f low-meter technology does not require that compensation.
Coriolis meters measure mass f low. They do have their own inaccuracies, but these tend to be low relative to other types of f lowmeters. The turndown of Coriolis me-ters is high compared to other types of f lowmeters. An-other advantage is that no recalibration is required when switching f luids or for changing process conditions.
Purchase Price vs. Cost of OwnershipIt’s important for control system engineers to evaluate ac-curacy required for applications before selecting any bi-directional f lowmeter technology, as more accurate and precise f low measurement often results in higher cost of the f lowmeter.
The control system engineer must understand that price is always the consideration. However, there are some important distinctions to be made in terms of price. A f lowmeter can have a low purchase price, but can be very expensive to maintain. Alternatively, a f low-meter can have a high purchase price, but will require very little maintenance. In these cases, the lower pur-chase price may not be the best bargain. Other compo-nents of price include the cost of installation, the cost of associated software, the cost of training people to use the f lowmeter, the cost of maintaining the meter, and the cost of maintaining an inventory of any needed replace-ment parts. All these costs should be taken into account when deciding what f lowmeter to buy. This should be the one reason for many users to look beyond purchase price when considering f lowmeter costs.
ruchika Kalyani is a control system engineer at fluor Daniel india Pvt ltd.
Back to Basics

51
Back to Basics: Ultrasonic Continuous Level MeasurementUltrasonic level is one of the five non-contacting continuous level measurement technologies,
and the one that is most often misused or misapplied. Here’s how to do it right.
by Walt Boyes
T he five non-contacting level measurement technolo-gies are radar, nuclear, laser, weight and ultrasonic. Each of them has both good points and bad. Radar, for
example, is relatively expensive in the more accurate ver-sions (frequency-modulated, continuous-wave, FMCW), while nuclear level is limited to relatively small vessels, and there are licensing and safety considerations. Lasers appear to have developed an application niche, especially in the measurement of bulk solids and powders. Weighing systems can be used in some vessels, but it is, again, a rel-atively niched application solution. Of all of these, ultra-sonic level measurement is the most widely used non-con-tact technology. Ultrasonic level transmitters are used in most industries and are very widely used in open-channel flow measurement systems, sited atop a flume or weir.
How Does It Work?Ultrasonic level sensors work by the “time of flight” princi-ple using the speed of sound. The sensor emits a high-fre-quency pulse, generally in the 20 kHz to 200 kHz range, and then listens for the echo. The pulse is transmitted in a cone, usually about 6° at the apex. The pulse impacts the level surface and is reflected back to the sensor, now acting as a receiver (Figure 1), and then to the transmitter for sig-nal processing.
Basically, the transmitter divides the time between the pulse and its echo by two, and that is the distance to the surface of the material. The transmitter is designed to lis-ten to the highest amplitude return pulse (the echo) and mask out all the other ultrasonic signals in the vessel.
Because of the high amplitude of the pulse, the sensor physically vibrates or “rings.” Visualize a motionless bell struck by a hammer. A distance of roughly 12 in. to 18 in.
Figure 1. The sensor sends pulses toward the surface and receives
echoes pulses back.
Signal echoesfrom surface
6° cone beam
Cutaway mounting�angeBlanking
distance
ulTrasonic sEnsor
Back to Basics

52
(300 mm to 450 mm), called the “blanking distance” is de-signed to prevent spurious readings from sensor ringing. This is important for installation in areas where the dis-tance above the level surface is minimal.
Physical Installation IssuesThere are some important physical installation consider-ations with ultrasonic level sensors.
1. Make sure the materials of construction of the sensor housing and the face of the sensor are compatible with the material inside the vessel. Most ultrasonic sensor vendors provide a wide selection of sensor materials of construc-tion in case the standard sensor housing isn’t compatible. Most sensors come with a PVC or CPVC housing. PVDF, PTFE (Teflon) and PFA (Tefzel) are usually available. In some cases, a housing of aluminum or stainless steel with a polymer face can be provided.
2. Make sure that the operating temperature range of the sensor is not exceeded on either the high or low tempera-ture end. The materials of construction may deform or the piezoelectric crystal may change its frequency if the tem-perature range is exceeded. The change in ambient tem-perature is usually compensated, either by an embedded temperature sensor, a remotely mounted temperature sen-sor or a target of known distance that can be used to mea-sure the ambient temperature.
3. Locate the sensor so that the face of the sensor is ex-actly 90° to the surface of the material. This is especially important in liquid and slurry level measurement. In some bulk solids measurements, this can be modified (and this will be discussed in a later section of this article). If you do not do this, your echo will either be missed entirely by the sensor, or it will use an echo that is bouncing off the vessel wall or a vessel internal structure instead of the real level.
4. Make sure that the vessel internals do not impinge on the pulse signal cone from the sensor. If they do, you may get a spurious high amplitude echo that will swamp the real return echo from the surface of the material.
5. Make sure you avoid agitators and other rotating devices in the vessel. Sometimes you can do this with an additional waveguide. If you can’t, make sure you purchase a transmitter
that can compensate for the effects on the echo of the agitator blade moving in and out of the signal cone.
6. Mount your sensor where it can’t be coated by ma-terial or condensation inside the vessel. Coatings attenu-ate the signal, sometimes so much that there is no longer enough power to get through the coating to the surface and back. If it isn’t possible to avoid coatings, try to provide some means of cleaning the sensor face. Some transmitters provide a signal “figure of merit” that can be used to de-tect coatings or other signal failures and activate an alarm function.
7. Always use the vendor-supplied mounting hardware for the sensor. Hard-conduit-wiring an ultrasonic sensor can increase the acoustic ringing and make the signal unusable.
Figure 2. Sometimes the measured value is “what the level would be if
the agitator were turned off.”
Motor drivenagitator
Vortex fromagitator
insTallaTion issuEs
Back to Basics
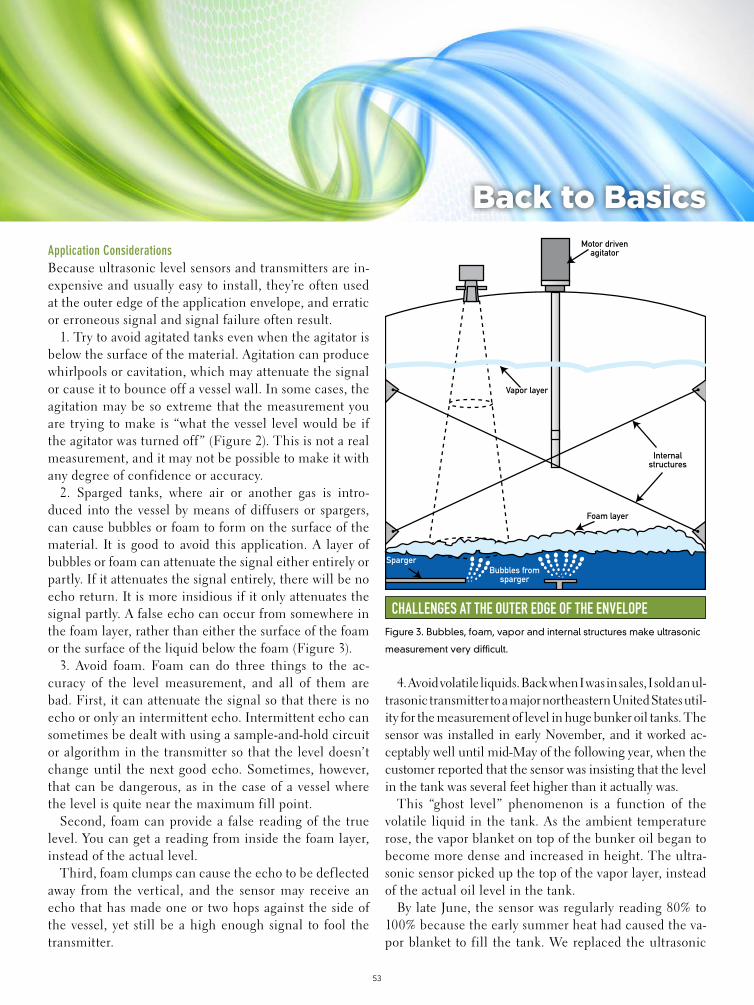
53
Application ConsiderationsBecause ultrasonic level sensors and transmitters are in-expensive and usually easy to install, they’re often used at the outer edge of the application envelope, and erratic or erroneous signal and signal failure often result.
1. Try to avoid agitated tanks even when the agitator is below the surface of the material. Agitation can produce whirlpools or cavitation, which may attenuate the signal or cause it to bounce off a vessel wall. In some cases, the agitation may be so extreme that the measurement you are trying to make is “what the vessel level would be if the agitator was turned off ” (Figure 2). This is not a real measurement, and it may not be possible to make it with any degree of confidence or accuracy.
2. Sparged tanks, where air or another gas is intro-duced into the vessel by means of diffusers or spargers, can cause bubbles or foam to form on the surface of the material. It is good to avoid this application. A layer of bubbles or foam can attenuate the signal either entirely or partly. If it attenuates the signal entirely, there will be no echo return. It is more insidious if it only attenuates the signal partly. A false echo can occur from somewhere in the foam layer, rather than either the surface of the foam or the surface of the liquid below the foam (Figure 3).
3. Avoid foam. Foam can do three things to the ac-curacy of the level measurement, and all of them are bad. First, it can attenuate the signal so that there is no echo or only an intermittent echo. Intermittent echo can sometimes be dealt with using a sample-and-hold circuit or algorithm in the transmitter so that the level doesn’t change until the next good echo. Sometimes, however, that can be dangerous, as in the case of a vessel where the level is quite near the maximum fill point.
Second, foam can provide a false reading of the true level. You can get a reading from inside the foam layer, instead of the actual level.
Third, foam clumps can cause the echo to be def lected away from the vertical, and the sensor may receive an echo that has made one or two hops against the side of the vessel, yet still be a high enough signal to fool the transmitter.
4. Avoid volatile liquids. Back when I was in sales, I sold an ul-trasonic transmitter to a major northeastern United States util-ity for the measurement of level in huge bunker oil tanks. The sensor was installed in early November, and it worked ac-ceptably well until mid-May of the following year, when the customer reported that the sensor was insisting that the level in the tank was several feet higher than it actually was.
This “ghost level” phenomenon is a function of the volatile liquid in the tank. As the ambient temperature rose, the vapor blanket on top of the bunker oil began to become more dense and increased in height. The ultra-sonic sensor picked up the top of the vapor layer, instead of the actual oil level in the tank.
By late June, the sensor was regularly reading 80% to 100% because the early summer heat had caused the va-por blanket to fill the tank. We replaced the ultrasonic
Figure 3. Bubbles, foam, vapor and internal structures make ultrasonic
measurement very difficult.
Motor drivenagitator
Vapor layer
Internalstructures
Foam layer
SpargerBubbles from
sparger
cHallEngEs aT THE ouTEr EDgE of THE EnvEloPE
Back to Basics

54
sensor with a FMCW radar sensor, which worked cor-rectly, and I learned something.
5. In solids and powders, you may have to aim the sensor at a point that is not 90 degrees to the level surface (perpendic-ular to the vertical axis of the vessel). You may want to aim the sensor because of rat-holing and angle-of-repose issues at the top, midpoint or bottom of the angle of repose. Try to have the transmitter calculate what the actual level might be. At least one vendor has developed a multiple sensor ar-ray that can scan the angle of repose and determine what the actual filled volume of the vessel is.
6. Avoid pressurized tanks. The speed of sound changes with temperature and density, and pressurizing the vapor space above the level can affect the density of the vapor space and, therefore, the speed of sound.
Ultrasonic Open-Channel FlowmetersOne of the most important applications for ultrasonic level sensors and transmitters is measuring open-chan-nel f low (Figure 4).
Most of the same caveats apply to ultrasonic level sen-sors used as f lowmeters as apply to ultrasonic level sen-sors used as tank level measurement devices. There are a few more:
1. Avoid wind and sun. Wind can blow through the va-por space and attenuate the signal or blow it off course. Sun can raise the temperature of the sensor housing it-self beyond the operating temperature range of the de-vice—and higher than the ambient temperature.
2. Make sure that there isn’t foam on the surface. This can happen often in nitrifying wastewater discharges.
3. Make sure that there is not too much turbulence or ripples (or if the f lume or weir is large enough, wave ac-tion) on the surface.
4. Above all, make sure that the f lume or weir is in-stalled correctly. Many problems blamed on the ultra-sonic transmitter are actually problems that are caused by the f lume not being installed level both horizontally and vertically, as well as front to back through the mea-surement zone.
5. Make provisions to keep ice from forming on the sensor
in the winter or dripping condensation in the summer.
The One-Trick Pony—Not!Ultrasonic sensors are simple to understand, easy to in-stall and inexpensive. It’s easy to go to them as the un-thinking sensor of choice for level applications, just as many people go to differential pressure level sensors. Yet, as many users have found, ultrasonic sensors and trans-mitters are tricky beasts. As with any other field instru-ment, applying an ultrasonic level sensor too far outside the manufacturer’s recommended application envelope is destined to fail, and sometimes fail spectacularly. But, if you follow these basic guidelines, you will have suc-cessful ultrasonic level installations.
wal t Boyes is a pr incipal wi th process measurement consul tancy spi t zer & Boyes.
Figure 4. The level sensor works exactly the same way—measures
level. The primary device (flume or weir) measures flow. The flow
transmitter takes the level signal and produces a flow value based on
the primary device.
6° beamParshall �ume (typ.)
Channel
Flowtransmitter
134.56
oPEn-cHannEl flow
Back to Basics

55
Stick It!Insertion flowmeters come in many varieties, but they all share
similar characteristics and problems.
by Walt Boyes
y ou can get f lowmeters in insertion versions that are paddlewheel, propeller, turbine, magnetic, vortex and differential pressure sensors. Insertion f lowme-
ters are popular in many industries, because they appear to be easy to install, inexpensive, and come in technol-ogy variations that mimic full-pipe meters.
But with no exceptions, insertion f lowmeters are not the same as their full-pipe counterparts. In fact, there is some evidence for David W. Spitzer’s claim in his book Industrial Flow Measurement that insertion f lowmeters are a type all their own.
How Does This Work? In Figure 1, you see turbulent f low and laminar f low. These are based on the concept of the Reynolds num-ber, which is a dimensionless number relating to the ra-tio of viscous to inertial forces in the pipe. Laminar f low, where the f low profile is straight and smooth, occurs at Reynolds numbers of less than about 2500. Turbulent f low, where there are eddies, vortices and swirls in the pipe, occurs above 4500 Reynolds numbers. Transitional f low, which is neither fully laminar nor fully turbulent, occurs between about 2500 and 4500 Reynolds num-bers. Laminar f low profiles are usually visualized as be-ing bullet-nosed, while turbulent f low profiles are seen as plug f lows.
Without getting too far into the math, f low studies have shown that in a pipe with a fully developed f low re-gime, either fully turbulent or fully laminar, the average velocity in the line can be found at a point somewhere between 1/8 and 1/10 of the way in from the side wall, depending on the f low study you read.
Insertion Paddlewheels, Propellers and TurbinesThere are three very similar types of insertion f lowme-ters that use a rotor that spins with the velocity of the f luid.
The first is a paddlewheel because the rotor is paral-lel to the centerline of the pipe, just like a paddlewheel steamboat. Paddlewheels range from very inexpensive to inexpensive, and are designed to be disposable. The least expensive use polymer bearings, which go out of round, and cause the rotor to wobble before the rotor shaft cuts through a bearing and goes downstream. The best use jeweled bearings and ceramic shafts, so they have much more longevity and less drag.
The spinning of the rotor is sensed by either a mag-netic pickup that generates a sine wave the frequency of which is proportional to velocity, or a Hall-effect sensor that generates a proportional square wave.
The advantage of the magnetic pickup is that it gen-erates the sine wave without additional power. The ad-vantage of the Hall- effect sensor is that it does not cause “stiction” (the momentary friction stop when the rotor sees the magnetic pickup’s magnet). Hall-effect sensors generally are able to read lower f low rates, and are more accurate at lower f low rates as well.
Paddlewheel f low sensors are designed to be easily in-serted into a small hole cut into the pipe using a custom fitting. Some paddlewheel sensors can be inserted into the pipe using a hot tap assembly, which allows the sen-sor to be inserted and retracted without shutting down the f low or relieving the pressure in the pipe.
Propeller meters use a prop shaped very much like an outboard motor’s propeller and are generally connected
Back to Basics

56
to a mechanical or electromechanical totalizer with a cable very much like a speedometer cable. Some more modern propeller meters use embedded magnets and ei-ther magnetic pickups or Hall-effect sensors.
Like paddlewheels, propeller meters have a pulse out-put that is proportional to the average velocity in the pipe. Because propeller meter rotors are large and lo-cated at the centerline of the pipe, they’re likely to be quite accurate, and even insertion propeller meters have been certified for billing purposes for decades.
Propeller meters, because their prop is significantly larger than a paddlewheel, are inserted using a f lange that mounts into the upright member of a tee fitting.
Turbine meters come in both electronic and electrome-chanical styles, but the only insertion turbine f lowmeters are electronic. They, like paddlewheels, use either a mag pickup or a Hall-effect sensor to produce an output pulse that’s proportional to the velocity of the f luid. Like pad-dlewheels, they must be inserted to the “average velocity point, which exists somewhere between 1/8 and 1/10 of the inside diameter away from the pipe wall.
Most insertion turbine meters have very small rotors, so they can be inserted through a small-diameter fitting or through a small diameter, hot tap assembly. Some-times, especially in the municipal water industry, this is called a “corporation cock assembly,” but it is essentially the same thing—a way of inserting a probe through a valve and still maintaining the pressure in the pipe with-out leaks.
Propeller meters are almost always used for water service, either in potable water systems or in irrigation systems.
Paddlewheels and insertion turbines can be used in a variety of applications, with materials of construction varying based on the requirements of the applications, such as acids, bases, and hot or cold f luids.
Electronic paddlewheels and turbines can be set up to be bidirectional, using quadrature detectors, which en-able the signal to indicate either forward or reverse f low, as well as f low rate. These are often used in HVAC appli-cations where chill water and hot water f low through the
same lines depending on the season.The signal from the paddlewheel or turbine or elec-
tronic propeller meter is sent to a transmitter, which uses the pulse (or frequency) output to display f low rate and to increment a totalizer (usually electronic). These trans-mitters generally have a pulse output, an analog output (usually 4-20 mADC), and often have one or two pro-grammable relay contact closure outputs. These can be used as f low alarms, as diagnostic alarms or as a rudi-mentary, dead-band controller.
Insertion dP FlowmetersThe most commonly used f low sensor in the world is the differential pressure transmitter connected to a pri-mary device, such as an orifice plate or Venturi tube. In its insertion incarnation, the differential pressure sensor is connected to a pitot tube inserted in the f low stream,
Figure 1. Turbulent flow from 4500+ Rn. Laminar flow from 0 to 2500 Rn.
Laminar Flow
Turbulent Flow
fully DEvEloPED flow
Back to Basics

57
and just as a pitot tube measures velocity on the outside hull of an aircraft, it measures the velocity in the f luid f lowing in the pipe.
These devices must also be inserted to the “average velocity point,” which is assumed to be somewhere be-tween 1/8 and 1/10 of the diameter of the pipe inbound from the pipe wall. If the average velocity point is not calculated correctly, the single point pitot tube meter will not be accurate.
Several companies now manufacture multiple-point pi-tot sensors. These sensors are mounted perpendicular to the diameter of the pipe, from one side wall to the other, and have several pitot ports located along their length.
The way these multi-point sensors work is that the dif-ferential pressure sensed is the average of all the differ-entials across the pipe—producing an output signal that very closely corresponds to the average velocity in the pipe. This way, the sensor is connected to a standard dif-ferential pressure transmitter, not several of them.
Multiple-port pitot tube f lowmeters can be calibrated to take very disturbed f low profiles, such as that in a 90° elbow, into account, and can, therefore, be used in loca-tions where no other f lowmeter can be used.
Insertion Mag MetersInsertion magnetic f lowmeters are not the same as spool-piece magnetic f lowmeters, even though they share the operation of Faraday’s law. In a spool-piece magnetic f lowmeter, the design geometry of the coils and the elec-trodes cause the signal output on the electrodes to be directly proportional to the average velocity in the pipe. Insertion mag meters use the same concept of “average velocity point” as the insertion paddlewheel does, and are about as accurate. Where a spool-piece magnetic f lowmeter can reliably be assumed to be close to 0.5% of rate accuracy, an insertion mag meter can often be 10% or 15% of rate, or worse.
Insertion mag meters have a great advantage over other insertion types: They have no moving parts, and are usu-ally highly resistant to acids, bases and abrasives.
Insertion Vortex and Target MetersInsertion vortex-shedding flowmeters have their proponents. These devices have accuracies similar to insertion turbine sensors, but have fewer moving parts and no rotor. This makes them the clear favorite from a maintenance point of view.
Design and Specifcation If you can use a spool-piece flowmeter for your application, do it. They are inherently more accurate and have volumet-ric calibrations instead of just velocity calibrations. Gener-ally, you will use insertion flowmeters where you can’t use a spool-piece, either for safety or expense reasons. Insertion paddlewheel flowmeters are often used in industrial water treatment applications and for driving chemical feed sys-tems. Even the multiple-port pitot tube flowmeters are less inherently accurate or repeatable than a spool-piece flowme-ter, regardless of technology.
Accuracy and CalibrationThe accuracy problem with insertion flowmeters is that they’re inserted into an uncalibrated spool section of pipe or even an elbow. The “average velocity point” theory is de-pendent on a fully developed flow profile with no swirling or distortion.
It’s almost certain that insertion meters will not be “accu-rate,” but they can be quite repeatable, which, in a flow con-trol loop application may be all you really need.
When you design an application for an insertion meter, you need to be much more careful of piping issues than if you were using a calibrated spool-piece meter. Be aware that the accuracy is going to be substantially less than you can get otherwise. The reason to use an insertion meter is nearly always that it was not designed into the piping originally, or it is being used as a low-cost sensor or a low-cost replace-ment for an original meter.
For these applications, the insertion flowmeter can be a useful tool in the design engineer’s tool bag.
wal t Boyes is a pr incipal wi th process measurement consul tancy spi t zer & Boyes. .
[Extended version at www.controlglobal.com/1310_flow]
Back to Basics

58
we have talked in this magazine about what I call the level measurement continuum before. Basi-cally, there are level measurement applications
that are very easy to do, and any level measurement de-vice will work. There are also level measurement applica-tions which are simply too hard to do with current tech-nologies.
Between easy and too hard to do, lay all the level mea-surement applications that require increasingly complex and costly measurement devices (Figure 1). [Editor’s note: the chart detailing these level measurement concepts can be downloaded at www.controlglobal.com/wp_downloads/pdf/LevelContinuumChart_Ronan100709.pdf.]
One of the “Okay to Use” bars in the chart that goes furthest toward “Too Hard to Do” is radar level measure-ment. It is one of the three measurement principles that can do the “really difficult” applications: radar, laser and nuclear level gauges. It is the one of the three with the widest applicability, and one of the most affordable mea-surement principles.
Radar level measurement is basically divided into two groups, free-air and guided-wave. In free-air radar mea-surement (Figure 2), a signal is sent from a non-contact-ing device and received back at the device. Using either transit time or frequency modulation techniques, the dis-tance from the device to the level is derived, and used to calculate the level of the liquid or solid being measured.
Free-air radar works much better than ultrasonic level gauges and is significantly less costly than nuclear level gauges or laser level devices. It’s substantially immune to vapor blanket variation in the vessel, to steam, dust and
foam in the vessel, and can be easily removed for cleaning and calibration.
Free-air radar solves many of the problems of difficult level measurement applications. You’re able to mount the device in many existing vessels using an existing connec-tion, which is normally 4 in. to 12 in. Vessel nozzles on many vessels are unused and available.
However, what happens if you have a vessel where there’s extreme agitation, vessel internals, granular ma-terials or extreme coating of the vessel side walls? These all reduce the ability of the radar level gauge to receive the return signal.
In the case of transit-time, free-air radar, signal loss can be total. The dielectric constant of the material be-ing measured matters too. If the dielectric is low and there are other issues, free-air radar may not work well, or it may not work at all.
For decades, we’ve been installing capacitance or RF admittance devices in tanks to measure level. These de-vices work very well—if they can be installed to miss in-ternal structures, have appropriate materials of construc-tion and the tank isn’t agitated much, if at all.
The physical design is well-suited for tank level mea-surement, and these devices can often be inserted through a tank nozzle much smaller than the ones nec-essary for free-air radar level measurement. The problem is that radar works on applications where capacitance or RF admittance devices do not.
Enter a technology called time domain ref lectometry (TDR). A probe, somewhat similar to an RF admittance probe in physical shape, is introduced into the vessel
The Lowdown on Radar Level MeasurementFree-air or guided-wave — which do you use when?
by Walt Boyes
Back to Basics

59
through a tank nozzle. Nozzles can be as small as 2 in. for this purpose. Generated pulses of microwave energy are transmitted down the probe. As soon as the energy pulse encounters a material, liquid or solid, that has a different dielectric constant from that of the vapor space in the vessel, a ref lection is generated, and a return pulse travels back up the probe. The transmitter’s circuitry cre-
ates the transmitted pulses, receives the ref lected pulses, and uses the time differential between them to calculate the distance from the probe to the surface of the level to be measured. The difference between that measured distance and the bottom of the vessel is the actual level in the vessel. (Figure 3 shows a typical TDR setup.) Be-cause the probe is used as a waveguide, the technology is
figurE 1: THE lEvEl mEasurEmEnT conTinuum
Back to Basics
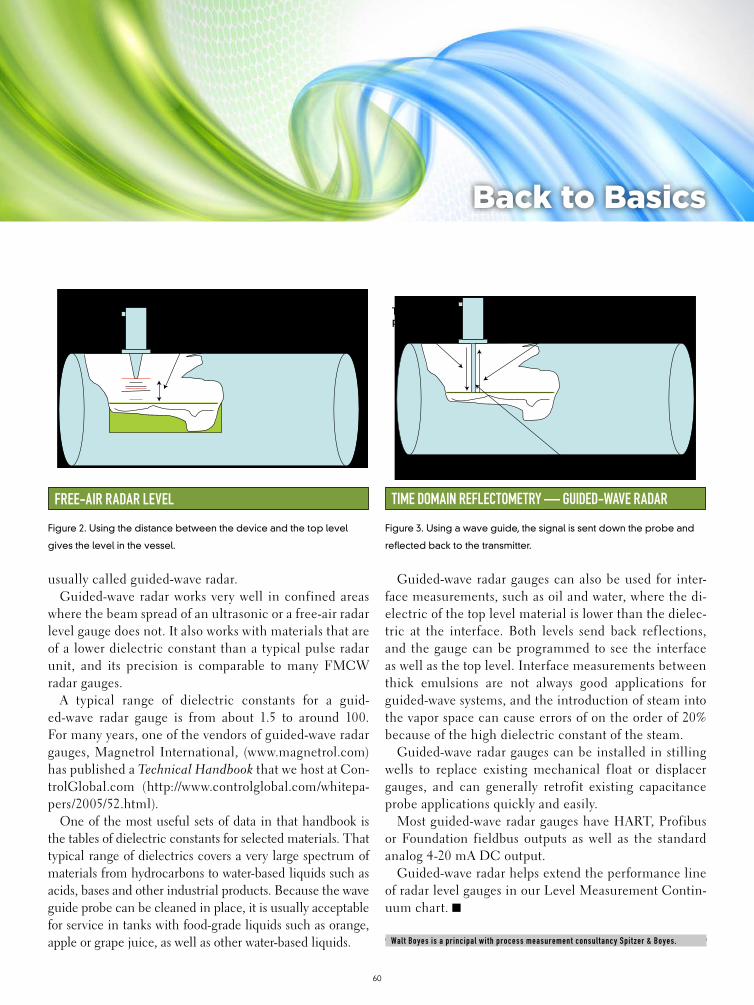
60
usually called guided-wave radar.Guided-wave radar works very well in confined areas
where the beam spread of an ultrasonic or a free-air radar level gauge does not. It also works with materials that are of a lower dielectric constant than a typical pulse radar unit, and its precision is comparable to many FMCW radar gauges.
A typical range of dielectric constants for a guid-ed-wave radar gauge is from about 1.5 to around 100. For many years, one of the vendors of guided-wave radar gauges, Magnetrol International, (www.magnetrol.com) has published a Technical Handbook that we host at Con-trolGlobal.com (http://www.controlglobal.com/whitepa-pers/2005/52.html).
One of the most useful sets of data in that handbook is the tables of dielectric constants for selected materials. That typical range of dielectrics covers a very large spectrum of materials from hydrocarbons to water-based liquids such as acids, bases and other industrial products. Because the wave guide probe can be cleaned in place, it is usually acceptable for service in tanks with food-grade liquids such as orange, apple or grape juice, as well as other water-based liquids.
Guided-wave radar gauges can also be used for inter-face measurements, such as oil and water, where the di-electric of the top level material is lower than the dielec-tric at the interface. Both levels send back ref lections, and the gauge can be programmed to see the interface as well as the top level. Interface measurements between thick emulsions are not always good applications for guided-wave systems, and the introduction of steam into the vapor space can cause errors of on the order of 20% because of the high dielectric constant of the steam.
Guided-wave radar gauges can be installed in stilling wells to replace existing mechanical f loat or displacer gauges, and can generally retrofit existing capacitance probe applications quickly and easily.
Most guided-wave radar gauges have HART, Profibus or Foundation fieldbus outputs as well as the standard analog 4-20 mA DC output.
Guided-wave radar helps extend the performance line of radar level gauges in our Level Measurement Contin-uum chart.
wal t Boyes is a pr incipal wi th process measurement consul tancy spi t zer & Boyes.
Figure 2. Using the distance between the device and the top level
gives the level in the vessel.
frEE-air raDar lEvEl
Signal Path Through Free Air
Figure 3. Using a wave guide, the signal is sent down the probe and
reflected back to the transmitter.
TimE Domain rEflEcTomETry — guiDED-wavE raDar
Wave guide
Transmittedpulses
Back to Basics

61
Saving Steam Saves MoneyMatt Brewing Co. reduced energy cost to brew beer by $230,000 per year using mass flow in-
strumentation.
by Rich Michaels
T he Matt Brewing Company is a family-owned business founded in 1888. We make the Saranac brand of spe-cialty products. Nick Matt and his nephew, Fred Matt,
currently head the management team at the brewery. Under the leadership of these third and fourth generations of the Matt family, the brewery continues to craft beer to the exact-ing standards set forth more than a century ago. The brewery currently makes up to 30 varieties of Saranac beer during the course of the year, with distribution to about 20 states.
The heart of a brewing operation is boiling the wort. Brew-ing starts with the addition of malted barley grain and water to the mash cooker. Mashing allows the enzymes in the malt to break down the starch in the grain into sugars, typically maltose, to create a malty, sugary solution. After mashing, the resulting solution flows to a filter press that separates out the grain. Matt Brewing Company sells the filtered grain byprod-uct to local farmers as animal feed.
From the filter press, the solution, now called wort, goes into one of two steam-heated, 500-bbl (15,000 gallon) ket-tles for boiling (Figure 1). One of the kettles boils the wort while the other is cleaned and prepared for the next cycle. A manually operated coil for steam at the bottom of the kettle preheats the wort.
The boiling operation continues for 90 minutes, evaporating about 5% to 10% of the solution. This operation, which includes the addition of the hops, sterilizes the wort and affects flavor, stability and consistency. The hops provide bitterness and fla-vor. Following wort boiling, the solution goes through a period in fermentation tanks and finally packaging in bottles and kegs.
Steam pressure management is crucial. Depending on the atmospheric pressure, we need to control the steam pres-sure to get more or less BTUs of heat into the kettle. A pound of steam represents a certain value of BTUs. Steam cost is one
of the most important energy variables Matt Brewing deals with. We were looking for a way to improve steam quality and reduce steam use. We consulted with R.L. Stone Co. (www.rl-stone.com), Syracuse, N.Y., on instrumentation to optimize the wort boiling operation.
The new instrument system measures and computes mass flow rates of steam to control heat for boiling the wort. As the wort temperature reaches the boiling point, the steam in the bottom preheat coil shuts off, and the recently installed automatic steam heating system takes over. From the steam header, the saturated steam flows through a control valve and an ABB Swirl flowmeter before reaching the kettle. (Figure 2)
The Swirl meter is a “vortex precessing” meter, somewhat akin to a vortex-shedding flowmeter, except that the Swirl meter has far better turndown at low flows and requires min-imal upstream and downstream straight pipe, compared to other flowmeter types. We selected this type of meter be-cause our piping geometry was tight, leaving very little
Boiling wort—–malt, grain and water—and steam are at the heart of
every batch of good beer.
technology in action

62
space for straight pipe to condition the steam flow (Figure 3). The Swirl meter contains a built-in inlet flow conditioner and outlet straightening vanes, which saved the expense of re-piping the brewhouse.
From the flowmeter, the saturated steam flows to the top of an internal boiler in the kettle called a calandria (Figure 4, p. 48). The calandria is a shell- and-tube heat exchanger. Wort rises through the tube bundle in the calandria while heated by the down-flowing steam, which begins to condense. A deflec-tor at the top of the calandria distributes the wort and prevents foam formation. The internal caldaria efficiently provides both heating and mixing of the wort.
When starting a batch, the operator dials data representing the volume of wort in the kettle into an ABB ControlMaster CM10 flow computer. (Figure 5, p. 48) This unit calculates the optimum mass flow rate of steam based on wort volume and feeds that rate to the ControlMaster CM30 single-loop
controller as a setpoint. The CM30 provides indication, re-cording, math functions and proportional/integral control of the steam mass flow.
The CM30s receive the steam mass flow rates from the Swirl meters and convert them to engineering units used in the brewing process. The CM30s compare the ac-tual versus desired flow rate, and develop a control sig-nal to maintain the predetermined setpoint. The 4-20 mA DC control signal goes to a set of ABB TZIDC intelligent electro-pneumatic positioners we installed on our existing Fisher control valves. An I/P (current to pneumatic) module within the TZIDC positioner precisely regulates air flow to pressurize and depressurize the valve while minimizing air consumption.
The displays for the CM30s indicate the desired steam mass flow rate (the control setpoint) based on the kettle volume, the measured steam mass flow rate in lbs/hr, and the percent control valve opening. The CM30 controller can also display
Figure 1. Wort, the basic beer solution, goes
into one of two steam-heated, 500-bbl kettles
for boiling.
coPPEr KETTlEs
Figure 2. This schematic shows the flow of saturated steam through a control valve and a Swirl
flowmeter.
Mash cooker
Wort Wort
To vent To ventFilter press
CM30
Steamout
Calandriaheat
exchangerSteam
inSteam
in
Preheatsteam
coilSwirlmeter
Swirlmeter
CM30CM10
Controlvalve
TZIDCpositioners
Boiler
CM10
THE EnginEEr’s guiDE To BrEwing
technology in action

63
steam flow rate trends. The CM10 dis-plays wort volume in the kettle dialed in by the operator.
Prior to the installation of the new instruments, we collected three months of data for the wort boiling operation. Measured and calculated variables included kettle volume, steam pressure and temperature, per-cent evaporation, and necessary water additions. We compared the data we collected to what we believed to be op-timum operating conditions and esti-mated possible savings.
Our savings have resulted from re-duced natural gas costs and water us-age. The new system for controlling steam pressure has generally reduced required steam pressures from 24 psi to 12 psi. The new system reduces steam use by approximately a third, depend-ing on the brew volume and the oper-ator. It also saves about 1200 gallons of water per brew cycle. We estimate the savings at approximately $630 per day (about $230,000 per year), and the pay-back time for the instrumentation proj-ect is about three to four months.
The results of the new control system are better quality and shelf life for our products with the added benefits of re-duced energy and water use. We’re con-sidering adding a system to automatically send a signal value for wort kettle vol-ume to the CM10 controller. This would eliminate manual entry errors. We’re also planning to add a system for reclaiming energy from plant wastewater to generate electricity for the plant.
rich michaels is brewing super v isor a t mat t Brewing company.
Figure 3. Matt chose the Swirl meter because its piping geometry left little room for straight-run
piping to condition the steam flow.
a TigHT squEEzE
Figure 4. The calandria, a type of heat
exchanger, both heats and mixes the
wort.
DouBlE DuTy
Figure 5. An operator sets the wort kettle volume
on a flow computer prior to batch start.
Dialing uP THE volumE
technology in action

64
Radar Technology for Level MeasurementPrecise knowledge of the grain level in UCML’s storage silos is essential to production. Radar
measurement is the key.
by Monte Smith
united Canadian Malt Ltd. (UCML) is Canada’s larg-est manufacturer of a wide variety of liquid and dry, diastatic and non-diastatic extracts of malted barley,
wheat, oats and rice. Our company was founded in Pe-terborough, Ontario in 1929, and since then has been a major international supplier of premier malt extracts and sweeteners for the food, pharmaceutical and brew-ing industries. Our customer base is extremely diverse, as customers use our ingredients in everything from ce-real, bread, biscuits and pastries to chocolate, pet food, vinegar, chewing gum, ice cream, and, of course, beer.
Malt extract is a vacuum-concentrated sweetener made from high-quality malted barley. United Canadian Malt manufactures approximately 300 different liquid extracts using a variety of grains and process parameters to pro-duce these natural, viscous sweeteners. In the food in-dustry, extracts are used in a variety of baked goods, as the fermentation process assistance improves structure, color and crust appearance. The additional advantage is malt extract’s ability to enhance these foods naturally with a unique, subtle and desirable f lavor.
UCML is a certified organic production facility of-fering liquid extracts and syrups made from a range of organically certified grains. In the pharmaceutical in-dustry, the distinct f lavor of both liquid and dried malt extracts is an effective vehicle for active substance ad-ministration. With its broad nourishment characteristics, malt offers an improvement over plain sugar syrups.
At our facility, the main ingredient, malted barley, is stored in two outdoor silos. From them, it is drawn, crushed and then blended with water to yield a slurry called “mash.” Precise quality control on temperature, time and specific water quantity allows the release of
nutritional components from the grain. During this pro-cess, the natural enzymes inherent in the malted barley convert the grain starches and proteins to soluble and di-gestible sweeteners and protein components. The resul-tant f luid, called “sweet wort,” is separated by filtration from the spent grains. The wort is then concentrated by evaporation to produce a viscous malt extract consisting of 80% solids material.
ChallengeBrewing production scheduling requires an accurate as-sessment of our primary ingredient—the malted barley, which is stored in UCML’s two 15-m (49.2-ft) steel silos. To do so, we need a very reliable, accurate and robust system to provide constant grain level information from our silos.
Figure 1. United Canadian Malt Ltd. manufactures extracts of malted
barley for the food industry.
wHErE iT HaPPEns
technology in action

65
Our previous weight and cable level measurement system and rotary paddle switches resulted in ongoing maintenance and reliability issues. Imagine removing caked-on grain dust from an inoperative spindle wheel atop a 15-m (49.2-ft) silo during a June rainstorm. Or bet-ter yet, reseating the control rope and winding motor in January’s frigid and icy weather.
When the electronics of the weight and cable system failed, we temporarily used a manual level control sys-tem. Time and safety issues were substantial cost and ef-ficiency factors, however, as workers had to climb the silo, open the hatch and check levels with a f lashlight. And, really, just how accurate is that f lashlight level check? Truthfully, the only benefit from all of this climbing to the top of the silos was the positive effect on the manag-er’s heart rate and his fresh air exposure!
All of this took place at UCML with malted barley grain arriving by rail car or truck every few days. Grain delivery was always a control headache, as the silo’s ca-pacity is much less than the more than 70 metric tons (MT) on a rail car. With the variable delivery schedules and the expense of rail car unloading demurrage time, it is crucial to have constantly accurate inventory level measurement. Precise inventory monitoring ensures that unloading from rail cars or trucks takes place within the allotted days, and without exceeding the silos’ capacity, since cleanup of spilled grain on surrounding streets is not easy. We also wanted the ability to coordinate the brewing usage of the grain discharged from the silos without shutting down production, as this would save both time and money.
UCML investigated several options for reporting silo grain levels. Load cells, a very accurate method, were too expensive to retrofit onto our existing silos. Repairing our weight and cable system’s electronics was also quite costly, considering its mechanical problems. An ideal system would have mechanically and electronically re-liable construction, and would be accurate over the full
length of the silo—especially the bottom cone discharge section. Such a solution would also have a remote read-out capability at some distance from the silo and capa-bility for a high- and low-level alarm shut-off option. Fi-nally, it must be able to handle the grain silo’s intense dust level during the filling cycle.
SolutionUnited Canadian Malt was already familiar with Siemens Industry’s level measurement transmitters in its manufac-turing process. UCML had previously installed a Sitrans
Figure 2. Sitrans LR460 (in background) and Sitrans LR560 (in fore-
ground) are measuring the level of malted barley at UCML. The com-
pact size of Sitrans LR560 makes it easy to carry to the top of the silo.
small, BuT accuraTE
technology in action

66
LG200 guided wave radar transmitter on a wort tank. Wort is a challenging substance to measure because of high tem-peratures and excessive steam and foam that are generated during the wort transfer process. The tank also requires a weekly chemical sanitation bath and a high-pressure water washdown, and there is little headroom, complicating the installation of any instrumentation. The installed Sitrans LG200 operates with a f lexible, single cable probe with a sanitary tri-clamp fitting. The transmitter is connected to a remote display at the oper-ator’s station to enable convenient remote monitoring. The LG200 performs consistently and accurately, despite at times working through a meter of foam and its accom-panying sticky residue. This unit has done so for several years, which imparts a great deal of confidence in the re-liability of Siemens’ instruments, both from our produc-tion and maintenance operators’ standpoints.
UCML’s first silo level control monitoring device was a Sitrans LR460 installed on the first of our two outdoor silos. It is connected to a remote display inside the build-ing. Sitrans LR460 is a non-contacting, 25-GHz frequen-cy-modulated continuous wave (FMCW) radar level transmitter, and it uses a four-wire connection (two for 115 VAC power supply and two for the mA output). After some fine-tuning of the signal, Sitrans LR460 provided reliable operation.
The Sitrans LR460 uses a 4-in. horn antenna with an 8° beam angle. Due to the center location of the Sitrans LR460, the transmitter was detecting the seams of the silo, which were tuned out via the process intelligence feature called “Auto-False-Echo-Suppression.” This pro-cess required the silo to be near empty. Once config-ured, Sitrans LR460 provided acceptable readings, ex-cept for the lower cone area.
With the success of the both the Sitrans LG200 and the Sitrans LR460 in mind, United Canadian Malt se-lected the new Sitrans LR560 for a solution for level mea-surement of the second silo. The stainless-steel housing
was readily adaptable to UCML’s preferred way of instal-lation on our silo inspection hatch, and its compact size made it easy to carry the transmitter to the top of the silo for the installation. From our electrician’s point of view, the unit’s two-wire configuration was also instrumental in saving installation work and wiring costs.
Figure 3. Sitrans LR560 has plug-and-play performance because of the
4° narrow beam and 78 GHz. Alternatively, the 8° wider beam of the
Sitrans LR460, requires fine-tuning to find the correct echo profile.
Two DEgrEEs of accuracy
technology in action

67
Sitrans LR560 uses a high frequency of 78 GHz and a unique lens antenna to provide a narrow 4° beam. The local display interface has an easy-to-use, graphical Quick Start Wizard that allowed operators to set up the Sitrans LR560 in a couple of minutes using the display pushbuttons. The ex-treme narrow beam of Sitrans LR560 provides plug-and-play performance, and no additional fine-tuning was required. The seams of the inside of the silo did not interfere with the level readings, and reliable readings are provided all the way to the bottom of the cone area.
Sitrans LR560 is available with HART, Profibus PA or Foundation fieldbus protocols. Programming can be per-formed remotely with Simatic PDM (process device man-ager), AMS or PACTware with Siemens’ DTM. The local display interface features a backlit display, and can be ro-tated in four positions. An integrated purge connection is readily available for self-cleaning of the antenna lens if the solids material is exceptionally sticky.The 78-GHz fre-quency creates a very short wavelength that provides excep-tional reflection from sloped surfaces and aiming is rarely necessary. An optional aiming flange is available to aim the antenna away from obstructions or towards the center of the discharge cone for reliable readings in the cone area.
BenefitsSince the Sitrans LR560 was installed, UCML’s opera-tors have noticed very stable readings from the transmit-ter, from completely empty to full. During filling, our operators simply keep an eye on the remote display, mon-itor the filling cycle and then shut the transfer system off if the level approaches the top of the silo. There has been zero maintenance on the Sitrans LR560 since its instal-lation, and no maintenance is expected.
UCML’s silo cleaning schedules have also benefitted from the Sitrans LR560’s compact design. Its low profile and lack of extended horn have meant a significantly eas-ier—and safer—cleaning process for the two workers who are on top of the silo performing the required operation.
The yearly maintenance cost associated with the previous mechanical level system has been eliminated. In fact, the cost of the new equipment was paid back well within the first year of its operation.
Overall, as the general manager at United Canadian Malt, I am very happy with all of the instruments we’re using from Siemens Industry. We have acceptable per-formance from the Sitrans LR460, and we were very sur-prised with the small size of the Sitrans LR560 and how much easier it was to install, set up and operate. Our op-erators know what is going on throughout our process, and we no longer have any overfilled silos or inaccurate readings from old technology.
monte smith is general manager at united canadian malt ltd.
Figure 4. The brewing process at United Canadian Malt Ltd.
How To maKE BEEr
technology in action

68
Ultrasonic Flowmeters Make Chiller Control EasierClamp-on flowmeters are reliable and easily replaceable for maximum uptime
by Kevin H. Evans
f or the Federal Aviation Administration (FAA), our most im-portant product is the safety of the traveling public. Every single thing we do is focused on this one goal. We oper-
ate facilities that allow modern levels of air transport to occur. One of our Air Route Traffic Control Center (ARTCC) in the southwestern United States handles approximately 5000+ com-mercial flights a day. Locally, our part of the team effort is to provide the environment that allows the rest of the team to not worry about anything outside of their responsibilities. Power, water, computer support, communications and air temperature are things that need to be present, but invisible to the personnel working the screens.
More specifically to my facility, thousands of different items from mainframe computers to multi-hundred-ton chill water refrigeration units must work in coordination with each other. Providing support to the rest of our team makes the facility’s task easier.
This coordinated effort is made possible by control automation. For the control au-tomation to work well, it needs to have in-formation, and, in part, this information is provided by flowmeters.
We have flowmeters on the water coming into facility, flowmeters on the natural gas that fires our boilers, flow-meters on our electricity, flowmeters on the air delivered throughout the ducts of the buildings, and flowmeters on the hot and cold water loops that move through-out the facility. We even have flowme-ters on the air vented from the buildings.
The heart of the ARTCC facility is the high-powered computers that manage
the flight control data. These aren’t desktop PCs, but main-frames that generate considerable heat and must be kept cool. The HVAC air handling system is an essential part of the fa-cilities I maintain.
Our main building depends on four chillers, each with a ca-pacity of 350 tons of cooling. For the hot loop, we have three boilers which can transfer 3.5 million BTUs of heat into the wa-ter flowing through the hot-side piping. Another system is our humidifiers. Flowmeters are essential to avoid damage from a system running dry or water overflowing into other equipment.
The system design called for many Controlotron ultrasonic transit-time clamp-on flowmeters, now maufactured by Sie-mens (www.industry.usa.siemens.com) that report directly to a distributed control system. These meters work especially well for us because they do not change the flow in the pipe where they are making their measurements.
The whole system depends on its flowmeters. The chiller and boiler control system must know how much hot and cold water is being used to create the discharge temperature supplied to the chill loop and the condenser. With-out this data, the machinery could have a sudden and catastrophic failure.
In all of these situations, the flowme-ters provide the information needed to control the system. Even if we are forced into manual operation, the flowmeters are responsible for giving the human operators the information they need to make the system work.
Our facility runs 24 hours a day, seven days a week, all year long. For heating and cooling purposes, this means two chillers
Figure 1. These meters are able to han-
dle hot and cold water and indicate
bidirectional flows.
mEasuring HoT & colD
technology in action
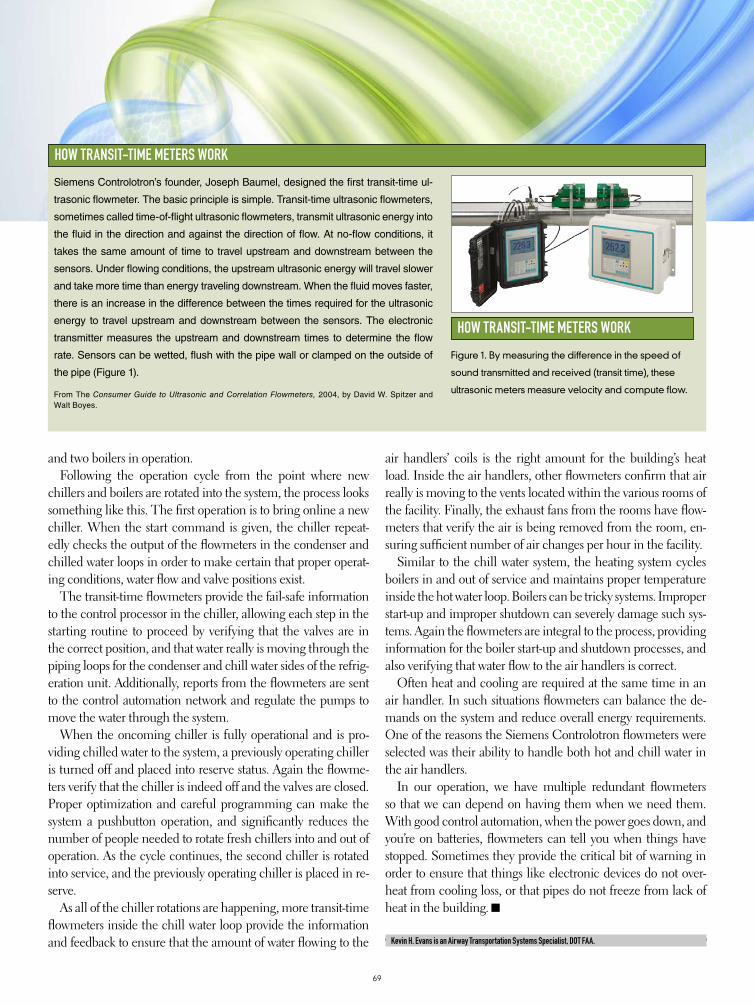
69
tech-
and two boilers in operation.Following the operation cycle from the point where new
chillers and boilers are rotated into the system, the process looks something like this. The first operation is to bring online a new chiller. When the start command is given, the chiller repeat-edly checks the output of the flowmeters in the condenser and chilled water loops in order to make certain that proper operat-ing conditions, water flow and valve positions exist.
The transit-time flowmeters provide the fail-safe information to the control processor in the chiller, allowing each step in the starting routine to proceed by verifying that the valves are in the correct position, and that water really is moving through the piping loops for the condenser and chill water sides of the refrig-eration unit. Additionally, reports from the flowmeters are sent to the control automation network and regulate the pumps to move the water through the system.
When the oncoming chiller is fully operational and is pro-viding chilled water to the system, a previously operating chiller is turned off and placed into reserve status. Again the flowme-ters verify that the chiller is indeed off and the valves are closed. Proper optimization and careful programming can make the system a pushbutton operation, and significantly reduces the number of people needed to rotate fresh chillers into and out of operation. As the cycle continues, the second chiller is rotated into service, and the previously operating chiller is placed in re-serve.
As all of the chiller rotations are happening, more transit-time flowmeters inside the chill water loop provide the information and feedback to ensure that the amount of water flowing to the
air handlers’ coils is the right amount for the building’s heat load. Inside the air handlers, other flowmeters confirm that air really is moving to the vents located within the various rooms of the facility. Finally, the exhaust fans from the rooms have flow-meters that verify the air is being removed from the room, en-suring sufficient number of air changes per hour in the facility.
Similar to the chill water system, the heating system cycles boilers in and out of service and maintains proper temperature inside the hot water loop. Boilers can be tricky systems. Improper start-up and improper shutdown can severely damage such sys-tems. Again the flowmeters are integral to the process, providing information for the boiler start-up and shutdown processes, and also verifying that water flow to the air handlers is correct.
Often heat and cooling are required at the same time in an air handler. In such situations flowmeters can balance the de-mands on the system and reduce overall energy requirements. One of the reasons the Siemens Controlotron flowmeters were selected was their ability to handle both hot and chill water in the air handlers.
In our operation, we have multiple redundant flowmeters so that we can depend on having them when we need them. With good control automation, when the power goes down, and you’re on batteries, flowmeters can tell you when things have stopped. Sometimes they provide the critical bit of warning in order to ensure that things like electronic devices do not over-heat from cooling loss, or that pipes do not freeze from lack of heat in the building.
Kevin H. Evans is an airway Transportation systems specialist, DoT faa.
Siemens Controlotron’s founder, Joseph Baumel, designed the first transit-time ul-
trasonic flowmeter. The basic principle is simple. Transit-time ultrasonic flowmeters,
sometimes called time-of-flight ultrasonic flowmeters, transmit ultrasonic energy into
the fluid in the direction and against the direction of flow. At no-flow conditions, it
takes the same amount of time to travel upstream and downstream between the
sensors. Under flowing conditions, the upstream ultrasonic energy will travel slower
and take more time than energy traveling downstream. When the fluid moves faster,
there is an increase in the difference between the times required for the ultrasonic
energy to travel upstream and downstream between the sensors. The electronic
transmitter measures the upstream and downstream times to determine the flow
rate. Sensors can be wetted, flush with the pipe wall or clamped on the outside of
the pipe (Figure 1).
From The Consumer Guide to Ultrasonic and Correlation Flowmeters, 2004, by David W. Spitzer and Walt Boyes.
Figure 1. By measuring the difference in the speed of
sound transmitted and received (transit time), these
ultrasonic meters measure velocity and compute flow.
How TransiT-TimE mETErs worK
How TransiT-TimE mETErs worK
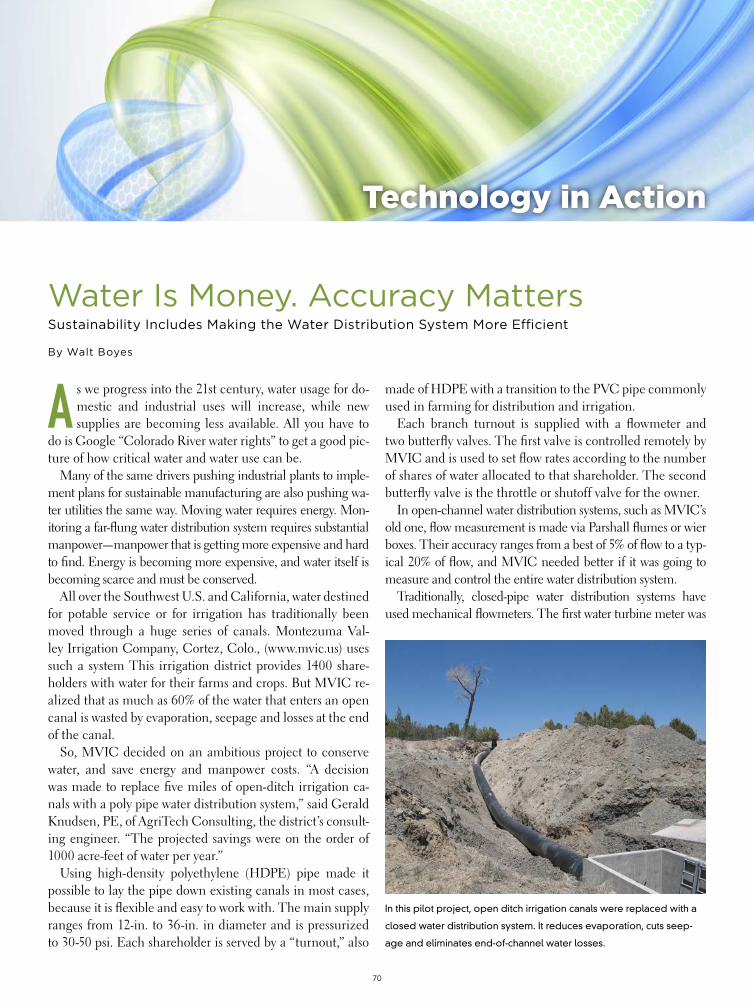
70
Water Is Money. Accuracy MattersSustainability Includes Making the Water Distribution System More Efficient
By Walt Boyes
a s we progress into the 21st century, water usage for do-mestic and industrial uses will increase, while new supplies are becoming less available. All you have to
do is Google “Colorado River water rights” to get a good pic-ture of how critical water and water use can be.
Many of the same drivers pushing industrial plants to imple-ment plans for sustainable manufacturing are also pushing wa-ter utilities the same way. Moving water requires energy. Mon-itoring a far-flung water distribution system requires substantial manpower—manpower that is getting more expensive and hard to find. Energy is becoming more expensive, and water itself is becoming scarce and must be conserved.
All over the Southwest U.S. and California, water destined for potable service or for irrigation has traditionally been moved through a huge series of canals. Montezuma Val-ley Irrigation Company, Cortez, Colo., (www.mvic.us) uses such a system This irrigation district provides 1400 share-holders with water for their farms and crops. But MVIC re-alized that as much as 60% of the water that enters an open canal is wasted by evaporation, seepage and losses at the end of the canal.
So, MVIC decided on an ambitious project to conserve water, and save energy and manpower costs. “A decision was made to replace five miles of open-ditch irrigation ca-nals with a poly pipe water distribution system,” said Gerald Knudsen, PE, of AgriTech Consulting, the district’s consult-ing engineer. “The projected savings were on the order of 1000 acre-feet of water per year.”
Using high-density polyethylene (HDPE) pipe made it possible to lay the pipe down existing canals in most cases, because it is flexible and easy to work with. The main supply ranges from 12-in. to 36-in. in diameter and is pressurized to 30-50 psi. Each shareholder is served by a “turnout,” also
made of HDPE with a transition to the PVC pipe commonly used in farming for distribution and irrigation.
Each branch turnout is supplied with a flowmeter and two butterfly valves. The first valve is controlled remotely by MVIC and is used to set flow rates according to the number of shares of water allocated to that shareholder. The second butterfly valve is the throttle or shutoff valve for the owner.
In open-channel water distribution systems, such as MVIC’s old one, flow measurement is made via Parshall flumes or wier boxes. Their accuracy ranges from a best of 5% of flow to a typ-ical 20% of flow, and MVIC needed better if it was going to measure and control the entire water distribution system.
Traditionally, closed-pipe water distribution systems have used mechanical flowmeters. The first water turbine meter was
In this pilot project, open ditch irrigation canals were replaced with a
closed water distribution system. It reduces evaporation, cuts seep-
age and eliminates end-of-channel water losses.
technology in action

71
produced in the 18th century, and its descendants are similar in design, with a mechanical register for totalizing water usage. They are very accurate and designed for water billing service. But, turbine and propeller meters are maintenance problems, and they are difficult to use as a flow transmitters.
MVIC decided to use transit-time flowmeters clamped to the outside of the HDPE pipe. Two transducers infer the ve-locity of the water by measuring the difference in the time it takes for an ultrasonic signal to move upstream and down-stream through the fluid.
“After extensive review of many types of meters from var-ious manufacturers, a decision was made to purchase ultra-sonic flowmeters from Dynasonics (www.dynasonics.com),” said Jim Siscoe, general manager of MVIC.
One of the reasons, Siscoe reported, is that the flowmeters can be solar- or battery-powered. The large turnouts are sup-plied with continuous power, either by line voltage or by so-lar power, which is highly advantageous in Colorado. Smaller turnouts are powered by the district’s “ditch riders,” who carry portable 12-VDC batteries with them. “While the flowmeter is under battery power,” Siscoe explained, “the measured flow rate is used to manually adjust flow via the butterfly valve im-mediately downstream from the meter. Most turnouts require only one setting per season.”
Another reason for using ultrasonic flowmeters was the drastically reduced maintenance requirement.
“The Dynasonics flowmeters are now our standard for both new and retrofit applications, particularly replacement of our impeller flowmeters,” Siscoe said. “We especially like their non-intrusive aspect, which results in no maintenance, low cost, flexibility and ease of installation.” The district now has to keep only one type of flowmeter in inventory.
“The MVIC’s long term goal is to fully automate the sys-tem by installing wireless flowmeters and automatic control valves downstream of the meters,” Knudsen said.
As a pilot, the district received a $75,000 Conservation In-novation Grant from the USDA’s National Resources Con-servation Service. Scope items for the CIG grant include a solar-powered gate to control water level in the feeder canal and a wireless flow control and measurement system.
“Using solar power saved $25,000 to install an electrical
service line to this remote location,” Knudsen said. “Based on this success, MVIC has ordered another solar powered flow control gate for another canal next winter.”
A wireless SCADA system will be implemented at two turnouts. “This portion of the project will demonstrate flow control and measurement at a remote location where flow needs to be changed regularly throughout the season,” Knudsen said. “Wireless automation at these two turnouts will demonstrate to the MVIC and its shareholders the ben-efit of remote flow measurement and control.”
“All the turnouts on the closed pipe network have ultra-sonic flowmeters with electronics capable of sending flow measurement data to the SCADA master control center at the MVIC office.” Knudsen said.
The project has been so successful that the U.S. Bureau of Reclamation (USBR) is providing $2.1 million in stimu-lus grants to MVIC for construction of a second, seven-mile project.
Knudsen reported that the final project costs were $2.9 mil-lion, with annual savings projected to be $2 million. These numbers would yield a payback in about 18 months.
wal t Boyes is a pr incipal wi th process measurement consul tancy spi t zer & Boyes.
The transit-time flowmeters use strap-on transducers, which function as
ultrasonic transmitters and receivers.
technology in action