october 2021 capital markets update
TRANSCRIPT

OCTOBER 2021Capital Markets Update
Market commentaryU.S. ECONOMICS― Real U.S. GDP grew at a quarterly annualized rate of 2.0% in Q3,
falling short of consensus estimates of 2.6%. A slowdown in consumer spending drove the deceleration in GDP as spending for durable goods – namely motor vehicles and parts – fell 26.2%.
― The Establishment Survey showed that 531,000 jobs were added to non-farm payrolls in October. The report beat expectations for450,000 job additions. Food services and drinking places contributed 119,000 jobs to the overall increase coinciding with a sharp decline in Covid cases that reduced pandemic-related layoffs.
― The headline unemployment rate fell to 4.6% in October, dropping below the median rate of 4.8% expected by Fed officials for the end of the year as per the latest Fed Summary of Expectations. However, the labor force participation rate remained at 61.6% – below the pre-pandemic level of 63.4% -- as labor supply remained low.
U.S. EQUITIES― The S&P 500 Index (+7.0%) rebounded sharply in October and closed
above the 4600 price level for the first-time. Strong earnings helped the market shake off concerns surrounding the deceleration of theeconomic recovery.
― Of the 89% of S&P 500 companies which had reported quarterly results by November 5th, 81% reported stronger-than-expected earnings and 75% beat expectations on reported revenues.
― If all remaining company financials are reported in-line withexpectations, net income will have grown 39.1% year-over-year and revenue growth will be 17.3% year-over-year. Net profit margins fell from 13.1% the quarter before to 12.9% in Q3, though they remain elevated relative to their level last year (10.9%).
U.S. FIXED INCOME― Fed Chairman Powell, speaking at the 2021 Bank for International
Settlements Conference, exhibited a hawkish tone and expressed increased concern over inflation being more persistent than expected. Powell stated, “the risks are clearly now to longer and more-persistent [supply] bottlenecks, and thus to higher inflation.”
― The probability of at least one 25-basis point rate hike by July 2022 increased from 28% to 75% based on the CME FedWatchTool which extrapolates the market’s fed funds rate expectations from 30-day federal fund futures contracts. The probability that the fed funds rate would increase 50 basis points by the end of 2022 increased from 32% to 75%.
― The Federal Open Market Committee announced it would begin tapering its asset purchases of $120 billion per month in mid-November. The taper will include $10 billion in Treasuries and $5 billion in mortgage-backed securities, per month.
INTERNATIONAL MARKETS― The MSCI Asia Pacific Index’s 12-month forward EPS estimates
have dropped to 12-year lows relative to the MSCI AC World Index. The decreased expectations were led by Australia, South Korea and countries in Southeast Asia such as Malaysia.
― Chinese equities recovered (MSCI China +3.1%) in October but other equity markets in Asia (MSCI EM Asia ex China -0.2%) moved mostly sideways over the month.
― The Japanese Yen fell -2.1% relative to the U.S. Dollar in October and hurt those that invested in Japanese equities without a local currency hedge (MSCI Japan -3.4% unhedged vs MSCI Japan 100% hedged to USD -1.2%).
October 2021Capital Markets Update 2
ONE YEAR ENDING OCTOBER
Major asset class returns
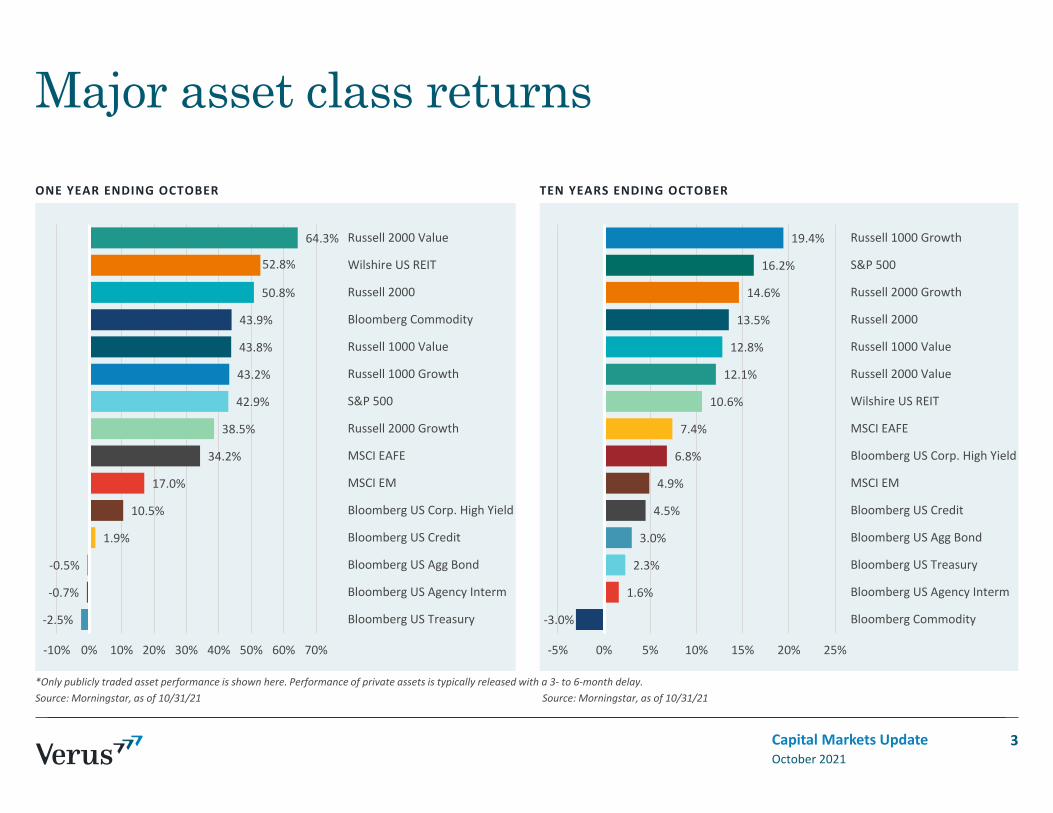
*Only publicly traded asset performance is shown here. Performance of private assets is typically released with a 3- to 6-month delay.Source: Morningstar, as of 10/31/21 Source: Morningstar, as of 10/31/21
TEN YEARS ENDING OCTOBER
October 2021Capital Markets Update 3
-2.5%
-0.7%
-0.5%
1.9%
10.5%
17.0%
34.2%
38.5%
42.9%
43.2%
43.8%
43.9%
50.8%
52.8%
64.3%
-10% 0% 10% 20% 30% 40% 50% 60% 70%
Bloomberg US Treasury
Bloomberg US Agency Interm
Bloomberg US Agg Bond
Bloomberg US Credit
Bloomberg US Corp. High Yield
MSCI EM
MSCI EAFE
Russell 2000 Growth
S&P 500
Russell 1000 Growth
Russell 1000 Value
Bloomberg Commodity
Russell 2000
Wilshire US REIT
Russell 2000 Value
-3.0%
1.6%
2.3%
3.0%
4.5%
4.9%
6.8%
7.4%
10.6%
12.1%
12.8%
13.5%
14.6%
16.2%
19.4%
-5% 0% 5% 10% 15% 20% 25%
Bloomberg Commodity
Bloomberg US Agency Interm
Bloomberg US Treasury
Bloomberg US Agg Bond
Bloomberg US Credit
MSCI EM
Bloomberg US Corp. High Yield
MSCI EAFE
Wilshire US REIT
Russell 2000 Value
Russell 1000 Value
Russell 2000
Russell 2000 Growth
S&P 500
Russell 1000 Growth

S&P 500 PRICE INDEX IMPLIED VOLATILITY (VIX INDEX) S&P 500 VALUATION SNAPSHOT
U.S. large cap equities― The S&P 500 Index climbed 7.0% in October. The
Consumer Discretionary (+10.9%) sector led the gainsfor the overall index. The gains in Consumer Discretionary were largely driven by a +42.6% advance in Tesla stock that contributed to 63.4% of the sector’s total return.
― All 11 S&P 500 GICS sectors had positive returns in October, led by the Consumer Discretionary (+10.9%), Energy (+10.4%) and Information Technology (+8.2%) sectors. The Utilities (+4.7%), Consumer Staples (+3.9%), and Telecommunication (+2.8%) sectors lagged the broader index.
― The Energy sector’s (+10.4%) performance was drivenby strong earnings from large oil companies which posted $24.9 billion in Q3 earnings growth. Chevron and Exxon Mobile accounted for $13 billion of the $26.9 billion in year-over-year earnings growth. TheEnergy sector is now up 111.3% over the last year.
― The Cboe VIX Index of implied volatility ended the month at 16.3 and dropped to an intra-month low of 15.0, the lowest level since February 2020. Strong earnings and increased certainty surrounding the coming Fed taper seemed to have reduced volatility expectations over the month.
Source: Bloomberg, as of 10/31/21 Source: Cboe, as of 10/31/21 Source: Bloomberg, as of 10/31/21
October 2021Capital Markets Update 4
2200
2700
3200
3700
4200
4700
5200
Oct-19 Apr-20 Oct-20 Apr-21 Oct-21
25.9
21.2
1.3 1.53.9 4.7
0
5
10
15
20
25
30
Trailing 1 Yr P/E
Forward 1 Yr P/E
Current Div. Yld
(%)
Implied Div. Yld
(%)
TrailingEarningsYld (%)
ImpliedEarningsYld (%)
0
10
20
30
40
50
60
70
80
90
Oct-19 Apr-20 Oct-20 Apr-21 Oct-21

VALUE VS. GROWTH RELATIVE VALUATIONSVALUE VS. GROWTH 1-YR ROLLING RELATIVE PERFORMANCE
SMALL VS. LARGE 1-YR ROLLING RELATIVE PERFORMANCE
Domestic equity size and style— The Russell 3000 Growth (+8.4%) rebounded in
October and outperformed the Russell 3000 Value (+5.0%). Risk assets performed well despite interest rate increases which can apply pressure to steep valuation levels.
— Large cap companies (Russell 1000 +6.9%) outperformed small cap companies (Russell 2000 +4.3%). The rebound in large-cap equities from September expanded the year-to-date relative outperformance of large cap stocks to +6.0% from +2.8% a month prior.
— The S&P 500 High Beta Index measures the performance of the 100 constituents most sensitive to changes in overall S&P 500 returns. The S&P High Beta Index (+7.4%), outperformed the S&P 500 Index (+7.0%).
— Performance within the large-cap space was largely attributable to only six names, which made up 43% of the returns over the month. The concentration in returns limited breadth in the market and the cap-weighted index (S&P 500 +7.0%) outperformed the equal-weighted Index (S&P 500 Equal Weight +5.3%).
Source: FTSE, Bloomberg, as of 10/31/21 Source: FTSE, Bloomberg, as of 10/31/21 Source: FTSE, Bloomberg, as of 10/31/21
October 2021Capital Markets Update 5
-15%
-10%
-5%
0%
5%
10%
15%
20%
0.0
0.5
1.0
1.5
2.0
2.5
Relative P/E (Value/Growth) (Left)Relative Average Valuation (Left)Subsequent 5 Year Rolling Excess Returns (Value/Growth) (Right)
-25%-20%-15%-10%
-5%0%5%
10%15%20%25%30%35%
Oct-09 Oct-11 Oct-13 Oct-15 Oct-17 Oct-19 Oct-21
Russell 2000 minus Russell 1000
-45%
-35%
-25%
-15%
-5%
5%
15%
25%
Oct-03 Oct-06 Oct-09 Oct-12 Oct-15 Oct-18 Oct-21
R1000 Value minus R1000 Growth

U.S. TREASURY YIELD CURVE NOMINAL YIELDS BREAKEVEN INFLATION RATES
Fixed income
Source: Bloomberg, as of 10/31/21 Source: Morningstar, as of 10/31/21 Source: Bloomberg, as of 10/31/21
— The Consumer Price Index rose 6.2% year-over-year in October, the fastest pace since 1990 and above the median expectation of 5.9%. Price increases were broad-based and exacerbated by supply chain bottlenecks and the tightness in the labor market.
— Breakeven inflation rates measure the market’s expectations for inflation rates over a period. The five-year breakeven inflation rate reached 3.0% intra-month, the highest level since 2004. The 10-yearbreakeven inflation rate reached 2.7% intra-month, the highest level since 2006.
— The yield curve flattened over the month as markets priced in a 25-basis point rate hike in July 2022 and the short end of the curve shifted higher. The spread between the 30- and 5-year U.S. Treasury yields decreased 35 basis points in October to just 0.75%.
— The 30-year U.S. Treasury yield fell 15 basis points over the month to 2.08%. At the long end of the curve, the 30-year yield ended the month five basis points lower than the 20-year yield, a sign of uncertainty in the market and potential concern the Fed may take more aggressive rate action to combat inflation.
October 2021Capital Markets Update 6
0%
1%
2%
3%
Oct-21 Apr-21 Oct-20
0%1%2%3%4%5%6%7%8%9%
BloombergUS Treasury
Index
BloombergUS Agg Index
BloombergUS Credit
Index
BloombergUS High Yield
Index
EMBI-GlobalIndex
Oct-21 Oct-20 20-Year Average
1.6%
2.6%2.9%
1.7%
2.4%2.6%
0.0%
0.6%
1.2%
1.8%
2.4%
3.0%
3.6%
12 Months Prior 6 Months Prior Oct-215-Year Breakeven 10-Year Breakeven
GLOBAL SOVEREIGN 10-YEAR YIELDS U.S. DOLLAR MAJOR CURRENCY INDEX MSCI VALUATION METRICS (3-MONTH AVG)
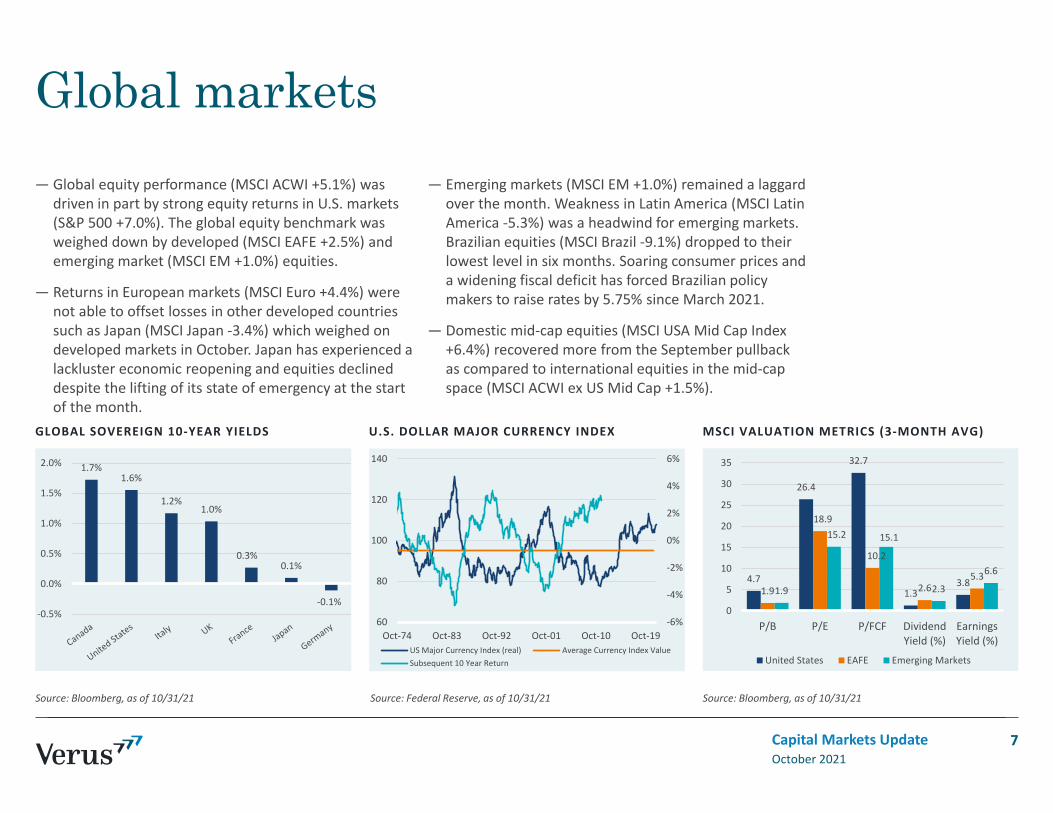
Global markets— Global equity performance (MSCI ACWI +5.1%) was
driven in part by strong equity returns in U.S. markets (S&P 500 +7.0%). The global equity benchmark was weighed down by developed (MSCI EAFE +2.5%) and emerging market (MSCI EM +1.0%) equities.
— Returns in European markets (MSCI Euro +4.4%) were not able to offset losses in other developed countries such as Japan (MSCI Japan -3.4%) which weighed on developed markets in October. Japan has experienced a lackluster economic reopening and equities declineddespite the lifting of its state of emergency at the start of the month.
— Emerging markets (MSCI EM +1.0%) remained a laggard over the month. Weakness in Latin America (MSCI Latin America -5.3%) was a headwind for emerging markets. Brazilian equities (MSCI Brazil -9.1%) dropped to their lowest level in six months. Soaring consumer prices and a widening fiscal deficit has forced Brazilian policy makers to raise rates by 5.75% since March 2021.
— Domestic mid-cap equities (MSCI USA Mid Cap Index +6.4%) recovered more from the September pullback as compared to international equities in the mid-cap space (MSCI ACWI ex US Mid Cap +1.5%).
Source: Bloomberg, as of 10/31/21 Source: Federal Reserve, as of 10/31/21 Source: Bloomberg, as of 10/31/21
October 2021Capital Markets Update 7
1.7%1.6%
1.2%1.0%
0.3%0.1%
-0.1%-0.5%
0.0%
0.5%
1.0%
1.5%
2.0%
-6%
-4%
-2%
0%
2%
4%
6%
60
80
100
120
140
Oct-74 Oct-83 Oct-92 Oct-01 Oct-10 Oct-19US Major Currency Index (real) Average Currency Index ValueSubsequent 10 Year Return
4.7
26.4
32.7
1.33.8
1.9
18.9
10.2
2.65.3
1.9
15.2 15.1
2.3
6.6
0
5
10
15
20
25
30
35
P/B P/E P/FCF DividendYield (%)
EarningsYield (%)
United States EAFE Emerging Markets
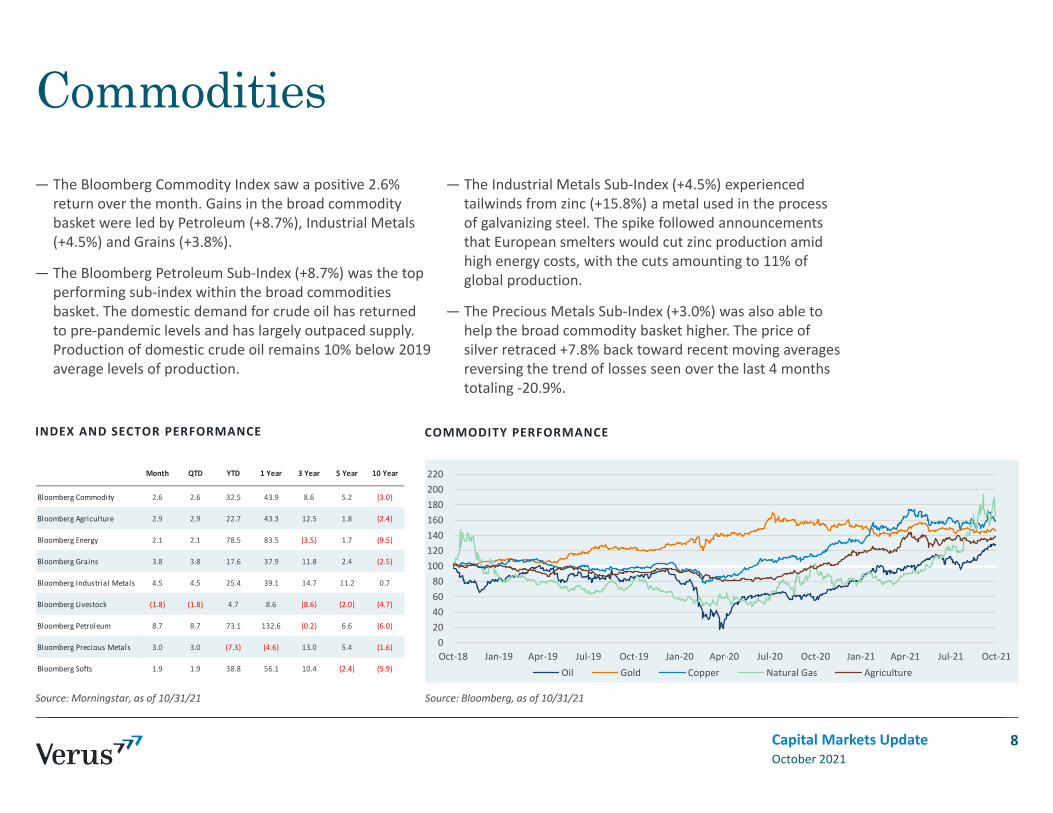
Commodities— The Bloomberg Commodity Index saw a positive 2.6%
return over the month. Gains in the broad commodity basket were led by Petroleum (+8.7%), Industrial Metals (+4.5%) and Grains (+3.8%).
— The Bloomberg Petroleum Sub-Index (+8.7%) was the top performing sub-index within the broad commodities basket. The domestic demand for crude oil has returned to pre-pandemic levels and has largely outpaced supply. Production of domestic crude oil remains 10% below 2019 average levels of production.
— The Industrial Metals Sub-Index (+4.5%) experienced tailwinds from zinc (+15.8%) a metal used in the process of galvanizing steel. The spike followed announcements that European smelters would cut zinc production amid high energy costs, with the cuts amounting to 11% of global production.
— The Precious Metals Sub-Index (+3.0%) was also able to help the broad commodity basket higher. The price of silver retraced +7.8% back toward recent moving averages reversing the trend of losses seen over the last 4 months totaling -20.9%.
Source: Morningstar, as of 10/31/21 Source: Bloomberg, as of 10/31/21
INDEX AND SECTOR PERFORMANCE COMMODITY PERFORMANCE
October 2021Capital Markets Update 8
Month QTD YTD 1 Year 3 Year 5 Year 10 Year
Bloomberg Commodity 2.6 2.6 32.5 43.9 8.6 5.2 (3.0)
Bloomberg Agriculture 2.9 2.9 22.7 43.3 12.5 1.8 (2.4)
Bloomberg Energy 2.1 2.1 78.5 83.5 (3.5) 1.7 (9.5)
Bloomberg Grains 3.8 3.8 17.6 37.9 11.8 2.4 (2.5)
Bloomberg Industrial Metals 4.5 4.5 25.4 39.1 14.7 11.2 0.7
Bloomberg Livestock (1.8) (1.8) 4.7 8.6 (8.6) (2.0) (4.7)
Bloomberg Petroleum 8.7 8.7 73.1 132.6 (0.2) 6.6 (6.0)
Bloomberg Precious Metals 3.0 3.0 (7.3) (4.6) 13.0 5.4 (1.6)
Bloomberg Softs 1.9 1.9 38.8 56.1 10.4 (2.4) (5.9)
020406080
100120140160180200220
Oct-18 Jan-19 Apr-19 Jul-19 Oct-19 Jan-20 Apr-20 Jul-20 Oct-20 Jan-21 Apr-21 Jul-21 Oct-21Oil Gold Copper Natural Gas Agriculture

Appendix
October 2021Capital Markets Update 9

Periodic table of returns
Source Data: Morningstar, Inc., Hedge Fund Research, Inc. (HFR), National Council of Real Estate Investment Fiduciaries (NCREIF). Indices used: Russell 1000, Russell 1000 Value, Russell 1000 Growth, Russell 2000, Russell 2000 Value, Russell 2000 Growth, MSCI EAFE, MSCI EM, Bloomberg US Aggregate, T-Bill 90 Day, Bloomberg Commodity, NCREIF Property, HFRI FOF, MSCI ACWI, Bloomberg Global Bond. NCREIF Property Index performance data as of 9/30/21.
Large Cap Equity Small Cap Growth Commodities
Large Cap Value International Equity Real Estate
Large Cap Growth Emerging Markets Equity Hedge Funds of Funds
Small Cap Equity US Bonds 60% MSCI ACWI/40% BBgBarc Global Bond
Small Cap Value Cash
BEST
WO
RST
October 2021Capital Markets Update 10
1999 2000 2001 2002 2003 2004 2005 2006 2007 2008 2009 2010 2011 2012 2013 2014 2015 2016 2017 2018 2019 2020 YTD 5-Year 10-Year
Commodities 66.4 31.8 14.0 25.9 56.3 26.0 34.5 32.6 39.8 5.2 79.0 29.1 14.3 18.6 43.3 13.5 13.3 31.7 37.3 6.7 36.4 38.5 32.5 25.5 19.4
Small Cap Value 43.1 22.8 8.4 10.3 48.5 22.2 21.4 26.9 16.2 1.4 37.2 26.9 7.8 18.1 38.8 13.2 5.7 21.3 30.2 1.9 31.4 34.6 27.6 19.2 16.3
Large Cap Growth 33.2 12.2 7.3 6.7 47.3 20.7 20.1 23.5 15.8 -6.5 34.5 24.5 2.6 17.9 34.5 13.0 0.9 17.3 25.0 0.0 28.5 21.0 24.2 17.9 14.6
Large Cap Equity 27.3 11.6 3.3 1.6 46.0 18.3 14.0 22.2 11.8 -21.4 32.5 19.2 1.5 17.5 33.5 11.8 0.6 12.1 22.2 -1.5 26.5 20.0 23.2 15.5 13.5
Large Cap Value 26.5 7.0 2.8 1.0 39.2 16.5 7.5 18.4 11.6 -25.9 28.4 16.8 0.4 16.4 33.1 6.0 0.0 11.8 21.7 -3.5 25.5 18.3 22.0 12.6 12.8
Small Cap Equity 21.3 4.1 -2.4 -6.0 29.9 14.3 6.3 15.5 10.3 -33.8 23.3 16.1 -2.1 15.3 23.3 4.9 -0.8 11.2 14.6 -6.0 22.4 14.0 17.2 12.4 12.1
International Equity 24.3 6.0 2.5 -5.9 30.0 14.5 7.1 16.6 10.9 -28.9 27.2 16.7 0.1 16.3 32.5 5.6 -0.4 11.3 17.1 -4.8 22.0 10.3 11.0 9.8 9.0
Real Estate 20.9 -3.0 -5.6 -11.4 29.7 12.9 5.3 15.1 7.0 -35.6 20.6 15.5 -2.9 14.6 12.1 4.2 -1.4 8.0 13.7 -8.3 18.6 7.8 10.9 9.8 7.4
Small Cap Growth 13.2 -7.3 -9.1 -15.5 25.2 11.4 4.7 13.3 7.0 -36.8 19.7 13.1 -4.2 11.5 11.0 3.4 -2.5 7.1 7.8 -9.3 18.4 7.5 7.6 9.4 6.9
Hedge Funds of Funds 11.4 -7.8 -9.2 -15.7 23.9 9.1 4.6 10.4 5.8 -37.6 18.9 10.2 -5.5 10.5 9.0 2.8 -3.8 5.7 7.7 -11.0 8.7 4.6 7.2 6.8 4.9
60/40 Global Portfolio 7.3 -14.0 -12.4 -20.5 11.6 6.9 4.6 9.1 4.4 -38.4 11.5 8.2 -5.7 4.8 0.1 0.0 -4.4 2.6 7.0 -11.2 7.8 2.8 6.0 6.2 4.5
Cash 4.8 -22.4 -19.5 -21.7 9.0 6.3 4.2 4.8 -0.2 -38.5 5.9 6.5 -11.7 4.2 -2.0 -1.8 -7.5 1.0 3.5 -12.9 7.7 0.5 0.0 5.2 3.0
Emerging Markets Equity -0.8 -22.4 -20.4 -27.9 4.1 4.3 3.2 4.3 -1.6 -43.1 0.2 5.7 -13.3 0.1 -2.3 -4.5 -14.9 0.5 1.7 -13.8 6.4 0.5 -0.3 3.1 0.6
US Bonds -1.5 -30.6 -21.2 -30.3 1.0 1.4 2.4 2.1 -9.8 -53.2 -16.9 0.1 -18.2 -1.1 -9.5 -17.0 -24.7 0.3 0.9 -14.6 2.1 -3.1 -1.6 1.1 -3.0

QTD
S&P 500 sector returns
Source: Morningstar, as of 10/31/21 Source: Morningstar, as of 10/31/21
ONE YEAR ENDING OCTOBER
October 2021Capital Markets Update 11
2.8%
3.9%
4.7%
5.2%
6.9%
7.0%
7.3%
7.5%
7.6%
8.2%
10.4%
10.9%
0% 3% 6% 9% 12% 15%
Telecom
Consumer Staples
Utilities
Health Care
Industrials
S&P 500
Financials
Real Estate
Materials
Information Technology
Energy
Consumer Discretionary
10.7%
19.0%
33.8%
36.2%
37.2%
39.8%
41.2%
42.9%
45.2%
46.9%
72.1%
111.3%
0% 20% 40% 60% 80% 100% 120%
Utilities
Consumer Staples
Health Care
Consumer Discretionary
Materials
Industrials
Telecom
S&P 500
Real Estate
Information Technology
Financials
Energy
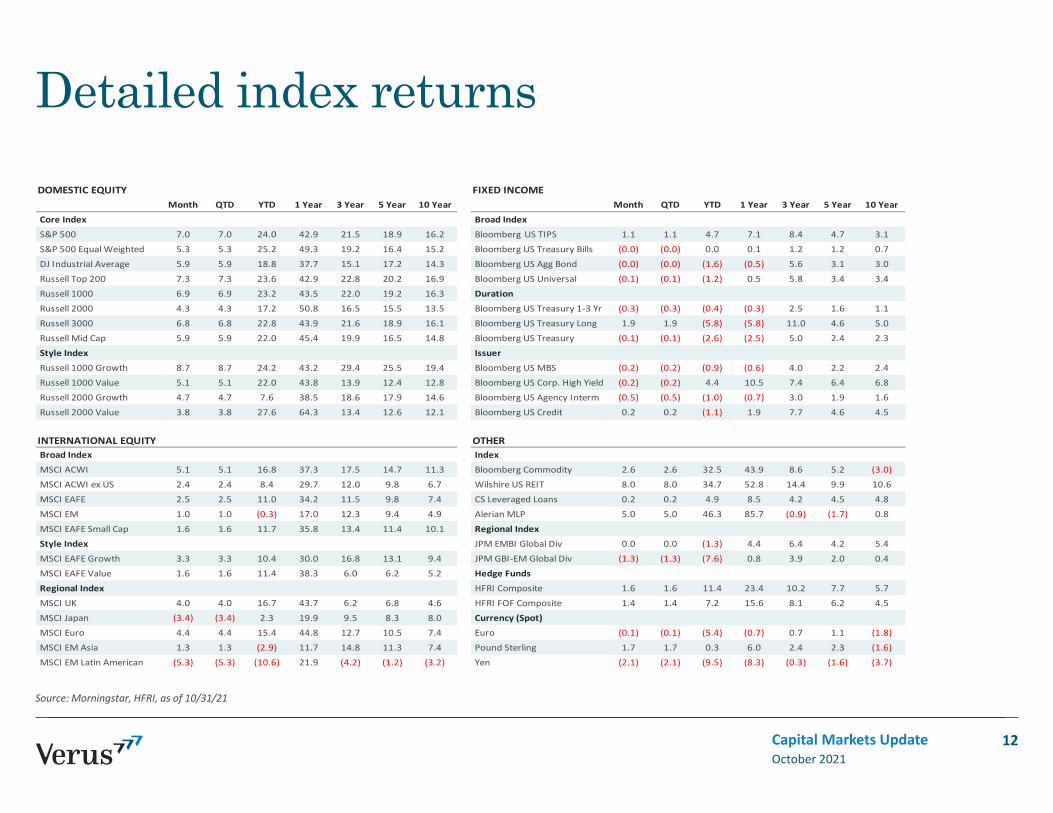
Detailed index returns
Source: Morningstar, HFRI, as of 10/31/21
October 2021Capital Markets Update 12
DOMESTIC EQUITY FIXED INCOMEMonth QTD YTD 1 Year 3 Year 5 Year 10 Year Month QTD YTD 1 Year 3 Year 5 Year 10 Year
Core Index Broad Index S&P 500 7.0 7.0 24.0 42.9 21.5 18.9 16.2 Bloomberg US TIPS 1.1 1.1 4.7 7.1 8.4 4.7 3.1 S&P 500 Equal Weighted 5.3 5.3 25.2 49.3 19.2 16.4 15.2 Bloomberg US Treasury Bills (0.0) (0.0) 0.0 0.1 1.2 1.2 0.7 DJ Industrial Average 5.9 5.9 18.8 37.7 15.1 17.2 14.3 Bloomberg US Agg Bond (0.0) (0.0) (1.6) (0.5) 5.6 3.1 3.0 Russell Top 200 7.3 7.3 23.6 42.9 22.8 20.2 16.9 Bloomberg US Universal (0.1) (0.1) (1.2) 0.5 5.8 3.4 3.4 Russell 1000 6.9 6.9 23.2 43.5 22.0 19.2 16.3 Duration Russell 2000 4.3 4.3 17.2 50.8 16.5 15.5 13.5 Bloomberg US Treasury 1-3 Yr (0.3) (0.3) (0.4) (0.3) 2.5 1.6 1.1 Russell 3000 6.8 6.8 22.8 43.9 21.6 18.9 16.1 Bloomberg US Treasury Long 1.9 1.9 (5.8) (5.8) 11.0 4.6 5.0 Russell Mid Cap 5.9 5.9 22.0 45.4 19.9 16.5 14.8 Bloomberg US Treasury (0.1) (0.1) (2.6) (2.5) 5.0 2.4 2.3 Style Index Issuer Russell 1000 Growth 8.7 8.7 24.2 43.2 29.4 25.5 19.4 Bloomberg US MBS (0.2) (0.2) (0.9) (0.6) 4.0 2.2 2.4 Russell 1000 Value 5.1 5.1 22.0 43.8 13.9 12.4 12.8 Bloomberg US Corp. High Yield (0.2) (0.2) 4.4 10.5 7.4 6.4 6.8 Russell 2000 Growth 4.7 4.7 7.6 38.5 18.6 17.9 14.6 Bloomberg US Agency Interm (0.5) (0.5) (1.0) (0.7) 3.0 1.9 1.6 Russell 2000 Value 3.8 3.8 27.6 64.3 13.4 12.6 12.1 Bloomberg US Credit 0.2 0.2 (1.1) 1.9 7.7 4.6 4.5
INTERNATIONAL EQUITY OTHER Broad Index Index MSCI ACWI 5.1 5.1 16.8 37.3 17.5 14.7 11.3 Bloomberg Commodity 2.6 2.6 32.5 43.9 8.6 5.2 (3.0) MSCI ACWI ex US 2.4 2.4 8.4 29.7 12.0 9.8 6.7 Wilshire US REIT 8.0 8.0 34.7 52.8 14.4 9.9 10.6 MSCI EAFE 2.5 2.5 11.0 34.2 11.5 9.8 7.4 CS Leveraged Loans 0.2 0.2 4.9 8.5 4.2 4.5 4.8 MSCI EM 1.0 1.0 (0.3) 17.0 12.3 9.4 4.9 Alerian MLP 5.0 5.0 46.3 85.7 (0.9) (1.7) 0.8 MSCI EAFE Small Cap 1.6 1.6 11.7 35.8 13.4 11.4 10.1 Regional Index Style Index JPM EMBI Global Div 0.0 0.0 (1.3) 4.4 6.4 4.2 5.4 MSCI EAFE Growth 3.3 3.3 10.4 30.0 16.8 13.1 9.4 JPM GBI-EM Global Div (1.3) (1.3) (7.6) 0.8 3.9 2.0 0.4 MSCI EAFE Value 1.6 1.6 11.4 38.3 6.0 6.2 5.2 Hedge Funds Regional Index HFRI Composite 1.6 1.6 11.4 23.4 10.2 7.7 5.7 MSCI UK 4.0 4.0 16.7 43.7 6.2 6.8 4.6 HFRI FOF Composite 1.4 1.4 7.2 15.6 8.1 6.2 4.5 MSCI Japan (3.4) (3.4) 2.3 19.9 9.5 8.3 8.0 Currency (Spot) MSCI Euro 4.4 4.4 15.4 44.8 12.7 10.5 7.4 Euro (0.1) (0.1) (5.4) (0.7) 0.7 1.1 (1.8) MSCI EM Asia 1.3 1.3 (2.9) 11.7 14.8 11.3 7.4 Pound Sterling 1.7 1.7 0.3 6.0 2.4 2.3 (1.6) MSCI EM Latin American (5.3) (5.3) (10.6) 21.9 (4.2) (1.2) (3.2) Yen (2.1) (2.1) (9.5) (8.3) (0.3) (1.6) (3.7)

Detailed private market returns
October 2021Capital Markets Update
Comparison to public market index returns
Source: Pooled IRRs are from Thompson Reuters C|A and Time-weighted Returns are from Investment Metrics, as of June 30th, 2021. All returns in U.S. dollars.* Includes Buyout, Growth Equity and Venture Capital.** Includes Control-Oriented Distressed, Credit Opportunities, Senior Debt and Subordinated Capital.*** Includes Private Equity Energy, Timber and Upstream Energy & Royalties.
13
Private Equity Pooled IRRs 1 Year 3 Year 5 Year 10 Year Private Credit Pooled IRRs 1 Year 3 Year 5 Year 10 Year
Global Private Equity FoFs & Secondary Funds 61.1 22.6 18.7 13.1 U.S. Al l Private Debt ** 34.1 12.1 12.6 11.1
Global Private Equity Direct Funds * 61.3 25.9 22.3 15.6 Public Index Time-weighted Returns
U.S. Private Equity Di rect Funds * 66.0 28.0 23.3 17.2 S&P / LSTA U.S. Leveraged Loan 100 Index 9.4 4.3 4.7 4.1
Europe Private Equity Direct Funds * 61.5 24.9 23.3 12.9
As ia Private Equity Direct Funds * 45.4 20.8 19.0 14.9
Public Index Time-weighted Returns Private Real Assets Pooled IRRs 1 Year 3 Year 5 Year 10 YearMSCI World 39.0 15.0 14.8 10.7 Global Nature Resources *** 26.6 (3.0) 2.5 1.4
S&P 500 40.8 18.7 17.6 14.8 Global Infrastructure 16.8 10.3 11.2 9.8
MSCI Europe 35.1 8.7 10.3 5.6 Public Index Time-weighted Returns
MSCI AC As ia Paci fic 34.3 10.3 12.6 7.0 S&P Global Natura l Resources 49.3 6.1 11.4 2.3
S&P Global Infrastructure 23.2 5.6 6.2 6.2
Private Real Estate Pooled IRRs 1 Year 3 Year 5 Year 10 YearU.S. Al l Private Real Es tate 19.5 8.4 9.4 11.9
Public Index Time-weighted Returns
FTSE NAREIT Equity REIT 38.0 10.1 6.3 9.4

Notices & disclosuresPast performance is no guarantee of future results. This document is provided for informational purposes only and is directed to institutional clients and eligible institutional counterparties only and is not intended for retail investors. Nothing herein constitutes investment, legal, accounting or tax advice, or a recommendation to buy, sell or hold a security or pursue a particular investment vehicle or any trading strategy. This document may include or imply estimates, outlooks, projections and other “forward-looking statements.” No assurance can be given that future results described or implied by any forward looking information will be achieved. Investing entails risks, including possible loss of principal. Verus Advisory Inc. (“Verus”) file a single form ADV under the United States Investment Advisors Act of 1940, as amended. Additional information about Verus Advisory, Inc. available on the SEC’s website at www.adviserinfo.sec.gov.
Verus – also known as Verus Advisory™.
October 2021Capital Markets Update 14