octomeric pyruvate-ferredoxin oxidoreductase from...
TRANSCRIPT
Journal of
www.elsevier.com/locate/yjsbi
Journal of Structural Biology 159 (2007) 9–18
StructuralBiology
Octomeric pyruvate-ferredoxin oxidoreductase fromDesulfovibrio vulgaris
Florian Garczarek a, Ming Dong a, Dieter Typke a, H. Ewa Witkowska b,Terry C. Hazen c, Eva Nogales a,d,*, Mark D. Biggin a,*, Robert M. Glaeser a,*
a Life Sciences Division, Lawrence Berkeley National Laboratory, University of California, Berkeley, CA 94720, USAb UCSF Biomolecular Resource Center Mass Spectrometry Facility and Department of Cell and Tissue Biology, University of California,
San Francisco, CA 94143, USAc Earth Sciences Division, Lawrence Berkeley National Laboratory, University of California, Berkeley, CA 94720, USA
d Howard Hughes Medical Institute, Department of Molecular and Cell Biology, University of California, Berkeley, CA 94720, USA
Received 13 December 2006; received in revised form 17 January 2007; accepted 19 January 2007Available online 17 February 2007
Abstract
Pyruvate-ferredoxin oxidoreductatse (PFOR) carries out the central step in oxidative decarboxylation of pyruvate to acetyl-CoA. Wehave purified this enzyme from Desulfovibrio vulgaris Hildenborough (DvH) as part of a systematic characterization of as many multi-protein complexes as possible for this organism, and the three-dimensional structure of this enzyme has been determined by a combina-tion of electron microscopy (EM), single particle image analysis, homology modeling and computational molecular docking. Our resultsshow that the 1 MDa DvH PFOR complex is a homo-octomer, or more precisely, a tetramer of the dimeric form of the related enzymefound in Desulfovibrio africanus (Da), with which it shares a sequence identity of 69%. Our homology model of the DvH PFOR dimer isbased on the Da PFOR X-ray structure. Docking of this model into our 17 A resolution EM-reconstruction of negatively stained DvHPFOR octomers strongly suggests that the difference in oligomerization state for the two species is due to the insertion of a single valineresidue (Val383) within a surface loop of the DvH enzyme. This study demonstrates that the strategy of intermediate resolution EMreconstruction coupled to homology modeling and docking can be powerful enough to infer the functionality of single amino acidresidues.� 2007 Elsevier Inc. All rights reserved.
Keywords: Pyruvate-ferredoxin oxidoreductase; Desulfovibrio vulgaris; Electron microscopy; Single particle reconstruction; Oligomerization; Homologymodeling; Molecular docking
1. Introduction
The oxidative decarboxylation of pyruvate to produceacetyl-CoA is the gateway to the tricarboxylic acid(TCA) cycle. In aerobic bacteria, this central step in energymetabolism is catalyzed by the pyruvate dehydrogenasemulti-enzyme complex. In most anaerobic bacteria,
1047-8477/$ - see front matter � 2007 Elsevier Inc. All rights reserved.
doi:10.1016/j.jsb.2007.01.020
* Corresponding authors. Address: Howard Hughes Medical Institute,Department of Molecular and Cell Biology, University of California,Berkeley, CA 94720, USA. Fax: +1 510 486 6488.
E-mail addresses: [email protected] (E. Nogales), [email protected](M.D. Biggin), [email protected] (R.M. Glaeser).
archaea, and eukaryotes that lack mitochondria, however,this step is catalyzed by the enzyme pyruvate-ferredoxinoxidoreductase (PFOR) (Charon et al., 1999).
The subunit composition of PFOR varies in differentorganisms. In some species PFOR occurs as a dimer of asingle polypeptide (Brostedt and Nordlund, 1991). In oth-ers, four or five different genes encode smaller polypeptidesthat assemble to form the functional PFOR (Brostedt andNordlund, 1991; Ikeda et al., 2006). These genes arehomologous to different parts of the larger single-polypep-tide PFORs, and it is thought that the single polypeptidePFORs arose by operon rearrangement and fusion of smal-ler common ancestor genes (Kletzin and Adams, 1996).
10 F. Garczarek et al. / Journal of Structural Biology 159 (2007) 9–18
Previously, the only structure reported for a PFOR wasthe X-ray crystal structure of a 266 kDa homodimericenzyme from the sulfate reducing bacterium Desulfovibrio
africanus (Da). The structure without bound substrate, aswell as a complex with pyruvate and that of a reactionintermediate, have been solved (Chabriere et al., 1999;Chabriere et al., 2001).
Here, we report the structure of a PFOR enzyme iso-lated from a closely related species, Desulfovibrio vulgaris
Hildenborough (DvH). We show that the enzyme, whichpurifies as a 1056 kDa oligomer, exists as a stable tetramerof dimers, and we propose that a single residue insertionplays a significant role in this unusual oligomerizationstate. Our work demonstrates how extremely powerful neg-ative stain electron microscopy can be in the context ofproteomic comparisons between related microbes, orbetween different physiological states of a single microbe,when there is already at least one homolog X-ray structureand the genome for the new organism of interest available.
2. Materials and methods
2.1. Biomass production
Desulfovibrio vulgaris Hildenborough (ATCC 29579)was obtained from the American Type Culture Collection(Manassas, VA). A defined lactate–sulfate medium,LS4D, is used in all cultures. All media preparation detailsand reagents are as before (Mukhopadhyay et al., 2006).All reagents and preparation protocols are tracked for eachmedia preparation and recorded in the Biofiles database(http://vimss.lbl.gov/perl/biofiles). Media are autoclavedand then filter sterilized, after which phosphate, vitaminsand reducing agent (titanium citrate) are added. Stock cul-tures of D. vulgaris were prepared by growing the ATCCculture to log phase, and storing at �80 �C. The starter cul-ture is prepared inside an anaerobic chamber using stockculture at a ratio of 1 ml stock/100 ml LS4D. The starterculture is incubated at 30 �C and allowed to grow for48 h to log phase (optical density at 600 nm of �0.3–0.4;�3 · 108 cells/ml). From the starter culture, a 10% subcul-ture for inoculating the production culture is made inLS4D, in the anaerobic chamber, and incubated at 30 �Cuntil log phase growth is reached (around 15 h). The gener-ation time for D. vulgaris on this medium is 5 h. To mini-mize repetitive culturing ‘‘phenotypic drift’’ allexperiments are started from fresh frozen stock. All exper-iments were run on cells that are less then three subculturesfrom the original ATCC culture. All inoculations andtransfers were done in a Coy anaerobic glove box chamber(Coy Laboratory Products Inc., Grass Lake, MI) with anatmosphere of 5% CO2, 5% H2 and 90% N2. The produc-tion culture is grown in batch, using a 5 L flask. The flaskis autoclaved with 5 L LS4D media and cooled on thebench in the anaerobic chamber. Immediately before inoc-ulation, vitamins, phosphate, and reducing agent areinjected into the flask. Samples are periodically taken from
the fermenter to monitor growth from OD measurement.Once log phase growth is reached, the cells are harvested.To minimize sample variability due to processing time,samples were pulled from the production cultures by peri-staltic pump through 7 m of capillary tubing in an ice bath.This was found to drop the temperature of the sample toless then 4 �C in less then 15 s. The samples are directlyput into 500 mL centrifuge bottles, which are centrifugedat 6000g for 10 min, with refrigeration at 4 �C (BeckmanCoulter, Avanti J-25). The supernatant is discarded; thepellets are washed with degassed phosphate buffered salinesolution, and pooled for a second spin. The bottles areflash-frozen in liquid nitrogen and stored at �80 �C untilfurther processing.
2.2. Purification and biochemical characterization of PFOR
Cell extracts were produced by thawing 10 g of pel-leted cells in 10 ml of 0.1 M Tris–HCl pH 7.5 containing80 mM KCl, 2 mM dithiothreitol (DTT), 1 mM phenyl-methylsulphonylfluoride (PMSF). Cells were broken bytreatment with 0.5 mg/ml lysozyme for 2 h followed bysonication. The cytosolic portion of the cell extract wasseparated by centrifugation at 200,000g for 90 min andthe supernatant was retained for purification of PFOR(Yu et al., 2001). All purification steps were performedat 4 �C using columns and an AKTA FPLC from GEHealthcare. Different mixtures of two buffers were usedfor column fractionation: Buffer A contained 25 mMHepes pH 7.6, 10% (v/v) glycerol, 2 mM DTT, 0.01%(v/v) NP 40 and Buffer B contained Buffer A plus 1 MNaCl. The NaCl concentration of the mixture of thetwo buffers is given by the % Buffer B.
The cell extract supernatant was loaded on a 1.6 · 20 cmQ Sepharose Fast Flow column equilibrated with 5% bufferB. After the column had been washed with two column vol-umes of equilibration buffer, the bound proteins wereeluted with 50% buffer B. All fractions containing signifi-cant amounts of protein were pooled and buffer exchangedto 5% buffer B with a 2.6 · 20 cm G-25 desalting column.The eluate was loaded to a 1.6 · 10 cm MonoQcolumn equilibrated with 5% buffer B. Then the MonoQcolumn was developed with a linear gradient from 5% buf-fer B to 50% buffer B in 25 column volumes and 4 ml frac-tions were collected. The fractions subsequentlydetermined to contain PFOR were pooled and loaded ontoa 1.6 · 60 cm Superdex 200 column equilibrated with 5%buffer B. Fractions eluted from that column in 5% bufferB were frozen in liquid nitrogen and stored at �70 �C.Purified Superdex 200 fractions were buffer exchangedusing a PD-10 desalting column equilibrated with 10 mMHepes, pH 7.6, 2 mM DTT, 0.01% NP40. The buffer-exchanged protein was concentrated with Amicon andMicrocon centrifugal filters (Millipore) to a concentrationof 0.2–0.6 mg/ml. The protein concentration was thendetermined with Coomassie Plus Bradford Assay Reagent(Pierce) using BSA as the standard.
F. Garczarek et al. / Journal of Structural Biology 159 (2007) 9–18 11
The molecular weight of purified protein complexes wasdetermined independently using native 4–20% PAGE (Bio-Rad) and gel filtration on a 1 · 30 cm Superose 6 columnequilibrated with 5% Buffer B. The molecular weight stan-dards used to calibrate the Superose 6 column were BSA(67 kDa), aldolase (158 kDa), catalase (223 kDa), ferritin(440 kDa), and thyroglobin (663 kDa). The Kav at whichthe DvH PFOR complex eluted from the column was0.30, suggesting an apparent molecular mass of 1000 kDafrom the calibration curve. The apparent molecular weightof the monomer subunit was determined by 4–20% SDS–PAGE (Bio-Rad).
The identity of the 130 kDa polypeptide observed inSDS–PAGE was determined by in-gel digestion of a gelslice containing this polypeptide according to an estab-lished protocol (Jimenez et al, 2006). Modified porcinetrypsin from Promega was used at a final concentrationof 12.5 ng/ml in the digestion. Mixtures of proteolytic pep-tides were analyzed by nanoLC MS/MS utilizing an Ulti-mate Capillary LC System (Dionex) interfaced withQStar XL mass spectrometer (Applied Biosystems/Sciex)equipped with a Protana nanospray source. External cali-bration was performed in MS/MS mode using fragmentions of Glu-fibrinopeptide.
LC Packings Pepmap C18 trap column (300 lm innerdiameter, 5 mm length, 300 A pore size, 5 lm bead size)and a column (75 lm inner diameter, 15 cm length) self-packed with Jupiter Proteo C12 end-capped material(90 A pore size, 4 lm bead size) were used for desaltingand reversed phase peptide separation, respectively. A50 min linear gradient from 2% B to 50% B was run at250 nL/min flow rate, utilizing solvents A: 2% acetoni-trile/0.1% formic acid and B: 80% acetonitrile/0.08% for-mic acid. Precursor ion selection employed an automatedroutine (Information Dependent Acquisition, IDA, Ana-lyst QS 1.1. Applied Biosystems/Sciex) that consisted of aseries of one survey MS scan (1 s, m/z 400–1700) and twoMS/MS scans (2 s, m/z 60–1500); nitrogen served as a col-lision gas and collision energy was automatically adjusteddepending on the size and charge state (/m/z/) of theprecursor ion. In-house Mascot search engine version2.1.01 (Matrix Science) was employed utilizing the follow-ing settings: all species within NCBInr 20060905 (3946334sequences; 1357962904 residues); precursor mass tolerance100 ppm; fragment mass tolerance 0.1 kDa; tryptic diges-tion with 2 missed cleavages, fixed modifications: S-car-boxyamidomethyl, variable modifications: deamidation(Asn and Gln); Met-sulfoxide; Pyro-Glu (from N-terminalGln). With the settings described above and a confidencelevel at p < 0.05, ion scores higher than 52 indicated exten-sive homology or identity.
The Mascot search engine matched 106 MS/MS spectrarepresenting 64 unique tryptic peptide sequences to PFOR(gi|46450850; DVU 3025) with an overall score of 2600.Ninety five of the matches ranked #1, out of which 18achieved a high confidence score (p < 0.05). The overallsequence coverage was 65%. Tryptic peptide 383VNGP387K
that encompasses 383 Val falls outside the mass range ofMS analysis and was not detected. Peptides containingamino acid residues Pro267, Pro318 and Ala319 weredetected. In addition, a putative pyruvate carboxylase(gi|46449660; DVU 1834) was also identified as a potentialhit with the overall score of 70 and sequence coverage of5%. For this protein, 6 MS/MS spectra matches repre-sented 6 unique tryptic peptide sequences, 3 matchesranked #1 and none achieved a high confidence score.We assume that this putative carboxylase is a minor con-taminant of the PFOR preparation.
2.3. Electron microscopy of negatively stained samples
The PFOR sample was diluted with 1% trehalose froman initial concentration of 0.3 mg/ml to a concentrationof 0.05 mg/ml. Three microliter of this sample wasadsorbed onto a glow-discharge treated, carbon-coatedgrid for 30 s. The grid was first washed by touching a dropof 1% trehalose with the sample facing down for 10 s. Thegrid was then transferred to a solution containing 5%ammonium molybdate (pH 7) and 1% trehalose andstained for 30 s. The excess stain was blotted with filterpaper and air-dried.
Data were collected on a Tecnai 12 (FEI Company)microscope operated at 120 keV on Kodak SO-163 filmunder low-dose conditions at a magnification of 49,700·with a defocus ranging from �0.6 lm to �1.6 lm. Micro-graphs were digitized in a Nikon Super Coolscan 8000 withscanning resolutions of 12.7 lm/pixel, resulting in resolu-tions of 2.56 A/pixel at the level of the sample.
2.4. Cryo-EM
Cryo-EM samples were prepared on holey quantifoilgrids (Quantifoil Micro Tools, GmbH), either with or with-out an additional thin layer of continuous carbon. In thefirst case (sample on continuous carbon), a 1.2 mg/mlPFOR sample was diluted to a concentration of 0.5 mg/ml. In the second case (sample over holey carbon) we usedthe undiluted sample, with a small amount of TMV addedas an internal standard for size and image quality. In bothcases, 3 lL of the protein samples were applied to a freshlyglow-discharged grid mounted in a Vitrobot chamber set at95% relative humidity and 23 �C. The grids were blottedfor 2 s and immediately plunge-frozen in liquid ethane inorder to vitrify the sample. Images were taken on a Tecnai20 (FEI Company) microscope operated at 200 keV onKodak SO-163 film under low-dose conditions at a magni-fication of 50,000 times.
2.5. Data processing of particles imaged in negative stain
Two steps were used for the overall reconstructionprocess:
For the first step, 10,411 particles were selected manu-ally from 19 micrographs and windowed out using
12 F. Garczarek et al. / Journal of Structural Biology 159 (2007) 9–18
EMAN’s Boxer with a box size of 160 · 160 pixels (Ludtkeet al., 1999). The boxed images were corrected for the CTFby phase flipping using ctfit (EMAN) and grouped into 80classes by reference free classification using the EMANcommands ctfit and startnrclass, respectively. A set ofEuler angles was then assigned to 20 of these class averagesand an initial 3-D model was built by using common linesin Fourier space with the EMAN startAny command,assuming D4 symmetry of the complex. This model waslow pass filtered to 50 A resolution and taken as a prelimin-ary model for 12 iterations of refinement using EMAN’srefine command. A resolution of 21 A of the final volumewas determined by calculating the Fourier shell correlationbetween two volumes which had been built independentlyby splitting the dataset into two halves (EMAN’s eotest).These volumes were also visually compared to a 21 A lowpassed filtered volume of the X-ray structure 1B0P (Chab-riere et al., 1999) of the PFOR homodimer from Desulf-
ovibrio africanus. A good overall correspondence could beseen between the dimer volume and a quarter of the refinedvolume, confirming that the reconstruction had convergedto the correct model.
For the second step, 14,496 particles were semiautomat-ically selected from the same micrographs mentioned aboveusing 40 2-D projections of the previously determinedmodel as a reference (using EMAN’s makeboxref.py scriptand Boxer). The selected particles were grouped in 5 defo-cus groups and aligned to 83 2-D projections of the previ-ous model using SPIDER’s AP_SH command (the 2-Dprojections were modified by the Contrast Transfer Func-tion, using the mean defocus value of each correspondingdefocus group) (Frank et al., 1996). Fifteen percent ofthe particles with the lowest cross-correlation value wereremoved from each defocus group and the remaining12,402 particles were used for a refinement with SPIDER.A resolution of 17 A was reached by imposing D4 symme-try (using BP_32F) and 21 A without imposing symmetry(using BP_CG).
EMAN v1.7 and SPIDER 13 (in combination withSPIRE) were the software versions used for reconstruction.All the resolutions reported correspond to the 0.5 FSCcriterions.
2.6. Building a three-dimensional PFOR DvH model
A three-dimensional homology model of PFOR dimerfrom DvH was produced using Modeller 8v2, which createsmodels based on the satisfaction of spatial restraints (Saliand Blundell, 1993). The sequence of the target proteinwas aligned to the Desulfovibrio africanus PFOR sequenceusing the program MUSCLE (Edgar, 2004) and the knownX-ray structure 2C3M (Cavazza et al., 2006) was used as atemplate for the determination of the tertiary structure.The homology PFOR dimer model was docked (rigid-bodyfitting) into the PFOR octomer electron density using theprogram colors from the program package Situs 2.2 (Cha-con and Wriggers, 2002).
The reconstructed densities presented here were normal-ized using the EMAN program proc3d (mean = 0,sigma = 1) and rendered with a threshold level of 1.9. Thisthreshold was chosen to correspond to a volume thatincluded almost all backbone atoms of the fitted homologymodel, allowing only small segments of loops to stick outof the volume. The size of the volume was measured withchimera (Pettersen et al., 2004) to be 2.05 · 106 A3. Theexpected size of a 1.06 MDa protein (PFOR octomer) is1.30 · 106 A3 assuming a protein density of 1.35 g/cm3.Therefore, the scaling factor between the expected andmeasured volume based on our study is 1.6. This scalingfactor should be generally applicable to other studies, eventhough the current work used ammonium molybdate incombination with trehalose as a negative stain. Theremarkable fit of an atomic model into the surface contoursof our reconstruction, as demonstrated by the subsequentdocking, should make this work a valuable point of refer-ence to establish the appropriate isosurface level to be usedin the interpretation of maps.
A model of the electrostatic potential (in water) of oneof the fitted homology dimers was calculated using Delphi(Rocchia et al., 2001) and projected onto the DvH PFORoctomer isosurface using the Chimera package from theResource for Biocomputing, Visualization, and Informat-ics at the University of California, San Francisco (sup-ported by NIH P41 RR-01081) (Pettersen et al., 2004).
3. Results
3.1. Purification of DvH PFOR
As part of an interdisciplinary project that is developinghigh-throughput approaches to identify and characterizemicrobial multi-protein complexes (http://pcap.lbl.gov/),this enzyme was initially purified as an unknown proteincomplex to at least 90% homogeneity (Fig. 1a and b). Bothnative gradient PAGE and Superose 6 gel filtration chro-matography indicated that the molecular mass of the com-plex was approximately 1000–1300 kDa (Fig. 1a and b anddata not shown). In SDS–PAGE, only a single polypeptideof 130 kDa was apparent. Mass spectrometry analysis of agel slice including this 130 kDa band identified the proteinas the 1215 amino acid, 132,690 kDa PFOR polypeptide(gi|46450850; DVU 3025). Thus the complex is a DvHPFOR that appears to form a higher order multimer thanreported for the Desulfovibrio africanus protein or anyother PFOR enzyme.
3.2. Electron microscopy and 3-D reconstruction
Electron micrographs of negatively stained DvH PFORreveal that the particles are homogeneous in size and uni-formly distributed on the carbon film of the EM grid(Fig. 2a). About 15,000 particle projections were boxedand subjected to two-dimensional reference-free alignmentand classification. As is seen in the examples shown in
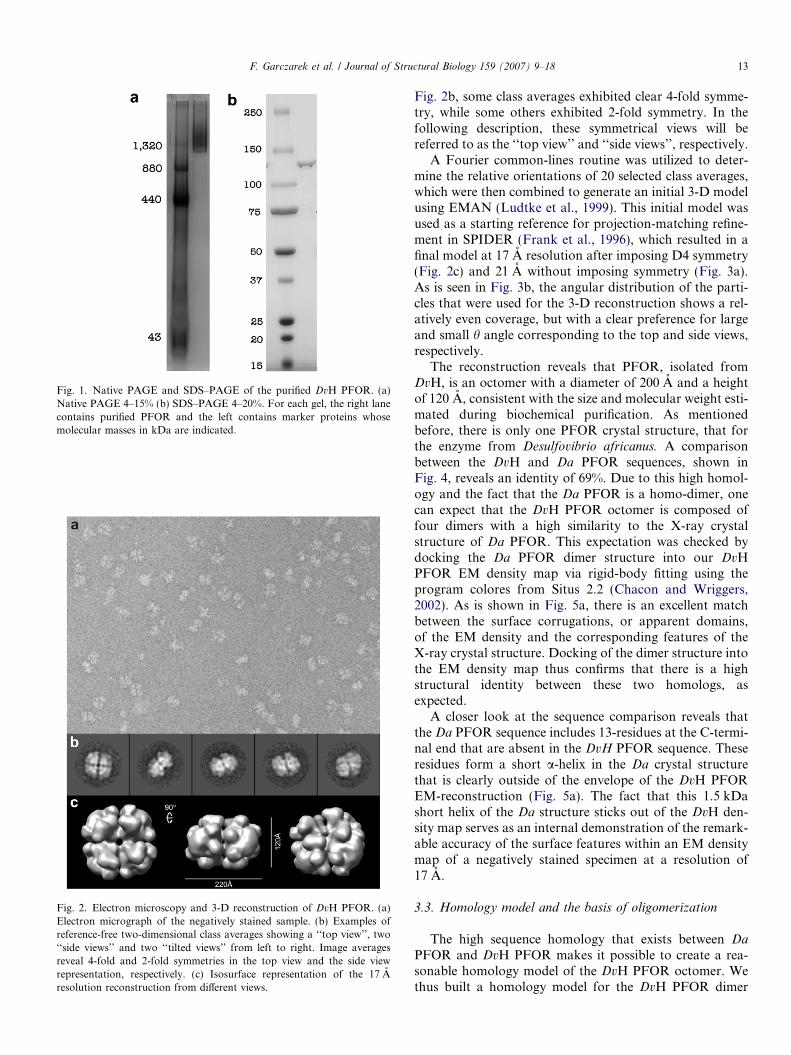
Fig. 1. Native PAGE and SDS–PAGE of the purified DvH PFOR. (a)Native PAGE 4–15% (b) SDS–PAGE 4–20%. For each gel, the right lanecontains purified PFOR and the left contains marker proteins whosemolecular masses in kDa are indicated.
Fig. 2. Electron microscopy and 3-D reconstruction of DvH PFOR. (a)Electron micrograph of the negatively stained sample. (b) Examples ofreference-free two-dimensional class averages showing a ‘‘top view’’, two‘‘side views’’ and two ‘‘tilted views’’ from left to right. Image averagesreveal 4-fold and 2-fold symmetries in the top view and the side viewrepresentation, respectively. (c) Isosurface representation of the 17 Aresolution reconstruction from different views.
F. Garczarek et al. / Journal of Structural Biology 159 (2007) 9–18 13
Fig. 2b, some class averages exhibited clear 4-fold symme-try, while some others exhibited 2-fold symmetry. In thefollowing description, these symmetrical views will bereferred to as the ‘‘top view’’ and ‘‘side views’’, respectively.
A Fourier common-lines routine was utilized to deter-mine the relative orientations of 20 selected class averages,which were then combined to generate an initial 3-D modelusing EMAN (Ludtke et al., 1999). This initial model wasused as a starting reference for projection-matching refine-ment in SPIDER (Frank et al., 1996), which resulted in afinal model at 17 A resolution after imposing D4 symmetry(Fig. 2c) and 21 A without imposing symmetry (Fig. 3a).As is seen in Fig. 3b, the angular distribution of the parti-cles that were used for the 3-D reconstruction shows a rel-atively even coverage, but with a clear preference for largeand small h angle corresponding to the top and side views,respectively.
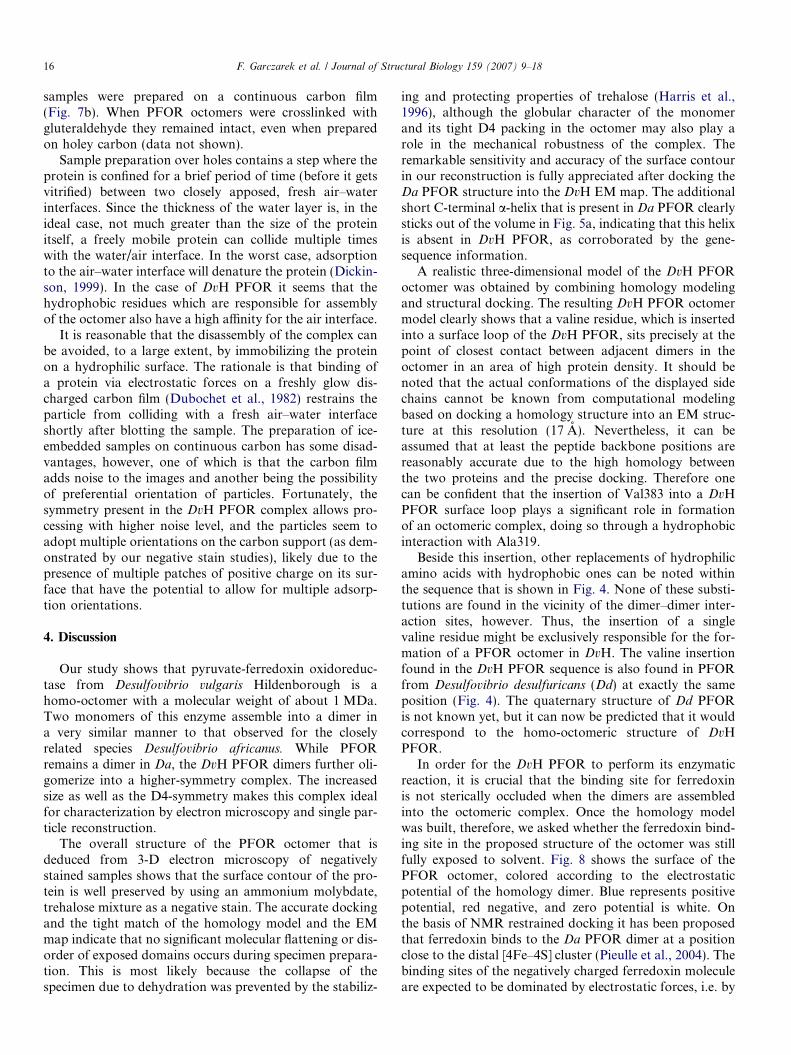
The reconstruction reveals that PFOR, isolated fromDvH, is an octomer with a diameter of 200 A and a heightof 120 A, consistent with the size and molecular weight esti-mated during biochemical purification. As mentionedbefore, there is only one PFOR crystal structure, that forthe enzyme from Desulfovibrio africanus. A comparisonbetween the DvH and Da PFOR sequences, shown inFig. 4, reveals an identity of 69%. Due to this high homol-ogy and the fact that the Da PFOR is a homo-dimer, onecan expect that the DvH PFOR octomer is composed offour dimers with a high similarity to the X-ray crystalstructure of Da PFOR. This expectation was checked bydocking the Da PFOR dimer structure into our DvHPFOR EM density map via rigid-body fitting using theprogram colores from Situs 2.2 (Chacon and Wriggers,2002). As is shown in Fig. 5a, there is an excellent matchbetween the surface corrugations, or apparent domains,of the EM density and the corresponding features of theX-ray crystal structure. Docking of the dimer structure intothe EM density map thus confirms that there is a highstructural identity between these two homologs, asexpected.
A closer look at the sequence comparison reveals thatthe Da PFOR sequence includes 13-residues at the C-termi-nal end that are absent in the DvH PFOR sequence. Theseresidues form a short a-helix in the Da crystal structurethat is clearly outside of the envelope of the DvH PFOREM-reconstruction (Fig. 5a). The fact that this 1.5 kDashort helix of the Da structure sticks out of the DvH den-sity map serves as an internal demonstration of the remark-able accuracy of the surface features within an EM densitymap of a negatively stained specimen at a resolution of17 A.
3.3. Homology model and the basis of oligomerization
The high sequence homology that exists between Da
PFOR and DvH PFOR makes it possible to create a rea-sonable homology model of the DvH PFOR octomer. Wethus built a homology model for the DvH PFOR dimer
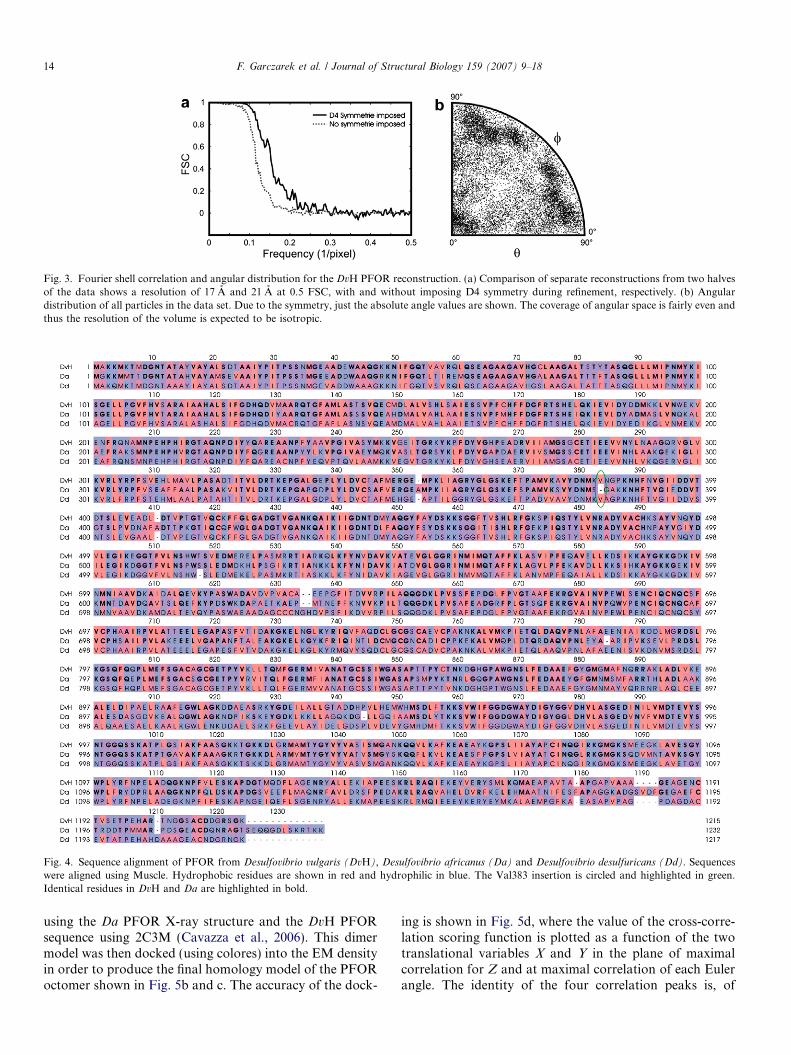
Fig. 4. Sequence alignment of PFOR from Desulfovibrio vulgaris (DvH), Desulfovibrio africanus (Da) and Desulfovibrio desulfuricans (Dd). Sequenceswere aligned using Muscle. Hydrophobic residues are shown in red and hydrophilic in blue. The Val383 insertion is circled and highlighted in green.Identical residues in DvH and Da are highlighted in bold.
Fig. 3. Fourier shell correlation and angular distribution for the DvH PFOR reconstruction. (a) Comparison of separate reconstructions from two halvesof the data shows a resolution of 17 A and 21 A at 0.5 FSC, with and without imposing D4 symmetry during refinement, respectively. (b) Angulardistribution of all particles in the data set. Due to the symmetry, just the absolute angle values are shown. The coverage of angular space is fairly even andthus the resolution of the volume is expected to be isotropic.
14 F. Garczarek et al. / Journal of Structural Biology 159 (2007) 9–18
using the Da PFOR X-ray structure and the DvH PFORsequence using 2C3M (Cavazza et al., 2006). This dimermodel was then docked (using colores) into the EM densityin order to produce the final homology model of the PFORoctomer shown in Fig. 5b and c. The accuracy of the dock-
ing is shown in Fig. 5d, where the value of the cross-corre-lation scoring function is plotted as a function of the twotranslational variables X and Y in the plane of maximalcorrelation for Z and at maximal correlation of each Eulerangle. The identity of the four correlation peaks is, of
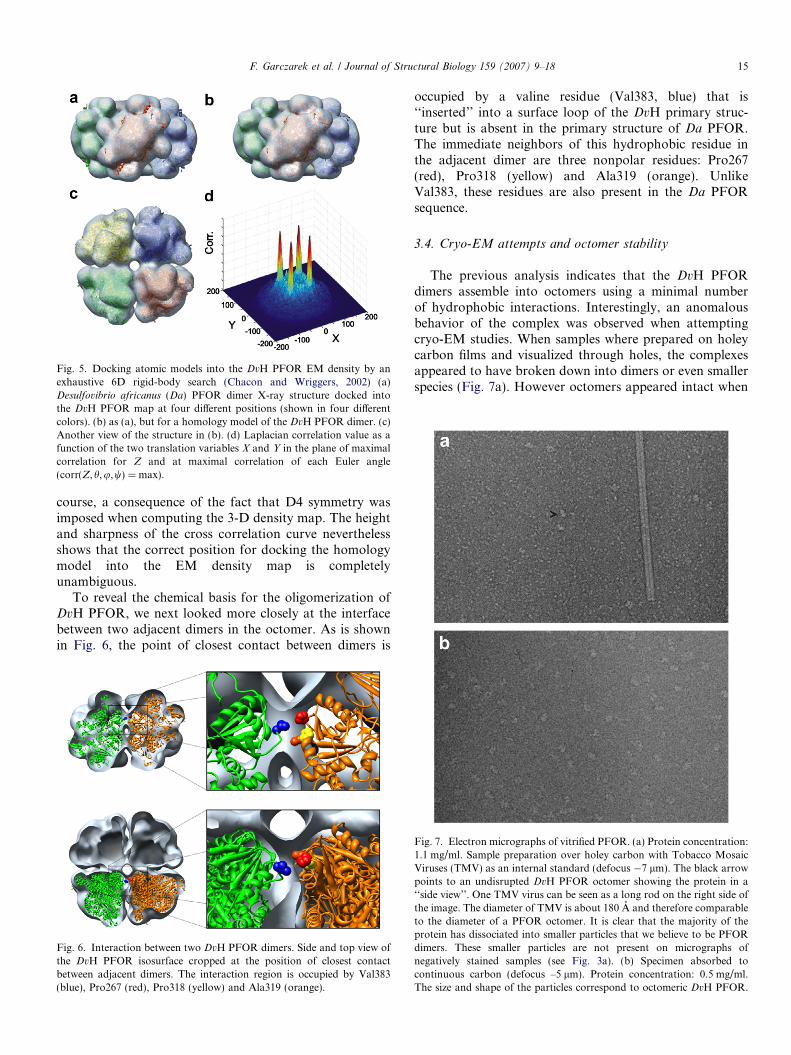
Fig. 5. Docking atomic models into the DvH PFOR EM density by anexhaustive 6D rigid-body search (Chacon and Wriggers, 2002) (a)Desulfovibrio africanus (Da) PFOR dimer X-ray structure docked intothe DvH PFOR map at four different positions (shown in four differentcolors). (b) as (a), but for a homology model of the DvH PFOR dimer. (c)Another view of the structure in (b). (d) Laplacian correlation value as afunction of the two translation variables X and Y in the plane of maximalcorrelation for Z and at maximal correlation of each Euler angle(corr(Z,h,u,w) = max).
F. Garczarek et al. / Journal of Structural Biology 159 (2007) 9–18 15
course, a consequence of the fact that D4 symmetry wasimposed when computing the 3-D density map. The heightand sharpness of the cross correlation curve neverthelessshows that the correct position for docking the homologymodel into the EM density map is completelyunambiguous.
To reveal the chemical basis for the oligomerization ofDvH PFOR, we next looked more closely at the interfacebetween two adjacent dimers in the octomer. As is shownin Fig. 6, the point of closest contact between dimers is
Fig. 6. Interaction between two DvH PFOR dimers. Side and top view ofthe DvH PFOR isosurface cropped at the position of closest contactbetween adjacent dimers. The interaction region is occupied by Val383(blue), Pro267 (red), Pro318 (yellow) and Ala319 (orange).
occupied by a valine residue (Val383, blue) that is‘‘inserted’’ into a surface loop of the DvH primary struc-ture but is absent in the primary structure of Da PFOR.The immediate neighbors of this hydrophobic residue inthe adjacent dimer are three nonpolar residues: Pro267(red), Pro318 (yellow) and Ala319 (orange). UnlikeVal383, these residues are also present in the Da PFORsequence.
3.4. Cryo-EM attempts and octomer stability
The previous analysis indicates that the DvH PFORdimers assemble into octomers using a minimal numberof hydrophobic interactions. Interestingly, an anomalousbehavior of the complex was observed when attemptingcryo-EM studies. When samples where prepared on holeycarbon films and visualized through holes, the complexesappeared to have broken down into dimers or even smallerspecies (Fig. 7a). However octomers appeared intact when
Fig. 7. Electron micrographs of vitrified PFOR. (a) Protein concentration:1.1 mg/ml. Sample preparation over holey carbon with Tobacco MosaicViruses (TMV) as an internal standard (defocus �7 lm). The black arrowpoints to an undisrupted DvH PFOR octomer showing the protein in a‘‘side view’’. One TMV virus can be seen as a long rod on the right side ofthe image. The diameter of TMV is about 180 A and therefore comparableto the diameter of a PFOR octomer. It is clear that the majority of theprotein has dissociated into smaller particles that we believe to be PFORdimers. These smaller particles are not present on micrographs ofnegatively stained samples (see Fig. 3a). (b) Specimen absorbed tocontinuous carbon (defocus –5 lm). Protein concentration: 0.5 mg/ml.The size and shape of the particles correspond to octomeric DvH PFOR.
16 F. Garczarek et al. / Journal of Structural Biology 159 (2007) 9–18
samples were prepared on a continuous carbon film(Fig. 7b). When PFOR octomers were crosslinked withgluteraldehyde they remained intact, even when preparedon holey carbon (data not shown).
Sample preparation over holes contains a step where theprotein is confined for a brief period of time (before it getsvitrified) between two closely apposed, fresh air–waterinterfaces. Since the thickness of the water layer is, in theideal case, not much greater than the size of the proteinitself, a freely mobile protein can collide multiple timeswith the water/air interface. In the worst case, adsorptionto the air–water interface will denature the protein (Dickin-son, 1999). In the case of DvH PFOR it seems that thehydrophobic residues which are responsible for assemblyof the octomer also have a high affinity for the air interface.
It is reasonable that the disassembly of the complex canbe avoided, to a large extent, by immobilizing the proteinon a hydrophilic surface. The rationale is that binding ofa protein via electrostatic forces on a freshly glow dis-charged carbon film (Dubochet et al., 1982) restrains theparticle from colliding with a fresh air–water interfaceshortly after blotting the sample. The preparation of ice-embedded samples on continuous carbon has some disad-vantages, however, one of which is that the carbon filmadds noise to the images and another being the possibilityof preferential orientation of particles. Fortunately, thesymmetry present in the DvH PFOR complex allows pro-cessing with higher noise level, and the particles seem toadopt multiple orientations on the carbon support (as dem-onstrated by our negative stain studies), likely due to thepresence of multiple patches of positive charge on its sur-face that have the potential to allow for multiple adsorp-tion orientations.
4. Discussion
Our study shows that pyruvate-ferredoxin oxidoreduc-tase from Desulfovibrio vulgaris Hildenborough is ahomo-octomer with a molecular weight of about 1 MDa.Two monomers of this enzyme assemble into a dimer ina very similar manner to that observed for the closelyrelated species Desulfovibrio africanus. While PFORremains a dimer in Da, the DvH PFOR dimers further oli-gomerize into a higher-symmetry complex. The increasedsize as well as the D4-symmetry makes this complex idealfor characterization by electron microscopy and single par-ticle reconstruction.
The overall structure of the PFOR octomer that isdeduced from 3-D electron microscopy of negativelystained samples shows that the surface contour of the pro-tein is well preserved by using an ammonium molybdate,trehalose mixture as a negative stain. The accurate dockingand the tight match of the homology model and the EMmap indicate that no significant molecular flattening or dis-order of exposed domains occurs during specimen prepara-tion. This is most likely because the collapse of thespecimen due to dehydration was prevented by the stabiliz-
ing and protecting properties of trehalose (Harris et al.,1996), although the globular character of the monomerand its tight D4 packing in the octomer may also play arole in the mechanical robustness of the complex. Theremarkable sensitivity and accuracy of the surface contourin our reconstruction is fully appreciated after docking theDa PFOR structure into the DvH EM map. The additionalshort C-terminal a-helix that is present in Da PFOR clearlysticks out of the volume in Fig. 5a, indicating that this helixis absent in DvH PFOR, as corroborated by the gene-sequence information.
A realistic three-dimensional model of the DvH PFORoctomer was obtained by combining homology modelingand structural docking. The resulting DvH PFOR octomermodel clearly shows that a valine residue, which is insertedinto a surface loop of the DvH PFOR, sits precisely at thepoint of closest contact between adjacent dimers in theoctomer in an area of high protein density. It should benoted that the actual conformations of the displayed sidechains cannot be known from computational modelingbased on docking a homology structure into an EM struc-ture at this resolution (17 A). Nevertheless, it can beassumed that at least the peptide backbone positions arereasonably accurate due to the high homology betweenthe two proteins and the precise docking. Therefore onecan be confident that the insertion of Val383 into a DvHPFOR surface loop plays a significant role in formationof an octomeric complex, doing so through a hydrophobicinteraction with Ala319.
Beside this insertion, other replacements of hydrophilicamino acids with hydrophobic ones can be noted withinthe sequence that is shown in Fig. 4. None of these substi-tutions are found in the vicinity of the dimer–dimer inter-action sites, however. Thus, the insertion of a singlevaline residue might be exclusively responsible for the for-mation of a PFOR octomer in DvH. The valine insertionfound in the DvH PFOR sequence is also found in PFORfrom Desulfovibrio desulfuricans (Dd) at exactly the sameposition (Fig. 4). The quaternary structure of Dd PFORis not known yet, but it can now be predicted that it wouldcorrespond to the homo-octomeric structure of DvHPFOR.
In order for the DvH PFOR to perform its enzymaticreaction, it is crucial that the binding site for ferredoxinis not sterically occluded when the dimers are assembledinto the octomeric complex. Once the homology modelwas built, therefore, we asked whether the ferredoxin bind-ing site in the proposed structure of the octomer was stillfully exposed to solvent. Fig. 8 shows the surface of thePFOR octomer, colored according to the electrostaticpotential of the homology dimer. Blue represents positivepotential, red negative, and zero potential is white. Onthe basis of NMR restrained docking it has been proposedthat ferredoxin binds to the Da PFOR dimer at a positionclose to the distal [4Fe–4S] cluster (Pieulle et al., 2004). Thebinding sites of the negatively charged ferredoxin moleculeare expected to be dominated by electrostatic forces, i.e. by
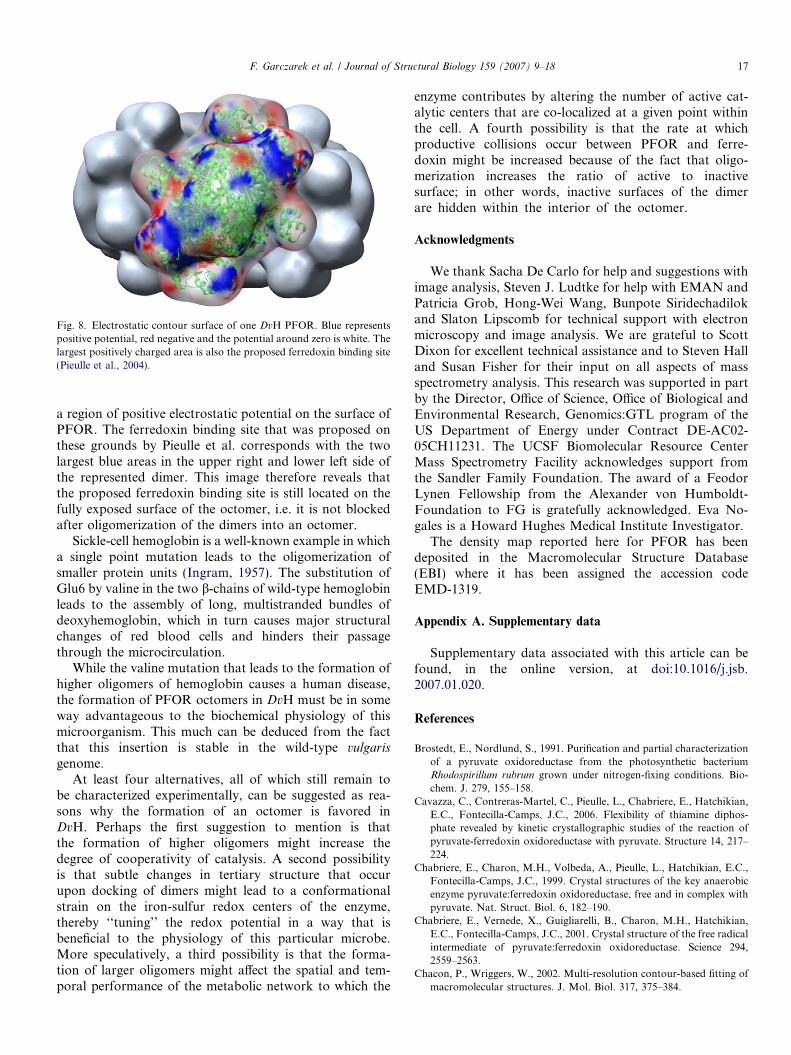
Fig. 8. Electrostatic contour surface of one DvH PFOR. Blue representspositive potential, red negative and the potential around zero is white. Thelargest positively charged area is also the proposed ferredoxin binding site(Pieulle et al., 2004).
F. Garczarek et al. / Journal of Structural Biology 159 (2007) 9–18 17
a region of positive electrostatic potential on the surface ofPFOR. The ferredoxin binding site that was proposed onthese grounds by Pieulle et al. corresponds with the twolargest blue areas in the upper right and lower left side ofthe represented dimer. This image therefore reveals thatthe proposed ferredoxin binding site is still located on thefully exposed surface of the octomer, i.e. it is not blockedafter oligomerization of the dimers into an octomer.
Sickle-cell hemoglobin is a well-known example in whicha single point mutation leads to the oligomerization ofsmaller protein units (Ingram, 1957). The substitution ofGlu6 by valine in the two b-chains of wild-type hemoglobinleads to the assembly of long, multistranded bundles ofdeoxyhemoglobin, which in turn causes major structuralchanges of red blood cells and hinders their passagethrough the microcirculation.
While the valine mutation that leads to the formation ofhigher oligomers of hemoglobin causes a human disease,the formation of PFOR octomers in DvH must be in someway advantageous to the biochemical physiology of thismicroorganism. This much can be deduced from the factthat this insertion is stable in the wild-type vulgaris
genome.At least four alternatives, all of which still remain to
be characterized experimentally, can be suggested as rea-sons why the formation of an octomer is favored inDvH. Perhaps the first suggestion to mention is thatthe formation of higher oligomers might increase thedegree of cooperativity of catalysis. A second possibilityis that subtle changes in tertiary structure that occurupon docking of dimers might lead to a conformationalstrain on the iron-sulfur redox centers of the enzyme,thereby ‘‘tuning’’ the redox potential in a way that isbeneficial to the physiology of this particular microbe.More speculatively, a third possibility is that the forma-tion of larger oligomers might affect the spatial and tem-poral performance of the metabolic network to which the
enzyme contributes by altering the number of active cat-alytic centers that are co-localized at a given point withinthe cell. A fourth possibility is that the rate at whichproductive collisions occur between PFOR and ferre-doxin might be increased because of the fact that oligo-merization increases the ratio of active to inactivesurface; in other words, inactive surfaces of the dimerare hidden within the interior of the octomer.
Acknowledgments
We thank Sacha De Carlo for help and suggestions withimage analysis, Steven J. Ludtke for help with EMAN andPatricia Grob, Hong-Wei Wang, Bunpote Siridechadilokand Slaton Lipscomb for technical support with electronmicroscopy and image analysis. We are grateful to ScottDixon for excellent technical assistance and to Steven Halland Susan Fisher for their input on all aspects of massspectrometry analysis. This research was supported in partby the Director, Office of Science, Office of Biological andEnvironmental Research, Genomics:GTL program of theUS Department of Energy under Contract DE-AC02-05CH11231. The UCSF Biomolecular Resource CenterMass Spectrometry Facility acknowledges support fromthe Sandler Family Foundation. The award of a FeodorLynen Fellowship from the Alexander von Humboldt-Foundation to FG is gratefully acknowledged. Eva No-gales is a Howard Hughes Medical Institute Investigator.
The density map reported here for PFOR has beendeposited in the Macromolecular Structure Database(EBI) where it has been assigned the accession codeEMD-1319.
Appendix A. Supplementary data
Supplementary data associated with this article can befound, in the online version, at doi:10.1016/j.jsb.2007.01.020.
References
Brostedt, E., Nordlund, S., 1991. Purification and partial characterizationof a pyruvate oxidoreductase from the photosynthetic bacteriumRhodospirillum rubrum grown under nitrogen-fixing conditions. Bio-chem. J. 279, 155–158.
Cavazza, C., Contreras-Martel, C., Pieulle, L., Chabriere, E., Hatchikian,E.C., Fontecilla-Camps, J.C., 2006. Flexibility of thiamine diphos-phate revealed by kinetic crystallographic studies of the reaction ofpyruvate-ferredoxin oxidoreductase with pyruvate. Structure 14, 217–224.
Chabriere, E., Charon, M.H., Volbeda, A., Pieulle, L., Hatchikian, E.C.,Fontecilla-Camps, J.C., 1999. Crystal structures of the key anaerobicenzyme pyruvate:ferredoxin oxidoreductase, free and in complex withpyruvate. Nat. Struct. Biol. 6, 182–190.
Chabriere, E., Vernede, X., Guigliarelli, B., Charon, M.H., Hatchikian,E.C., Fontecilla-Camps, J.C., 2001. Crystal structure of the free radicalintermediate of pyruvate:ferredoxin oxidoreductase. Science 294,2559–2563.
Chacon, P., Wriggers, W., 2002. Multi-resolution contour-based fitting ofmacromolecular structures. J. Mol. Biol. 317, 375–384.
18 F. Garczarek et al. / Journal of Structural Biology 159 (2007) 9–18
Charon, M.H., Volbeda, A., Chabriere, E., Pieulle, L., Fontecilla-Camps, J.C., 1999. Structure and electron transfer mechanism ofpyruvate:ferredoxin oxidoreductase. Curr. Opin. Struct. Biol. 9, 663–669.
Dickinson, E., 1999. Adsorbed protein layers at fluid interfaces: interac-tions, structure and surface rheology. Colloids Surf. B: Biointerfaces15, 161–176.
Dubochet, J., Groom, M., Mueller-Neuteboom, S., 1982. The mounting ofmacromolecules for electron microscopy with particular reference tosurface phenomena and the treatment of support films by glowdischarge. Adv. Opt. Electron Microsc. 8, 107–135.
Edgar, R.C., 2004. MUSCLE: a multiple sequence alignment method withreduced time and space complexity. BMC Bioinformatics 5, 113.
Frank, J., Radermacher, M., Penczek, P., Zhu, J., Li, Y., Ladjadj, M.,Leith, A., 1996. SPIDER and WEB: processing and visualization ofimages in 3D electron microscopy and related fields. J. Struct. Biol.116, 190–199.
Harris, J.R., Gerber, M., Gebauer, W., Wernicke, W., Markl, J., 1996.Negative stains containing trehalose: application to tubular andfilamentous structures. J. Microsc. Soc. Am. 2, 43–52.
Ikeda, T., Ochiai, T., Morita, S., Nishiyama, A., Yamada, E., Arai, H.,Ishii, M., Igarashi, Y., 2006. Anabolic five subunit-type pyruvate:fer-redoxin oxidoreductase from Hydrogenobacter thermphilus TK-6.Biochem. Biophys. Res. Commun. 340, 76–82.
Ingram, V.M., 1957. Gene mutations in human hemoglobin: the chemicaldifference between normal and sickle cell hemoglobin. Nature 180,326–328.
Jimenez, C.R., Huang, L., Qiu, Y., Burlingame, A.L., 2006. In-geldigestion of proteins for MALDI-MS fingerprint mapping. Curr. Prot.Prot. Sci., 16.4.2–16.4.4.
Kletzin, A., Adams, M.W., 1996. Molecular and phylogenetic character-ization of pyruvate and 2-ketoisovalerate ferredoxin oxidoreductasesfrom Pyrococcus furiosus and pyruvate ferredoxin oxidoreductase fromThermotoga maritima. J. Bacteriol. 178, 248–257.
Ludtke, S.J., Baldwin, P.R., Chiu, W., 1999. EMAN: semiautomatedsoftware for high-resolution single-particle reconstructions. J. Struct.Biol. 128, 82–97.
Mukhopadhyay, A., He, Z., Alm, E.J., Arkin, A.P., Baidoo, E.E., Borglin,S.C., Chen, W., Hazen, T.C., He, Q., Holman, H.Y., Huang, K.,Huang, R., Joyner, D.C., Katz, N., Keller, M., Oeller, P., Redding, A.,Sun, J., Wall, J., Wei, J., Yang, Z., Yen, H.C., Zhou, J., Keasling, J.D.,2006. Salt stress in Desulfovibrio vulgaris Hildenborough: an integratedgenomics approach. J. Bacteriol. 188, 4068–4078.
Pettersen, E.F., Goddard, T.D., Huang, C.C., Couch, G.S., Greenblatt,D.M., Meng, E.C., Ferrin, T.E., 2004. UCSF Chimera: a visualizationsystem for exploratory research and analysis. J. Comput. Chem. 25,1605–1612.
Pieulle, L., Nouailler, M., Morelli, X., Cavazza, C., Gallice, P., Blanchet,S., Bianco, P., Guerlesquin, F., Hatchikian, E.C., 2004. Multipleorientations in a physiological complex: the pyruvate-ferredoxinoxidoreductase-ferredoxin system. Biochemistry 43, 15480–15493.
Rocchia, W.E., Alexov, E., Honig, B., 2001. Extending the applicability ofthe nonlinear Poisson–Boltzmann equation: multiple dielectric con-stants and multivalent ions. J. Phys. Chem. B 105, 6507–6514.
Sali, A., Blundell, T.L., 1993. Comparative protein modeling by satisfac-tion of spatial restraints. J. Mol. Biol. 234, 779–815.
Yu, L., Ishida, T., Ozawa, K., Akutsu, H., Horiike, K., 2001. Purificationand characterization of homo- and hetero-dimeric acetate kinases fromthe sulfate-reducing bacterium Desulfovibrio vulgaris. J. Biochem.(Tokyo) 129, 411–421.