oda portfolio review 2020
TRANSCRIPT

© 2021 by the National Economic and Development Authority
All rights reserved. Any part of this publication may be used and reproduced, provided proper acknowledgement is made.
ODA Portfolio Review 2020
Published by:
National Economic and Development Authority12 St. Josemaria Escriva Drive, Ortigas Center,Pasig City 1605 PhilippinesTel: (+632) 631 0945 to 56E-mail: [email protected]://neda.gov.ph
Printed in the Philippines

Table of Contents
List of Tables V
List of Figures VII
List of Boxes VII
List of Annexes VIII
Acronyms X
Executive Summary XIV
1 The ODA Portfolio Review 1
2 The CY 2020 ODA Portfolio 3
2.1 ODA Distribution 5
2.2 ODA Status 17
2.3 Infrastructure Flagship Projects 24
3 Performance 28
3.1 Responsiveness of Program Loans to Financing Requirements 28
3.2 Financial Performance of Project Loans 30
3.3 Financial Performance of Project Loans of Implementing Agencies 34
3.4 Grants Financial Performance 40
3.5 Physical Performance 41
4 Results 46
4.1 Program/Project Results Contributing to the Philippine Development Plan and Results Matrices Sector Objectives
46
4.2 Evaluation Findings of Recently Completed Studies 50
5 Key Implementation Issues 51
5.1 Issues Affecting Implementation and Performance and Measures Taken/To Be Taken
51

5.2 Projects which Require Restructuring 54
5.3 Other Issues That Do Not Require ICC Action or Require Action Resolution at the Implementing Agency Level
68
5.4 Alert Mechanism 68
5.5 Projects with Incomplete Outputs at Loan Closing in CY 2020 71
5.6 Ongoing Projects with Damaged Outputs in CY 2020 72
5.7 Cost Overrun Stock as of CY 2020 73
6 Lessons Learned and Recommendations 74
6.1 Lessons Learned on Projects with Resolved Issues 74
6.2 Lessons Learned on Projects with Current Issues 77
6.3 Other Recommendations for 2021 and Beyond 80
7 Review of ODA Grants in the Philippines 81

v
List of Tables
Table 2.1 Comparison of CY 2019 and CY 2020 ODA Portfolio 4
Table 2.2 Share of Various Fund Categories to the Project Loans Portfolio 4
Table 2.3 ODA Distribution by Implementing/Executing Agency 5
Table 2.4 Sector Classification 7
Table 2.5 Sectoral Distribution of New ODA Loans and Grants in 2020 9
Table 2.6 Distribution of ODA Loans and Grants in 2020 by Area Coverage 11
Table 2.7 Cumulative ODA by Fund Source in USD Million 13
Table 2.8 New ODA Loans and Grants in CY 2020 by Fund Source 14
Table 2.9 Classification of ODA Projects by Gender-Responsiveness 17
Table 2.10 CY 2019 and CY 2020 Status of ODA Loans in USD Million by Loan Type 19
Table 2.11 Status of Loans in USD Million CY 2018-2020 20
Table 2.12 Status of ODA Loans for COVID-19 Response in CY 2020 21
Table 2.13 GPH-implemented ODA Grants by Type in CY 2020 24
Table 2.14 IFPs by Source of Financing 26
Table 2.15 ODA-funded IFPs by Development Partner 27
Table 2.16 ODA-funded IFPs by Status 27
Table 3.1 Financial Performance of Project Loans (2019 vs 2020) 31
Table 3.2 Disbursement Level in CY 2019 and CY 2020 31
Table 3.3 Disbursement Ratio of Project Loans in CY 2019 and CY 2020 32
Table 3.4 Actual Project Loans Disbursement Shortfall by Implementing Agency (IA) 32
Table 3.5 Project Loans with Availment Backlog by IA 33
Table 3.6 Financial Performance of Implementing/Executing Agencies for Project Loans 35
Table 3.7 Allotment Releases, Obligations, and Disbursement as of end 2020 35
Table 3.8 Multi-year Budget Requirements per Implementing Agency for FY 2021and Beyond
36

vi
Table 3.9 Commitment Fees Paid in CY 2019 and CY 2020 37
Table 3.10 Projects with Highest Commitment Fees Paid in CY 2020 Due to Implementation Delays
38
Table 3.11 Top Five Projects which Incurred Highest Commitment Fees 39
Table 3.12 Grant Utilization as of CY 2020 by Fund Source 40
Table 3.13 Physical Status of ODA-assisted Projects in 2020 42
Table 3.14 Physical Status of ODA Loan-assisted Projects by IA 43
Table 3.15 Physical Status and Target Completion Year of Loan-Assisted Project 44
Table 3.16 Physical Status of ODA Grant-assisted Projects by Fund Source 44
Table 4.1 ODA Loan/Grant-assisted Projects and Programs with Reported Outputsand Outcomes Contributing to the PDP-RM 2017-2022
47
Table 4.2 Results of the Philippines COVID-19 Emergency Response Project 48
Table 4.3 List of Evaluation Studies 49
Table 5.1 Classification and Incidence of Implementation Issues in CY 2020 52
Table 5.2 Projects with COVID-19-related Issues 53
Table 5.3 Projects with Restructuring Requests in 2020 54
Table 5.4 Projects Likely to be Restructured in 2021 66
Table 5.5 Summary of Alert Status of Ongoing Projects in 2019 and 2020 70
Table 5.6 Projects with Incomplete Outputs 71
Table 5.7 Projects with Damaged Outputs in 2020 73

vii
List of Figures
Figure 2.1 ODA Loans and Grants Distribution by Sector in CY 2020 8
Figure 2.2 Three-Year (CY 2018 to CY 2020) Comparison of ODA by Sector 10
Figure 2.3 Distribution of Region-specific ODA Loans and Grants in CY 2020 12
Figure 2.4 ODA Loans and Grants Supporting the Sustainable Development Goals 15
Figure 2.5 Magnitude of ODA Grants, in USD Million (CY 2018 to CY 2020) 22
Figure 2.6 Distribution of ODA Grant Assistance by Classification 23
List of Boxes
Box 2.1 Sustainable Development Goals 16
Box 2.2 CY 2020 ODA Loans Net Commitment in Original Currency 18
Box 2.3 Concessionality of ODA Loans to the Philippines 18
Box 2.4 Classification of ODA Grant Assistance 22
Box 3.1 Types of Program Loans 28
Box 3.2 Definition of Absorptive Capacity Indicators 38
Box 3.3 Commitment Fees Attributable to Implementation Delay and as Cost of Financing
38
Box 4.1 Outcomes Contributing to the Various PDP and RM Sector Objectives 46
Box 5.1 The NEDA Enhanced Alert Mechanism 69

viii
List of Annexes
Annex 2-A Total Project Cost by Implementing Agency
Annex 2-B DBCC-Approved Program Loans
Annex 2-C Distribution of Total ODA Loans Net Commitment by Sector and Sub-sector
Annex 2-D ODA Supporting the Sustainable Development Goals
Annex 2-E ODA Loans and Grants Responsive to Gender Promotion
Annex 2-F List of Active Loans
Annex 2-G Description of Active ODA Loans-assisted Programs and Projects
Annex 2-H Financing Terms of Development Partners
Annex 2-I Grant Element of Active ODA Loans
Annex 2-J Adjustments in the Reported ODA Loans Net Commitment in CY 2018 andCY 2019
Annex 2-K List of ODA Loans for COVID Response
Annex 2-L List of Active ODA Grants-assisted Projects
Annex 2-M List of Non-ODA Grants
Annex 2-N Infrastructure Flagship Projects with Active ODA Loans and Grants
Annex 3-A Financial Performance of Ongoing NG Program Loans
Annex 3-B Financial Performance of ODA Project Loans
Annex 3-C List of Active Project Loans with Availment Backlog
Annex 3-D Financial Performance of ODA Project Loans per Agency
Annex 3-E ODA Loans-assisted Projects’ Budgetary Performance
Annex 3-F Multi-year Budget Requirements
Annex 3-G Historical Data on Commitment Fees Paid CY 2006 to CY 2020
Annex 3-H Cumulative Commitment Fees Paid per Project CY 2002 to CY 2020
Annex 3-I Commitment Fees Paid by Implementing Agency CY 2014 to CY 2020
Annex 3-J Cumulative Commitment Fees Incurred by Projects with Active Loans as of December 2020

ix
Annex 3-K Commitment Fees Incurred by Projects in CY 2020 due to Implementation Delays
Annex 3-L Physical Status of ODA Loan-assisted Projects
Annex 3-M Physical Status of ODA Grant-assisted Projects
Annex 4-A Results of ODA Projects and Programs and their Alignment with the PDP-RMs
Annex 4-B Results of Evaluation Studies
Annex 4-C Dissemination and Utilization of Recently Completed Evaluation Studies
Annex 5-A List of Projects with Issues vis-à-vis Actions Taken
Annex 5-B Projects with Restructuring Requests in CY 2020
Annex 5-C Projects Likely to be Restructured in CY 2021
Annex 5-D List of Projects with Other Issues Not Needing ICC Actionwith Resolution at IA Level
Annex 5-E List of Actual Problem Projects as of December 2020
Annex 5-F Cost Overruns in CY 2020
Annex 7-A Results of ODA Grants

x
Acronyms
AARNR Agriculture, Agrarian Reform, and Natural Resources
ADB Asian Development Bank
AFD Agence Française de Développement
AIIB Asian Infrastructure Investment Bank
AM Alert Mechanism
BARMM Bangsamoro Autonomous Region in Muslim Mindanao
BOC Bureau of Customs
BIR Bureau of Internal Revenue
BSP Bangko Sentral ng Pilipinas
CAF Country Assistance Framework
CAR Cordillera Administrative Region
CCC Climate Change Commissio
CF Commitment Fee
CHR Commission on Human Rights
COA Commission on Audit
COVID-19 Coronavirus disease 2019
CPS Country Partnership Strategy
CWC Council for the Welfare of Children
CY Calendar Year
CTF Clean Technology Fund
DA Department of Agriculture
DAR Department of Agrarian Reform
DBCC Development Budget Coordination Committee
DBM Department of Budget and Management
DED Detailed Engineering Design

xi
DENR Department of Environment and Natural Resources
DEPED Department of Education
DFA Department of Foreign Affairs
DFAT Department of Foreign Affairs and Trade
DILG Department of the Interior and Local Government
DOE Department of Energy
DOF Department of Finance
DOLE Department of Labor and Employment
DOH Department of Health
DOST Department of Science and Technology
DOT Department of Tourism
DOTr Department of Transportation
DP Development Partner
DPWH Department of Public Works and Highways
DSWD Department of Social Welfare and Development
DTI Department of Trade and Industry
ECC Early Childhood Care and Development
EU European Union
FY Fiscal Year
GAD Gender and Development
GFI Government Financial Institution
GID Governance and Institutions Development
GOCC Government-owned and -controlled corporation
GPH Government of the Philippines
GPPB Government Procurement Policy Board
IA Implementing Agency
IBRD International Bank for Reconstruction and Development
ICC Investment Coordination Committee
ICC-CC Investment Coordination Committee - Cabinet Committee

xii
ICC-TB Investment Coordination Committee - Technical Board
IFAD International Fund for Agricultural Development
IFP Infrastructure Flagship Project
INFRA Infrastructure Development
INFRACOM Committee on Infrastructure
IOM International Organization for Migration
IPIF Infrastructure Preparation and Innovation Facility
ITT Industry, Trade, and Tourism
JICA Japan International Cooperation Agency
KEXIM-EDCF Korea Export-Import Bank - Economic Development Cooperation Fund
KOICA Korea International Cooperation Agency
LANDBANK Land Bank of the Philippines
LGU Local Government Unit
LWUA Local Water Utilities Administration
MINDA Mindanao Development Agency
MOA Memorandum of Agreement
MWCD Metropolitan Cebu Water District
MWSS Metropolitan Waterworks and Sewerage System
MYCA Multi-year Contracting Authority
NNC National Nutrition Council
NG National Government
NEDA National Economic and Development Authority
NGA National Government Agency
NEA National Electrification Administration
NIA National Irrigation Administration
NWRB National Water Resources Board
OA Oversight Agency
ODA Official Development Assistance
OECD Organization for Economic Cooperation and Development

xiii
OFID OPEC Fund for International Development
PAWD Philippine Association of Water Districts
PCC Philippine Competition Commission
PCR Project Completion Report
PCW Philippine Commission on Women
PDP Philippine Development Plan
PEMSEA Partnerships in Environmental Management for the Seas of East Asia
PhilHealth Philippine Health Insurance Corporation
PMO Project Management Office
POPCOM Commission on Population and Development
PPP Public-Private Partnership
RA Republic Act
RM Results Matrix
RoWA Right of Way Acquisition
SC Supreme Court
SEC Securities and Exchange Commission
SDG Sustainable Development Goals
SRCD Social Reform and Community Development
TESDA Technical Education and Skills Development Authority
TOR Terms of Reference
UN United Nations
UNDP United Nations Development Programme
UNFPA United Nations Population Fund
UNESCO United Nations Educational, Scientific and Cultural Organization
UNIDO United Nations Industrial Development Organization
UNOPS United Nations Office for Project Services
USA United States of America
USAID United States Agency for International Development
WB World Bank
WFP World Food Programme

xiv
Executive Summary
The Philippines was on track to becoming an upper middle-income economy, until the coronavirus disease 2019 (COVID-19) pandemic disrupted the country’s economic growth momentum and development trajectory. The unprecedented challenges brought by the pandemic prompted a shift in sourcing and utilizing Official Development Assistance (ODA) financing in the new normal, from project-specific to quick-disbursing program loans. In 2020, the government entered into several quick-disbursing program loans to deliver critical policy reforms in priority sectors, particularly on improving the country’s health system capacity and addressing the fiscal and economic impacts of the pandemic. The government also re-affirmed its commitment to ramp up spending on public infrastructure as one of the major drivers of economic recovery, given its multiplier effect in job generation and other economic activities.
ODA Portfolio Profile
The active ODA portfolio of the Philippines in 2020 amounted to USD30.69 billion, representing a 46.63 percent increase from USD20.93 billion in 2019. It consists of 30 program loans, 76 project loans, and 251 grants. Among these, 20 program loans, 14 project loans, and 25 grants were signed in 2020. Of the 106 loans, program loans increased by 136 percent, from USD5 billion (14 program loans) in 2019 to USD11.81 billion (30 program loans) in 2020. On the other hand, project loans increased by 20 percent, from USD14.29 billion (67 project loans) in 2019 to USD17.19 billion (76 project loans) in 2020. To support various programs and projects for COVID-19 response, the government entered into a total of 25 ODA loan agreements worth USD9.08 billion (USD8.16 billion for 20 program loans and USD915 million for 5 project loans). The infrastructure development sector recorded the largest share amounting to USD14.55 billion (47%) of the active ODA portfolio in 2020, followed by the governance and institutions development (GID) sector (24%), and the social reform and community development (SRCD) sector (20%). Japan remained the top provider of ODA to the country with USD11.18 billion (36.44%) worth of loans and grants, followed by the Asian Development Bank (ADB) (28.52%) and World Bank (WB) (20.97%).

xv
Performance
Financial performance of project loans and grants. There was a decline in the financial performance of project loans in terms of disbursement level, disbursement ratio, and availment rate (except for disbursement rate), largely due to delays in implementation of project activities resulting from the imposition of community quarantines in the country and related issues on travel restrictions, manpower reduction, and materials supply.
Specifically, the disbursement level of the total ODA project loans portfolio in 2020 decreased by 12.54 percent from the 2019 level (from USD1.21 billion in 2019 to USD1.06 billion in 2020). Disbursement ratio decreased by 2.67 percentage points (ppts) (from 10.72% in 2019 to 8.05% in 2020), while availment rate decreased by 5.67 ppts (from 70.53% in 2019 to 64.86% in 2020). Disbursement rate, however, increased by 2.41 ppts (from 64.28% in 2019 to 66.69% in 2020). The project loans portfolio registered a disbursement shortfall (target disbursements less actual disbursements) of USD569.62 million in 2020. Availment backlog (cumulative target disbursements less cumulative actual disbursements) also remained high at USD2.75 billion.
For active ODA grants, the overall utilization level in 2020 reached USD866.30 million, posting a utilization rate of 51.92 percent against the total grants portfolio amount of USD1.67 billion. This represents a 0.92-ppt increase in the utilization rate of grants compared to the same period in 2019 (51%).
Responsiveness of program loans to financing requirements. Program loans are designed for fiscal support, which are disbursed as needed following a financing program that is designed to bridge the fiscal deficit while keeping the debt-to-gross domestic product (GDP) level sustainable. Out of the total of USD11.81 billion for 30 program loans, 78 percent (USD9.22 billion for 27 program loans) was disbursed as of December 2020, in accordance with the National Government’s financing requirements. Out of the USD8.16 billion total amount of COVID-19 response-related program loans signed in 2020, a total of USD5.82 billion (71%) was disbursed as of year-end 2020. In addition, USD200 million was disbursed from a program loan secured in 2019 to support COVID-19 response. Physical performance of project loans and grants. Out of the 311 ongoing ODA-funded projects (60 loan-assisted projects and 251 grant-assisted projects), 72.03 percent (224 loan/grant-assisted projects) were implemented on schedule, 17.04 percent (53 loan/grant-assisted projects) were behind schedule, 9.32 percent (29 loan/grant-assisted projects) were completed, and 0.96 percent (three loan-assisted projects) accounted for project loans that closed with incomplete outputs, and 0.64 percent (two grant-assisted projects) with no reported status.

xvi
In terms of the physical status of the 60 loan-assisted projects, five projects were physically completed (8.33%), 24 projects were on schedule (40%), 28 projects were behind schedule (46.67%), and three projects closed with incomplete outputs (5%). Of the five completed loan-assisted projects in 2020, four projects were completed on time while one project was completed past due its target completion date. Of the 24 projects that were on schedule, three projects are expected to be completed in 2021, four projects to be completed in 2022, and 17 projects to be completed in 2023 onwards. Meanwhile, the implementation of 28 projects were behind schedule due to COVID-19 restrictions, issues on site condition/availability, delays in procurement and government/funding institution approvals, inadequate budget or delayed fund releases, issues on the design/scope/technical specifications of projects, as well as issues on the performance of contractors/consultants, institutional support, inputs and costs, among others. Of the 251 grant-assisted projects, 24 projects were completed (9.56%), 200 ongoing projects were on schedule (79.68%), 25 ongoing projects were behind schedule (9.96%), and two grant-assisted projects (0.8%) with no reported status.
Programs/Projects Results
ODA implementation yielded outputs and outcomes which are aligned with the national development priorities indicated in the Philippine Development Plan Results Matrices (PDP-RM) 2017-2022. ODA support for COVID-19 response primarily went to the government’s emergency cash assistance program and health system delivery through the provision of medical supplies and equipment, construction of isolation and quarantine facilities, and strengthening the capacity of existing health facilities. These interventions are gradually manifesting the intended results.
For the Calendar Year (CY) 2020 ODA review, 55 loan/grant-assisted projects reported outputs and outcomes which contributed to 58 sector outcome indicators in seven chapters of the PDP-RM 2017-2022. Meanwhile, there were 29 ODA loan/grant-assisted projects with no reported outputs as these either have newly-effective loans, are in pre-implementation stages (i.e., preliminary or detailed engineering design stage, procurement), just commenced implementation/construction within the year, or have yet to receive project funding.
xvii
Key implementation issues
Exogenous and endogenous factors affected the implementation of 87 ODA projects. The COVID-19 pandemic gave rise to new implementation issues, which required implementing and oversight agencies to adjust existing strategies/processes/policies and to ensure that ODA remains effective and adaptive to the new normal. Impact of COVID-19. The imposition of community quarantines to control the spread of COVID-19 in the entire country affected the implementation of 59 ongoing ODA programs and projects. Out of the 97 COVID-19-related issues which affected project implementation, 40 were already resolved. Site condition/availability. Out of the 33 issues related to site condition and availability (i.e., availability of project and resettlement sites, inadequacy of existing site structures, unanticipated geological conditions, issues on right-of-way and land acquisition, and peace and order concerns in the project area), which affected 22 projects, five issues were already resolved. Procurement. Of the 15 issues related to delays in procurement, which affected 13 projects, five issues were already resolved. Government/funding institution approvals. Out of the 22 issues related to government or funding institution approvals, which affected 14 projects, seven were already resolved. Budget and funds flow. Out of the 36 issues related to budget and funds flow (i.e., absence, lack of, or inadequate funding, delayed fund releases, and adverse movement of interest or exchange rates), which affected 26 projects, 12 issues were already resolved. Design, scope, and technical specifications. Of the 15 issues related to design, scope, and technical specifications (i.e., changes in project scope and specifications outside the agreed range and inadequate design resulting in facilities which are substandard or incapable of delivering services at anticipated cost and specified level), which affected 13 projects, four were already resolved.
Performance of contractors/consultants. Of the four issues reported on the poor performance of contractors/consultants (e.g., failure to provide contracted service to required specifications or failure of contractor’s financial and technical capacity to meet the project’s financial demands and technical specifications), which affected four projects, one issue was resolved.
Capacity of Project Management Offices (PMO) and other implementing partners. All three issues reported on the capacity of PMOs and other implementing partners (e.g., recruitment, turnover of

xviii
staff affecting project implementation, and low technical capacity to manage/implement the project), which affected two projects, were resolved. Institutional support. Five issues related to inadequate support or coordination with stakeholders or implementing partners, which affected five projects, remained unresolved by year-end. Inputs and cost. Of the 10 issues on inputs and costs (e.g., unavailability of required quantities and inadequacy in the quality of inputs/materials, or higher cost of inputs against anticipated cost at project design), which affected nine projects, four were already resolved. Other implementation issues. Out of the 24 issues related to legal matters or force majeure (e.g., major typhoons, flooding, or earthquakes), which affected 18 projects, eight were already resolved. Projects with restructuring requests in 2020. The National Economic and Development Authority (NEDA) received 33 restructuring requests involving 26 projects from various agencies. Out of the 33 requests, 22 were approved by the Investment Coordination Committee (ICC)-Technical Board (TB)/Cabinet Committee (CC)/NEDA Board, and two were approved by the Development Budget Coordination Committee (DBCC) in 2020. The remaining nine requests were still being reviewed by the ICC Secretariat as of end 2020.
Meanwhile, a total of 21 projects which encountered various implementation issues are likely to be restructured in 2021.
Lessons Learned and Recommendations
Lessons from the preparation, design, and implementation that affected the performance, outcome, and impact of various projects and programs were documented to serve as reference in improving future project/program design and implementation. Recommendations for implementing agencies include further strengthening capacity to manage projects and improving financial management and monitoring and evaluation. On projects with resolved issues. Concerted efforts of various government agencies facilitated the resolution of 89 implementation issues of projects during the year. These include the following facilitative actions, among others: (a) ICC omnibus ad referendum approval for project restructuring requests on time extensions and reallocations of loan proceeds; (b) Government Procurement Policy Board (GPPB) Resolution Nos. 16-2019 and 09-2020 allowing the use of digital signature in all procurement-related documents to mitigate the limitation of personal signing of bidding documents,
xix
and efficient conduct of procurement activities during state of calamities and to promote business continuity in the procurement process; (c) issuance of Administrative Order No. 32 on Expediting the review, and approval process of infrastructure flagship projects (IFPs) on water security; and (d) DFA’s issuance of the Guidelines for Streamlined Processing of Requests for Exemption from the Temporary Suspension of Visa Issuance to provide assistance to foreign nationals and expatriates facilitating the implementation of ODA-funded projects in the Philippines.
On projects with current issues. For projects with unresolved implementation issues (i.e., 175 reported issues on site condition, procurement, government funding/approval, budget and funds flow, design/scope/technical specifications, contractors’ performance, PMO capacity, institutional support, inputs/costs, and COVID-19-related concerns), more analysis, consultations, and specific interventions either at the implementation- or policy-level need to be pursued by the implementing agencies and coordinated for appropriate institutional responses from oversight agencies.
Review of ODA Grants in the Philippines
This report covers a brief review of the effectiveness of ODA grants provided by development partners (DPs) to the Philippine government (GPH). This also contains existing studies and assessments by DPs.
Grant assistance received from the eight largest providers of non-capital grants in the country (i.e., ADB, Australian Department of Foreign Affairs and Trade (DFAT), European Union (EU) Japan International Cooperation Agency (JICA), Korea International Cooperation Agency (KOICA), United Nations Development Programme (UNDP), United States Agency for International Development (USAID), and WB) were focused on the delivery and/or achievement of results anchored on recurring themes on inclusive economic growth, infrastructure, human development, and rural development. The provision of these grants is consistent with the multi-year country assistance frameworks of DPs with the Philippines. The reported outputs and outcomes of 45 grant-assisted projects were examined to highlight their responsiveness to the objectives/strategies of the PDP 2017-2022 and relevant country assistance frameworks (CAF).

ODA PORTFOLiO REviEW REPORT 2020 1
The ODA PortfolioReview
01Mandate
Republic Act (RA) No. 8182 or the ODA Act of 1996, as amended by RA 8555, mandates NEDA to conduct an annual review of the implementation of all projects financed through ODA. The outcomes of the review are reported by NEDA to Congress not later than June 30 of each year. The ODA Act complements the NEDA Board Resolution No. 30 series of 1992, which instructs the ICC to review all ongoing ODA-funded programs and projects to improve ODA absorptive capacity.
Objectives
The ODA portfolio review aims to: (a) report on the status of all projects financed through ODA, including their budgetary requirements; (b) identify key implementation issues, actual or prospective causes (e.g., procurement delays, cost overrun), and cross-cutting concerns hampering project implementation; (c) report on actions taken by concerned agencies to facilitate project implementation; (d) report on projects requiring restructuring; (e) report results (outputs and outcomes) derived from implementing ODA programs and projects; and (f) provide recommendations to improve portfolio performance.
Methodology
As provided under RA 8182, ODA is a loan or loan and grant that meets all of the following criteria: (a) administered with the objective of promoting sustainable social and economic development and welfare of the Philippines; (b) contracted with governments of foreign

2 NATIONAL ECONOMIC AND DEVELOPMENT AUTHORITY
countries with whom the Philippines has diplomatic, trade relations, or bilateral agreements or which are members of the United Nations (UN), their agencies and international or multilateral lending institutions; (c) there are no available comparable financial instruments in the capital market; and (d) must contain a grant element of at least 25 percent.1
The 2020 portfolio review covers active ODA loans and grants that were signed or became effective and supported programs and projects implemented/completed/which had ODA financing closed within the period of January 1, 2020 to December 31, 2020. Projects of government-owned and controlled corporations (GOCCs)/government financial institutions (GFIs) funded by foreign lenders/DPs, wherein borrowings are made pursuant to the original charters of GOCC/GFI or under special borrowing laws (amended Foreign Borrowings Act), were also covered in this review. In addition, while the ODA Act of 1996, as amended, only requires the reporting of loans and loans with grant counterpart, this review also covers standalone grant-assisted programs and projects reported by DPs.
The review process involved online2 consultations, discussions, and validation with 13 agencies with project portfolios financed through loans, ICC-approved grants, and a combination of loans and grants amounting to PHP300 million and above. Desk reviews3 were conducted with agencies whose portfolios only include purely grant-assisted projects. The review involves the participation of oversight agencies (OAs), namely, NEDA, Department of Budget and Management (DBM), Department of Finance (DOF), and Commission on Audit (COA), as well as various DPs.
Report structure
The ODA report is organized into seven sections, including this section. Section 2 provides an overview of the ODA portfolio in CY 2020, updates on ODA-funded IFPs implemented under the Build, Build, Build Program, and highlights on ODA-funded programs and projects contracted for COVID-19 response. Section 3 reports on the financial and physical performance of the ODA portfolio. Section 4 reports on the outcomes, outputs, and findings from the recently completed studies on ODA-funded programs and projects, whereas Section 5 discusses key implementation issues and problematic projects in CY 2020 and provides an assessment of the continued viability of ODA programs/projects. Section 6 presents the important lessons learned from project/program implementation and recommendations for 2021 and beyond. Lastly, Section 7 provides a brief review of ODA grant assistance projects in the Philippines.
1 Source: https://www.neda.gov.ph/oda-act-1996/2 Due to the imposition of the community quarantines in the country in response to the COVID-19 pandemic, consultations were conducted using various
digital platforms such as email, online messaging, video conferencing, short message service (SMS), among others.3 Desk review also involved consultations and validation activities with concerned agencies and DPs through official correspondences and email exchanges.
ODA PORTFOLiO REviEW REPORT 2020 3
In 2020, the country’s ODA portfolio size significantly increased to support various programs and projects for COVID-19 response, infrastructure development, governance and institutions development, social reform and community development, food security and environmental protection, and trade and investment.
The total ODA portfolio as of December 2020 increased by USD9.76 billion (46.63%), from USD20.93 billion (for 81 loans and 268 grants) in 2019 to USD30.69 billion (for 106 loans and 251 grants) in 2020. Proceeds from ODA in the portfolio supported 93 loan-assisted programs and projects and 251 grant-assisted projects. (Table 2.1).
The CY 2020 ODA Portfolio02
The total cost of the 67 loan-assisted projects, as approved by the ICC, amounted to PHP2.13 trillion, of which PHP477.10 billion or 22 percent was funded using government appropriations. The percent share of each fund category to the total cost of the entire portfolio is shown in Table 2.2 (refer to Annex 2-A for the list of ODA loan-assisted projects in 2020 and corresponding ICC-approved total project costs). Meanwhile, total cost for program loans, as approved by the DBCC, amounted to USD11.81 billion and was purely funded by loans. See Annex 2-B for the list of DBCC-approved program loans.

4 NATIONAL ECONOMIC AND DEVELOPMENT AUTHORITY
TABLE 2.2 SHARE OF VARIOUS FUND CATEGORIES TO THE PROJECT LOANS PORTFOLIO
Fund Category Amount(in PHP million)
Percent Share to Total Portfolio
Loan Proceeds 1,607,024.25 75.37
GPH Counterpart 477,096.78 22.38
Private Sector Counterpart 39,565.31 1.86
Local Government Unit (LGU)/Beneficiary Counterpart
7,420.08 0.35
Grant Proceeds 989.48 0.05
Total Project cost 2,132,095.90 100.00
4 Non-USD denominated loans and grants are converted in USD amounts based on the quarterly average BSP exchange rates as of Q4 2019.5 The total count includes one hybrid loan (Beneficiary First Social Protection Project/WB) that is counted twice, i.e., as program loan amounting to
USD580 million and as project loan amounting to USD20 million.6 Non-USD denominated loans and grants are converted in USD amounts based on the quarterly average BSP exchange rates as of Q4 2020.7 The CY 2019 total ODA loan net commitment was adjusted to reflect the cancellation of loans which closed in 2019 but with final notices of cancellation
from DPs received by the NEDA Secretariat only in 2020. This also included a correction in the loan amount of Italian Assistance to the Agrarian Reform Community Development Support Program (IARCDSP).
8 This includes one program supported by four loans and another program supported by two loans.
TABLE 2.1 COMPARISON OF CY 2019 AND CY 2020 ODA PORTFOLIO
ODA
CY 2019 CY 2020
Loan/ Grant Count
Commitments4 (in USDmillion)
Programs/ Projects
Supported by ODA
Loan5/ Grant Count
Commitments6 (in USD million)
Programs/ Projects
Supported by ODA
Loans 81 19,289.927 73 106 29,003.92 93
Programs 14 5,000.00 14 30 11,813.15 268
Projects 67 14,289.92 59 76 17,190.77 67
Grants 268 1,641.18 268 251 1,687.80 251
Projects 268 1,641.18 268 251 1,687.80 251
Total 349 20,931.10 341 357 30,691.72 344
Programs 14 5,000.00 14 30 11,813.15 26
Projects 335 15,931.10 327 327 18,878.57 318
ODA PORTFOLiO REviEW REPORT 2020 5
2.1 ODA Distribution
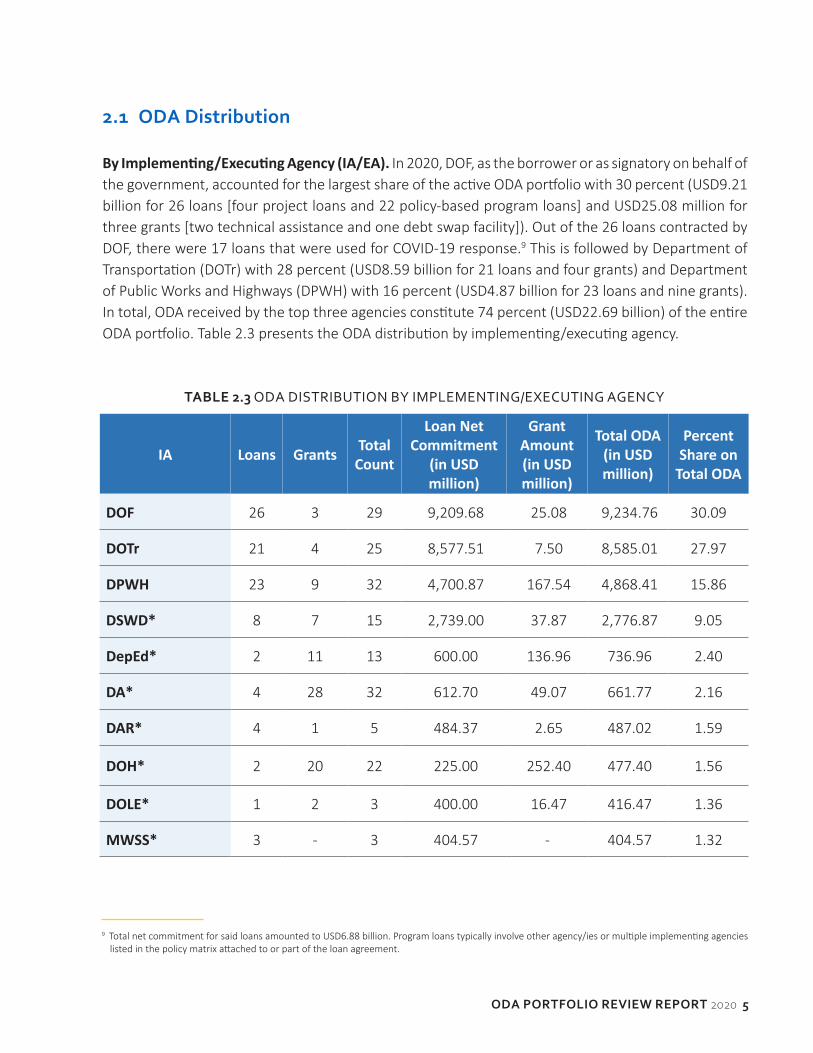
By Implementing/Executing Agency (IA/EA). In 2020, DOF, as the borrower or as signatory on behalf of the government, accounted for the largest share of the active ODA portfolio with 30 percent (USD9.21 billion for 26 loans [four project loans and 22 policy-based program loans] and USD25.08 million for three grants [two technical assistance and one debt swap facility]). Out of the 26 loans contracted by DOF, there were 17 loans that were used for COVID-19 response.9 This is followed by Department of Transportation (DOTr) with 28 percent (USD8.59 billion for 21 loans and four grants) and Department of Public Works and Highways (DPWH) with 16 percent (USD4.87 billion for 23 loans and nine grants). In total, ODA received by the top three agencies constitute 74 percent (USD22.69 billion) of the entire ODA portfolio. Table 2.3 presents the ODA distribution by implementing/executing agency.
TABLE 2.3 ODA DISTRIBUTION BY IMPLEMENTING/EXECUTING AGENCY
IA Loans Grants Total Count
Loan Net Commitment
(in USD million)
Grant Amount(in USD million)
Total ODA(in USD million)
Percent Share on
Total ODA
DOF 26 3 29 9,209.68 25.08 9,234.76 30.09
DOTr 21 4 25 8,577.51 7.50 8,585.01 27.97
DPWH 23 9 32 4,700.87 167.54 4,868.41 15.86
DSWD* 8 7 15 2,739.00 37.87 2,776.87 9.05
DepEd* 2 11 13 600.00 136.96 736.96 2.40
DA* 4 28 32 612.70 49.07 661.77 2.16
DAR* 4 1 5 484.37 2.65 487.02 1.59
DOH* 2 20 22 225.00 252.40 477.40 1.56
DOLE* 1 2 3 400.00 16.47 416.47 1.36
MWSS* 3 - 3 404.57 - 404.57 1.32
9 Total net commitment for said loans amounted to USD6.88 billion. Program loans typically involve other agency/ies or multiple implementing agencies listed in the policy matrix attached to or part of the loan agreement.

6 NATIONAL ECONOMIC AND DEVELOPMENT AUTHORITY
IA Loans Grants Total Count
Loan Net Commitment
(in USD million)
Grant Amount(in USD million)
Total ODA(in USD million)
Percent Share on
Total ODA
DP-Implemented10 - 59 59 - 389.41 389.41 1.27
NIA* 4 - 4 348.05 - 348.05 1.13
LANDBANK 2 4 6 322.17 18.57 340.74 1.11
Other IAs11 - 50 50 - 267.07 267.07 0.87
DENR* 2 15 17 145.52 79.16 224.68 0.73
Multi-agency - 14 14 - 135.63 135.63 0.44
BOC* 1 - 1 88.28 - 88.28 0.29
LGU-Implemented12 - 13 13 - 78.60 78.60 0.25
DTI* 1 4 5 62.90 7.50 70.40 0.23
LWUA* 1 2 3 60.00 3.00 63.00 0.21
PCC* 1 - 1 23.30 - 23.30 0.07
DOE* - 2 2 - 11.15 11.15 0.03
DILG* - 3 3 - 2.17 2.17 0.01
Grand Total 106 251 357 29,003.92 1,687.80 30,691.72 100.00
10 DP-implemented projects are grants that are administered directly by the DPs including Australia, Canada, EU, International Organization for Migration (IOM), KOICA, Netherlands, UN Habitat, UNDP, United Nations Educational, Scientific and Cultural Organization (UNESCO), United Nations Population Fund (UNFPA), United Nations Industrial Development Organization (UNIDO), United Nations Office for Project Services (UNOPS), and World Food Programme (WFP).
11 Other implementing agencies include: Bangsamoro Autonomous Region in Muslim Mindanao (BARMM) with eight projects; NEDA with seven projects; Climate Change Commission (CCC), Commission on Human Rights (CHR), and Securities and Exchange Commission (SEC) with three projects each; Council for the Welfare of Children (CWC), Mindanao Development Agency (MinDA), Philippine Association of Water Districts (PAWD), and Commission on Population and Development (POPCOM) with two projects each; and Bureau of Internal Revenue (BIR), Bangko Sentral ng Pilipinas (BSP), COA, Department of Science and Technology (DOST), Department of Tourism (DOT), Early Childhood Care and Development (ECCD) Council, Metropolitan Cebu Water District (MCWD), National Nutrition Council (NNC), National Water Resources Board (NWRB), Philippine Commission on Women (PCW), Partnerships in Environmental Management for the Seas of East Asia (PEMSEA), Philippine National Police (PNP), Public-Private Partnership (PPP) Center, Supreme Court (SC), and Technical Education and Skills Development Authority (TESDA) with one project each.
12 LGU-implemented projects are grants that are administered by the LGUs in National Capital Region (NCR), BARMM, Cordillera Administrative Region (CAR), Regions 2, 3, 4A, 4B, 5, 6, 7, 9, 11, 12, and 13.
*Department of Social Welfare and Development (DSWD), Department of Education (DepED), Department of Agriculture (DA), Department of Agrarian Reform (DAR), Department of Health (DOH), Department of Labor and Employment (DOLE), Metropolitan Waterworks and Sewerage System (MWSS), National Irrigation Administration (NIA), Land Bank of the Philippines (LANDBANK), Department of Environment and Natural Resources (DENR), Bureau of Customs (BOC), Department of Trade and Industry (DTI), Local Water Utilities Administration (LWUA), Philippine Competition Commission (PCC), Department of Energy (DOE), and Department of the Interior and Local Government (DILG).

ODA PORTFOLiO REviEW REPORT 2020 7
By Sector. ODA programs and projects are classified into five sectors: Agriculture, Agrarian Reform, and Natural Resources (AARNR); Governance and Institutions Development (GID); Industry, Trade, and Tourism (ITT); Infrastructure Development (INFRA); and Social Reform and Community Development (SRCD).
TABLE 2.4 SECTOR CLASSIFICATION
Sector Key Activities/ComponentsAARNR
Farm-to-market roads and bridges, irrigation systems/facilities, agriculture and enterprise development, agricultural credit, multi-purpose buildings, flood protection, solar dryers, warehouses, potable water supply, watershed conservation, forest management and agro-forestry, agribusiness, and environmental management (e.g., climate change, disaster risk reduction)
GID
Tax reforms, human resource development and management, judicial reforms, and local governance
ITT
Trade and investment, environmental technologies in industries, and microfinance and microenterprise development
INFRA
Power, energy, electrification, information communications technology, air, land (roads and bridges), rail, and water transportation, flood control and drainage, solid waste management, water supply and sanitation, and other public works (e.g., public markets, bus terminals)
SRCD
Primary, secondary, and tertiary education, technical and vocational education training, arts, culture, and humanities education, maternal and child health services, hospital services, nutrition and population, social welfare and development, multi-purpose buildings and school buildings, potable water supply, and water, sanitation and hygiene.

8 NATIONAL ECONOMIC AND DEVELOPMENT AUTHORITY
The INFRA sector accounted for the largest share of the active ODA portfolio with 47.42 percent (USD14.55 billion), followed by the GID sector with 24.34 percent (USD7.47 billion), the SRCD sector with 19.90 percent (USD6.11 billion), AARNR with 7.46 percent (USD2.29 billion), and the ITT sector with 0.88 percent (USD269.52 million) (see Figure 2.1 for loans and grants distribution by sector and Annex 2-C for the distribution of ODA loans by sector and sub-sector).
Sector Loans Grants Total Count
Loan Net Commitment
(in USD million)
Grant Amount(in USD million)
Total ODA(in USD million)
Percent Share on
Total ODA
INFRA 51 23 74 14,267.95 286.28 14,554.23 47.42
GID 20 56 76 7,004.86 463.95 7,468.81 24.34
SRCD 17 79 96 5,542.12 566.74 6,108.86 19.90
AARNR 16 80 96 2,037.81 252.49 2,290.30 7.46
ITT 2 13 15 151.18 118.34 269.52 0.88
Total 106 251 357 29,003.92 1,687.80 30,691.72 100.00
FiGURE 2.1 ODA LOANS AND GRANTS DISTRIBUTION BY SECTOR IN CY 2020
7.46%AARNR
0.88%iTT
24.34%GiD
47.42%iNFRA
19.90%SRCD

ODA PORTFOLiO REviEW REPORT 2020 9
TABLE 2.5 SECTORAL DISTRIBUTION OF NEW ODA LOANS AND GRANTS IN 2020
Sector Loans Loan Net
Commitment(in USD million)
Grant Count
Grant Amount(in USD million)
Total Count
Total ODA (in USD million)
Percent Share on Amount
GID 13 4,931.56 4 105.96 17 5,037.52 45.12
SRCD 11 3,403.12 3 22.63 14 3,425.75 30.69
INFRA13 7 1,830.68 1 - 8 1,830.68 16.40
AARNR 2 770.00 17 11.57 19 781.57 7.00
ITT 1 88.28 - - 1 88.28 0.79
Grand Total 34 11,023.64 25 140.16 59 11,163.80 100.00
A three-year comparison shows that investments in SRCD, GID, and ITT sectors significantly increased in 2020. While there was a continued increase in ODA to the INFRA sector, 2020 data showed that more ODA loans and grants were contracted in support of programs and projects toward COVID-19 response (SRCD and GID) and promotion of digital economy (ITT).
Meanwhile, for the 59 new ODA loans and grants that entered the portfolio in 2020 (Table 2.5), the GID sector accounted for the highest share with 45 percent (USD5.04 billion for 13 loans and four grants), followed by SRCD sector with 31 percent (USD3.43 billion for 11 loans and three grants). INFRA sector which historically accounted for the largest share only came in third with 16 percent (USD1.83 billion for seven loans).
13 This excludes the grant amount of the United Kingdom (UK)-assisted Global Future Cities due to unavailability of data.
10 NATIONAL ECONOMIC AND DEVELOPMENT AUTHORITY
14 Data for the CY 2018 and CY 2019 total ODA loan net commitment were adjusted to reflect the cancellation of loans which closed in 2018 and 2019, respectively, but with final notices of loan cancellation from DPs received by the NEDA Secretariat only in 2019 and 2020. This also included a correction in the loan amount of IARCDSP.
15 The three major classifications of area coverage are (a) nationwide; (b) multi-regional; and (c) region-specific. Region-specific programs/projects are implemented in only one region while multi-regional programs/projects are implemented in various regions of the country.
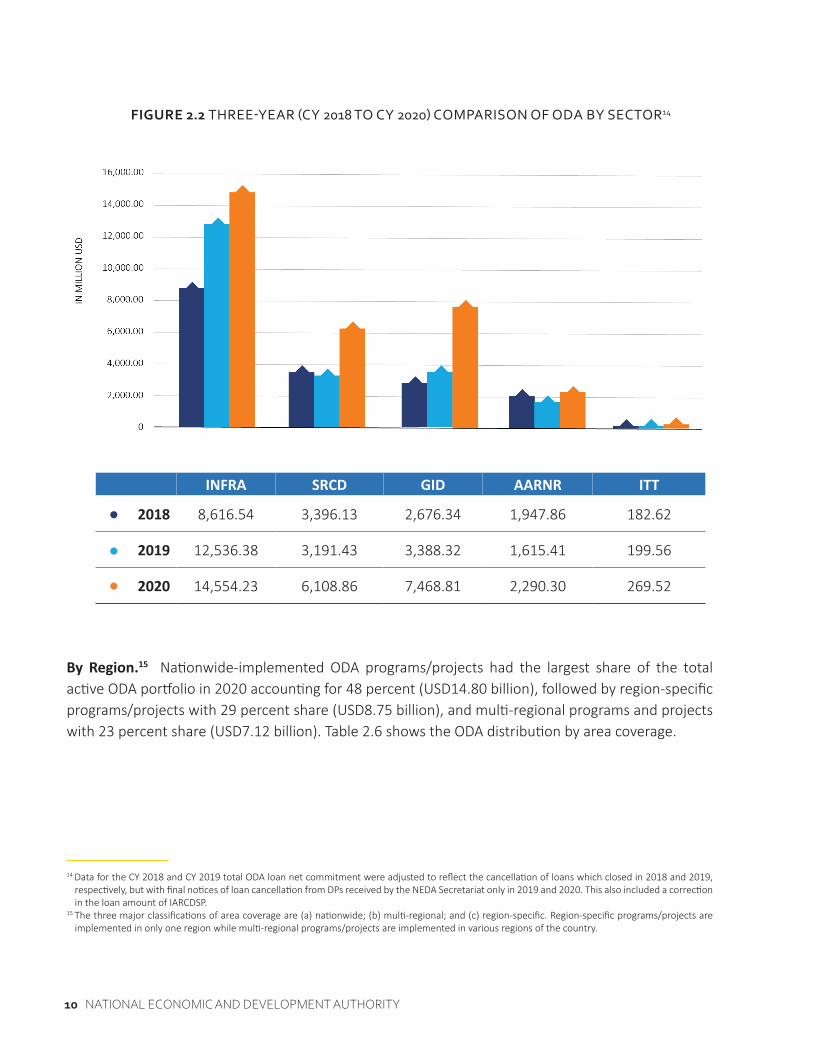
FiGURE 2.2 THREE-YEAR (CY 2018 TO CY 2020) COMPARISON OF ODA BY SECTOR14
INFRA SRCD GID AARNR ITT
2018 8,616.54 3,396.13 2,676.34 1,947.86 182.62
2019 12,536.38 3,191.43 3,388.32 1,615.41 199.56
2020 14,554.23 6,108.86 7,468.81 2,290.30 269.52
By Region.15 Nationwide-implemented ODA programs/projects had the largest share of the total active ODA portfolio in 2020 accounting for 48 percent (USD14.80 billion), followed by region-specific programs/projects with 29 percent share (USD8.75 billion), and multi-regional programs and projects with 23 percent share (USD7.12 billion). Table 2.6 shows the ODA distribution by area coverage.

ODA PORTFOLiO REviEW REPORT 2020 11
16 Area coverage for the Japan-assisted Non-Project Grant Aid for the provision of Medical Equipment to DOH is unspecified due to unavailability of data.
TABLE 2.6 DISTRIBUTION OF ODA LOANS AND GRANTS IN 2020 BY AREA COVERAGE
Coverage
Loans Grants Total
Count
Net Commitment
(in USDmillion)
Count
Net Commitment
(in USDmillion)
Count
Net Commitment
(in USDmillion)
Percent Share on
Total ODA Portfolio
Nationwide 48 14,037.08 136 766.34 184 14,803.42 48.23
Programs 28 11,013.15 - - 28 11,013.15 35.88
Projects 20 3,023.93 136 766.34 156 3,790.27 12.35
Multi-regional 20 6,614.32 62 501.86 82 7,116.18 23.19
Programs 1 500.00 - - 1 500.00 1.63
Projects 19 6,114.32 62 501.86 81 6,616.18 21.56
Region-specific 38 8,352.52 52 400.46 90 8,752.98 28.52
Programs 1 300.00 - - 1 300.00 0.98
Projects 37 8,052.52 52 400.46 89 8,452.98 27.54
Unspecified16 - - 1 19.14 1 19.14 0.06
Programs - - - - - - -
Projects - - 1 19.14 1 - 0.06
Total 106 29,003.92 251 1,687.60 357 30,691.72 100.00
Meanwhile, for region-specific programs and projects, the top five regions with the largest share of the ODA portfolio were NCR (34%), Central Luzon (22%), Central Visayas (19%), BARMM (9%), and Davao Region (6%). Figure 2.3 shows the distribution and the respective ODA net commitments for region-specific ODA programs and projects in 2020.

12 NATIONAL ECONOMIC AND DEVELOPMENT AUTHORITY
FiGURE 2.3 DISTRIBUTION OF REGION-SPECIFIC ODA LOANS AND GRANTS IN CY 2020
By Fund Source. Cumulatively, Japan is the top provider of ODA assistance to the country accounting for 36 percent (USD11.18 billion for 30 loans and 15 grants), followed by ADB with 29 percent (USD8.75 billion for 31 loans and 21 grants), and WB with 21 percent (USD6.44 billion for 22 loans and seven grants). Total assistance from the three DPs accounted for 86 percent of the ODA portfolio as of 2020. Table 2.7 provides the percentage distribution of active ODA by fund source.
1 NCR USD2,959.45 Million
2 Central Luzon USD1,887.77 Million
3 Central Visayas USD1,668.95 Million
4 BARMM USD800.19 Million
5 Davao Region USD564.71 Million
6 CALABARZON USD363.67 Million
7 Northern Mindanao USD231.91 Million
8 Western Visayas USD213.38 Million
9 Eastern Visayas USD32.63 Million
10 CAR USD10.34 Million
11 Cagayan Valley USD9.50 Million
12 MIMAROPA USD5.00 Million
13 Bicol USD3.24 Million
14 SOCCSKSARGEN USD2.07 Million
15 Zamboanga Peninsula USD0.18 Million
Total USD8,752.98 Million
1
6
12
8
9
13
11
10
2
3
7
5
4
14
15
COMMITMENT (IN USD MILLION)

ODA PORTFOLiO REviEW REPORT 2020 13
TABLE 2.7 CUMULATIVE ODA BY FUND SOURCE IN USD MILLION
Fund Source Loans Grants Total Count
Loan Net Commitment
(in USD million)
Grant Amount(in USD million)
Total ODA(in USD million)
Percent Share on Amount
Japan17 30 15 45 11,110.14 74.67 11,184.81 36.44
ADB 31 21 52 8,641.91 110.33 8,752.24 28.52
WB 22 7 29 6,405.30 29.80 6,435.10 20.97
AIIB 2 - 2 957.60 - 957.60 3.12
Korea18 7 14 21 731.77 78.13 809.90 2.64
China 3 2 5 493.08 127.66 620.74 2.02
USA - 36 36 - 555.78 555.78 1.81
France 4 3 7 451.09 1.71 452.80 1.48
UN System19 5 103 108 151.82 210.61 362.43 1.18
EU - 6 6 - 233.71 233.71 0.76
Australia - 18 18 - 176.77 176.77 0.58
Italy 1 2 3 31.21 6.24 37.45 0.12
Germany - 3 3 - 31.71 31.71 0.10
OFID 1 - 1 30.00 - 30.00 0.10
Netherlands - 6 6 - 21.36 21.36 0.07
Canada - 3 3 - 14.52 14.52 0.05
Spain - 6 6 - 10.55 10.55 0.03
New Zealand - 4 4 - 4.25 4.25 0.01
Switzerland20 - 1 1 - - - -
UK21 - 1 1 - - - -
Grand Total 106 251 357 29,003.92 1,687.80 30,691.72 100.00
17 Japan is composed of JICA and the Embassy of Japan (i.e., non-project grant aid).18 Korea is composed of the KOICA, Korea Rural Economic Institute, and Ministry of Agriculture Food and Rural Affairs - Education, Promotion and
Information Service.19 UN System is composed of Food and Agriculture Organization (FAO), International Fund for Agricultural Development (IFAD), IOM, UN HABITAT, UNDP,
UNESCO, UNFPA, UNICEF, UNIDO, UNOPS, WFP, and World Health Organization (WHO). Loans under the UN System refer to IFAD loans.20 This excludes the grant amount of the Switzerland-assisted Trade Capacity Building: Market Study – Philippines due to unavailability of data21 This excludes the grant amount of the UK-assisted Global Future Cities due to unavailability of data
14 NATIONAL ECONOMIC AND DEVELOPMENT AUTHORITY
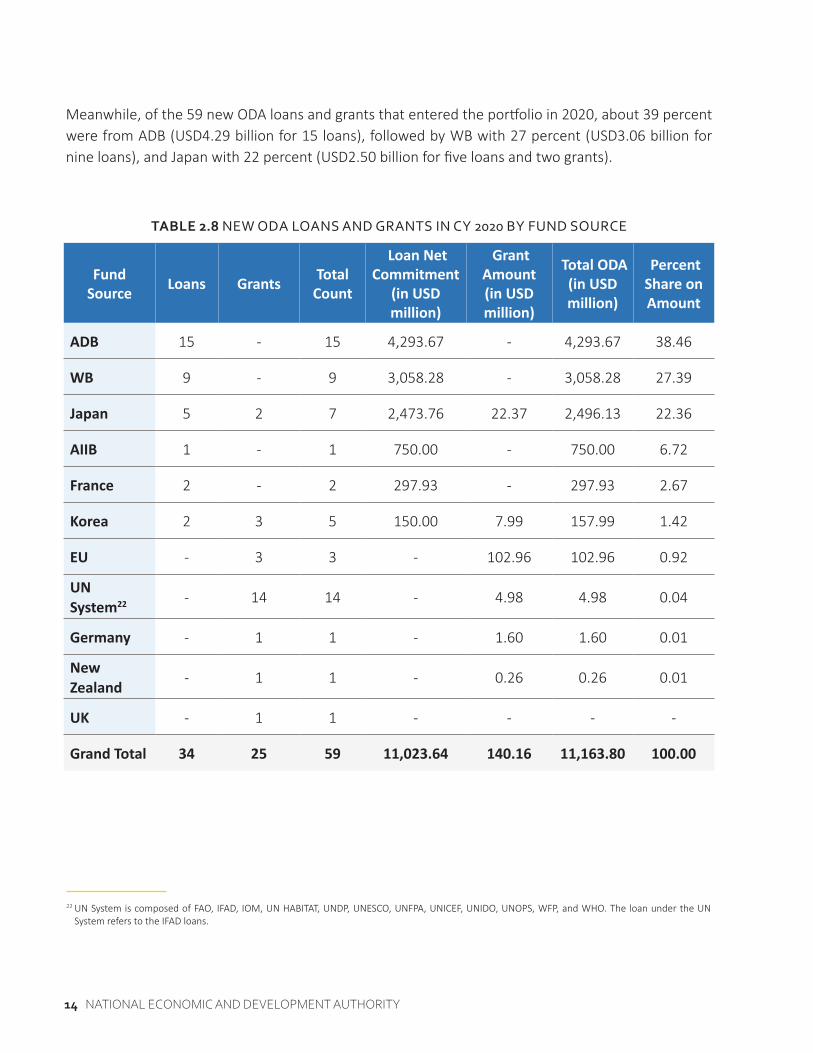
TABLE 2.8 NEW ODA LOANS AND GRANTS IN CY 2020 BY FUND SOURCE
Fund Source Loans Grants Total
Count
Loan Net Commitment
(in USD million)
Grant Amount(in USD million)
Total ODA(in USD million)
Percent Share on Amount
ADB 15 - 15 4,293.67 - 4,293.67 38.46
WB 9 - 9 3,058.28 - 3,058.28 27.39
Japan 5 2 7 2,473.76 22.37 2,496.13 22.36
AIIB 1 - 1 750.00 - 750.00 6.72
France 2 - 2 297.93 - 297.93 2.67
Korea 2 3 5 150.00 7.99 157.99 1.42
EU - 3 3 - 102.96 102.96 0.92
UN System22 - 14 14 - 4.98 4.98 0.04
Germany - 1 1 - 1.60 1.60 0.01
New Zealand - 1 1 - 0.26 0.26 0.01
UK - 1 1 - - - -
Grand Total 34 25 59 11,023.64 140.16 11,163.80 100.00
22 UN System is composed of FAO, IFAD, IOM, UN HABITAT, UNDP, UNESCO, UNFPA, UNICEF, UNIDO, UNOPS, WFP, and WHO. The loan under the UN System refers to the IFAD loans.
Meanwhile, of the 59 new ODA loans and grants that entered the portfolio in 2020, about 39 percent were from ADB (USD4.29 billion for 15 loans), followed by WB with 27 percent (USD3.06 billion for nine loans), and Japan with 22 percent (USD2.50 billion for five loans and two grants).

ODA PORTFOLiO REviEW REPORT 2020 15
Sustainable Development Goals (SDGs). For 2020, a total of 122 programs and projects, which were financed by 62 loans and 60 grants, supported the achievement of the 17 SDGs. The top three SDGs supported by ODA loans and grants are SDG 9 (Industry, Innovation and Infrastructure), SDG 1 (No Poverty), and SDG 4 (Quality Education), with 51, 27, and 26 ODA programs and projects, respectively (Figure 2.4). See Annex 2-D for the list of ODA loans and grants supporting the SDGs.
FiGURE 2.4 ODA PROGRAMS AND PROJECTS SUPPORTING THE SDGS
*A program/project may contribute to more than one SDG.
SUST
AIN
AB
LE D
EVEL
OP
MEN
T G
OA
LS

16 NATIONAL ECONOMIC AND DEVELOPMENT AUTHORITY
Promoting gender-responsiveness of projects. Since 2007, NEDA tracks the amount of ODA allotted for gender-responsive programs and projects, pursuant to RA 7192 (Women in Development and Nation-Building Act) and RA 9710 (Magna Carta of Women). RA 9710 specifically provides that “5 to 30 percent of funds received from foreign investments and multilateral agencies are in support of gender-responsive programs and projects.” The Harmonized Gender and Development (GAD) Guidelines is a tool in monitoring the gender responsiveness of ODA programs and projects. In 2020, about 78 percent of the ODA portfolio, with a total project cost of PHP520.51 billion (Table 2.9), with available GAD classification was accounted to be gender-responsive and gender-sensitive. Projects with promising GAD prospects comprised seven percent, while 15 percent registered as projects with invisible GAD initiatives. The complete list of agencies and projects is provided in Annex 2-E.
BOx 2.1 SUSTAINABLE DEVELOPMENT GOALS
Built on the success of the Millennium Development Goals and anchored on the 2030 Agenda, the SDGs are universal set of goals aimed towards ending poverty, protecting the planet, and ensuring that all people enjoy peace and prosperity. Adopted in September 2015 and made effective in January 2016, 193 partner countries of the United Nations commit to uphold the achievement of the following goals by 2030 (Source: United Nations (2016). Overview of the SDGs).
Image source: sdg.neda.gov.ph

ODA PORTFOLiO REviEW REPORT 2020 17
TABLE 2.9 CLASSIFICATION OF ODA PROJECTS BY GENDER-RESPONSIVENESS
ClassificationProjects
Count Percent Share
Total Project Cost(in PHP million)
PercentShare
Gender-responsive 12 44.44 469,317.13 85.01
Loans 8 465,349.09
Grants 4 3,968.04
Gender-sensitive 9 33.33 51,197.79 9.27
Loans 6 49,596.64
Grants 3 1,601.15
With Promising GAD Prospects 2 7.41 7,614.41 1.38
Loans 1 7,504.91
Grants 1 109.50
GAD is Invisible in the Project 4 14.81 23,949.17 4.34
Loans 2 23,938.00
Grants 2 11.17
Total 27 100.00 552,078.50 100.00
2.2 ODA Status
ODA Loans. The loans portfolio in 2020 amounted to USD29 billion for 76 project loans and 30 program loans worth USD17.19 billion and USD11.81 billion, respectively. The amount excludes loan cancellations amounting to USD244.34 million. The 30 program loans support 26 policy- and sector-based activities and investments,23 while 76 project loans support 67 projects.24 Annex 2-F provides the list of loans and Annex 2-G provides the description of loan-supported programs and projects.
23 There is one program supported by four loans and one program supported by two loans.24 There is one project supported by three loans, eight projects supported by two loans each, and two projects supported by one loan.

18 NATIONAL ECONOMIC AND DEVELOPMENT AUTHORITY
BOx 2.2 CY 2020 ODA LOANS NET COMMITMENT IN ORIGINAL CURRENCY
Loans contracted in original currencies are as follows:
Currency Loan CountNet Commitment in
Original Currency(in million)
Net Commitment (in USD million)
USD 61 16,075.05 16,075.05
JPY 29 1,139,701.70 10,908.10
KRW 6 706,406.00 631.77
EUR 9 1,149.71 1,370.14
SDR* 1 13.25 18.86
Total 106 29,003.92
*Special Drawing Rights
For the purpose of analysis and reporting, the non-USD denominated loans were converted to USD using the BSP average monthly foreign exchange rates for the last quarter of 2020.
BOx 2.3 CONCESSIONALITY OF ODA LOANS TO THE PHILIPPINES
The grant element is a measure of the concessionality of a loan calculated as the difference between the face value of a loan and the discounted present value of the service payments the borrower will make over the lifetime of the loan, expressed as a percentage of the face value (OECD).
Pursuant to the amended RA 8182 (ODA Act), ODA must contain a grant element of at least 25 percent. DOF computes for the grant element of direct loans of the National Government (NG); hence, excludes foreign borrowings/foreign loans of GOCCs/GFIs (usually guaranteed by the NG), which are incurred pursuant to their original charter or under special borrowing laws (e.g., Foreign Borrowings Act, as amended).
For the 33 new direct loans (does not include one guaranteed loan) that entered the NG in 2020, the weighted average grant element computed by DOF is 64.41 percent. The financing terms of DPs, such as interest rate, maturity (interval to final payment), and grace period interval to first payment of capital, are presented in Annex 2-H. Annex 2-I presents the grant element of all active ODA loans as of 2020.
Source: DOF (2021). Grant Element of Active ODA Loans in 2020.
ODA PORTFOLiO REviEW REPORT 2020 19
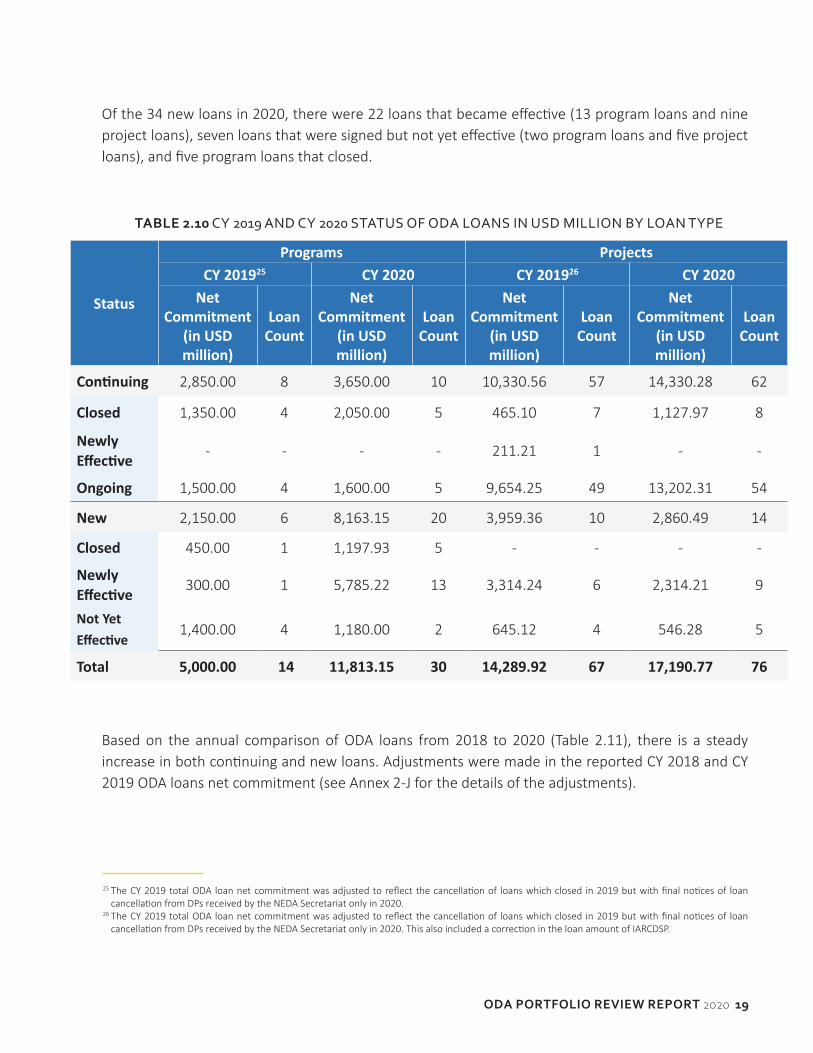
Of the 34 new loans in 2020, there were 22 loans that became effective (13 program loans and nine project loans), seven loans that were signed but not yet effective (two program loans and five project loans), and five program loans that closed.
TABLE 2.10 CY 2019 AND CY 2020 STATUS OF ODA LOANS IN USD MILLION BY LOAN TYPE
Status
Programs ProjectsCY 201925 CY 2020 CY 201926 CY 2020
Net Commitment
(in USD million)
Loan Count
Net Commitment
(in USD million)
Loan Count
Net Commitment
(in USD million)
Loan Count
Net Commitment
(in USD million)
Loan Count
Continuing 2,850.00 8 3,650.00 10 10,330.56 57 14,330.28 62
Closed 1,350.00 4 2,050.00 5 465.10 7 1,127.97 8
Newly Effective - - - - 211.21 1 - -
Ongoing 1,500.00 4 1,600.00 5 9,654.25 49 13,202.31 54
New 2,150.00 6 8,163.15 20 3,959.36 10 2,860.49 14
Closed 450.00 1 1,197.93 5 - - - -
Newly Effective 300.00 1 5,785.22 13 3,314.24 6 2,314.21 9
Not Yet Effective
1,400.00 4 1,180.00 2 645.12 4 546.28 5
Total 5,000.00 14 11,813.15 30 14,289.92 67 17,190.77 76
Based on the annual comparison of ODA loans from 2018 to 2020 (Table 2.11), there is a steady increase in both continuing and new loans. Adjustments were made in the reported CY 2018 and CY 2019 ODA loans net commitment (see Annex 2-J for the details of the adjustments).
25 The CY 2019 total ODA loan net commitment was adjusted to reflect the cancellation of loans which closed in 2019 but with final notices of loan cancellation from DPs received by the NEDA Secretariat only in 2020.
26 The CY 2019 total ODA loan net commitment was adjusted to reflect the cancellation of loans which closed in 2019 but with final notices of loan cancellation from DPs received by the NEDA Secretariat only in 2020. This also included a correction in the loan amount of IARCDSP.

20 NATIONAL ECONOMIC AND DEVELOPMENT AUTHORITY
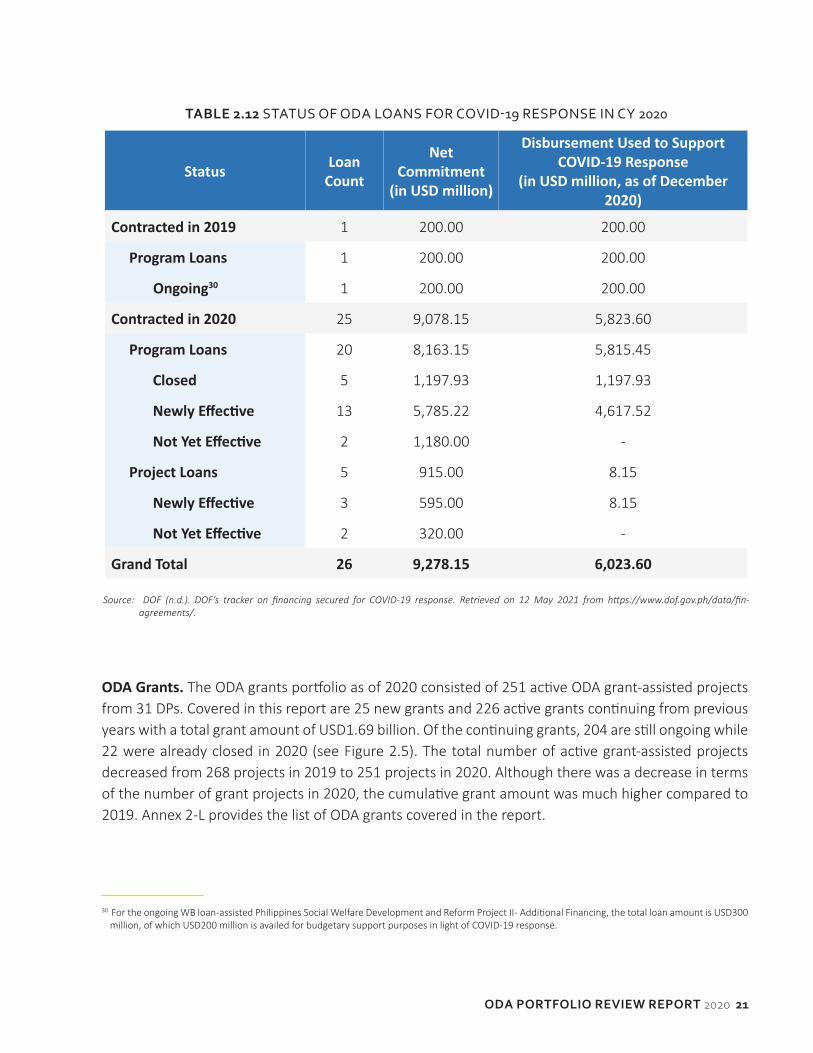
ODA for COVID-19 Response. In 2020, the government signed a total of 25 ODA loans29 worth USD9.08 billion (USD8.16 billion for 20 program loans and USD915 million for five project loans) in support of various programs and projects for COVID-19 response. Of the USD9.08 billion, 64 percent or USD5.82 billion was disbursed as of end 2020. In addition, USD200 million was disbursed from a program loan signed in 2019 to support COVID-19 response (see Table 2.12). Annex 2-K provides the list of loans for COVID-19 response and corresponding status as of December 2020.
27 The CY 2018 total ODA loan net commitment was adjusted to reflect the cancellation of loans which closed in 2018 but with final notices of loan cancellation from DPs received by the NEDA Secretariat only in 2019. This also included a correction in the loan amount of IARCDSP.
28 The CY 2019 total ODA loan net commitment was adjusted to reflect the cancellation of loans which closed in 2019 but with final notices of loan cancellation from DPs received by the NEDA Secretariat only in 2020. This also included a correction in the loan amount of IARCDSP.
29 This included one WB-assisted hybrid loan, i.e., Philippines Beneficiary FIRST Social Protection Project which was classified as both program and project loans.
TABLE 2.11 STATUS OF LOANS IN USD MILLION CY 2018-2020
Status
201827 201928 2020Amount(in USD million)
CountAmount(in USD million)
CountAmount(in USD million)
Count
Continuing 11,036.03 63 13,180.56 65 17,980.28 72
Closed 1,321.05 10 1,815.10 11 3,177.97 13
Terminated 33.18 2 - - - -
Newly Effective - - 211.21 1 - -
Ongoing 9,681.80 51 11,154.25 53 14,802.31 59
New 3,380.44 13 6,109.36 16 11,023.64 34
Closed - - 450.00 1 1,197.93 5
Newly Effective 2,493.22 9 3,614.24 7 8,099.43 22
Not Yet Effective 887.22 4 2,045.12 8 1,726.28 7
Total 14,416.47 76 19,289.92 81 29,003.92 106
ODA PORTFOLiO REviEW REPORT 2020 21
TABLE 2.12 STATUS OF ODA LOANS FOR COVID-19 RESPONSE IN CY 2020
Status Loan Count
Net Commitment
(in USD million)
Disbursement Used to Support COVID-19 Response
(in USD million, as of December 2020)
Contracted in 2019 1 200.00 200.00
Program Loans 1 200.00 200.00
Ongoing30 1 200.00 200.00
Contracted in 2020 25 9,078.15 5,823.60
Program Loans 20 8,163.15 5,815.45
Closed 5 1,197.93 1,197.93
Newly Effective 13 5,785.22 4,617.52
Not Yet Effective 2 1,180.00 -
Project Loans 5 915.00 8.15
Newly Effective 3 595.00 8.15
Not Yet Effective 2 320.00 -
Grand Total 26 9,278.15 6,023.60
Source: DOF (n.d.). DOF’s tracker on financing secured for COVID-19 response. Retrieved on 12 May 2021 from https://www.dof.gov.ph/data/fin-agreements/.
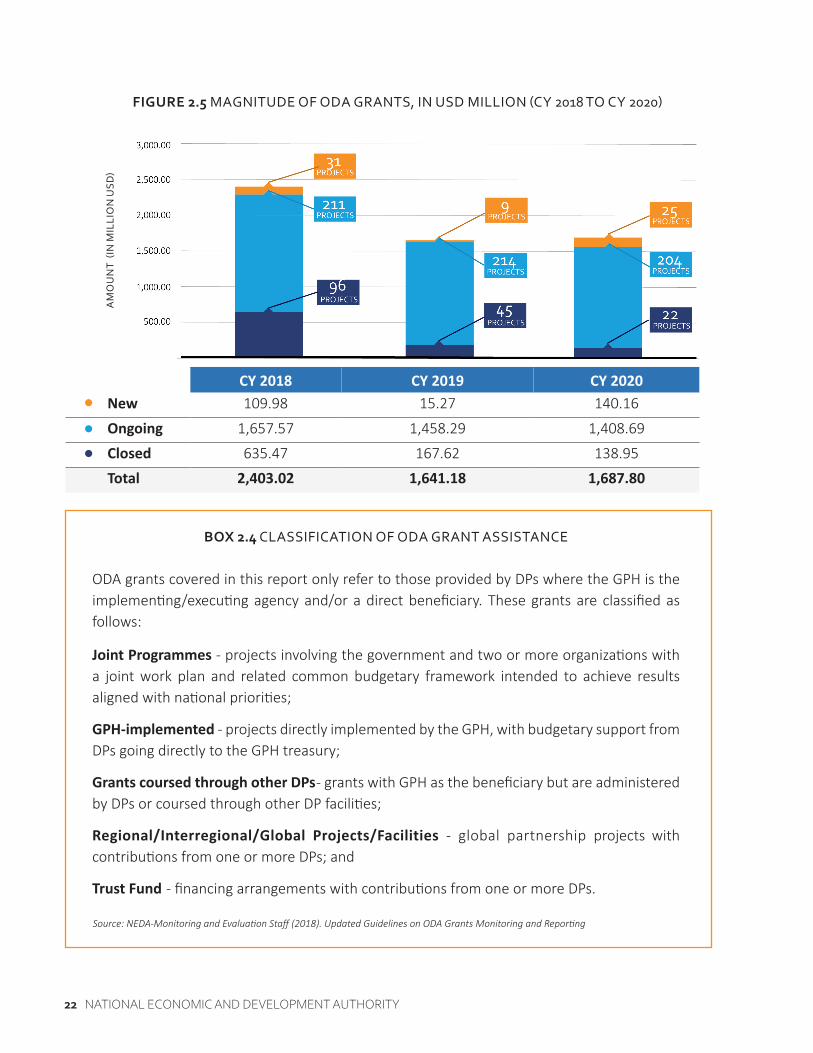
ODA Grants. The ODA grants portfolio as of 2020 consisted of 251 active ODA grant-assisted projects from 31 DPs. Covered in this report are 25 new grants and 226 active grants continuing from previous years with a total grant amount of USD1.69 billion. Of the continuing grants, 204 are still ongoing while 22 were already closed in 2020 (see Figure 2.5). The total number of active grant-assisted projects decreased from 268 projects in 2019 to 251 projects in 2020. Although there was a decrease in terms of the number of grant projects in 2020, the cumulative grant amount was much higher compared to 2019. Annex 2-L provides the list of ODA grants covered in the report.
30 For the ongoing WB loan-assisted Philippines Social Welfare Development and Reform Project II - Additional Financing, the total loan amount is USD300 million, of which USD200 million is availed for budgetary support purposes in light of COVID-19 response.
22 NATIONAL ECONOMIC AND DEVELOPMENT AUTHORITY
FiGURE 2.5 MAGNITUDE OF ODA GRANTS, IN USD MILLION (CY 2018 TO CY 2020)
BOx 2.4 CLASSIFICATION OF ODA GRANT ASSISTANCE
ODA grants covered in this report only refer to those provided by DPs where the GPH is the implementing/executing agency and/or a direct beneficiary. These grants are classified as follows:
Joint Programmes - projects involving the government and two or more organizations with a joint work plan and related common budgetary framework intended to achieve results aligned with national priorities;
GPH-implemented - projects directly implemented by the GPH, with budgetary support from DPs going directly to the GPH treasury;
Grants coursed through other DPs - grants with GPH as the beneficiary but are administered by DPs or coursed through other DP facilities;
Regional/Interregional/Global Projects/Facilities - global partnership projects with contributions from one or more DPs; and
Trust Fund - financing arrangements with contributions from one or more DPs.
Source: NEDA-Monitoring and Evaluation Staff (2018). Updated Guidelines on ODA Grants Monitoring and Reporting
CY 2018 CY 2019 CY 2020New 109.98 15.27 140.16
Ongoing 1,657.57 1,458.29 1,408.69
Closed 635.47 167.62 138.95
Total 2,403.02 1,641.18 1,687.80
AM
OU
NT
(IN
MIL
LIO
N U
SD)
ODA PORTFOLiO REviEW REPORT 2020 23
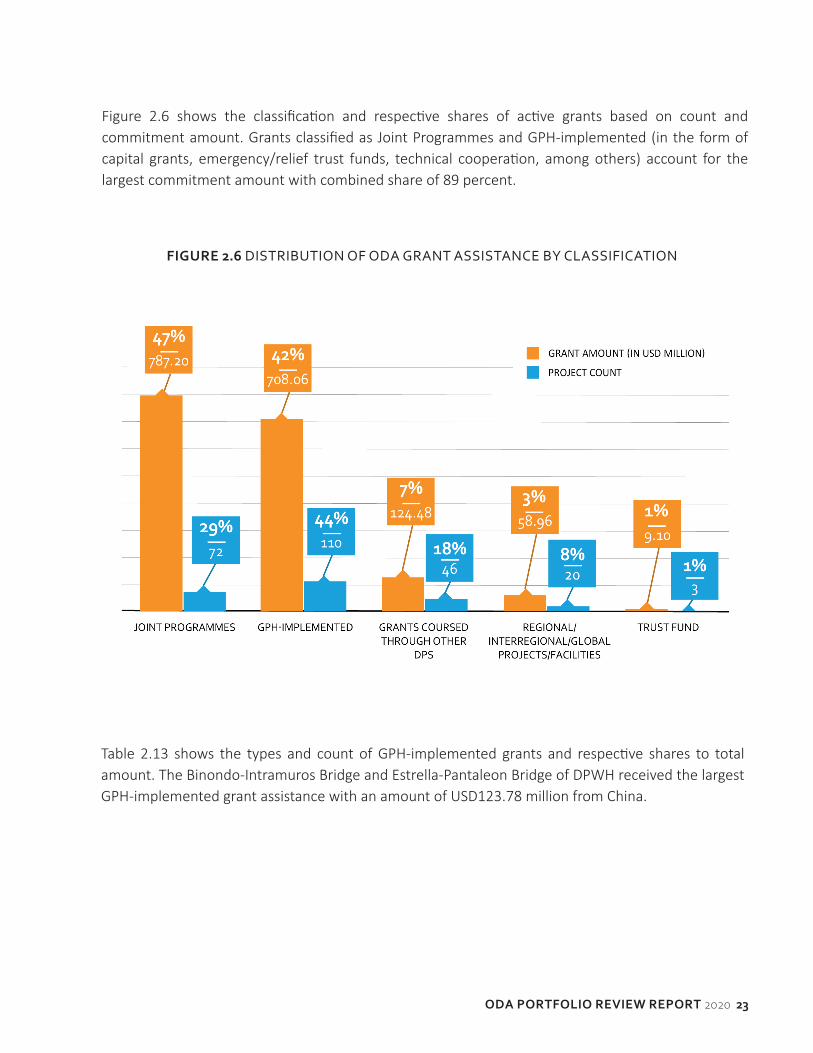
Figure 2.6 shows the classification and respective shares of active grants based on count and commitment amount. Grants classified as Joint Programmes and GPH-implemented (in the form of capital grants, emergency/relief trust funds, technical cooperation, among others) account for the largest commitment amount with combined share of 89 percent.
FiGURE 2.6 DISTRIBUTION OF ODA GRANT ASSISTANCE BY CLASSIFICATION
Table 2.13 shows the types and count of GPH-implemented grants and respective shares to total amount. The Binondo-Intramuros Bridge and Estrella-Pantaleon Bridge of DPWH received the largest GPH-implemented grant assistance with an amount of USD123.78 million from China.

24 NATIONAL ECONOMIC AND DEVELOPMENT AUTHORITY
TABLE 2.13 GPH-IMPLEMENTED ODA GRANTS BY TYPE IN CY 2020
Grant TypeTotal Grant
Amount(in USD million)
Percent Share Grant Count Percent Share
Mixed31 260.98 36.86 37 33.64
Capital Grants 162.53 22.95 4 3.64
Technical Cooperation 111.62 15.76 36 32.73
Technical Assistance 103.72 14.65 19 17.27
Emergency Relief 31.94 4.51 5 4.55
Trust Fund 29.80 4.21 7 6.36
Others 7.47 1.05 2 1.82
Total 708.06 100.00 110 100.00
Meanwhile, 14 DPs provided supplemental information on grants not classified as ODA but were channeled through civil society organizations, including non-government organizations and private sector groups. There were 134 programs/projects reported worth USD343.48 million (see Annex 2-M for the list of non-ODA grants).
2.3 infrastructure Flagship Projects
Background. The Build, Build, Build Program represents the government’s commitment to accelerate infrastructure development in the country. Infrastructure development remains among the top priorities of GPH in order to spur and sustain economic development, support a higher growth trajectory, and improve the quality of life in urban and rural communities.
Infrastructure Flagship Projects (IFPs). At the core of the government’s Build, Build, Build Program are the IFPs which are the most urgent and game-changing projects that are expected to greatly contribute to achieving the country’s development goals by improving connectivity and stimulating growth across the country. The IFPs were conceptualized in 2017 with the following objectives:
a. Prioritize game-changing and urgently needed projects of national significance;b. Facilitate the processing, approval, and implementation of the identified flagship projects;
31 Mixed grants refer to projects with components belonging to various grant types.

ODA PORTFOLiO REviEW REPORT 2020 25
c. Push substantial implementation on the ground to ensure continuity of pipeline projects into succeeding administrations.
The original list of 75 IFPs was presented and endorsed for adoption by the NEDA Board Committee on Infrastructure (INFRACOM) and the ICC-Cabinet Committee (CC) during their April 17, 2017 special joint meeting. On June 27, 2017, the NEDA Board approved the adoption of the 75 IFPs.
On November 29, 2019, the government updated the list of IFPs to ensure the relevance and responsiveness of the flagship projects to the development objectives of the country for the medium-term. The evolving list then contained 100 infrastructure projects (worth PHP4.35 trillion), wherein 36 projects were retained from the original 75 while 64 new projects were added.
Infrastructure program amid COVID-19 pandemic. The operations of several sectors of the economy were brought to a near standstill due to the imposition of community quarantine across the country. This held back business activities and affected most sectors, including construction and transportation. The following challenges were encountered in the implementation of infrastructure projects:
a. Delays in project preparation, procurement, and/or implementation due to disruption of work of contractors, professionals/experts/engineers, and workers/laborers involved in ODA-funded projects;
b. Interruption of importation of construction materials due to disruption of labor and materials supply;
c. Increase in costs of infrastructure projects due to requirements for social distancing and other health precautionary measures;
d. Diminished fiscal space allotted for infrastructure which was reallocated to the government’s COVID-19 response pursuant to RA No. 11494 or the “Bayanihan to Recover as One Act”;
e. Change in demand which affects the financial viability of PPP projects and the interest of the private sector in pursuing development projects; and
f. Difficulties in securing ODA due to the shifting priorities towards COVID-19 response.32
The national government reassessed and reprioritized its infrastructure development program to consider the available fiscal space for infrastructure, firm up budgetary requirements, and adjust its infrastructure spending strategy to support more health and social recovery programs. In line with this, the INFRACOM, in coordination with the Office of the Presidential Adviser on Flagship Programs and Projects, approved the revised list of IFPs on July 24, 2020, which includes 104 projects and incorporates measures addressing the new normal. The updated IFP was subsequently confirmed ad referendum by the NEDA Board on August 19, 2020.
32 Congressional Policy and Budget Research Department (CPBRD). The New Build! Build! Build! Program: Risks, Challenges and Policy Option. Retrieved from: https://cpbrd.congress.gov.ph/images/PDF%20Attachments/CPBRD%20Notes/CN2020-02_BBB_Revised.pdf

26 NATIONAL ECONOMIC AND DEVELOPMENT AUTHORITY
IFPs by Source of Financing. Table 2.14 shows the financing sources of the 104 IFPs. Majority of the IFPs are ODA-funded (worth PHP2.17 trillion), with a share of 52.55 percent. Aside from this, two projects were undertaken through mixed financing of ODA and PPP (worth PHP64.92 billion), as well as ODA and the General Appropriations Act (GAA) (worth PHP28.27 billion).
33 LRT Line 1 South Extension and LRT Line 2 East Extension are under one loan, “Capacity Enhancement of Mass Transit Systems in Metro Manila”
TABLE 2.14 IFPS BY SOURCE OF FINANCING
Source of Financing No. of Projects Indicative Cost (in PHP billion) Percent Share
ODA 48 2,170.31 52.55
PPP (Unsolicited) 18 1,399.37 33.88
PPP 8 240.16 5.82
GAA 25 180.32 4.37
ODA/PPP 1 64.92 1.57
ODA/GAA 1 28.27 0.68
GAA/PPP 1 26.63 0.64
Private 2 20.05 0.49
Total 104 4,130.02* 100.00
*Amount consistent with official data on the IFPs, as approved by the NEDA Board on August 19, 2020.
Status of ODA-funded IFPs. As of end 2020, there were 34 IFPs under the active/ongoing ODA portfolio. These projects have a total investment requirement of PHP1.74 trillion. (See Annex 2-N for the list of IFPs with active loans and grants.)
The 34 IFPs are supported by 36 active loans33 and four grants, majority of which are funded by Japan. Table 2.15 shows the number of IFPs per development partner.

ODA PORTFOLiO REviEW REPORT 2020 27
TABLE 2.15 ODA-FUNDED IFPS BY DP
Fund Source Project Count
Japan 14
ADB 6
China 6
Korea 5
WB 1
ADB and JICA 1
France and WB 1
Total 34
TABLE 2.16 ODA-FUNDED IFPS BY STATUS
Status Project Count
Pre-construction/Pre-implementation Stages 19
Under Construction/Implementation Stages 13
Completed 1
For Government Approval 1
Total 34
Table 2.16 shows the status of these projects as of December 2020.

ODA PORTFOLiO REviEW REPORT 2020 28
3.1 Responsiveness of Program Loans to Financing Requirements
In 2020, 22 out of the 30 policy-based program loans supported investments in local government finance, fiscal decentralization reforms, and disaster risk reduction. The remaining eight were sector-based program loans which supported activities for education, social welfare and development, infrastructure, and agriculture. Majority of the program loans contracted in 2020 were either provided in response to the pandemic or as budgetary support.
BOx 3.1 TYPES OF PROGRAM LOANS
The two types of program loans being implemented by the government are policy-based program loans and sector-based program loans. Policy-based program loans support structural reforms framed on certain policy conditionalities. Loan disbursements are not earmarked for activities/projects implemented by specific implementing agencies (IAs), but form part of the general cash envelope of the national government. On the other hand, sector-based program loans are used to finance IAs’ regular activities under a specific sector. Budget allocations and cash releases to the IAs follow the GPH budget execution processes.
Program loans have lower transaction cost. Since 2006, the share of program loans supported structural reforms (i.e., budgetary support, tax reforms, and governance), sector-based approaches (i.e., social welfare, health, education, agriculture, environment, and socioeconomic development), and post-disaster reconstruction.
Source: DOF (n.d.)
Performance03

29 NATIONAL ECONOMIC AND DEVELOPMENT AUTHORITY
Program loans are intended to provide fiscal support and are based on quick-disbursement procedures with the DPs. Disbursement triggers are based on policy reforms agreed upon between the government and the DPs. Some of these policy reforms include the following: (a) enactment of certain measures such as the Rice Tariffication Law,34 Agriculture Free Patent Reform Act,35 National Payment Systems Act,36 and Ease of Doing Business and Efficient Government Service Delivery Act37; and (b) submission of the proposed amendments to the 1991 Local Government Code for congressional approval.38
Disbursements of program loans are made as-needed following a financing program that is designed to bridge the fiscal deficit, while keeping the debt-to-GDP level sustainable. Out of the 30 program loans with total net commitment of USD11.81 billion, 27 program loans were able to disburse a cumulative amount of USD9.22 billion (78%). (See Annex 3-A for the financial performance of program loans.)
The sizable increase in program loan disbursements is a testament to the government’s prudent public financial management, and steadfast commitment to its development agenda. With DOF’s ability to access ultra-concessional financing amid the pandemic, the government managed to avoid putting pressure on the capital markets, which could drive interest rates up on commercial borrowings. The increase in program loan financing also shows that the government continued to deliver critical policy reforms in several priority sectors even with the challenges brought about by the COVID-19 pandemic.
34 Dominguez, C.G. (2020, June 11). [DOF Letter to Mr. Masatsugu Asakawa]. Competitive and Inclusive Agriculture Program Policy Matrix as cited in the ADB Report and Recommendation of the President to the Board of Directors on the Proposed Programmatic Approach and Policy-Based Loan for Subprogram 1: Republic of the Philippines: Competitive and Inclusive Agriculture Development Program. Retrieved from https://www.adb.org/sites/default/files/project-documents/53353/53353-001-rrp-en.pdf.
35 Ibid.36 Dominguez, C. G. (2020, April 6). [DOF Letter to Mr. Masatsugu Asakawa]. Support to Capital Market-Generated Infrastructure Financing Program,
Subprogram 1 Policy Matrix as cited in the ADB Report and Recommendation of the President to the Board of Directors on the Proposed Programmatic Approach and Policy-Based Loan for Subprogram 1 Republic of the Philippines: Support to Capital Market-Generated Infrastructure Financing Program. Retrieved from https://www.adb.org/sites/default/files/project-documents/53047/53047-001-rrp-en.pdf.
37 Dominguez, C. G. (2019, September 10). [DOF Letter to Mr. Takehiko Nakao]. Local Governance Reform Program, Subprogram 1 Policy Matrix as cited in the Report and Recommendation of the President to the Board of Directors on the Proposed Programmatic Approach and Policy-Based Loan for Subprogram 1 Republic of the Philippines: Local Governance Reform Program. Retrieved from https://www.adb.org/sites/default/files/project-documents/52173/52173-001-rrp-en.pdf.
38 Ibid.

ODA PORTFOLiO REviEW REPORT 2020 30
BOx 3.2 DEFINITION OF ABSORPTIVE CAPACITY INDICATORS
Disbursement Level is the actual expenditures or draw-downs from loan proceeds for a given year.
Disbursement Rate is defined as the actual disbursement level as a percentage of target disbursement for the year. It reflects the planning and implementation capacities of project management offices.
Availment Rate is defined as the cumulative actual disbursements as a percentage of cumulative scheduled disbursement, both reckoned from the start of implementation up to the reporting period.
Typically, a project in its initial stage would register a close-to-zero availment rate. A project that has an availment rate closer to 100 percent signifies that it is likely on track, catching up, or past midway its implementation. Meanwhile, a project that is about to close, but still registers a comparably low availment rate, reflects that it has a large disbursement backlog and may require loan restructuring subject to ICC/NEDA Board action.
Disbursement Ratio is the ratio of actual disbursements for a given year to the loan balance available at the beginning of the year, inclusive of newly effective loans. Disbursement ratio increases or improves with an increase in actual disbursement.
Source: NEDA (2018). NEDA Manual for Project Monitoring.
3.2 Financial Performance of Project Loans
Overall financial performance of project loans (disbursement level, disbursement ratio, and availment rate) declined in 2020 compared to 2019 except for disbursement rate. Reported reasons for the decline are restrictions brought about by the COVID-19 pandemic (e.g., delays in procurement, processing of progress billings, and implementation of project activities), procurement issues unrelated to COVID-19, and delays in government/funding institution approvals, among others.

31 NATIONAL ECONOMIC AND DEVELOPMENT AUTHORITY
Disbursement Level. Disbursement level of project loans decreased by 12.54 percent, from USD1.21 billion in 2019 to USD1.06 billion in 2020.
TABLE 3.2 DISBURSEMENT LEVEL IN CY 2019 AND CY 2020
Loan Status
2019 2020
Loan Count
Net Commitment
(in USDmillion)
Disbursement Level
(in USDmillion)
Loan Count
Net Commitment
(in USD million)
Disbursement Level
(in USDmillion)
Continuing 57 10,330.56 1,190.36 62 14,330.28 1,054.42
New 10 3,959.36 24.51 14 2,860.49 8.15
Total 67 14,289.92 1,214.87 76 17,190.77 1,062.57
TABLE 3.1 FINANCIAL PERFORMANCE OF PROJECT LOANS (2019 VS 2020)
Financial IndicatorsTotal Increase/Decline
(in percent/nominal) 2019 2020
Disbursement Level (in USD million) 1,214.87 1,062.57 (12.54)
Disbursement Ratio (in percent) 10.72 8.05 (2.67)
Disbursement Rate (in percent) 64.28 66.69 2.41
Availment Rate (in percent) 70.53 64.86 (5.67)
Loan Count 67 76 9
Table 3.1 shows the comparative financial performance of project loans in 2019 and 2020. Annex 3-B provides the details of financial performance of project loans in 2020.
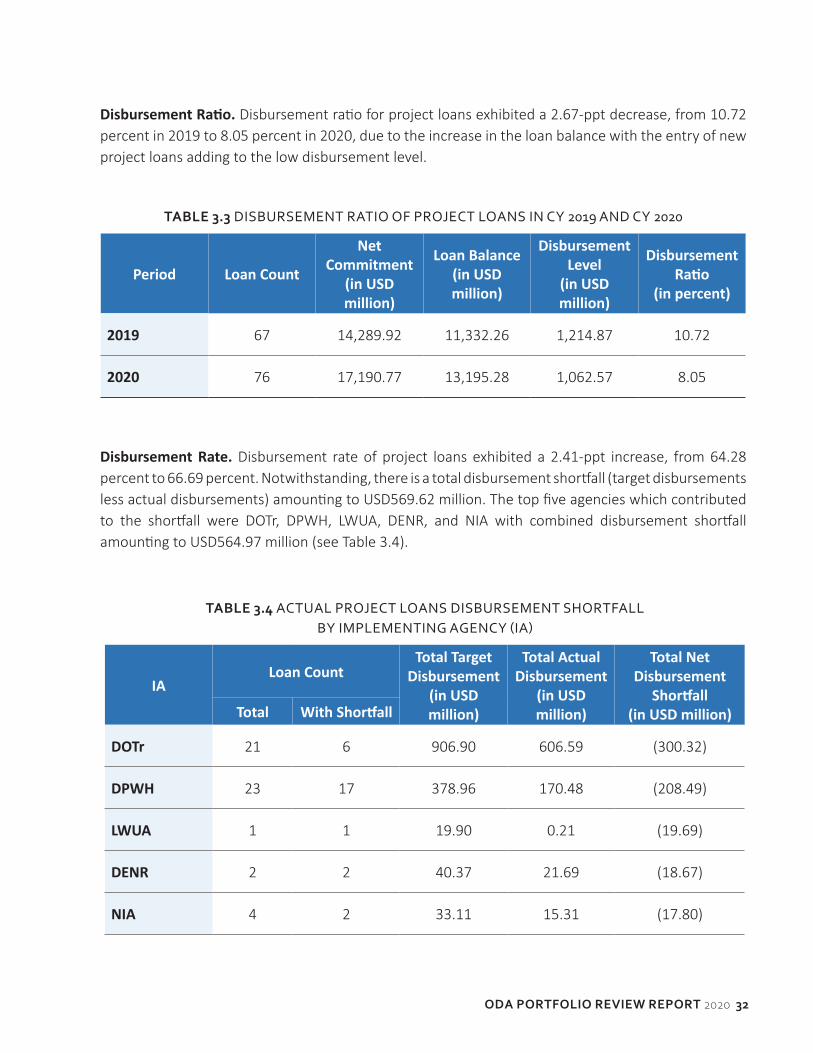
ODA PORTFOLiO REviEW REPORT 2020 32
TABLE 3.4 ACTUAL PROJECT LOANS DISBURSEMENT SHORTFALLBY IMPLEMENTING AGENCY (IA)
IALoan Count
Total Target Disbursement
(in USD million)
Total Actual Disbursement
(in USD million)
Total Net Disbursement
Shortfall(in USD million)Total With Shortfall
DOTr 21 6 906.90 606.59 (300.32)
DPWH 23 17 378.96 170.48 (208.49)
LWUA 1 1 19.90 0.21 (19.69)
DENR 2 2 40.37 21.69 (18.67)
NIA 4 2 33.11 15.31 (17.80)
Disbursement Ratio. Disbursement ratio for project loans exhibited a 2.67-ppt decrease, from 10.72 percent in 2019 to 8.05 percent in 2020, due to the increase in the loan balance with the entry of new project loans adding to the low disbursement level.
Disbursement Rate. Disbursement rate of project loans exhibited a 2.41-ppt increase, from 64.28 percent to 66.69 percent. Notwithstanding, there is a total disbursement shortfall (target disbursements less actual disbursements) amounting to USD569.62 million. The top five agencies which contributed to the shortfall were DOTr, DPWH, LWUA, DENR, and NIA with combined disbursement shortfall amounting to USD564.97 million (see Table 3.4).
TABLE 3.3 DISBURSEMENT RATIO OF PROJECT LOANS IN CY 2019 AND CY 2020
Period Loan Count
Net Commitment
(in USD million)
Loan Balance(in USD million)
Disbursement Level
(in USD million)
Disbursement Ratio
(in percent)
2019 67 14,289.92 11,332.26 1,214.87 10.72
2020 76 17,190.77 13,195.28 1,062.57 8.05

33 NATIONAL ECONOMIC AND DEVELOPMENT AUTHORITY
Availment Rate. The availment rate (cumulative actual disbursements over cumulative scheduled disbursements) of project loans portfolio decreased by 5.67 ppts, from 70.53 percent in 2019 to 64.86 percent in 2020. Availment backlog (cumulative target disbursements less cumulative actual disbursements) remains high, amounting to USD2.75 billion. The top five agencies which contributed to the backlog in 2020 were DOTr, DPWH, NIA, DOF, and LWUA (see Table 3.5). Refer to Annex 3-C for the list of projects with availment backlog.
IALoan Count
Total Target Disbursement
(in USD million)
Total Actual Disbursement
(in USD million)
Total Net Disbursement
Shortfall(in USD million)Total With Shortfall
DAR 4 2 28.68 26.32 (2.36)
MWSS 3 1 42.70 40.42 (2.28)
Total 58 31 1,450.64 881.02 (569.62)
TABLE 3.5 PROJECT LOANS WITH AVAILMENT BACKLOG BY IA
IALoan Count Scheduled
Availment (in USD million)
Actual Availment
(in USD million)
Net Availment Backlog
(in USD million)Total With Backlog
DOTr 21 13 2,910.18 1,118.02 1,792.16
DPWH 23 19 1,321.02 606.64 714.38
NIA 4 4 233.82 126.09 107.73
DOF* 4 4 83.27 34.57 48.71
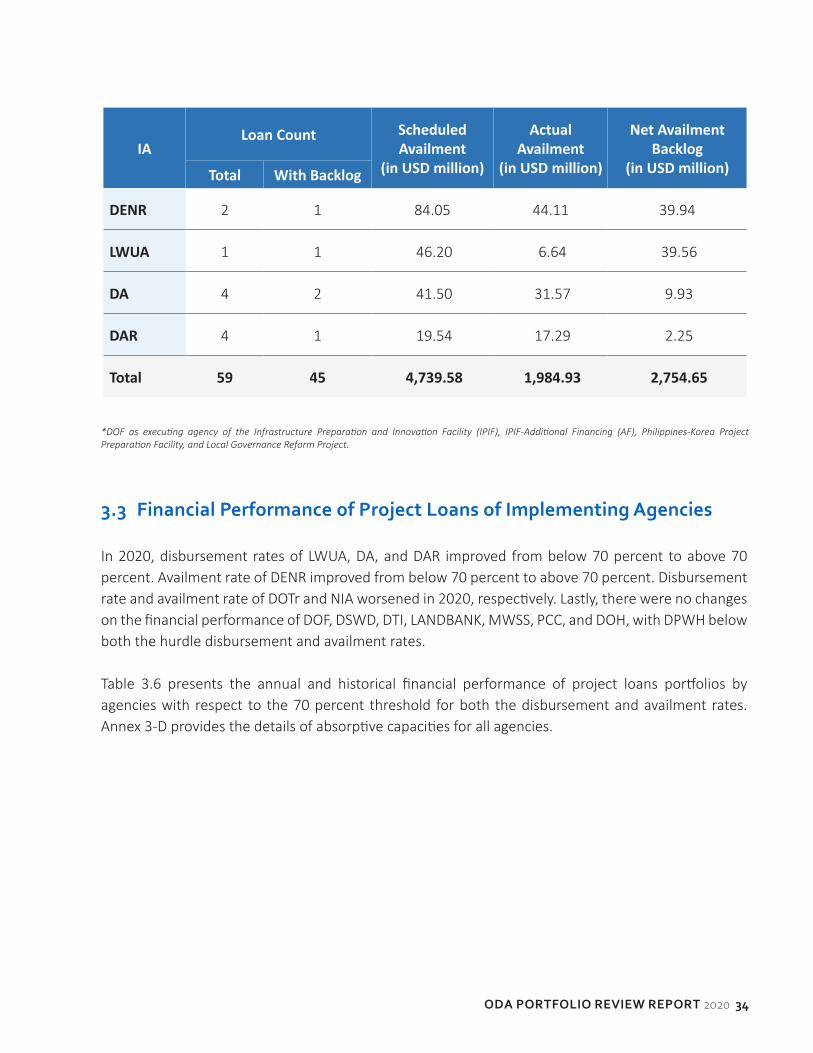
ODA PORTFOLiO REviEW REPORT 2020 34
3.3 Financial Performance of Project Loans of implementing Agencies
In 2020, disbursement rates of LWUA, DA, and DAR improved from below 70 percent to above 70 percent. Availment rate of DENR improved from below 70 percent to above 70 percent. Disbursement rate and availment rate of DOTr and NIA worsened in 2020, respectively. Lastly, there were no changes on the financial performance of DOF, DSWD, DTI, LANDBANK, MWSS, PCC, and DOH, with DPWH below both the hurdle disbursement and availment rates.
Table 3.6 presents the annual and historical financial performance of project loans portfolios by agencies with respect to the 70 percent threshold for both the disbursement and availment rates. Annex 3-D provides the details of absorptive capacities for all agencies.
IALoan Count Scheduled
Availment (in USD million)
Actual Availment
(in USD million)
Net Availment Backlog
(in USD million)Total With Backlog
DENR 2 1 84.05 44.11 39.94
LWUA 1 1 46.20 6.64 39.56
DA 4 2 41.50 31.57 9.93
DAR 4 1 19.54 17.29 2.25
Total 59 45 4,739.58 1,984.93 2,754.65
*DOF as executing agency of the Infrastructure Preparation and Innovation Facility (IPIF), IPIF-Additional Financing (AF), Philippines-Korea Project Preparation Facility, and Local Governance Reform Project.

35 NATIONAL ECONOMIC AND DEVELOPMENT AUTHORITY
TABLE 3.6 FINANCIAL PERFORMANCE OF IMPLEMENTING/EXECUTING AGENCIESFOR PROJECT LOANS
Historical and Annual Financial Indicators
Below 70 percent Availment Rate of Project
Loans
70 percent and Above Availment Rate of Project
Loans
70 percent and Above Disbursement Rate of Project Loans
DOF,39 ↑LWUA↑DA, ↑DAR, DSWD, DTI
LANDBANK, MWSS, PCC, DOH
Below 70 percent Disbursement Rate of Project Loans ↓DOTr, DPWH, NIA← →DENR
Note: Movement across quadrants from prior year’s performance is indicated by the directional arrows. Left- facing arrow means a decrease in the availment rate performance of the IA from 70 percent and above in CY 2019 to below 70 percent in CY 2020, while a right-facing arrow means an improvement in their availment performance in CY 2020. Meanwhile an upward-facing arrow means an improvement in the disbursement rate performance of the IA from below 70 percent in CY 2019 to 70 percent and above in CY 2020, while a downward-facing arrow means otherwise.
Budgetary Performance of Implementing Agencies. As of end 2020, the obligation rate of agencies with respect to the implementation of ODA loan-funded projects, averaged 83 percent, while the disbursement rate averaged 69 percent. Details of the financial performance per agency is shown in Table 3.7, while details per project in terms of allotment releases, obligations, and disbursements are provided in Annex 3-E.
TABLE 3.7 ALLOTMENT RELEASES, OBLIGATIONS, AND DISBURSEMENT AS OF END 2020
Implementing Agency
Allotment Releases(in PHP million)
(a)
Obligations(in PHP million)
(b)
Disbursements(in PHP million)
(c)
Obligation Rate
(in percent)(d) = (b) / (a) x
100%
Disbursement Rate
(in percent)(e) = (c) / (b) x
100%
DA 33,601.35 31,262.07 25,726.53 93.04 82.29
DAR 6,594.79 5,831.08 4,775.04 88.42 81.89
DENR 8,820.94 7,949.82 4,972.33 90.12 62.55
DOTr 176,820.05 165,540.63 112,489.55 93.62 67.95
39 DOF as executing agency of IPIF, IPIF-AF, Philippines-Korea Project Preparation Facility, and Local Governance Reform Project

ODA PORTFOLiO REviEW REPORT 2020 36
TABLE 3.8 MULTI-YEAR BUDGET REQUIREMENTS PER IA FOR FY 2021 AND BEYOND
Agency No. of Projects
Budget Requirement(in PHP million)
2021 2022 2023 2024 2025 2026 Onwards
DA 4 1,491.14 1,671.78 - - - -
DAR 2 2,723.86 12,997.38 8,611.88 - - -
DENR 2 709.94 483.01 92.62 - - -
DOH 2 6,740.31 647.52 430.13 - - -
DOTr 16 50,014.62 258,728.45 184,168.67 103,172.95 50,824.36 59,936.30
Implementing Agency
Allotment Releases(in PHP million)
(a)
Obligations(in PHP million)
(b)
Disbursements(in PHP million)
(c)
Obligation Rate
(in percent)(d) = (b) / (a) x
100%
Disbursement Rate
(in percent)(e) = (c) / (b) x
100%
DPWH 87,220.65 80,461.61 58,734.95 92.25 73.00
DSWD 49,831.66 48,823.05 45,547.04 97.98 93.29
DTI 339.74 205.60 121.00 60.52 58.85
NIA 16,131.03 15,136.77 8,777.71 93.84 57.99
PCC 86.77 32.35 13.29 37.28 41.08
*Note: DOH was excluded due to incomplete data at the time of report publication.
Multi-year Budget Requirements. Based on agency forecasts, about PHP1.08 trillion would be needed for the implementation/completion of 57 ongoing projects as of end 2020 until their completion. Budget requirements per agency are shown in Table 3.8 and breakdown by fund source for the 57 ongoing projects is shown in Annex 3-F.

37 NATIONAL ECONOMIC AND DEVELOPMENT AUTHORITY
TABLE 3.9 COMMITMENT FEES PAID IN CY 2019 AND CY 2020
CY 2019 CY 2020
A. Commitment Fees Paid (in USD million) 4.66 6.78
Due to Cost of Financing 2.73 3.07
Due to Delays 1.93 3.71
B. Net Commitment (in USD million) 19,289.92 29,003.92
C. Ratio of A to B (in percent) 0.02 0.02
Source: DOF-Bureau of the Treasury (2021). Commitment Fees and Other Charges (January to December 2020).
Agency No. of Projects
Budget Requirement(in PHP million)
2021 2022 2023 2024 2025 2026 Onwards
DPWH 18 18,639.42 53,394.67 67,259.46 54,905.17 30,001.17 40,511.04
DSWD 3 10,041.20 18,479.52 10,712.75 4,087.33 30.92 -
DTI 1 596.71 859.38 1,055.35 920.18 198.68 -
LANDBANK 1 205.81 205.81 205.81 205.81 - -
LWUA 1 1,209.13 1,050.73 579.58 154.82 - -
MWSS 3 4,446.96 5,763.98 4,450.17 2,070.17 1,199.76 -
NIA 3 3,410.37 648.52 381.07 - - -
PCC 1 333.41 343.74 335.49 297.93 109.05 -
Grand Total 57 100,562.88 355,274.49 278,282.98 165,814.36 82,363.94 100,447.34
Commitment Fees (CF). Total CFs paid in 2020 amounted to USD6.78 million which was 45.49 percent higher than the fees paid in 2019 (Table 3.9). But while the amount was higher, the proportion of CFs to the net commitments paid in 2020 was proportionate to that of 2019, at 0.02 percent for both 2019 and 2020. Annex 3-G shows annual data on the CFs paid from 2006 to 2020. About 55 percent (USD3.71 million) of CFs paid in 2020 were attributed to implementation delays (Box 3.3).

ODA PORTFOLiO REviEW REPORT 2020 38
TABLE 3.10 PROJECTS WITH HIGHEST COMMITMENT FEES PAID IN CY 2020DUE TO IMPLEMENTATION DELAYS
Project Title/IA/Fund Source Fees Paid
in CY 2020 Due to Delays (in USD million)
1. Malolos-Clark Railway Project/DOTr/ADB 1.93
2. Improving Growth Corridors in Mindanao Road Sector Project/ DPWH/ADB
0.32
3. Capacity Enhancement of Mass Transit Systems in Metro Manila/DOTr/GOJ-JICA
0.30
BOx 3.3 COMMITMENT FEES ATTRIBUTABLE TO IMPLEMENTATION DELAY AND AS COST OF FINANCING
CF is the amount levied on the undisbursed loan amount or a portion thereof, payable per annum [Example: 0.75 percent (rate) x USD10 million (undisbursed amount) = USD75,000]. The rate is applied on the undisbursed amount of the entire loan or a portion thereof (base), which approximates or may be bigger than the amount scheduled to be disbursed due to availment backlogs. Thus, even when there is no implementation delay, a certain amount of CF would still be charged as purely cost of financing. Implementation delay40 only increases the amount.
Source: NEDA (2009). 18th ODA Portfolio Review Report.
The top six projects with the highest incurred CFs in 2020 attributed to implementation delays shown in Table 3.10 also accounted for 85 percent of CFs paid due to implementation delays in 2020. Details of cumulative CFs for all projects paid in 2020 and prior years are provided in Annex 3-H, with Annex 3-I for the annual amounts of CFs paid by IAs from 2014 to 2020, Annex 3-J, and Annex 3-K for the cumulative CFs incurred by projects with active loans in 2020.
40 In order to approximate how much of the CFs paid in 2020 may be attributed to implementation delay, first, it was assumed that for all loans with at least 100 percent availment rate (no implementation delay), CFs paid are entirely due to cost of financing. Second, CFs due to implementation delay were calculated by: (a) deducting computed CFs assuming 100 percent availment rate to the actual CFs paid, or (b) applying the rate to the backlog (scheduled availment less actual availment). The result of the analysis showed that approximately 55 percent of CFs paid in 2020 may be attributed to implementation delays.

39 NATIONAL ECONOMIC AND DEVELOPMENT AUTHORITY
TABLE 3.11 TOP FIVE PROJECTS WHICH INCURRED HIGHEST COMMITMENT FEES FROM LOAN EFFECTIVITY UNTIL YEAR-END 2020
Project Title/IA/Fund Source Total CFs Paid(in USD million)
1. Philippine Ports and Coast Guard Capability Development Project/DOTr/France 5.39
2. Capacity Enhancement of Mass Transit Systems in Metro Manila/DOTr/GOJ-JICA 2.62
3. Road Upgrading and Preservation Project/DPWH/GOJ-JICA 2.46
4. Metro Manila Flood Management Project/DPWH/WB and AIIB 2.45
5. Malolos-Clark Railway Project/DOTr/ADB 2.07
Sub-total 14.99
Cumulative CFs Paid for Active Loans 28.80
Table 3.11 shows the five projects with active ODA loans which incurred the largest cumulative CFs from loan effectivity until year-end 2020.
Project Title/IA/Fund Source Fees Paid
in CY 2020 Due to Delays (in USD million)
4. Metro Manila Flood Management Project/DPWH/AIIB 0.26
5. Infrastructure Preparation and Innovation Facility - Additional Financing/DPWH/DOTr/ADB
0.21
6. Infrastructure Preparation and Innovation Facility/DPWH/ ADB 0.11
Total 3.13

ODA PORTFOLiO REviEW REPORT 2020 40
3.4 Grants Financial Performance41
Utilization level of active grants as of December 2020 reached USD887.99 million, posting a utilization rate42 of 53 percent against the total grant amount of USD1.69 billion. This reflects a 2-ppt increase in utilization rate compared to the same period in 2019 which was at 51 percent.
The top three fund sources which posted the largest utilization level in 2020 were United States of America (USA), EU, and the UN System accounting for 56 percent of the overall utilization level of the grants portfolio (Table 3.12). Compared with the CY 2019 performance, grants from USA posted a decrease in utilization level by three percent (from USD266 million to USD218.58 million) in CY 2020. Further, grants from EU and UN System posted an increase by nine percent (from USD135.60 million to USD147.47 million) and seven percent (from USD120.11 million to USD129.02 million) in CY 2020, respectively.
41 Grants financial performance was measured in terms of utilization level which is the cumulative disbursements of active grants reckoned from grant agreement effectivity dates.
42 Utilization rate is computed as the utilization level over the total grant amount.43 UN System is composed of FAO, IFAD, IOM, UN HABITAT, UNDP, UNESCO, UNFPA, UNICEF, UNIDO, UNOPS, WFP, and WHO. 44 Japan is composed of JICA and the Embassy of Japan (i.e., non-project grant aid).45 Korea is composed of the KOICA, Korea Rural Economic Institute, and Ministry of Agriculture Food and Rural Affairs - Education, Promotion and
Information Service.
TABLE 3.12 GRANT UTILIZATION AS OF CY 2020 BY FUND SOURCE
Fund Source No. of Projects
Grant Amount (in USD million)
Utilization(in USD million)
Percent Share to Total
Utilization Rate
(in percent)
USA 36 555.78 218.58 24.62 39.33
EU 6 233.71 147.47 16.61 63.10
UN System43 103 210.61 129.02 14.53 61.26
Australia 18 176.77 117.41 13.22 66.42
ADB 21 110.33 68.60 7.73 62.18
Japan44 15 74.67 61.85 6.97 82.83
Korea45 14 78.13 42.60 4.80 54.52
China 2 127.66 38.72 4.36 30.33
Germany 3 31.71 28.61 3.22 90.22
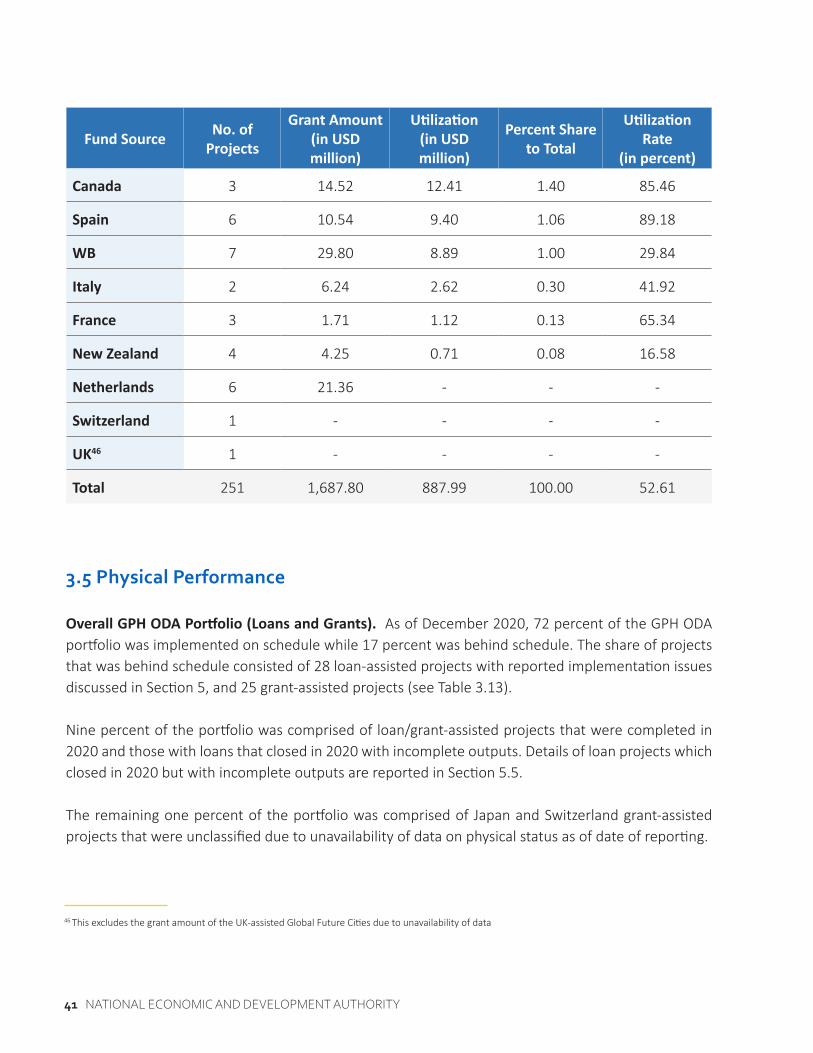
41 NATIONAL ECONOMIC AND DEVELOPMENT AUTHORITY
3.5 Physical Performance
Overall GPH ODA Portfolio (Loans and Grants). As of December 2020, 72 percent of the GPH ODA portfolio was implemented on schedule while 17 percent was behind schedule. The share of projects that was behind schedule consisted of 28 loan-assisted projects with reported implementation issues discussed in Section 5, and 25 grant-assisted projects (see Table 3.13).
Nine percent of the portfolio was comprised of loan/grant-assisted projects that were completed in 2020 and those with loans that closed in 2020 with incomplete outputs. Details of loan projects which closed in 2020 but with incomplete outputs are reported in Section 5.5.
The remaining one percent of the portfolio was comprised of Japan and Switzerland grant-assisted projects that were unclassified due to unavailability of data on physical status as of date of reporting.
Fund Source No. of Projects
Grant Amount (in USD million)
Utilization(in USD million)
Percent Share to Total
Utilization Rate
(in percent)
Canada 3 14.52 12.41 1.40 85.46
Spain 6 10.54 9.40 1.06 89.18
WB 7 29.80 8.89 1.00 29.84
Italy 2 6.24 2.62 0.30 41.92
France 3 1.71 1.12 0.13 65.34
New Zealand 4 4.25 0.71 0.08 16.58
Netherlands 6 21.36 - - -
Switzerland 1 - - - -
UK46 1 - - - -
Total 251 1,687.80 887.99 100.00 52.61
46 This excludes the grant amount of the UK-assisted Global Future Cities due to unavailability of data

ODA PORTFOLiO REviEW REPORT 2020 42
TABLE 3.13 PHYSICAL STATUS OF ODA-ASSISTED PROJECTS IN 2020
Physical StatusNo. of Projects Percent
Share on Count
ODA Amount(in USD million)
Percent Share on AmountLoan Grant Total Loan Grant Total
Completed 5 24 29 9.32 399.68 128.03 527.71 3.99
Ahead of Schedule - - - - - - - -
On Schedule 24 200 224 72.03 7,273.24 1,443.17 8,716.41 65.93
Behind Schedule 28 25 53 17.04 3,213.88 113.37 3,327.25 25.17
Not Yet Started - - - - - - - -
Closed with Incomplete Outputs
3 - 3 0.96 645.21 - 645.21 4.88
Unclassified - 2 2 0.64 - 3.23 3.23 0.02
Total 60 251 311 100.00 11,532.01 1,687.80 13,219.81 100.00
Physical Performance of ODA Loan-assisted Projects by Implementing Agency. Out of the 60 loan-assisted projects,47 28 projects were reported to be behind schedule (see Table 3.14). These projects encountered delays due to issues brought about by COVID-19, site condition/availability, procurement, government/funding institutions approvals, budget and funds flow, design/scope/technical specifications, performance of contractors/consultants, institutional support, inputs and costs, and other implementation issues. Details of the issues are discussed in Section 5: Key implementation issues. Refer to Annex 3-L for the physical status of the ODA loan-assisted programs and projects.
47 The list excludes four newly signed projects (one BOC project, one DOTr project, and two DSWD projects) and three projects with loans executed by DOF.

43 NATIONAL ECONOMIC AND DEVELOPMENT AUTHORITY
TABLE 3.14 PHYSICAL STATUS OF ODA LOAN-ASSISTED PROJECTS BY IA
Physical Status
IA Completed On Schedule Behind Schedule
Closed with Incomplete
OutputsTotal Count
DA - 3 1 - 4
DAR - 1 2 1 4
DENR - 0 2 - 2
DOH - 2 - - 2
DOTr 3 6 6 1 16
DPWH 1 7 11 - 19
DSWD - - 1 - 1
DTI - 1 - - 1
LANDBANK - - 1 1 2
LWUA - - 1 - 1
MWSS 1 2 0 - 3
NIA - 1 3 - 4
PCC - 1 0 - 1
Total 5 24 28 3 60
Further, in terms of completion timelines, of the five completed loan-assisted projects, four were completed on time while one was completed past its target completion date.
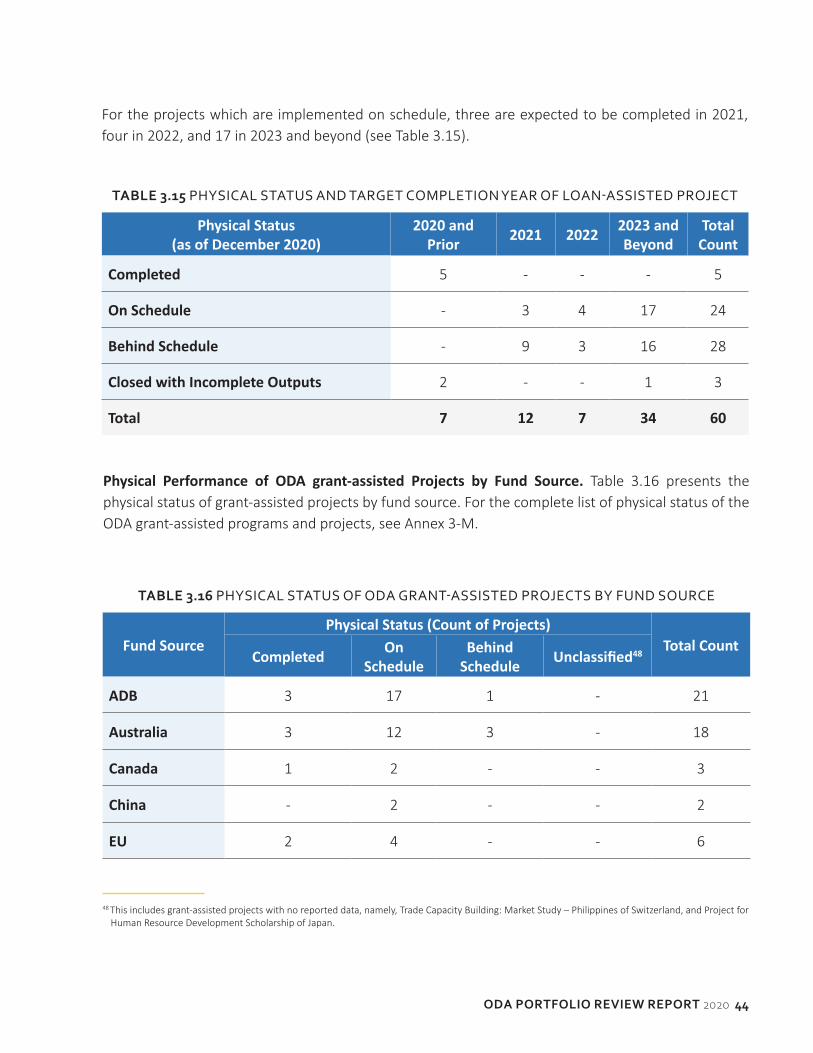
ODA PORTFOLiO REviEW REPORT 2020 44
For the projects which are implemented on schedule, three are expected to be completed in 2021, four in 2022, and 17 in 2023 and beyond (see Table 3.15).
Physical Performance of ODA grant-assisted Projects by Fund Source. Table 3.16 presents the physical status of grant-assisted projects by fund source. For the complete list of physical status of the ODA grant-assisted programs and projects, see Annex 3-M.
TABLE 3.15 PHYSICAL STATUS AND TARGET COMPLETION YEAR OF LOAN-ASSISTED PROJECT
Physical Status (as of December 2020)
2020 and Prior 2021 2022 2023 and
Beyond Total
Count
Completed 5 - - - 5
On Schedule - 3 4 17 24
Behind Schedule - 9 3 16 28
Closed with Incomplete Outputs 2 - - 1 3
Total 7 12 7 34 60
TABLE 3.16 PHYSICAL STATUS OF ODA GRANT-ASSISTED PROJECTS BY FUND SOURCE
Fund SourcePhysical Status (Count of Projects)
Total CountCompleted On
ScheduleBehind
Schedule Unclassified48
ADB 3 17 1 - 21
Australia 3 12 3 - 18
Canada 1 2 - - 3
China - 2 - - 2
EU 2 4 - - 6
48 This includes grant-assisted projects with no reported data, namely, Trade Capacity Building: Market Study – Philippines of Switzerland, and Project for Human Resource Development Scholarship of Japan.
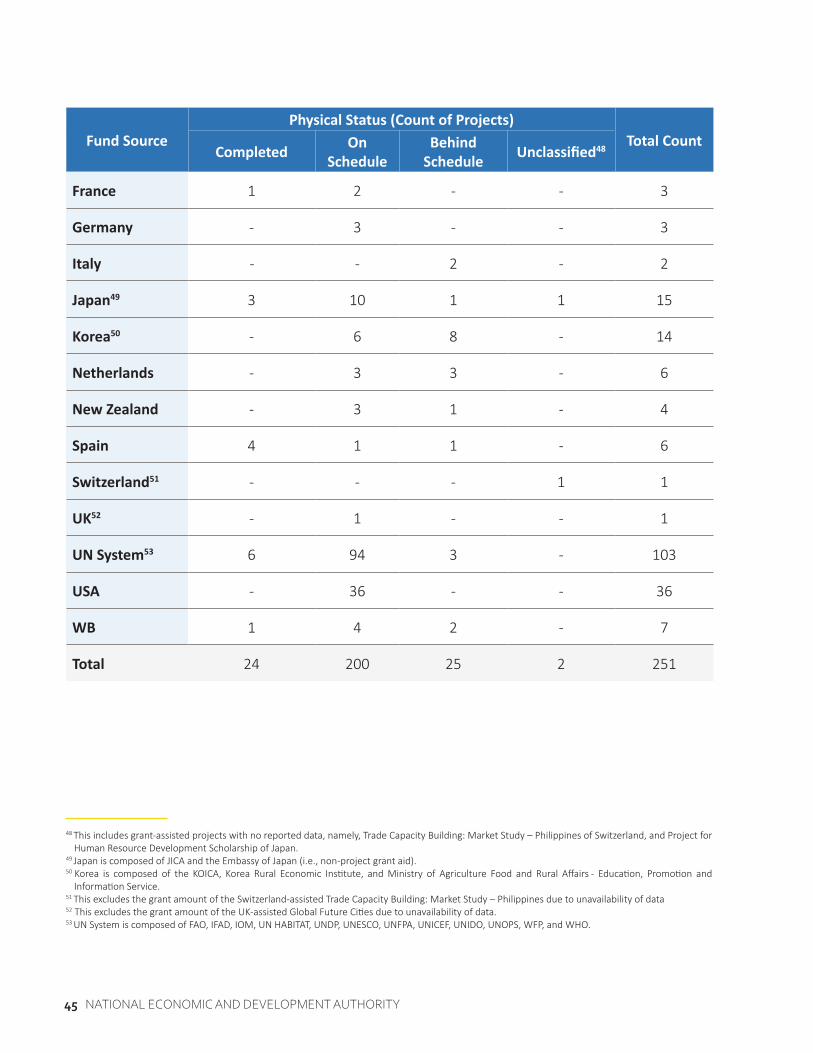
45 NATIONAL ECONOMIC AND DEVELOPMENT AUTHORITY
Fund SourcePhysical Status (Count of Projects)
Total CountCompleted On
ScheduleBehind
Schedule Unclassified48
France 1 2 - - 3
Germany - 3 - - 3
Italy - - 2 - 2
Japan49 3 10 1 1 15
Korea50 - 6 8 - 14
Netherlands - 3 3 - 6
New Zealand - 3 1 - 4
Spain 4 1 1 - 6
Switzerland51 - - - 1 1
UK52 - 1 - - 1
UN System53 6 94 3 - 103
USA - 36 - - 36
WB 1 4 2 - 7
Total 24 200 25 2 251
48 This includes grant-assisted projects with no reported data, namely, Trade Capacity Building: Market Study – Philippines of Switzerland, and Project for Human Resource Development Scholarship of Japan.
49 Japan is composed of JICA and the Embassy of Japan (i.e., non-project grant aid).50 Korea is composed of the KOICA, Korea Rural Economic Institute, and Ministry of Agriculture Food and Rural Affairs - Education, Promotion and
Information Service.51 This excludes the grant amount of the Switzerland-assisted Trade Capacity Building: Market Study – Philippines due to unavailability of data52 This excludes the grant amount of the UK-assisted Global Future Cities due to unavailability of data.53 UN System is composed of FAO, IFAD, IOM, UN HABITAT, UNDP, UNESCO, UNFPA, UNICEF, UNIDO, UNOPS, WFP, and WHO.

ODA PORTFOLiO REviEW REPORT 2020 46
ODA implementation in 2020 continued to yield outputs and outcomes aligned with national development priorities indicated in the Philippine Development Plan Results Matrices (PDP-RMs) 2017-2022. ODA support for COVID-19 response primarily went towards the government’s emergency cash assistance program and health system delivery through the provision of medical supplies and equipment, construction of isolation and quarantine facilities, and strengthening the capacity of existing health facilities.
4.1 Program/Project Results Contributing to the Philippine Development Plan and Results Matrices Sector Objectives
BOx 4.1 OUTCOMES CONTRIBUTING TO THE VARIOUS PDP AND RM SECTOR OBJECTIVES
The PDP 2017-2022 is the first medium-term plan anchored on the AmBisyon Natin 2040 and the current Administration’s Zero-to-10-Point Socioeconomic Agenda. It also considers the country’s commitments to the 2030 SDGs. The plan aims to lay a stronger foundation for inclusive growth, a high-trust society, and a globally competitive economy towards the attainment of the national long-term vision by 2040. The PDP’s accompanying RMs provide results orientation by providing an indicator framework to the Plan objectives. ODA programs and projects are implemented in support of the strategies to attain the development objectives of the PDP and the RMs.
Source: NEDA (2017). PDP 2017-2022.
Results04

47 NATIONAL ECONOMIC AND DEVELOPMENT AUTHORITY
TABLE 4.1 ODA LOAN/ GRANT-ASSISTED PROJECTS AND PROGRAMS WITH REPORTED OUTPUTS AND OUTCOMES CONTRIBUTING TO THE PDP-RM 2017-2022
PDP-RM 2017-2022 ChapterNo. of ODAProjects/
Programs*
No. ofPDP-RMs Indicators
Chapter 8: Expanding Economic Opportunities in Agriculture, Forestry, and Fisheries
7 10
Chapter 9: Expanding Economic Opportunities in Industry and Services through Trabaho and Negosyo 2 6
Chapter 10: Accelerating Human Capital Development 7 8
Chapter 11: Reducing Vulnerability of Individuals and Families 5 1
Chapter 16: Promoting Competition 1 1
Chapter 19: Accelerating Infrastructure Development 32 17
Chapter 20: Ensuring Ecological Integrity, Clean, andHealthy Environment
13 15
Total 55 58
*One project/program may contribute to several outcome indicators in more than one chapter of the PDP.
Table 4.1 shows that 55 loan/grant-assisted projects have reported outputs and outcomes contributing to 58 sector outcome indicators in seven chapters of the PDP-RMs 2017-2022 (see details in Annex 4-A). Meanwhile, 29 ODA loan-assisted projects have no reported outputs and outcomes as these either have newly effective loans, are under pre-implementation stage (i.e., under preliminary or detailed engineering design stage, or procurement), just started implementation/construction in December 2020, or yet to receive project funding.

ODA PORTFOLiO REviEW REPORT 2020 48
Results of ODA Loan-assisted Programs and Projects Availed for COVID-19 Response. Out of the 25 loans availed for COVID-19 response, 18 loans (17 program loans and one project loan) have actual disbursements as of year-end 2020 supporting 14 programs and one project. Annex 2-K presents the main objectives of 12 COVID-19 budget-support programs with actual disbursements and the corresponding activities on pandemic response supported by these loans. Meanwhile, Table 4.2 shows the major outputs of the Philippines COVID-19 Emergency Response Project implemented by the DOH as of December 2020.
Loan Title/DP/IA Actual Output/Outcome as of December 2020
Philippines COVID-19 Emergency Response Project/WB/DOH
Net Commitment: USD100 million
Availment as of end 2020: USD8.15 million
Loan Validity: May 6, 2020 to December 29, 2023
Component 1 – Strengthening COVID-19 Emergency Health Care Response • standard design for hospital isolation and treatment centers to
manage Severe Acute Respiratory Infections patients finalized • 200 units of ventilators to be provided for hospitals procured• 14,757 health staff trained in infection prevention and control per
DOH-approved protocols
Component 2 – Strengthening Laboratory Capacity at National and Sub-national Level to Support Emerging Infectious Diseases Prevention, Preparedness, and Response • daily capacity of designated national laboratory in conducting
COVID-19 diagnostic tests increased from 300 to 692• daily capacity of designated sub-national laboratory in Davao in
conducting COVID-19 diagnostic tests increased from 20 to 1,006• daily capacity of designated sub-national laboratory in Cebu in
conducting COVID-19 diagnostic tests increased from 20 to 545
Component 3 – Implementation Management and Monitoring and Evaluation • monitoring and evaluation systems for project activities established• Terms of Reference for the development of a functional asset
management system being finalized• grievance redress mechanism monitoring system being developed
TABLE 4.2 RESULTS OF THE PHILIPPINES COVID-19 EMERGENCY RESPONSE PROJECT

49 NATIONAL ECONOMIC AND DEVELOPMENT AUTHORITY
4.2 Evaluation Findings of Recently Completed Studies
Aligned with the commitment to strengthen its monitoring and evaluation programs, NEDA undertakes objective assessment and reporting of the results of completed programs and projects to determine the impact of development interventions on inclusive growth and derive lessons to guide future policy actions for improved project design implementation.
Completed evaluation studies of programs and projects in the transportation, agriculture, social development, and natural resource management sectors reported mixed results/findings and highlighted the need to sustain and enhance efforts across these sectors for continuous improvement and enhanced transparency and accountability.
The findings of all completed evaluation studies are presented in Annex 4-B and categorized into three: (a) thematic studies of government programs under the NEDA-UNDP Strategic M&E Project; (b) NEDA-commissioned studies; and (c) studies completed through Australian DFAT Policy Window Philippines. In brief, these completed studies are enumerated in Table 4.3:
TABLE 4.3 LIST OF EVALUATION STUDIES
Title of Study1. Assessment of the Anti-Red Tape Act (2007 ARTA): Efficiency, Effectiveness, and Relevance,
Towards the Expanded ARTA/Ease of Doing Business (EODB) Act Implementation
2. Evaluation of the Payapa at Masaganang Pamayanan (PAMANA) Program
3. Formative Evaluation of the Philippine Plan of Action for Nutrition (PPAN) 2017-2022
4. Impact Evaluation Study of the Marikina–Infanta Road Project (MIRP)
5. An Impact Evaluation Study on the Diversified Farm Income and Market Development Project (DFIMDP)
6. Impact Evaluation of the Laguna de Bay Institutional Strengthening and Community Participation Project in CALARBAZON (LISCOP)
7. Impact Evaluation of the Agri-Pinoy Livestock Program (A-PLP) in Samar Island
8. Impact Evaluation of the Camiguin Coastal Resource Management Project (CCRMP)
9. Impact Evaluation Study of the Cervantes-Makayan-Abatan Road Project (CMARP)
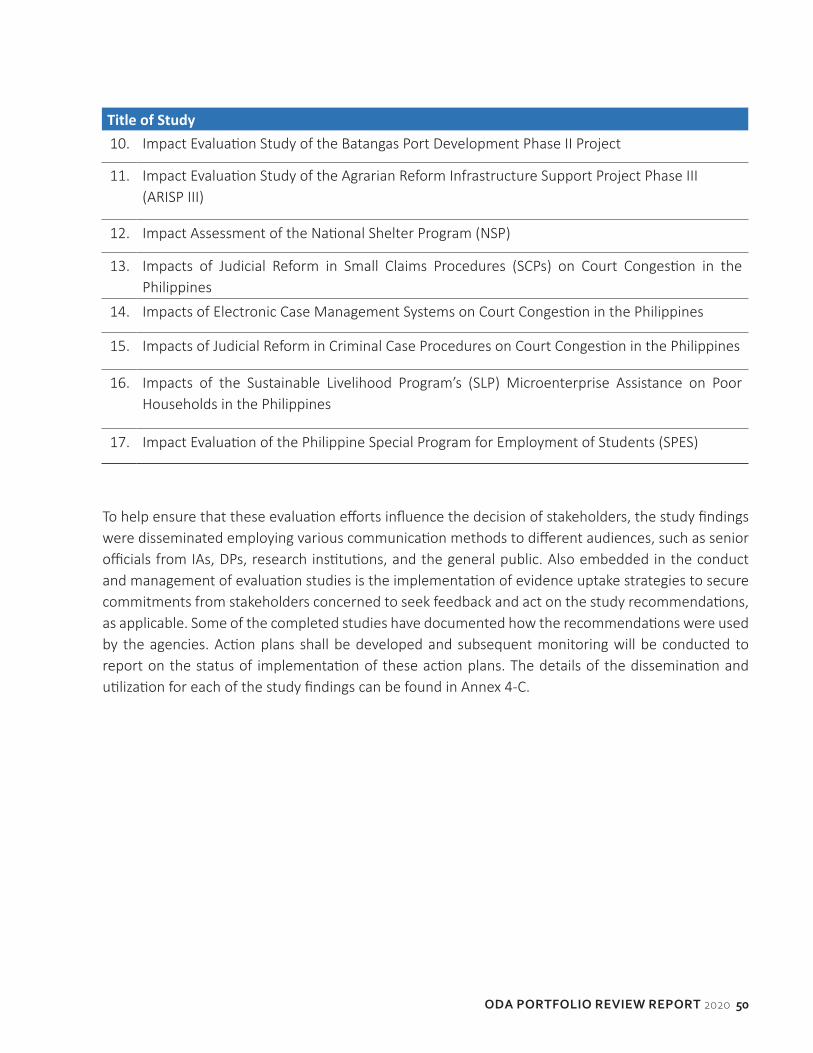
ODA PORTFOLiO REviEW REPORT 2020 50
To help ensure that these evaluation efforts influence the decision of stakeholders, the study findings were disseminated employing various communication methods to different audiences, such as senior officials from IAs, DPs, research institutions, and the general public. Also embedded in the conduct and management of evaluation studies is the implementation of evidence uptake strategies to secure commitments from stakeholders concerned to seek feedback and act on the study recommendations, as applicable. Some of the completed studies have documented how the recommendations were used by the agencies. Action plans shall be developed and subsequent monitoring will be conducted to report on the status of implementation of these action plans. The details of the dissemination and utilization for each of the study findings can be found in Annex 4-C.
Title of Study10. Impact Evaluation Study of the Batangas Port Development Phase II Project
11. Impact Evaluation Study of the Agrarian Reform Infrastructure Support Project Phase III(ARISP III)
12. Impact Assessment of the National Shelter Program (NSP)
13. Impacts of Judicial Reform in Small Claims Procedures (SCPs) on Court Congestion in the Philippines
14. Impacts of Electronic Case Management Systems on Court Congestion in the Philippines
15. Impacts of Judicial Reform in Criminal Case Procedures on Court Congestion in the Philippines
16. Impacts of the Sustainable Livelihood Program’s (SLP) Microenterprise Assistance on Poor Households in the Philippines
17. Impact Evaluation of the Philippine Special Program for Employment of Students (SPES)

ODA PORTFOLiO REviEW REPORT 2020 51
Exogenous and endogenous factors affected the implementation of 87 ODA projects. The COVID-19 pandemic gave rise to new implementation issues, which required implementing and oversight agencies to adjust existing strategies, processes, and policies. While the pandemic presented new challenges to the GPH and its various partners in handling the unusual situation, it also resulted in a paradigm shift to ensure that ODA remains effective and adaptive to the new normal.
5.1 Issues Affecting Implementation and Performance and Measures Taken/To Be Taken
A summary of various issues encountered in project implementation in 2020 is provided in Table 5.1. Issues arising from the pandemic were separately accounted for, in addition to the recurring implementation issues reported by the agencies. Various implementation issues caused agencies to request for the restructuring of 26 projects in 2020, with another 21 projects likely to be restructured in 2021, while the rest of the implementation issues would only require project-level and agency-specific interventions. See Annex 5-A for a list of projects with issues and the corresponding actions taken or measures to be taken by the agencies.
Keyimplementationissues
05
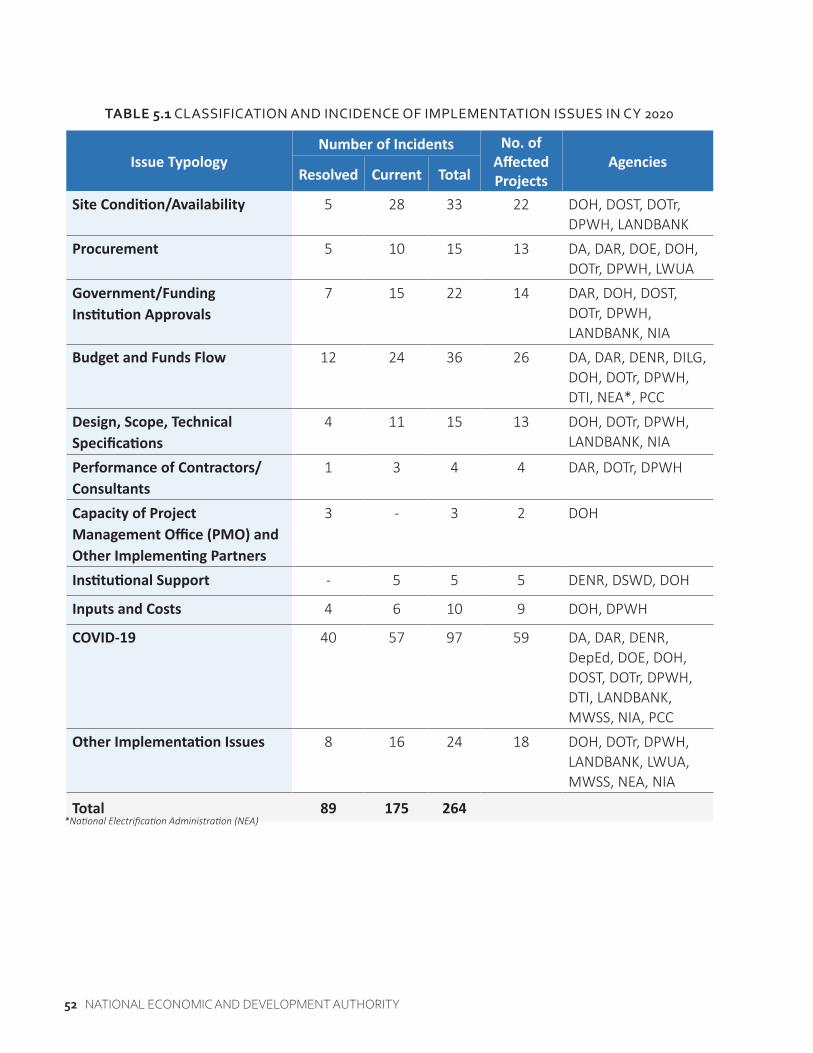
52 NATIONAL ECONOMIC AND DEVELOPMENT AUTHORITY
TABLE 5.1 CLASSIFICATION AND INCIDENCE OF IMPLEMENTATION ISSUES IN CY 2020
Issue Typology Number of Incidents No. of
Affected Projects
AgenciesResolved Current Total
Site Condition/Availability 5 28 33 22 DOH, DOST, DOTr, DPWH, LANDBANK
Procurement 5 10 15 13 DA, DAR, DOE, DOH, DOTr, DPWH, LWUA
Government/Funding Institution Approvals
7 15 22 14 DAR, DOH, DOST, DOTr, DPWH, LANDBANK, NIA
Budget and Funds Flow 12 24 36 26 DA, DAR, DENR, DILG, DOH, DOTr, DPWH, DTI, NEA*, PCC
Design, Scope, Technical Specifications
4 11 15 13 DOH, DOTr, DPWH, LANDBANK, NIA
Performance of Contractors/ Consultants
1 3 4 4 DAR, DOTr, DPWH
Capacity of Project Management Office (PMO) and Other Implementing Partners
3 - 3 2 DOH
Institutional Support - 5 5 5 DENR, DSWD, DOH
Inputs and Costs 4 6 10 9 DOH, DPWH
COVID-19 40 57 97 59 DA, DAR, DENR, DepEd, DOE, DOH, DOST, DOTr, DPWH, DTI, LANDBANK, MWSS, NIA, PCC
Other Implementation Issues 8 16 24 18 DOH, DOTr, DPWH, LANDBANK, LWUA, MWSS, NEA, NIA
Total 89 175 264 *National Electrification Administration (NEA)

ODA PORTFOLiO REviEW REPORT 2020 53
Impact of COVID-19. The imposition of community quarantines to control the spread of the COVID-19 virus affected the implementation of 59 ongoing ODA programs and projects. Of the 97 COVID-19-related issues affecting project implementation, 40 were already resolved. Major COVID-19-related issues encountered by typology are shown in Table 5.2.
TABLE 5.2 PROJECTS WITH COVID-19-RELATED ISSUES
Issue TypologyNumber of Incidents No. of
Affected Projects
AgenciesResolved Current Total
Securing visas for foreign nationals engaged with the project
2 9 11 11 DOST, DOTr, DPWH, MWSS
Deployment of foreign/local staff due to travel restrictions
9 8 17 15 DA, DAR, DENR, DOE, DOH, DOST, DOTr, MWSS
Delays in materials/service delivery, deployment in manpower, and additional cost related to health and safety measures
8 9 17 17 DepEd, DOE, DOST, DOTr, DPWH
Procurement delays 1 4 5 5 DOTr, DOST, DPWH
Securing permits/clearance/ approvals of government/DPs
2 1 3 3 DOTr, MWSS, NIA
Budget cuts/realignment of funds
4 2 6 5 DAR, DOST, DPWH, PCC
Delays in contract implementation and suspension of project activities (due to the enhanced community quarantine)
11 24 35 31 DA, DAR, DENR, DOH, DOTr, DOST, DPWH, DTI, MWSS, LANDBANK, NIA
Others 3 0 3 3 DOH, PCC
Total 40 57 97 -

54 NATIONAL ECONOMIC AND DEVELOPMENT AUTHORITY
TABLE 5.3 PROJECTS WITH RESTRUCTURING REQUESTS IN 2020
Nature of Restructuring Projects/IA/DP Issue
Typologies Status of Review/Approval
For Investment Coordination Committee (ICC) ApprovalIncrease in cost Davao City Bypass
Construction Project/ DPWH/JICA
Processing of approvals, budget and funds flow, and COVID-19
The request was approved by the ICC-CC on December 20, 2019 and confirmed by the NEDA Board on January 28, 2020.
Flood Risk Management Project – Cagayan, Tagaloan and Imus River/DPWH/JICA
Site condition and COVID-19
The ICC-TB endorsed the request on March 17, 2021 for ICC-CC ad referendum approval.
Flood Risk Management Project – Cagayan de Oro River/DPWH/ JICA
Design, scope and technical specifications
Ongoing review by the ICC Secretariat.
Integrated Disaster Risk Reduction – Climate Change Adaptation in Low-lying Areas in Pampanga Bay/DPWH/ KEXIM-EDCF
Site condition The ICC-TB endorsed the request on March 17, 2021.
5.2 Projects which Require Restructuring
Project restructuring requests cover changes in cost and scope, extension of loan/grant and implementation duration period, and loan reallocation that are submitted by the agencies to approving bodies such as the ICC and the DBCC.
Projects with restructuring requests in 2020. NEDA received 33 restructuring requests from various agencies involving 26 projects. Out of the 33 requests, 22 were approved by the ICC-TB/CC/NEDA Board and two were approved by the DBCC in 2020. The remaining nine requests were still being reviewed by the ICC Secretariat as of end 2020. See Annex 5-B for details of the project restructuring requests in 2020. Table 5.3 is a summary of projects with restructuring requests, corresponding implementation issues encountered, and status of review/approval.

ODA PORTFOLiO REviEW REPORT 2020 55
Nature of Restructuring Projects/IA/DP Issue
Typologies Status of Review/Approval
Extension of loan/grant validity period
Cebu Bus Rapid Transit/ DOTr/WB and Agence Française de Développement (AFD)
Site condition, budget, and funds flow, and design, scope, and technical specifications
The request for the two-year loan validity extension was endorsed by the ICC-TB for ICC-CC approval on December 9, 2020.
Update: The request was approved by ICC-CC on February 22, 2021.
AFD Loan: The extension of the AFD loan was signed on March 31, 2021.
WB Loan: The WB concurred with the extension of the International Bank for Reconstruction and Development (IBRD) and Clean Technology Fund (CTF) loans on June 3, 2021.
Capacity Enhancement of Mass Transit Systems in Metro Manila – LRT Line 1 South Extension Project and LRT Line 2 East Extension Project/ DOTr/JICA
Site condition, budget and funds flow, and COVID-19
The request was approved by the ICC-CC on November 19, 2020 and confirmed by the NEDA Board on November 26, 2020.
Photo courtesy of DOTr/LRT-1 South Extension Civil Works for Viaducts and Stations

56 NATIONAL ECONOMIC AND DEVELOPMENT AUTHORITY
Nature of Restructuring Projects/IA/DP Issue
Typologies Status of Review/Approval
Extension of implementation period only
Flood Risk Management Project – Cagayan, Tagaloan and Imus River/DPWH/JICA
Site condition and COVID-19
The request was endorsed by the ICC-TB for ICC-CC approval on December 9, 2020.
Update: The request was approved ad referendum by the ICC-CC on February 22, 2021.
Capacity Enhancement of Mass Transit Systems in Metro Manila – LRT Line 1 South Extension Project
COVID-19 The request was endorsed by the ICC-TB for ICC-CC approval on December 9, 2020.
Update: The request was approved ad referendum by the ICC-CC on February 22, 2021 and was confirmed ad referendum by the NEDA Board on March 24, 2021.
Capacity Enhancement of Mass Transit Systems in Metro Manila – LRT Line 2 East Extension Project
Procurement The request was endorsed by the ICC-TB for ICC-CC approval on December 9, 2020.
Update: The request was approved ad referendum by the ICC-CC on February 22, 2021 and was confirmed ad referendum by the NEDA Board on March 24, 2021.
Mindanao Sustainable Agrarian and Agriculture Development/DAR/JICA
Performance of contractors and COVID-19
A no objection letter was relayed by the ICC-TB to DAR on September 24, 2020.
MRT 3 Rehabilitation Project/DOTr/JICA
Budget and funds flow and COVID-19
The request was endorsed by the ICC-TB for ICC-CC approval on December 9, 2020.
Update: The request was approved ad referendum by the ICC-CC on February 22, 2021.

ODA PORTFOLiO REviEW REPORT 2020 57
Nature of Restructuring Projects/IA/DP Issue
Typologies Status of Review/Approval
Binondo-Intramuros and Estrella-Pantaleon Bridges Project/DPWH/ China
Site condition, inputs and cost, and COVID-19
The request was endorsed by the ICC-TB for ICC-CC approval on December 9, 2020.
Update: The request was approved ad referendum by the ICC-CC on February 22, 2021.
Road Upgrading and Preservation Project/ DPWH/JICA
Site condition, design, scope, and technical specifications, performance of contractors, inputs and costs, force majeure, and COVID-19
The request was endorsed by the ICC-TB for ICC-CC approval on December 9, 2020.
Update: The request was approved ad referendum by the ICC-CC on February 22, 2021.
Photo courtesy of DOTr/LRT-2 East Extension Viaduct Installation of OCS Cantilever
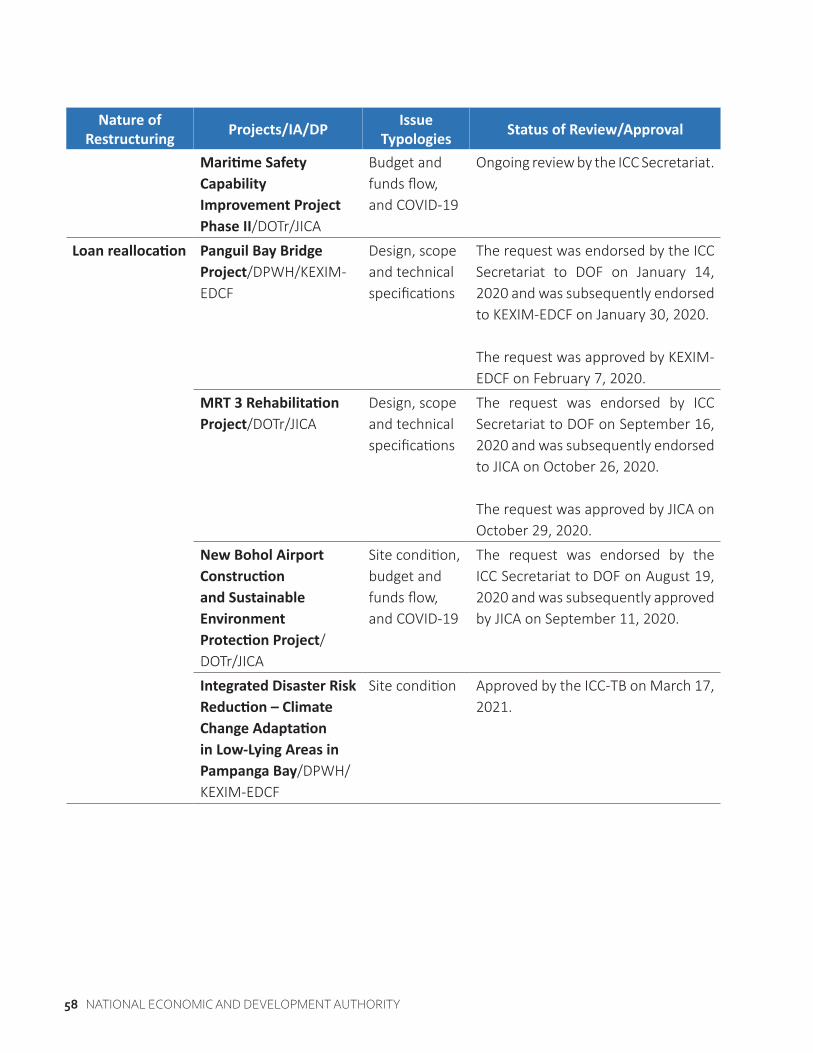
58 NATIONAL ECONOMIC AND DEVELOPMENT AUTHORITY
Nature of Restructuring Projects/IA/DP Issue
Typologies Status of Review/Approval
Maritime Safety Capability Improvement Project Phase II/DOTr/JICA
Budget and funds flow, and COVID-19
Ongoing review by the ICC Secretariat.
Loan reallocation Panguil Bay Bridge Project/DPWH/KEXIM-EDCF
Design, scope and technical specifications
The request was endorsed by the ICC Secretariat to DOF on January 14, 2020 and was subsequently endorsed to KEXIM-EDCF on January 30, 2020.
The request was approved by KEXIM-EDCF on February 7, 2020.
MRT 3 Rehabilitation Project/DOTr/JICA
Design, scope and technical specifications
The request was endorsed by ICC Secretariat to DOF on September 16, 2020 and was subsequently endorsed to JICA on October 26, 2020.
The request was approved by JICA on October 29, 2020.
New Bohol Airport Construction and Sustainable Environment Protection Project/DOTr/JICA
Site condition, budget and funds flow, and COVID-19
The request was endorsed by the ICC Secretariat to DOF on August 19, 2020 and was subsequently approved by JICA on September 11, 2020.
Integrated Disaster Risk Reduction – Climate Change Adaptation in Low-Lying Areas in Pampanga Bay/DPWH/ KEXIM-EDCF
Site condition Approved by the ICC-TB on March 17, 2021.

ODA PORTFOLiO REviEW REPORT 2020 59
Nature of Restructuring Projects/IA/DP Issue
Typologies Status of Review/Approval
Change in cost and extension of implementation period and loan validity
New Cebu International Container Port/DOTr/ KEXIM-EDCF
Site condition, procurement, processing of approval, budget and funds flow, and COVID-19
Ongoing review by the ICC Secretariat.
Change in scope, increase in cost, and implementation period extension
Cebu Bus Rapid Transit/ DOTr/WB and AFD
Site condition, budget and funds flow, and design, scope, and technical specifications
Ongoing review by the ICC Secretariat of DOTr’s request for change in scope and increase in cost.
Update: The request for implementation period extension was endorsed by the ICC-TB for ICC ad referendum approval on May 21, 2021.
Photo courtesty of DPWH/Estrella-Pantaleon Bridge

60 NATIONAL ECONOMIC AND DEVELOPMENT AUTHORITY
Nature of Restructuring Projects/IA/DP Issue
Typologies Status of Review/Approval
Change in scope, utilization of loan balance, and extension of implementation period
Maritime Safety Capability Improvement Project Phase I/DOTr/ JICA
Design, scope, and technical specifications
Ongoing review by the ICC Secretariat.
Change in scope and loan reallocation
Philippines COVID-19 Emergency Response Project (PCERP)/DOH/ WB
Design, scope, and technical specifications
The request was approved ad referendum by the ICC-CC on December 11, 2020 and confirmed ad referendum by the NEDA Board on December 14, 2020.
Update: The ICC-TB noted the revised additional loan financing for PCERP from USD300 million to USD500 million on February 24, 2021. The additional loan financing from the WB became effective on March 31, 2021.
Health System Enhancement to Address and Limit (HEAL) COVID-19/DOH/ ADB and AIIB
Design, scope, and technical specifications, and COVID-19
The request was approved ad referendum by the ICC-CC on December 11, 2020 and confirmed ad referendum by the NEDA Board on December 14, 2020.
Update: The ICC-TB noted the revised additional loan financing for HEAL to be co-financed by the ADB with an increase in loanamount from USD300 million to USD400 million and the AIIB with an additional financing amounting to USD300 million on February 24, 2021. The additional loan financing from the ADB became effective on April 15, 2021 while the loan financing from the AIIB became effective on May 10, 2021.

ODA PORTFOLiO REviEW REPORT 2020 61
Nature of Restructuring Projects/IA/DP Issue
Typologies Status of Review/Approval
Extension of implementation period, loan validity period, and loan reallocation
Forest Management Project/DENR/JICA
Procurement, institutional support, and COVID-19
The request was approved ad referendum by the ICC-CC on February 22, 2021.
Update: DOF is awaiting the official request from DENR in order to proceed with the following endorsements: (a) DFA on the extension of loan validity and (b) JICA on the reallocation of loan proceeds.
Extension of grant validity with utilization of unallocated and remaining grant balances
Emergency Assistance for Reconstruction and Recovery of Marawi – Health Component Project/DOH/ADB
Processing of approval
The request was endorsed by the ICC Secretariat to DOF on November 27, 2020.
Update: The request was approved by ADB on January 4, 2021.
Extension of implementation period, loan and/or grant validity period
Scaling-up of Cordillera Highland Agricultural Resources Management Project 2/DA/IFAD
Budget and funds flow
The request was approved ad referendum by the ICC-CC on December 18, 2020.
Update: The request was approved by IFAD on January 14, 2021.
Photo courtesy of DENR/Agroforestry Support Facilities along Pullaan Core Local Road in CAR

62 NATIONAL ECONOMIC AND DEVELOPMENT AUTHORITY
Nature of Restructuring Projects/IA/DP Issue
Typologies Status of Review/Approval
Panguil Bay Bridge Project/DPWH/KEXIM-EDCF
Procurement and COVID-19
The request was approved ad referendum by the ICC-CC on February 22, 2021 and confirmed ad referendum by NEDA Board on March 24, 2021.
Update: Approved by KEXIM-EDCF on June 14, 2021.
Integrated Disaster Risk Reduction – Climate Change Adaptation in Low-Lying Areas in Pampanga Bay/DPWH/ KEXIM-EDCF
Site condition The request was approved ad referendum by the ICC-CC on February 22, 2021.
Update: Approved by KEXIM-EDCF on June 10, 2021.
Jalaur River Multi-purpose Project/NIA/ KEXIM-EDCF
Processing of approvals and design, scope, and technical specifications
The request was approved ad referendum by ICC-CC on February 22, 2021 and confirmed ad referendum by the NEDA Board on March 24, 2021.
Photo courtesy of NIA/Jalaur Afterbay Dam

ODA PORTFOLiO REviEW REPORT 2020 63
Nature of Restructuring Projects/IA/DP Issue
Typologies Status of Review/Approval
FishCORAL/DA/IFAD COVID-19 The request was endorsed by the ICC Secretariat to DOF on December 28, 2020 and was subsequently endorsed to IFAD on December 29, 2020.
Update: Approved by IFAD on January 19, 2021.
Integrated Natural Resources and Environmental Management Project/ DENR/IFAD
Budget and funds flow, and institutional support
The request was approved by IFAD on January 19, 2021.
For DBCC approval
Change in scope Secondary Education Support Program (SESP)/DepEd/ADB
COVID-19 The request was endorsed by DOF to DBM for DBCC notation/approval on January 26, 2021.
Update: DBM, through a letter to the DOF dated January 28, 2021, informed that the DBCC-Executive Technical Board took note of the SESP restructuring.
On February 9, 2021, DOF endorsed to ADB the request of DepEd on the SESP restructuring.
Extension of implementation period, loan validity period, and loan reallocation
Senior High School Support Program/ DepEd/ADB
COVID-19 The request was approved by the DBCC through Resolution No. 2020-24 on November 18, 2020.
The request was approved by ADB on December 17, 2020.

64 NATIONAL ECONOMIC AND DEVELOPMENT AUTHORITY
TABLE 5.4 PROJECTS LIKELY TO BE RESTRUCTURED IN 2021
Nature of Restructuring Projects/IA/DP Issue
Typologies Status of Review/Approval
Increase in cost Binondo-Intramuros and Estrella-Pantaleon Bridges Project/DPWH/China
Design, scope, and technical specifications
DPWH targets to submit request for restructuring by second quarter of 2021.
Change in scope Education Pathways to Peace in Mindanao (Pathways)/DepEd and Bangsamoro Ministry of Basic, Higher and Technical Education (MBHTE)/ DFAT
COVID-19 DepEd and MBHTE have yet to finalize the request.
Capacity Building to Foster Competition Project/PCC/ADB
COVID-19 (effect on the capacity of PMO and implementing partner)
PCC requested the inclusion of DTI-Consumer Protection Group in the project’s beneficiaries through letter dated February 17, 2021.
The ICC-TB endorsed the request for ICC-CC approval ad referendum on April 15, 2021.
Implementation period extension
Integrated Natural Resources and Environmental Management Project - Bangon Marawi Comprehensive Rehabilitation and Recovery Programme/NIA/ IFAD
Procurement, COVID-19, processing of approvals
NEDA endorsed the extension of implementation period to DOF through letter dated May 10, 2021.
On May 14, 2021, DOF endorsed to IFAD the request for extension.
IFAD, in its letter dated May 27, 2021, approved the implementation period extension until December 31, 2021.
Projects Likely to be Restructured in 2021. A total of 21 projects which encountered various implementation issues are likely to be restructured in 2021. Table 5.4 provides a summary of the projects that may be restructured in 2021 and further details on the nature of the restructuring are provided in Annex 5-C.

ODA PORTFOLiO REviEW REPORT 2020 65
Nature of Restructuring Projects/IA/DP Issue
Typologies Status of Review/Approval
Arterial Road Bypass Project III/DPWH/ JICA
Site condition, COVID-19
DPWH targets to submit request for restructuring by second quarter of 2021.
Central Luzon Link Expressway Project/ DPWH/JICA
Site condition, COVID-19
DPWH targets to submit request for restructuring by second quarter of 2021.
Davao City Bypass Construction Project/ DPWH/JICA
Budget and funds flow, COVID-19
DPWH targets to submit request for restructuring by second quarter of 2021.
Loan validity extension
National Irrigation Sector Rehabilitation and Improvement Project/NIA/JICA
COVID-19 The ICC-TB, during the May 5, 2021 meeting, endorsed the request for ICC-CC ad referendum approval.
Loan reallocation Flood Risk Management Project – Cagayan de Oro River/DPWH/JICA
Design, scope, and technical specifications
DPWH submitted the request for reallocation through letter dated January 14, 2021.
NEDA endorsed the request to DOF through letter dated February 26, 2021. The proposed reallocation involves change in scope, which has to be approved by the ICC.
Increase in cost and loan reallocation
Capacity Enhancement of Mass Transit Systems in Metro Manila – LRT Line 1 South Extension Project and LRT Line 2 East Extension Project/ DOTr/JICA
Procurement DOTr submitted the request for loan reallocation through letter dated February 2, 2021. DOTr targets to submit the request for increase in cost by second quarter of 2021.
Jalaur RiverMulti-purpose Project Stage II/NIA/KEXIM-EDCF
Budget and funds flow, others
NIA targets to submit request for restructuring within May 2021.

66 NATIONAL ECONOMIC AND DEVELOPMENT AUTHORITY
Nature of Restructuring Projects/IA/DP Issue
Typologies Status of Review/Approval
Increase in cost, loan reallocation, implementation period extension and loan validity extension
Samar Pacific Coastal Road Project/DPWH/ KEXIM-EDCF
Inputs and cost, force majeure (typhoons)
DPWH submitted the request for loan reallocation through letter dated January 11, 2021, and the request for increase in cost, loan validity and implementation period extension through letter dated January 13, 2021.
Change in scope and implementation period extension
Metro Manila Interchange Construction Project Phase VI/DPWH/JICA
Site condition, procurement, design, scope, and technical specifications, COVID-19
DPWH has yet to finalize the request.
North-South Commuter Railway Project/DOTr/JICA
COVID-19 (effect on procurement), design, scope, and technical specifications
DOTr targets to submit request for restructuring by second quarter of 2021.
Photo courtesy of DPWH/Arterial Road Bypass Project Phase III

ODA PORTFOLiO REviEW REPORT 2020 67
Nature of Restructuring Projects/IA/DP Issue
Typologies Status of Review/Approval
Water District Development Sector Project/LWUA/ADB
Procurement, project uptake, others
LWUA targets to submit request for restructuring by second quarter of 2021.
Change in scope, implementation period extension and increase in cost
Metro Manila Subway Project/ DOTr/JICA
Site condition, design, scope, and technical specifications
DOTr submitted the request for restructuring on February 19, 2021.
Change in scope, implementation period extension, increase in cost, and realignment of GPH funds
Chico River Pump Irrigation Project/ NIA/China
Processing of approvals, force majeure, COVID-19
The Office of the President (OP) - Office of the Cabinet Secretary endorsed NIA’s request for restructuring for ICC review through letter dated April 19, 2021.
Change in scope, implementation period extension, loan validity extension, and reallocation of loan proceeds
Convergence on Value Chain Enhancement for Rural Growth and Empowerment/DAR/ IFAD
Capacity of PMO and implementing partner, COVID-19
DAR targets to submit request for restructuring on or before May 15, 2021.
Photo courtesy of NIA/Chico River Pump Irrigation Project

68 NATIONAL ECONOMIC AND DEVELOPMENT AUTHORITY
5.3 Other issues That Do Not Require iCC Action or Require Action Resolution at the implementing Agency Level
Fourteen agencies implementing 47 projects reported issues not involving restructuring, and thus, did not require ICC action in 2020. These issues were either resolved or will be addressed at the project/agency level as committed by implementing agencies during the one-on-one consultations. These projects are implemented by the DA (1), DAR (1), DENR (5), DILG (1), DOE (1), DOH (13), DOST (4), DOTr (6), DPWH (8), DSWD (1), DTI (1), LANDBANK (3), MWSS (1), and NEA (1). See Annex 5-D for the list of projects.
5.4 Alert Mechanism
The NEDA’s Enhanced Alert Mechanism (AM) identifies and flags projects which require priority monitoring and facilitation using 10 leading indicators on financial, physical, cost overrun, and stage of project implementation.
Nature of Restructuring Projects/IA/DP Issue
Typologies Status of Review/Approval
Metro Manila Bus Rapid Transit Project/DOTr/WB
Site condition, design, scope, technical specifications, and budget and funds flow.
DOTr has yet to finalize the request.
Implementation period extension and loan validity extension
Italian Agrarian Reform Community Development Support Program/ DAR/Italy
Budget and funds flow, COVID-19 (effect on the capacity of PMO and implementing partners)
DAR submitted the request through letter dated January 28, 2021.
The ICC-TB endorsed the request for ICC-CC approval on March 17, 2021, which was subsequently approved through ad referendum by the ICC-CC on May 17, 2021.

ODA PORTFOLiO REviEW REPORT 2020 69
BOx 5.1 THE NEDA ENHANCED ALERT MECHANISM
An Enhanced Alert Mechanism (AM) was adopted during the 68th Project Implementation Officers’ (PIO) Meeting held on April 28, 2019. Said version introduced new leading indicators that apply to priority programs and projects regardless of the source(s) of financing. The AM classifies ongoing ODA loan-assisted and ICC-approved grant-assisted projects into Potential (with one indicator category breached) and Actual problem projects (with at least two indicator categories breached). Actual problem projects are further classified into two alert levels: Level I – Early Warning Stage and Level II – Critical Stage.
ENHANCED AM iNDiCATORS
Indicator 1: Financial1a Ratio of (a) actual loan proceeds disbursements to (b) target loan proceeds disbursements
is less than 70 percent
1b Ratio of (a) actual grant proceeds disbursements to (b) target grant proceeds disbursements is less than 70 percent
1c Ratio of (a) actual disbursements from the GPH Counterpart Fund to (b) target disbursements from the GPH Counterpart Fund is less than 70 percent
1d Difference between the (a) time elapsed and (b) ratio of cumulative actual disbursements to the ICC-approved project cost is more than 30 percent
1e Difference between the (a) ratio of cumulative actual disbursements to total ICC-approved project cost and (b) actual overall weighted physical accomplishment is more than 30 percent
Indicator 2: Physical2a Negative physical slippage of at least 10 percent
2b Project with (a) delays of more than six months being experienced in its major ongoing activities in the critical path or in any ongoing component/deliverable, or (b) with some activities due for completion after the ICC-approval of the extension of implementation period/loan or grant validity
Indicator 3: Cost overrun3a Potential cost overruns of at least 10 percent of ICC-approved cost
3b Actual cost overruns of at least 10 percent of ICC-approved cost (excluding cost overrun with NEDA Board confirmation of ICC approval)
Indicator 4: Stage of project implementation4a Project is completing within a year (supplemental indicator only)
Source: NEDA (2019). Enhanced Alert Mechanism Guidelines.

70 NATIONAL ECONOMIC AND DEVELOPMENT AUTHORITY
Actual Problem Projects in CY 2020. Table 5.5 provides the AM status of 71 projects (i.e., 57 projects were carried over from 2019, and additional 14 projects were newly signed/effective and became ongoing in 2020). Thirty-four ODA loan- and grant-assisted projects were flagged as actual problem projects for priority monitoring (i.e., Alert Level II - Critical Stage and Alert Level I - Early Warning Stage) as of December 2020. Of these, 29 projects remain to be actual problem projects for the last six months (or two consecutive reporting quarters), thus, were elevated to the Critical Stage.
TABLE 5.5 SUMMARY OF ALERT STATUS OF ONGOING PROJECTS IN 2019 AND 2020
Alert Status2019 2020
Loan-Assisted
Grant-Assisted Total Loan-
AssistedGrant-
Assisted Total
Actual Problem Projects 31 1 32 32 2 34
Level II 19 - 19 27 2 29
Level I 12 1 13 5 - 5
Potential Problem Projects 8 - 8 7 1 8
Neither Actual nor Potential Problem Projects
5 1 6 9 - 9
No Assessment 1 - 1 5 - 5
Ongoing Subtotal 45 2 47 53 3 56
Completed 10 - 10 7 - 7
Newly-effective 3 - 3 4 - 4
Newly-signed 3 - 3 4 - 4
Total 61 2 63 68 3 71
The most common indicators breached by the majority of the projects classified as Critical Stage were: 1d (difference between the time elapsed and the ratio of cumulative disbursements to the ICC-approved project cost is more than 30%); and 2b (project with delays of more than six months being experienced in its major ongoing activities in the critical path or in any ongoing component/due for completion) largely due to the effects of the COVID-19 pandemic.

ODA PORTFOLiO REviEW REPORT 2020 71
TABLE 5.6 PROJECTS WITH INCOMPLETE OUTPUTS
Project/IA/Fund Source
Description of Incomplete Outputs
Measures Taken/To be Taken/ Updates
1. Mindanao Sustainable Agrarian and Agriculture Development/DAR/JICA
Works for completion beyond the December 31, 2020 loan closing include: (a) one sub-project under Agribusiness and Agroforestry Development sub-component; and (b) three sub-projects under the Infrastructure Development sub-component.
Measures being taken: DAR conducts coordination meetings and catch-up planning with implementing partners to complete the remaining sub-projects by March 2021.
Out of the 29 projects tagged as Critical Stage, four projects were restructured in 2020 as approved by the ICC while six projects had restructuring requests submitted to the ICC but were still under review as of end 2020. In addition, 13 projects identified at the Critical Stage are likely to be restructured in 2021, while the remaining six projects will be monitored closely to ensure agencies’ immediate action on reported issues and to expedite intervention towards resolution of the issues.
In terms of year-on-year comparison, out of the 51 ongoing projects assessed, 19 projects remained to be actual and potential problem projects from 2019 to 2020, 16 projects worsened to being either potential or actual problem projects, while seven projects improved from being either actual to potential problem or from potential problem to problem resolved. Four projects did not breach alert indicators as of year-end 2019 and 2020, while five were recorded as new projects in 2020. Refer to Annex 5-E for the list of projects with corresponding alert status as of year-end 2019 and 2020.
5.5 Projects with incomplete Outputs at Loan Closing in CY 2020
Three projects have incomplete outputs upon loan closing (Table 5.6).

72 NATIONAL ECONOMIC AND DEVELOPMENT AUTHORITY
Project/IA/Fund Source
Description of Incomplete Outputs
Measures Taken/To be Taken/ Updates
2. Metro Manila Wastewater Management Project (MWMP)/LANDBANK/WB
Only 91 percent of the project’s target outputs were completed upon loan closing on June 30, 2020, such as construction of sewerage treatment plants (STPs), connectivity of STPs, etc.
Measures being taken: To ensure the achievement of the Project Development Objectives, LANDBANK monitors the progress of uncompleted civil works subcontract packages financed under MWMP, maintains close coordination and collaboration with Manila Water Company, Inc. and Maynilad Water Services, Inc., and discusses possible strategies to fast-track implementation of the remaining subcontract packages.
3. New Bohol Airport Construction and Sustainable Environment Protection Project/DOTr/JICA
The original loan for the project closed on July 24, 2020, but completion of the rectification of defects during the defects notification period was moved from June 30, 2020 to December 31, 2020 due to the impacts of the COVID-19 pandemic.
Measures taken: Foreign experts of the contractor and the consultant conducted remote online inspections on the completion of minor works from April 2020 to December 2020. As of February 2021, DFA issued visa exemptions for 17 foreign experts requested by DOTr between October to December 2020. As of May 2021, nine have been deployed to the Philippines while seven more will be mobilized from June 2021 to December 2021 to complete the rectification works, conduct inspection, and facilitate site acceptance and project closing by December 2021.
5.6 Ongoing Projects with Damaged Outputs in CY 2020
Two projects (one implemented by DSWD and another by NIA) have damaged outputs in 2020 due to typhoons. Details are provided in Table 5.7.

ODA PORTFOLiO REviEW REPORT 2020 73
TABLE 5.7 PROJECTS WITH DAMAGED OUTPUTS IN 2020
Project/IA/ Fund Source Description of Damaged Outputs Measures Taken/
To be Taken/Updates
1. Kapit-Bisig Laban sa Kahirapan-Comprehensive and Integrated Delivery of Social Services – National Community-Driven Development Program (KC-NCDDP)/DSWD/WB
A total of 35 sub-projects were partially damaged in 2020 because of typhoons Rolly and Ulysses.
All 35 sub-projects were immediately repaired within 2020.
2. Chico River Pump Irrigation Project/NIA/China EXIM
The project was partly affected by Typhoons Rolly, Tonio, and Ulysses, which battered Cagayan Valley Region in late 2020. Damages were observed at the coffer dam, structure backfill (pumphouse), the main canal and the access road in Pinukpuk, Kalinga and Cagayan. Based on NIA’s assessment, these damages were not significant enough to hamper overall project implementation.
The PMO advised the Contractor to work for a crash program within 1st quarter of 2021 to catch up on the delays caused by unfavorable weather conditions, including repairs needed for the damaged outputs.
5.7 Cost Overrun Stock as of CY 2020
Cost overrun is defined as additional costs over and above the ICC-approved project cost (Section 2.1 of the Implementing Rules and Regulations of the ODA Act). Agency requests for cost overruns undergo the ICC review process mainly to determine whether the project continues to be economically viable. In 2020, the ICC received six requests for change in cost originally amounting to PHP5.89 billion. Out of the six requests, three were withdrawn, two are still subject to ICC Secretariat review as of April 2021, and one was approved in March 2021. Meanwhile, the total change in cost received in 2020 (less the three requests withdrawn) amounted to PHP4.21 billion. Annex 5-F shows the details of the six requests.

ODA PORTFOLiO REviEW REPORT 2020 74
Lessons from project/program preparation, design, and implementation that affected the performance and achievement of project/program outcomes and impacts were documented for future improvement of project/program design and implementation.
6.1 Lessons Learned on Projects with Resolved issues
A total of 89 issues were resolved related to site conditions, procurement, budget and funds flow, government funding/approval, design/scope/technical specifications, contractor performance, PMO capacity, inputs and costs, and other impacts of the COVID-19 pandemic.
Apart from individual agency actions in response to the implementation constraints brought about by the pandemic, various efforts were introduced that took a whole-of-government approach in resolving cross-cutting issues. These include:
a. ICC omnibus ad referendum approval for project restructuring requests on time extensions and reallocations of loan proceeds;
b. Government Procurement Policy Board (GPPB) Resolution Nos. 16-2019 and 09-2020 allowing the use of digital signature in all procurement-related documents to mitigate the limitation of personal signing of bidding documents, and efficient conduct of procurement activities during state of calamities and to promote business continuity in the procurement process;
c. Administrative Order (AO) No. 32 on “Expediting the review, and approval process of infrastructure flagship projects on water security”; and,
d. DFA’s issuance of the “Guidelines for Streamlined Processing of Requests for Exemption from the Temporary Suspension of Visa Issuance” to provide assistance to foreign nationals and expatriates implementing ODA to the Philippines.
Lessons Learnedand Recommendations06
75 NATIONAL ECONOMIC AND DEVELOPMENT AUTHORITY
Site condition/availability. Five projects with issues on right-of-way acquisition (RoWA) and site availability were settled through coordination with project stakeholders including securing the assistance of the concerned LGUs. Among these, one project by the DPWH, the Binondo-Intramuros Bridge Project, required the revision of the Detailed Engineering Design (DED) to circumvent the disruption of a heritage site.
Procurement. Five projects with issues on procurement were resolved. The agencies concerned coordinated with the counterpart DPs on their procurement requirements, processes, terms and conditions, and procurement strategies. The agencies also conducted orientation/consultation with possible suppliers and bidders to expand the number of firms participating in the procurement process and avoid failed bidding.
The adoption of the GPPB Resolution Nos. 16-2019 and 09-2020, allowed the use of digital signature in all procurement-related documents to ensure the efficient conduct of procurement activities during state of calamities and to promote business continuity in the procurement process.
Government/funding institution approvals. Seven projects with pending government approvals were resolved through frequent coordination meetings and review missions with the DPs and national government agencies to comply with processing and approval requirements.
Budget and funds flow. There were 12 projects with issues on insufficient budgets due to foreign exchange fluctuation or delayed budget releases following the absence of prerequisite documents [funding strategy, Forward Obligational Authority (FOA), and the updated Multi-Year Contracting Authority (MYCA)] were resolved through coordination with OAs. DBM, NEDA, and DOF facilitated the resolution of budget issues either through bilateral coordination or through the intervention of the ICC/NEDA Board.
In addition, per Section 30 of the General Provisions of the 2021 GAA signed by the President on December 28, 2020, the issuance of MYCA shall no longer be necessary for foreign-assisted projects funded by foreign loans.
Design, scope, and technical specifications. Four projects encountered bottlenecks in design, scope, or technical requirements. The implementing agencies resolved these issues through the (a) streamlining of loan availment processes and continuing marketing drives which improved the beneficiaries’ uptake on the existing socialized lending programs; (b) application of no-cost extension to accommodate change in priorities; and (c) introduction of an alternative construction sequence and methodology for civil works.

ODA PORTFOLiO REviEW REPORT 2020 76
Performance of contractors/consultants. The implementation of one project was stalled due to the unavailability of the contracted firm’s resources/equipment for road construction. The DPWH instructed said contractor to mobilize necessary resources (materials and equipment) and fast-track implementation to cope with the delays encountered.
Capacity of PMO and other implementing partners. Three projects encountered manpower issues due to security of tenure and risk of unemployment following the forthcoming completion of projects. The concerned agencies continuously hired equivalent human resource complement and applied staffing adjustments and re-organizations.
Inputs and costs. Four projects encountered issues on input materials and some corrective measures were adopted, including: (a) difficulty in transporting materials (e.g., antiretroviral drugs) was addressed by utilizing community centers as alternative distribution nodes; (b) non-compliance to the required specification for the submersible pumps was immediately rectified through replacement and delivery; and (c) claims by the contractor on quantities of unsuitable construction materials were investigated and approved by DPWH.
COVID-19 pandemic. The COVID-19 pandemic forced agencies to adopt new and innovative coordination and communication mechanisms for continued collaboration among various project stakeholders and LGUs. This includes, among others: (a) maximization of the use of online platforms (e.g., MS Teams, Skype, Zoom Application) for virtual consultation/coordination meetings; and (b) use of information technology (e.g., remote sensing and geo-tagging) to bring together stakeholders and information from far-flung project areas which lessened the adverse impacts or risks of force majeure events during project implementation.
In addition, agencies adopted the requirements for social distancing and other health precautionary measures in project implementation.
On the issue on the suspension of project consultants’ entry visas amidst the travel restrictions caused by the pandemic, NIA sought assistance from the Inter-Agency Task Force on COVID-response, i.e., DOF, BOC, DFA, and other agencies. DFA granted the entry permits through the issuances of Single Entry 9(a) Visas.
DFA likewise issued the Guidelines for Streamlined Processing of Requests for Exemption from the Temporary Suspension of Visa Issuance to assist foreign nationals and expatriates implementing ODA in the Philippines.

77 NATIONAL ECONOMIC AND DEVELOPMENT AUTHORITY
The DOF, NEDA, DBM, and BSP implemented arrangements and took swift steps to review projects/programs and issue the necessary approvals to respond to the government’s financing requirements for pandemic response and recovery. At the oversight level, the ICC and the DBCC adopted arrangements to ensure that project/program processing will not be hampered to remain responsive to the priorities for post-pandemic recovery. These include the use of alternative arrangements such as utilizing online platforms (e.g., MS Teams, Skype, Zoom Application) for the conduct of video conferences/virtual meetings.
6.2 Lessons Learned on Projects with Current issues
This year’s ODA portfolio encountered 175 pending issues encountered in 69 projects that were related to site condition, procurement, government funding/approval, budget and funds flow, design/scope/technical specifications, contractors’ performance, PMO capacity, institutional support, inputs/costs, and the COVID-19 pandemic. More analysis, consultations, and specific interventions either at the implementation- or policy-level need to be pursued by the implementing agencies and coordinated for appropriate institutional responses from oversight agencies. Of the 69 projects, a total of 21 projects, which encountered various implementation issues, are expected to be restructured in 2021.
The following are recommendations to address the pending issues:
Site conditions. There are 28 projects reported to have pending issues related to delays and challenges in securing an appropriate project site. Implementing agencies need to resolve RoWA issues, determine possible alternative sites, and allocate resource requirements at the planning stage. Parallel information and communication drives with project-affected persons must be conducted to formalize agreements and compensation packages.
Implementing agencies should also consider having joint memoranda of agreement (MOAs) with key public utility agencies (e.g., MWSS, DOE, DPWH, etc.) to prescribe guidelines and procedures for the relocation of electric transmission lines, water utility pipes, and other utilities obstructing project sites or right-of-way, as well as for the payment, compensation, and/or recovery of costs pertinent to the relocation of said utilities in areas affected by the implementation of infrastructure projects.
Procurement. Currently, there are 10 projects with unresolved issues related to procurement, such as delays in the delivery of goods/services and failed biddings. To avoid procurement delays, agencies should undertake early preparation of TORs for civil works and consulting services to enable the conduct of advance procurement.

ODA PORTFOLiO REviEW REPORT 2020 78
In contract preparation, all details must be clearly specified to avoid ambiguous interpretations and misunderstandings between the contractor and the IA. In turn, IAs should ensure that punitive clauses in the contracts are enforced properly to compel the consultant’s/contractor’s compliance with requirements and expected deliverables within the agreed timeline. Furthermore, agencies must maintain an updated database of the roster of suppliers, consultants, and contractors to minimize failures of bidding.
Government/funding institution approvals. There are 15 projects that need to resolve delays in the approval of requirements and funding. Agencies must be aware of the policies and guidelines (e.g., resettlement, environmental safeguards, RoWA) of DPs, as well as GPH budgetary, procurement, and approval processes, to ensure smooth implementation of the project. Coordination and commitment among agencies, affected utility companies, and concerned LGUs should be immediately undertaken to facilitate timely securing of permits, necessary approvals (i.e., Certification Precondition for the Free, Prior and Informed Consent Process, Environmental Compliance Certificate, and the Special Use Agreement in Protected Areas), and relocation of affected utilities as deemed necessary.
For projects which require restructuring, IAs should already consider the processing timelines for the evaluation, approval, and other relevant procedures of the GPH and DPs in their proposals.
Budget and funds flow. A total of 24 projects have pending issues on budget and funds flow. A common lesson learned for IAs is to ensure that timelines of all project activities are in sync with the timing and availability of budget and government approvals. The budget and finance units of IAs should closely coordinate with the concerned DBM operations bureaus for the early preparation of budget-related documents and compliance with requirements.
IAs must firm up the annual budgetary requirements in a post COVID-19 scenario for all ongoing projects from 2021 and beyond and address the disbursement backlogs as of December 2020. PMOs should secure internal budget support and commitment from their respective heads of agencies for the implementation and timely completion of all ongoing ODA projects. Requests for special budget under the FY 2021 Unprogrammed Appropriations must be prioritized for projects that are implementation-ready to ensure that the budget requested shall be disbursed within the year.
Design, scope, and technical specifications. There are 11 projects with reported pending implementation issues caused by unforeseen changes in design, scope, technical inputs, and costs. To ensure proper management of changes such as variation orders, cost increases, and/or implementation duration extensions, DEDs should be revisited and updated prior to proceeding with actual procurement activities. Similarly, outdated feasibility studies should be updated to better reflect cost estimates, technological advances, emerging policies, and changes in institutional arrangements, among others.

79 NATIONAL ECONOMIC AND DEVELOPMENT AUTHORITY
Agencies need to ensure quality at entry of project proposals by incorporating institutional capacity assessment and development, risk analysis, and social and environmental safeguards in project design and preparation.
Performance of contractors/consultants. Three projects were reported to have unresolved issues related to contractor performance. IAs must manage contractor performance to ensure that contracts and deliverables are carried out as planned.
Institutional support. Five projects incurred delays caused by lack of/minimum cooperation from stakeholders. Thus, regular coordination with partners were continuously conducted to compensate for the slow communication and feedback on implementation documents, unavailability of services and commodities, and conflict of interest among stakeholders. The implementing agencies and the development partner concerned need to strengthen their role as convenors to influence improvements to coordination mechanisms, build alliances and partnerships, and strengthen knowledge management across and between key sectors.
Inputs and costs. Six inputs- and costs-related issues that remain unresolved are connected more specifically to RoWA. Agencies must be able to allocate budget increase for RoWA costs pursuant to the Right-of-Way Act prescribing the use of the current market value of land.
COVID-19 pandemic. With the prevailing COVID-19 pandemic, recurring issues are still expected such as securing visas of foreign nationals, securing permits/clearance/approvals of government/DPs, budget cuts/realignment of funds, travel restrictions, procurement and contract implementation delays, materials/ service delivery delays, reduction in manpower deployment, and additional cost related to health and safety measures.
IAs should ensure that COVID-19 health precautionary measures and safety protocols are enforced to prevent further spread of the virus while catch-up plans are firmed up and implemented to factor in the “new normal.” Finally, IAs should promptly respond to the DFA’s requirements for visa entry issuance as may be required by their foreign nationals and expatriate staff in implementing ODA in the Philippines.
In addition, various initiatives and efforts undertaken by the national government with DPs have been vital in adapting to the new normal arrangements. For instance, in the case of JICA projects, there is the DOF led or co-organized high-level and technical-level meetings to extensively discuss with oversight agencies and project stakeholders (e.g., contractors, consultants) implementation performance and address the effects of the COVID-19 pandemic on Japan ODA project implementation. Through this initiative, the government was able to respond to the issues in the field, come up with response measures with the DP, and monitor the concerns.

ODA PORTFOLiO REviEW REPORT 2020 80
6.3 Other Recommendations for 2021 and Beyond
On capacity development. To further strengthen the PMO’s capacity to manage projects, agencies need to maximize the assistance from DPs in terms of capacity building in all aspects of ODA portfolio management and in the various stages of the project cycle. This includes procurement, contract management, project management, financial management, new implementation schemes (such as design-and-build contracts), monitoring and evaluation, and other technical aspects of the projects.
On financial management of ODA loans. Agencies should be guided by the DBM’s issuance of National Budget Circular No. 581 (Clarificatory Guidelines and Procedures Applicable to Foreign-Assisted Projects following the Cash Budgeting System and Treasury Single Account Framework) in December 2020, which intends to improve the financial management of foreign-assisted programs and projects.
On monitoring and evaluation. IAs must ensure that all projects embed monitoring and evaluation of outputs and outcomes, and should have monitoring and evaluation plans submitted both to NEDA and DBM. PMOs/IAs need to consistently submit to NEDA complete project updates highlighting physical and financial accomplishments consolidated at the project level, critical issues encountered, progress and actions being taken on approved catch-up plans, risk mitigation measures, and project outcomes/results. Agencies must actively participate in Project Implementation Review meetings to ensure agreements reached are followed through for the timely and expeditious resolution of emerging project issues.
Project Completion Reports (PCR) must be submitted to NEDA, for all completed projects/closed loans six months after project completion/loan closing. For projects nearing completion, IAs may start preparing PCRs, ideally six months prior to the actual closing/completion date. IAs must continuously monitor and report projects which remain unfinished upon loan or grant closing.
To sustain knowledge management strategies, IAs must continue to upload monthly project updates in the NEDA Knowledge Management Systems for the IFPs.
Agencies should also support the interventions of the Anti-Red Tape Authority (ARTA) in the following: (a) monitoring of Administrative Order No. 32 compliance with approval processes covering the issuance of necessary permits and (b) facilitating the resolution of issues encountered by IAs in complying with said approval processes for IFPs on water security.

ODA PORTFOLiO REviEW REPORT 2020 81
Review of ODA Grantsin the Philippines
07The Organization for Economic Cooperation and Development (OECD) defines grants as “transfers made in cash, goods or services for which no repayment is required.”54 Grant assistance comes in the form of: (a) technical assistance (policy/thematic studies, studies for project preparation, advisory services); (b) emergency/relief; (c) technical cooperation (consultants, expert, training, and other forms of capacity building); (d) capital grants (facility, equipment, and infrastructure); and (e) mixed (having components belonging to different categories). NEDA’s reporting of grants covers projects where the GPH is either the primary implementing agency or the beneficiary, with the exception of those coursed through non-government entities (e.g., civil society organization and private sector).
Over the years, grants have complemented the ODA loans availed by the GPH to improve institutional capacity, establish organizational or policy reforms, streamline processes and systems of GPH agencies, and formulate masterplans and feasibility studies, among others.
The GPH continues to recognize the importance of ODA grants as supplementary financing for development interventions, as observed in the increase in the magnitude of ODA grants from USD1.64 billion in 2019 to USD1.67 billion in 2020. The top providers of grants assistance as of year-end 2020, are USA, EU, and UN System with 32.92 percent, 13.84 percent, and 12.48 percent shares of the total grants portfolio, respectively. While 47 percent of the active ODA portfolio went to the INFRA sector, ODA grants were focused on the SRCD and the GID sectors.
54 OECD (n.d.) “Glossary of Statistical Terms” in OECD website. Retrieved on May 12, 2021 from https://stats.oecd.org/glossary/detail.asp?ID=1143#:~:text=OECD%20Statistics,which%20no%20repayment%20is%20required

82 NATIONAL ECONOMIC AND DEVELOPMENT AUTHORITY
Grants are generally provided by the DPs through their respective programming/budgeting/procurement processes, and have minimal to no counterpart budgetary requirements. Due to this, efforts to monitor and evaluate grant aid effectiveness are made largely by the grant providers rather than the recipients. However, as laid out in the Paris Declaration on Aid Effectiveness, aside from value-for-money, aid effectiveness (regardless of modality) must also be measured in terms of country ownership, alignment of development priorities, focus on sustainable and measurable results, and mutual accountability.
In this regard, NEDA undertook a preliminary review of the effectiveness of 45 ODA grant projects/programs (details in Annex 7-A) covering eight of the largest providers of non-capital grants assistance in the country: ADB, Australian DFAT, EU, JICA, KOICA, UNDP, USAID, and WB. The review examined the results of existing evaluation studies/assessments conducted or commissioned by the DPs within their multi-year country assistance frameworks (CAF) under the current administration.
Framework of loans and grants assistance to the GPH. The GPH and DPs jointly prepare CAF or country partnership strategies (CPS) to improve coordination, alignment, and harmonization of aid delivery and use toward common results and objectives. CAFs/CPSs are anchored on the priority sectors to which DPs commit to provide ODA loans and grants assistance to the Philippines. The details of the priority sectors of seven DPs based on the development thrusts of the current administration are as follows:
ADB: (a) infrastructure development; (b) social reform and community development (health, social protection, education); and (c) governance and institutions development (reforms, human resource development) Australia DFAT: (a) social infrastructure; (b) trade; (c) education; (d) human resource development; (e) financial management; and (f) peace EU: (a) rule of law and needed governance reforms in justice sector institutions; (b) inclusive growth through access to sustainable energy and job creations; and (c) peacebuilding in Mindanao JICA: (a) sustainable economic growth (infrastructure, maritime law enforcement, energy, information and communications technology, human resource development); (b) human security for inclusive growth (disaster management, environment, water/sewerage system, and waste management); (c) peace and development in Mindanao KOICA: (a) education; (b) health; (c) governance; (d) agriculture, forestry, and fisheries; and (e) technology, environment, and energy
ODA PORTFOLiO REviEW REPORT 2020 83
UNDP: (a) eradicating poverty in all its forms and dimensions; (b) accelerating structural transformations; and (c) building resilience to shocks and crises
USAID: (a) democratic governance; (b) human capital development; (c) environmental and community resilience; and (d) peace and stability in conflict-affected areas in Mindanao WB: (a) education; (b) health services; (c) social protection; (d) budget execution; (e) fostering competition; (f) infrastructure development; (g) agricultural development; (h) basic services in conflict-affected areas; (i) support to the Bangsamoro Regional Government; and (j) resilience from natural disasters and climate change
The recurring themes of country assistance of the eight DPs covered in this section are inclusive economic growth, infrastructure, human development, and rural development. These are reflected in the grant assistance the country has been receiving for decades from these donors, which are also responsive to the desired outcomes and outputs across several PDP-RM 2017-2022 chapters as analyzed for this year’s report.
The review of existing literature reveals a generally positive impact of grants in supporting the government’s development thrusts enshrined in the PDP. These include the following:
a. The roll-out and institutionalization of the ADB-funded JobStart program enabled the DOLE-Public Employment Service Offices to provide employment to over 21,000 at-risk youth (Chapter 9: Expanding Economic Opportunities in Industry and Services through Trabaho and Negosyo);
b. USAID’s assistance under its Country Development Cooperation Strategy for 2019-2024 supported the improvement of family planning services and tuberculosis prevention in the country (Chapter 10: Accelerating Human Capital Development);
c. The package of interrelated UNDP grants assistance created an enabling environment for the establishment of the Comprehensive Agreement on the Bangsamoro, ultimately resulting in the ratification of the Bangsamoro Organic Law and the creation of BARMM (Chapter 17: Attaining Just and Lasting Peace);
d. JICA’s development strategy for the country’s infrastructure sector underscores the need to strengthen the capacities of DPWH and DOTr – agencies at the forefront of the Build, Build, Build program – by developing much-needed transportation databases and technical manuals for bridge repairs, among others (Chapter 19: Accelerating Infrastructure Development); and
e. WB’s initiatives for cleaner environment, such as the Chiller Energy Efficiency Project, reduced the energy consumption in beneficiary sites to 35 gigawatt hours per year due to the installation of new energy-efficient chillers (Chapter 20: Ensuring Ecological Integrity, Clean and Healthy Environment).

84 NATIONAL ECONOMIC AND DEVELOPMENT AUTHORITY
In addition, DPs extend grant assistance to support emergent GPH priorities and needs, such as disaster/pandemic response and recovery.
Rebuilding Marawi is a key feature of the Duterte Administration’s development agenda, with several DPs pitching in to assist affected communities towards recovery. Various grant projects/programs mainly focused on restoring basic services on infrastructure (installation of solar street lights and restoration of water supply), health (provision of pre-natal and postnatal care), education (distribution of teaching manuals and student workbooks and establishment of learning centers), and livelihood (provision of training in enterprise management and access to micro-finance).
However, while grant aid generally works to benefit institutions and individuals in recipient countries, there were issues identified, which may decrease the effectiveness and impact of ODA grants.
Many bilateral grants are tied aid. While there are some benefits of tied aid in terms of maximizing the DPs’ comparative advantage in technological and human resources, the use of DPs’ own systems (e.g., procurement) for delivering goods and services under grant agreements may diminish GPH ownership and accountability over the project.
Another concern is on the low predictability of grants assistance primarily due to the nature of country partnership agreements. Some country partnership arrangements (e.g., USAID and some UN agencies) do not immediately identify the sub-projects under a particular grant assistance program, except when these are packaged with loan assistance. Demand for grant projects is mostly determined later, or within the project implementation period. In the case of the Philippines, implementing agencies may also directly tap grant assistance from DPs as necessary, hence, there is no incentive to program grant assistance in advance during programming consultations/dialogues.
Lastly, evaluation studies are generally commissioned by the DPs unilaterally, which lead to low utilization of findings by the GPH. The OECD-Development Assistance Committee (OECD-DAC) acknowledges this issue, noting the propensity of grant providers to commission evaluations of ODA loans and grants to satisfy their own informational requirements rather than to implement improvements in programs and projects.
To further improve the effective development and delivery of ODA grants, NEDA is proposing the following initial recommendations:
a. DPs and GPH should include in the programming discussions the pipeline for grant assistance to improve predictability of grant projects.
b. Grant projects should have transparent monitoring and evaluation mechanisms. Grant agreements should clearly specify monitoring, evaluation, and reporting responsibilities of DPs

ODA PORTFOLiO REviEW REPORT 2020 85
and implementing agencies, including provision of copies of grant agreements and regular reporting to NEDA and other oversight agencies.
c. DPs/IAs should include in the monitoring reports to NEDA relevant information on grant-assisted projects/programs (e.g., total cost and breakdown of cost by components [e.g., consulting services, equipment, training, project management], outputs, implementation duration, status). This is to improve NEDA’s capacity to monitor and evaluate grants.
d. Evaluation/assessment of ODA grants must be embedded in the design of every new grant project/program. With the rollout of National Evaluation Policy Framework (NEPF) , IAs may conduct “self-evaluation” to assess their own performance in managing the grants assistance received as well as in ascertaining its effectiveness.
Apart from the initiative of DPs (as commonly practiced) and improvement of the monitoring and evaluation capacity of implementing agencies, NEDA, through its Monitoring and Evaluation Fund, will expand the conduct and management of thematic/sector-level evaluation studies and include cluster evaluation of recently completed grants to provide a better assessment of the effectiveness of grant aid.

ODA PORTFOLiO REviEW REPORT 2020 86
National Economic and Development Authority
No. 12 Escriva Drive, Ortigas Center, Pasig City, Philippines, 1605
https://[email protected]
+632 8631 0945 to 56 NEDAhq