oecd economic surveys spain recovery is underway but making growth more inclusive remains a...
TRANSCRIPT

OECD Economic Surveys
Spain
March 2017
OVERVIEW
www.oecd.org/eco/surveys/economic-survey-spain.htm
This Overview is extracted from the 2017 Economic Survey of Spain. The Survey is published on the responsibility of the Economic and Development Review Committee (EDRC) of the OECD, which is charged with the examination of the economic situation of member countries.
This document and any map included herein are without prejudice to the status of or sovereignty over any territory, to the delimitation of international frontiers and boundaries and to the name of any territory, city or area
OECD Economic Surveys: Spain© OECD 2017
You can copy, download or print OECD content for your own use, and you can include excerpts from OECD publications, databases and multimedia products in your own documents, presentations, blogs, websites and teaching materials, provided that suitable acknowledgment of OECD as source and copyright owner is given. All requests for public or commercial use and translation rights should be submitted to [email protected]. Requests for permission to photocopy portions of this material for public or commercial use shall be addressed directly to the Copyright Clearance Center (CCC) at [email protected] or the Centre français d’exploitation du droit de copie (CFC) at [email protected].
OECD Economic Surveys: Spain
© OECD 2017
9
Executive summary
● The recovery is underway but making growth more inclusive remains a challenge
● Fostering innovative business investment is crucial to unlock productivity growth
● Reducing unemployment and improving job quality can make growth moreinclusive
EXECUTIVE SUMMARY
OECD ECONOMIC SURVEYS: SPAIN © OECD 201710
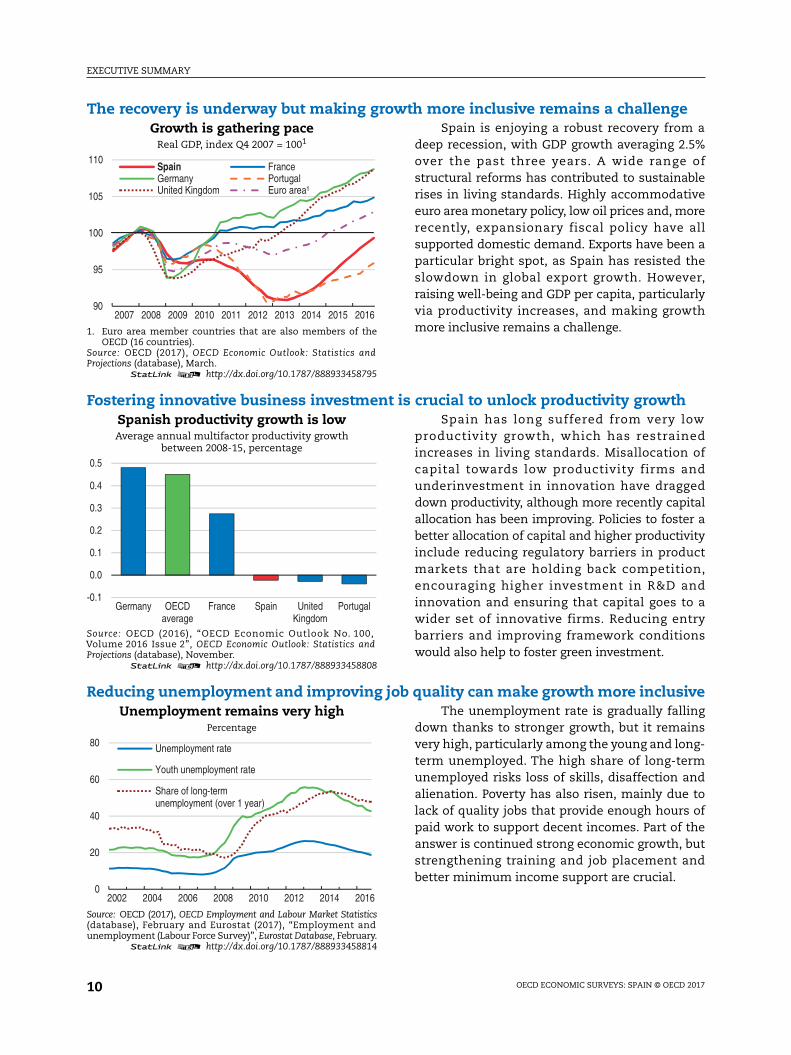
The recovery is underway but making growth more inclusive remains a challengeGrowth is gathering pace
Real GDP, index Q4 2007 = 1001
1. Euro area member countries that are also members of theOECD (16 countries).
Source: OECD (2017), OECD Economic Outlook: Statistics andProjections (database), March.
1 2 http://dx.doi.org/10.1787/888933458795
Spain is enjoying a robust recovery from adeep recession, with GDP growth averaging 2.5%over the past three years. A wide range ofstructural reforms has contributed to sustainablerises in living standards. Highly accommodativeeuro area monetary policy, low oil prices and, morerecently, expansionary fiscal policy have allsupported domestic demand. Exports have been aparticular bright spot, as Spain has resisted theslowdown in global export growth. However,raising well-being and GDP per capita, particularlyvia productivity increases, and making growthmore inclusive remains a challenge.
Fostering innovative business investment is crucial to unlock productivity growthSpanish productivity growth is lowAverage annual multifactor productivity growth
between 2008-15, percentage
Source: OECD (2016), “OECD Economic Outlook No. 100,Volume 2016 Issue 2”, OECD Economic Outlook: Statistics andProjections (database), November.
1 2 http://dx.doi.org/10.1787/888933458808
Spain has long suffered from very lowproductivity growth, which has restrainedincreases in living standards. Misallocation ofcapital towards low productivity firms andunderinvestment in innovation have draggeddown productivity, although more recently capitalallocation has been improving. Policies to foster abetter allocation of capital and higher productivityinclude reducing regulatory barriers in productmarkets that are holding back competition,encouraging higher investment in R&D andinnovation and ensuring that capital goes to awider set of innovative firms. Reducing entrybarriers and improving framework conditionswould also help to foster green investment.
Reducing unemployment and improving job quality can make growth more inclusiveUnemployment remains very high
Percentage
Source: OECD (2017), OECD Employment and Labour Market Statistics(database), February and Eurostat (2017), “Employment andunemployment (Labour Force Survey)”, Eurostat Database, February.
1 2 http://dx.doi.org/10.1787/888933458814
The unemployment rate is gradually fallingdown thanks to stronger growth, but it remainsvery high, particularly among the young and long-term unemployed. The high share of long-termunemployed risks loss of skills, disaffection andalienation. Poverty has also risen, mainly due tolack of quality jobs that provide enough hours ofpaid work to support decent incomes. Part of theanswer is continued strong economic growth, butstrengthening training and job placement andbetter minimum income support are crucial.
90
95
100
105
110
2007 2008 2009 2010 2011 2012 2013 2014 2015 2016
Spain FranceGermany PortugalUnited Kingdom Euro area¹
-0.1
0.0
0.1
0.2
0.3
0.4
0.5
Germany OECDaverage
France Spain UnitedKingdom
Portugal
0
20
40
60
80
2002 2004 2006 2008 2010 2012 2014 2016
Unemployment rate
Youth unemployment rate
Share of long-termunemployment (over 1 year)
EXECUTIVE SUMMARY
OECD ECONOMIC SURVEYS: SPAIN © OECD 2017 11
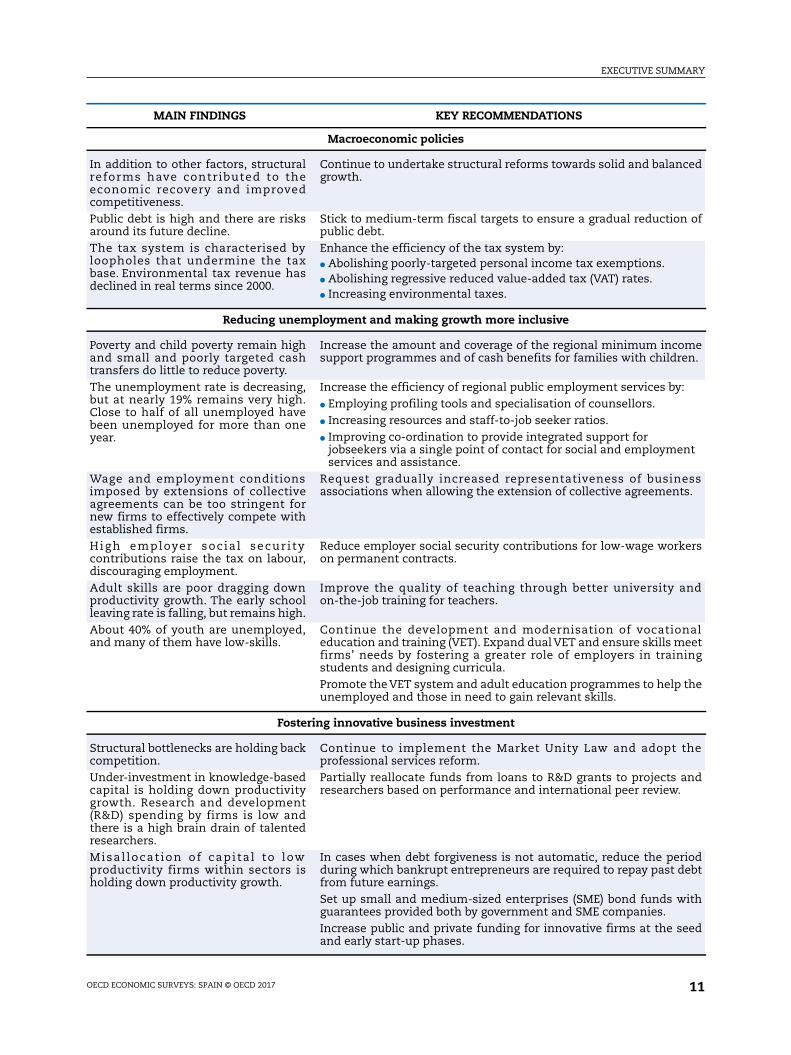
MAIN FINDINGS KEY RECOMMENDATIONS
Macroeconomic policies
In addition to other factors, structuralreforms have contributed to theeconomic recovery and improvedcompetitiveness.
Continue to undertake structural reforms towards solid and balancedgrowth.
Public debt is high and there are risksaround its future decline.
Stick to medium-term fiscal targets to ensure a gradual reduction ofpublic debt.
The tax system is characterised byloopholes that undermine the taxbase. Environmental tax revenue hasdeclined in real terms since 2000.
Enhance the efficiency of the tax system by:● Abolishing poorly-targeted personal income tax exemptions.● Abolishing regressive reduced value-added tax (VAT) rates.● Increasing environmental taxes.
Reducing unemployment and making growth more inclusive
Poverty and child poverty remain highand small and poorly targeted cashtransfers do little to reduce poverty.
Increase the amount and coverage of the regional minimum incomesupport programmes and of cash benefits for families with children.
The unemployment rate is decreasing,but at nearly 19% remains very high.Close to half of all unemployed havebeen unemployed for more than oneyear.
Increase the efficiency of regional public employment services by:● Employing profiling tools and specialisation of counsellors.● Increasing resources and staff-to-job seeker ratios.● Improving co-ordination to provide integrated support for
jobseekers via a single point of contact for social and employmentservices and assistance.
Wage and employment conditionsimposed by extensions of collectiveagreements can be too stringent fornew firms to effectively compete withestablished firms.
Request gradually increased representativeness of businessassociations when allowing the extension of collective agreements.
High employer socia l secur i tycontributions raise the tax on labour,discouraging employment.
Reduce employer social security contributions for low-wage workerson permanent contracts.
Adult skills are poor dragging downproductivity growth. The early schoolleaving rate is falling, but remains high.
Improve the quality of teaching through better university andon-the-job training for teachers.
About 40% of youth are unemployed,and many of them have low-skills.
Continue the development and modernisation of vocationaleducation and training (VET). Expand dual VET and ensure skills meetfirms’ needs by fostering a greater role of employers in trainingstudents and designing curricula.Promote the VET system and adult education programmes to help theunemployed and those in need to gain relevant skills.
Fostering innovative business investment
Structural bottlenecks are holding backcompetition.
Continue to implement the Market Unity Law and adopt theprofessional services reform.
Under-investment in knowledge-basedcapital is holding down productivitygrowth. Research and development(R&D) spending by firms is low andthere is a high brain drain of talentedresearchers.
Partially reallocate funds from loans to R&D grants to projects andresearchers based on performance and international peer review.
Misal locat ion of capita l to lowproductivity firms within sectors isholding down productivity growth.
In cases when debt forgiveness is not automatic, reduce the periodduring which bankrupt entrepreneurs are required to repay past debtfrom future earnings.Set up small and medium-sized enterprises (SME) bond funds withguarantees provided both by government and SME companies.Increase public and private funding for innovative firms at the seedand early start-up phases.

OECD Economic Surveys: Spain
© OECD 2017
13
Assessment and recommendations
● The economic recovery is set to continue at a healthy pace
● Bolstering the financial sector to raise credit growth
● Fiscal policy
● Making growth more inclusive by reducing unemployment and improvingjob quality
● Improving medium-term sustainable growth
The statistical data for Israel are supplied by and under the responsibility of the relevant Israeliauthorities. The use of such data by the OECD is without prejudice to the status of the Golan Heights,East Jerusalem and Israeli settlements in the West Bank under the terms of international law.
ASSESSMENT AND RECOMMENDATIONS
OECD ECONOMIC SURVEYS: SPAIN © OECD 201714
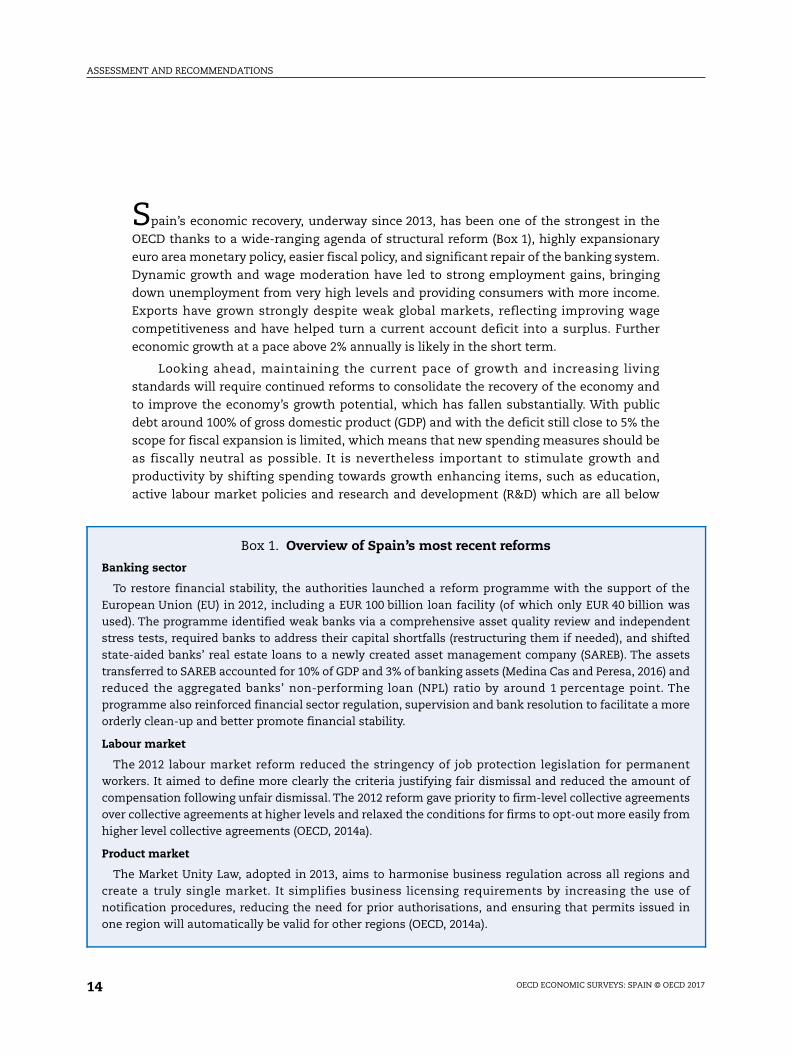
Spain’s economic recovery, underway since 2013, has been one of the strongest in the
OECD thanks to a wide-ranging agenda of structural reform (Box 1), highly expansionary
euro area monetary policy, easier fiscal policy, and significant repair of the banking system.
Dynamic growth and wage moderation have led to strong employment gains, bringing
down unemployment from very high levels and providing consumers with more income.
Exports have grown strongly despite weak global markets, reflecting improving wage
competitiveness and have helped turn a current account deficit into a surplus. Further
economic growth at a pace above 2% annually is likely in the short term.
Looking ahead, maintaining the current pace of growth and increasing living
standards will require continued reforms to consolidate the recovery of the economy and
to improve the economy’s growth potential, which has fallen substantially. With public
debt around 100% of gross domestic product (GDP) and with the deficit still close to 5% the
scope for fiscal expansion is limited, which means that new spending measures should be
as fiscally neutral as possible. It is nevertheless important to stimulate growth and
productivity by shifting spending towards growth enhancing items, such as education,
active labour market policies and research and development (R&D) which are all below
Box 1. Overview of Spain’s most recent reforms
Banking sector
To restore financial stability, the authorities launched a reform programme with the support of theEuropean Union (EU) in 2012, including a EUR 100 billion loan facility (of which only EUR 40 billion wasused). The programme identified weak banks via a comprehensive asset quality review and independentstress tests, required banks to address their capital shortfalls (restructuring them if needed), and shiftedstate-aided banks’ real estate loans to a newly created asset management company (SAREB). The assetstransferred to SAREB accounted for 10% of GDP and 3% of banking assets (Medina Cas and Peresa, 2016) andreduced the aggregated banks’ non-performing loan (NPL) ratio by around 1 percentage point. Theprogramme also reinforced financial sector regulation, supervision and bank resolution to facilitate a moreorderly clean-up and better promote financial stability.
Labour market
The 2012 labour market reform reduced the stringency of job protection legislation for permanentworkers. It aimed to define more clearly the criteria justifying fair dismissal and reduced the amount ofcompensation following unfair dismissal. The 2012 reform gave priority to firm-level collective agreementsover collective agreements at higher levels and relaxed the conditions for firms to opt-out more easily fromhigher level collective agreements (OECD, 2014a).
Product market
The Market Unity Law, adopted in 2013, aims to harmonise business regulation across all regions andcreate a truly single market. It simplifies business licensing requirements by increasing the use ofnotification procedures, reducing the need for prior authorisations, and ensuring that permits issued inone region will automatically be valid for other regions (OECD, 2014a).

ASSESSMENT AND RECOMMENDATIONS
OECD ECONOMIC SURVEYS: SPAIN © OECD 2017 15
peer countries and have substantially fallen since the crisis. Productivity gains, if shared
via higher wages, will be instrumental for improving the well-being of all Spanish citizens
and to make growth more inclusive.
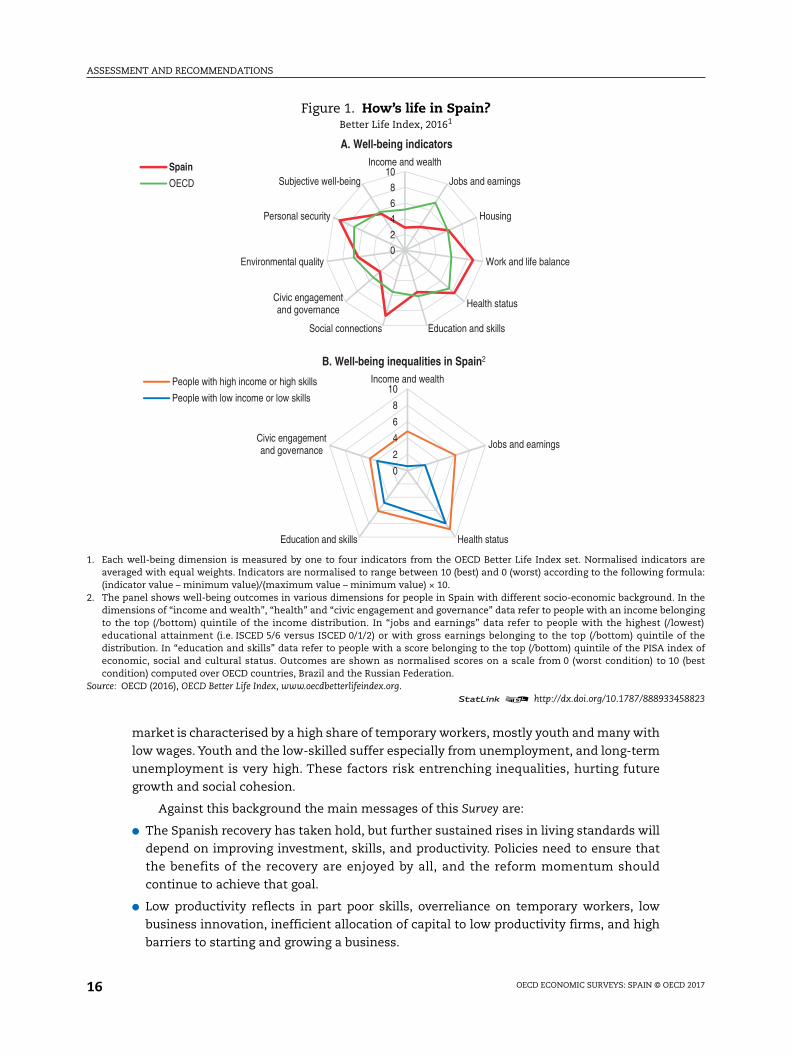
Spanish people enjoy very good social connections, good work-life balance, personal
security and health conditions (Figure 1, Panel A). However, there are wider gaps in
well-being relative to other countries in key areas including income, jobs, and education.
Behind these averages there is also substantial heterogeneity with some groups of the
population fairing considerably worse than others, especially in key areas including
income and jobs (Figure 1, Panel B).
The crisis has left scars that hurt well-being, the most visible being still very high
unemployment, poverty and inequality. Bringing more people back to work is crucial, but
Spain has also to focus on the quality of jobs created to ensure that the benefits of growth
are more widely shared and to create better opportunities for new generations. The labour
Box 1. Overview of Spain’s most recent reforms (cont.)
Education
The Organic Law for Improvement of the Quality of Education (LOMCE), approved in 2013 and graduallyimplemented since the school year 2014/15, aims to reduce early school leaving and improve educationaloutcomes. It adopts new national external assessments of students; grants greater autonomy to schools inexchange for accountability, and modernises and develops the Vocational Education and Training (VET)system. In 2012, a new dual VET system was introduced which develops a model for certificates from theMinistry of Labour and another model for a degree from the Ministry of Education. National standardisedexams have two positive goals: in primary education the aim is to identify students that face difficulties inorder to provide additional support. At the end of compulsory education and upper secondary, the aim is todefine the standards that students have to achieve in order to obtain a national degree.
Tax
The 2014 tax reform reduced the statutory income tax rates, in particular, for low-paid workers andsimplified different deductions on labour earnings, reducing the tax wedge and the tax burden on labour. Iteliminated distortive income tax benefits, like the house buying tax exemption. Also, it reduced the generalcorporate income tax rate from 30% to 25%. A tax on fluorinated gases was introduced in 2014. Some changesto the reform of the corporate income tax were approved in December 2016, as discussed below.
Pension
The 2011 and 2013 reforms raised the retirement age and reduced the replacement rate. Following thereforms, the pensionable earnings reference was revised and the amount of pension benefits will be linkedto life expectancy in the future (OECD, 2015a).
Public administration
The commission on the Reform of the Spanish Public Administration (CORA) was established in 2012, toimprove public-sector efficiency at all levels – central, regional and local – (OECD, 2014b). The reform,together with the Law for Rationalisation and Sustainability of the Local Administration in 2013, led to alarge-scale drive to clarify the allocation of responsibilities across levels of government, reduce duplicationand overlap across jurisdictions and limit the creation of new public entities or agencies at local level. Thenumber of agencies (i.e. Entidades Dependientes del Sector Público) in the regional administration has beenreduced by 34% between 2012 and 2016. A recent OECD report suggests that Spain has made progress inimplementing the OECD recommendations from the first OECD Public Governance Review on the CORA(OECD, 2016a).
ASSESSMENT AND RECOMMENDATIONS
OECD ECONOMIC SURVEYS: SPAIN © OECD 201716
market is characterised by a high share of temporary workers, mostly youth and many with
low wages. Youth and the low-skilled suffer especially from unemployment, and long-term
unemployment is very high. These factors risk entrenching inequalities, hurting future
growth and social cohesion.
Against this background the main messages of this Survey are:
● The Spanish recovery has taken hold, but further sustained rises in living standards will
depend on improving investment, skills, and productivity. Policies need to ensure that
the benefits of the recovery are enjoyed by all, and the reform momentum should
continue to achieve that goal.
● Low productivity reflects in part poor skills, overreliance on temporary workers, low
business innovation, inefficient allocation of capital to low productivity firms, and high
barriers to starting and growing a business.
Figure 1. How’s life in Spain?Better Life Index, 20161
1. Each well-being dimension is measured by one to four indicators from the OECD Better Life Index set. Normalised indicators areaveraged with equal weights. Indicators are normalised to range between 10 (best) and 0 (worst) according to the following formula:(indicator value – minimum value)/(maximum value – minimum value) × 10.
2. The panel shows well-being outcomes in various dimensions for people in Spain with different socio-economic background. In thedimensions of “income and wealth”, “health” and “civic engagement and governance” data refer to people with an income belongingto the top (/bottom) quintile of the income distribution. In “jobs and earnings” data refer to people with the highest (/lowest)educational attainment (i.e. ISCED 5/6 versus ISCED 0/1/2) or with gross earnings belonging to the top (/bottom) quintile of thedistribution. In “education and skills” data refer to people with a score belonging to the top (/bottom) quintile of the PISA index ofeconomic, social and cultural status. Outcomes are shown as normalised scores on a scale from 0 (worst condition) to 10 (bestcondition) computed over OECD countries, Brazil and the Russian Federation.
Source: OECD (2016), OECD Better Life Index, www.oecdbetterlifeindex.org.1 2 http://dx.doi.org/10.1787/888933458823
0
2
4
6
8
10Income and wealth
Jobs and earnings
Housing
Work and life balance
Health status
Education and skillsSocial connections
Civic engagementand governance
Environmental quality
Personal security
Subjective well-being
A. Well-being indicators
Spain
OECD
0
2
4
6
8
10Income and wealth
Jobs and earnings
Health statusEducation and skills
Civic engagementand governance
B. Well-being inequalities in Spain2
People with high income or high skills
People with low income or low skills

ASSESSMENT AND RECOMMENDATIONS
OECD ECONOMIC SURVEYS: SPAIN © OECD 2017 17
● The crisis and the ensuing high unemployment have resulted in poverty and income
disparities. Making growth more inclusive will require further reducing unemployment,
better policies to reduce poverty and improving the quality of jobs via better skills,
training and job matching.
The economic recovery is set to continue at a healthy paceSpain recorded very robust GDP growth of 3.2% in 2015, up from 1.4% in 2014,
supported by expansionary monetary policy, low oil prices, a looser fiscal stance and the
depreciation of the euro. The banking sector reform helped to stabilise the financial sector
contributing to a pick-up in credit growth by improving banks access to market funding
and by avoiding a disruptive and disorderly unwind of a significant part of the financial
sector (Box 1). A relaxation of the fiscal stance in 2015-16 supported demand.
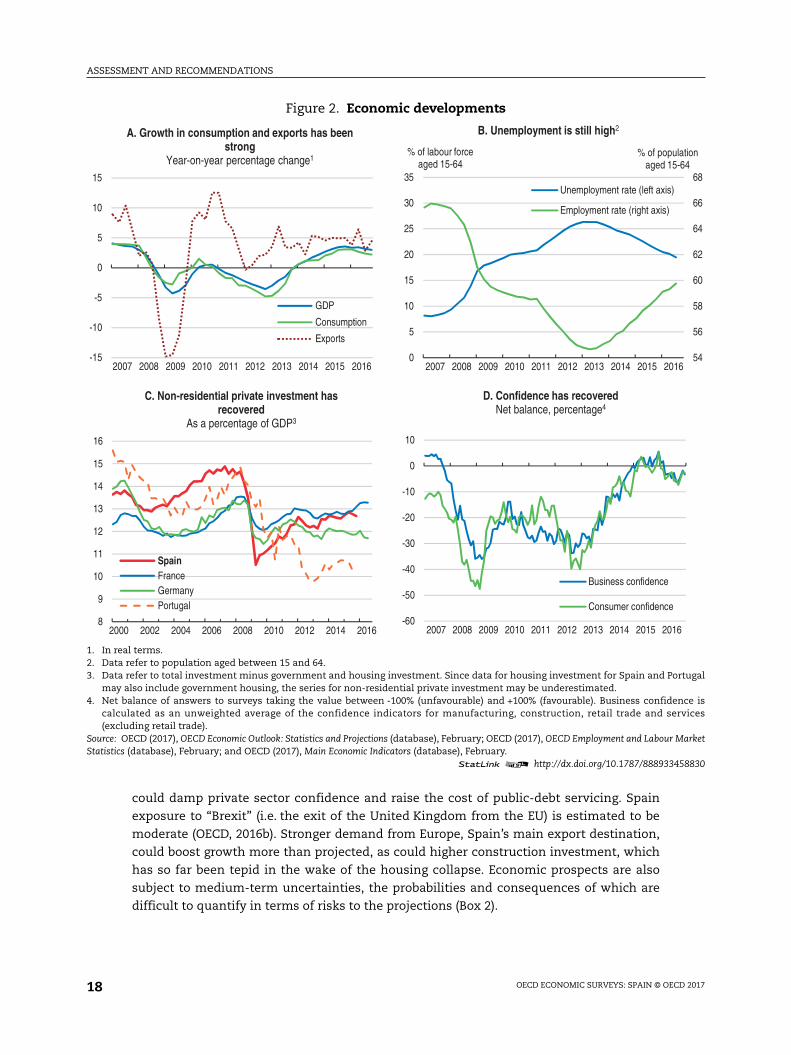
Consumption has been particularly strong, boosted by rising real disposable incomes,
led by employment gains, tax reductions, falling prices, low oil prices and easy financial
conditions (Figure 2, Panels A and B). Investment has picked up as financing conditions
have kept improving and confidence strengthened (Figure 2, Panels C and D). Although
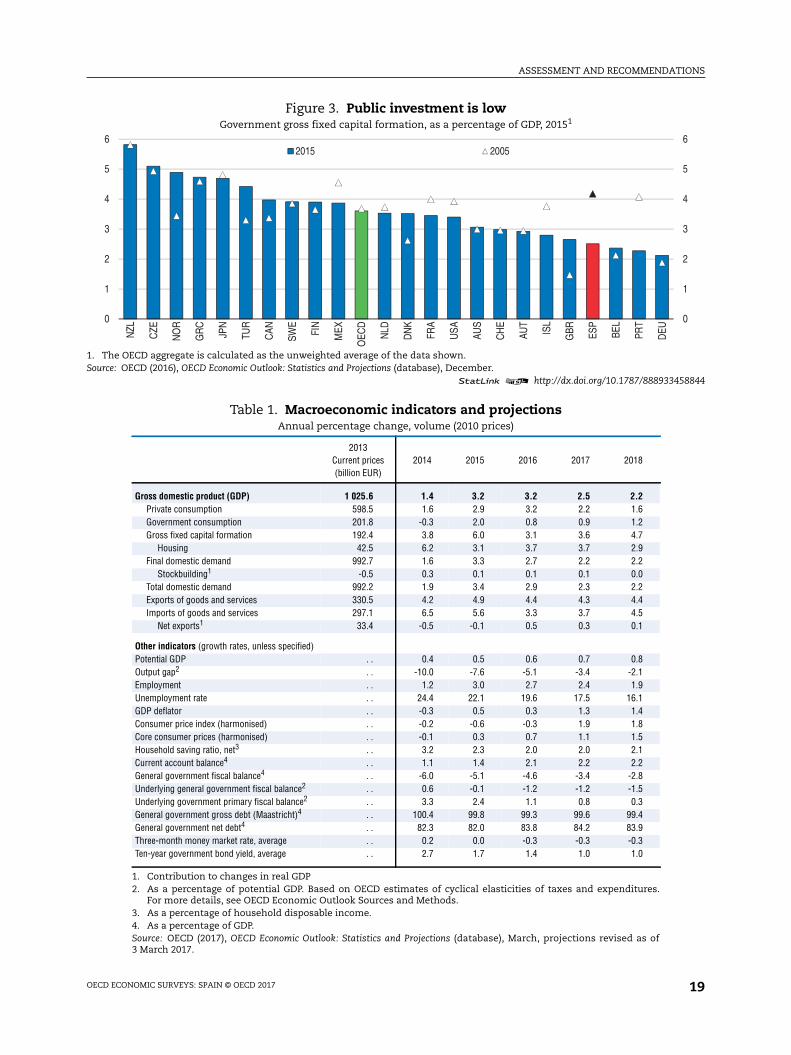
total investment remains below pre-crisis levels, it is mainly due to a substantial fall in
construction investment and to a lesser extent falls in public investment (Figure 3). On the
other hand, equipment investment has been very dynamic in recent years and is already
very close to pre-crisis levels. Exports are benefitting from gains in international
competitiveness.
The job market was devastated during the crisis, but is gradually recovering.
Employment is rising at about 3% a year. The unemployment rate has come down
substantially from its peak of 26% in 2013, but it remains high at nearly 19%; youth
unemployment is double than that (42.7%). Long-term unemployment has also come down
rapidly from its 2014 peak, but is still high. Persistent unemployment may be eroding skills
and increasing social alienation. The labour market is characterised by a high share of
temporary workers (25.7% in 2015) and part-time work increased during the crisis and
currently stands at 15.2%, more than half of it being involuntary. Temporary and part-time
workers suffer from periods of unemployment and under employment, which reduces
their incomes and raises poverty (OECD, 2015b).
Economic growth is projected to reach 3.2% in 2016 and then continue at an annual pace
above 2% in 2017 and 2018 (Table 1). Domestic demand will continue leading the recovery.
Private consumption is set to remain strong on the back of further employment gains, as the
reforms from previous years continue to bear fruit. Continued favourable financing
conditions will extend the nascent pick up in business and housing investment. Inflation will
pick up but pressures should remain moderate due to still high unemployment. Growth is set
to somewhat slow in 2017 and 2018 as the pace of growth of domestic demand eases, and
some factors that have contributed to boost consumption, such as low oil prices and lower
taxes, recede. Export growth is expected to somewhat moderate due to weak demand in
export markets and anaemic world trade.
Risks stem from internal and external factors. Domestically, it may be difficult for the
minority government to legislate further bold reforms needed to boost growth sustainably.
Slowing global trade growth (Haugh et al., 2016) could further undermine exports, which
have been an important driver of the economic recovery, especially if Spain’s international
competitiveness were to erode. Renewed turbulence in international financial markets
ASSESSMENT AND RECOMMENDATIONS
OECD ECONOMIC SURVEYS: SPAIN © OECD 201718
could damp private sector confidence and raise the cost of public-debt servicing. Spain
exposure to “Brexit” (i.e. the exit of the United Kingdom from the EU) is estimated to be
moderate (OECD, 2016b). Stronger demand from Europe, Spain’s main export destination,
could boost growth more than projected, as could higher construction investment, which
has so far been tepid in the wake of the housing collapse. Economic prospects are also
subject to medium-term uncertainties, the probabilities and consequences of which are
difficult to quantify in terms of risks to the projections (Box 2).
Figure 2. Economic developments
1. In real terms.2. Data refer to population aged between 15 and 64.3. Data refer to total investment minus government and housing investment. Since data for housing investment for Spain and Portugal
may also include government housing, the series for non-residential private investment may be underestimated.4. Net balance of answers to surveys taking the value between -100% (unfavourable) and +100% (favourable). Business confidence is
calculated as an unweighted average of the confidence indicators for manufacturing, construction, retail trade and services(excluding retail trade).
Source: OECD (2017), OECD Economic Outlook: Statistics and Projections (database), February; OECD (2017), OECD Employment and Labour MarketStatistics (database), February; and OECD (2017), Main Economic Indicators (database), February.
1 2 http://dx.doi.org/10.1787/888933458830
-15
-10
-5
0
5
10
15
2007 2008 2009 2010 2011 2012 2013 2014 2015 2016
A. Growth in consumption and exports has been strong
Year-on-year percentage change1
GDP
Consumption
Exports
8
9
10
11
12
13
14
15
16
2000 2002 2004 2006 2008 2010 2012 2014 2016
C. Non-residential private investment has recovered
As a percentage of GDP3
SpainFranceGermanyPortugal
54
56
58
60
62
64
66
68
0
5
10
15
20
25
30
35
2007 2008 2009 2010 2011 2012 2013 2014 2015 2016
B. Unemployment is still high2
Unemployment rate (left axis)
Employment rate (right axis)
% of labour forceaged 15-64
% of populationaged 15-64
-60
-50
-40
-30
-20
-10
0
10
2007 2008 2009 2010 2011 2012 2013 2014 2015 2016
D. Confidence has recoveredNet balance, percentage4
Business confidence
Consumer confidence
ASSESSMENT AND RECOMMENDATIONS
OECD ECONOMIC SURVEYS: SPAIN © OECD 2017 19
Figure 3. Public investment is lowGovernment gross fixed capital formation, as a percentage of GDP, 20151
1. The OECD aggregate is calculated as the unweighted average of the data shown.Source: OECD (2016), OECD Economic Outlook: Statistics and Projections (database), December.
1 2 http://dx.doi.org/10.1787/888933458844
0
1
2
3
4
5
6
0
1
2
3
4
5
6N
ZL
CZE
NO
R
GR
C
JPN
TUR
CAN
SWE
FIN
MEX
OEC
D
NLD
DN
K
FRA
USA
AUS
CH
E
AUT
ISL
GBR ES
P
BEL
PRT
DEU
2015 2005
Table 1. Macroeconomic indicators and projectionsAnnual percentage change, volume (2010 prices)
2013Current prices(billion EUR)
2014 2015 2016 2017 2018
Gross domestic product (GDP) 1 025.6 1.4 3.2 3.2 2.5 2.2Private consumption 598.5 1.6 2.9 3.2 2.2 1.6Government consumption 201.8 -0.3 2.0 0.8 0.9 1.2Gross fixed capital formation 192.4 3.8 6.0 3.1 3.6 4.7
Housing 42.5 6.2 3.1 3.7 3.7 2.9Final domestic demand 992.7 1.6 3.3 2.7 2.2 2.2
Stockbuilding1 -0.5 0.3 0.1 0.1 0.1 0.0Total domestic demand 992.2 1.9 3.4 2.9 2.3 2.2Exports of goods and services 330.5 4.2 4.9 4.4 4.3 4.4Imports of goods and services 297.1 6.5 5.6 3.3 3.7 4.5
Net exports1 33.4 -0.5 -0.1 0.5 0.3 0.1
Other indicators (growth rates, unless specified)Potential GDP . . 0.4 0.5 0.6 0.7 0.8Output gap2 . . -10.0 -7.6 -5.1 -3.4 -2.1Employment . . 1.2 3.0 2.7 2.4 1.9Unemployment rate . . 24.4 22.1 19.6 17.5 16.1GDP deflator . . -0.3 0.5 0.3 1.3 1.4Consumer price index (harmonised) . . -0.2 -0.6 -0.3 1.9 1.8Core consumer prices (harmonised) . . -0.1 0.3 0.7 1.1 1.5Household saving ratio, net3 . . 3.2 2.3 2.0 2.0 2.1Current account balance4 . . 1.1 1.4 2.1 2.2 2.2General government fiscal balance4 . . -6.0 -5.1 -4.6 -3.4 -2.8Underlying general government fiscal balance2 . . 0.6 -0.1 -1.2 -1.2 -1.5Underlying government primary fiscal balance2 . . 3.3 2.4 1.1 0.8 0.3General government gross debt (Maastricht)4 . . 100.4 99.8 99.3 99.6 99.4General government net debt4 . . 82.3 82.0 83.8 84.2 83.9Three-month money market rate, average . . 0.2 0.0 -0.3 -0.3 -0.3Ten-year government bond yield, average . . 2.7 1.7 1.4 1.0 1.0
1. Contribution to changes in real GDP2. As a percentage of potential GDP. Based on OECD estimates of cyclical elasticities of taxes and expenditures.
For more details, see OECD Economic Outlook Sources and Methods.3. As a percentage of household disposable income.4. As a percentage of GDP.Source: OECD (2017), OECD Economic Outlook: Statistics and Projections (database), March, projections revised as of3 March 2017.
ASSESSMENT AND RECOMMENDATIONS
OECD ECONOMIC SURVEYS: SPAIN © OECD 201720
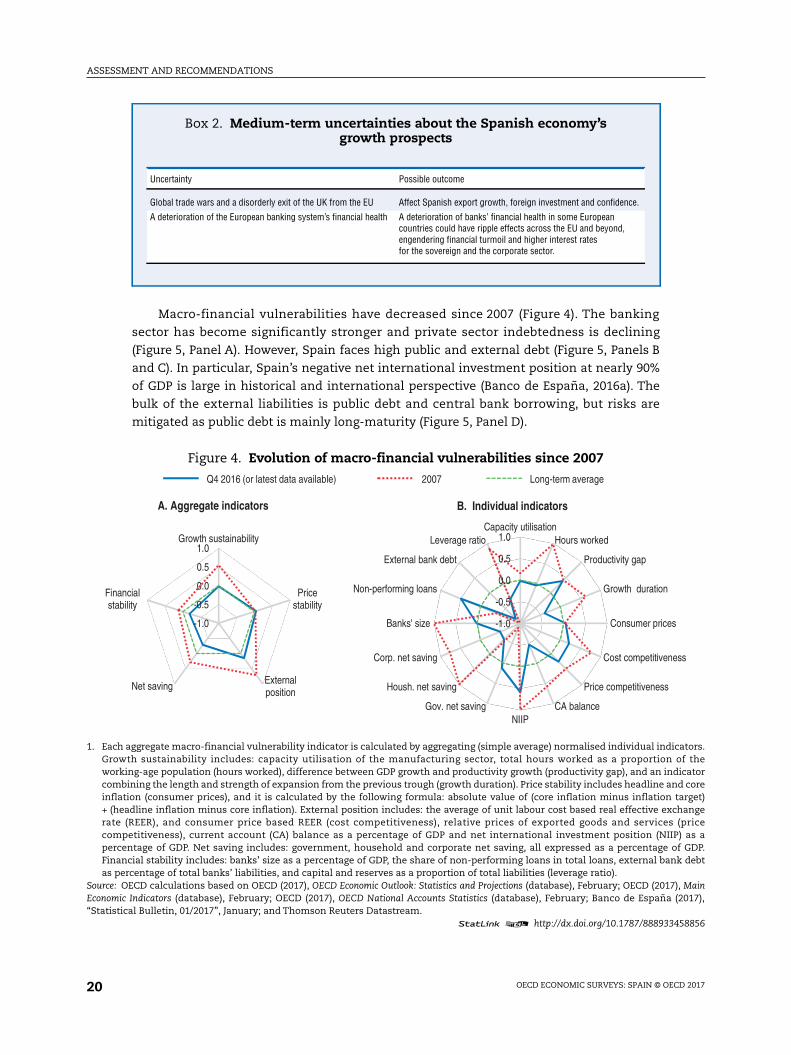
Macro-financial vulnerabilities have decreased since 2007 (Figure 4). The banking
sector has become significantly stronger and private sector indebtedness is declining
(Figure 5, Panel A). However, Spain faces high public and external debt (Figure 5, Panels B
and C). In particular, Spain’s negative net international investment position at nearly 90%
of GDP is large in historical and international perspective (Banco de España, 2016a). The
bulk of the external liabilities is public debt and central bank borrowing, but risks are
mitigated as public debt is mainly long-maturity (Figure 5, Panel D).
Box 2. Medium-term uncertainties about the Spanish economy’sgrowth prospects
Uncertainty Possible outcome
Global trade wars and a disorderly exit of the UK from the EU Affect Spanish export growth, foreign investment and confidence.
A deterioration of the European banking system’s financial health A deterioration of banks’ financial health in some Europeancountries could have ripple effects across the EU and beyond,engendering financial turmoil and higher interest ratesfor the sovereign and the corporate sector.
Figure 4. Evolution of macro-financial vulnerabilities since 2007
1. Each aggregate macro-financial vulnerability indicator is calculated by aggregating (simple average) normalised individual indicators.Growth sustainability includes: capacity utilisation of the manufacturing sector, total hours worked as a proportion of theworking-age population (hours worked), difference between GDP growth and productivity growth (productivity gap), and an indicatorcombining the length and strength of expansion from the previous trough (growth duration). Price stability includes headline and coreinflation (consumer prices), and it is calculated by the following formula: absolute value of (core inflation minus inflation target)+ (headline inflation minus core inflation). External position includes: the average of unit labour cost based real effective exchangerate (REER), and consumer price based REER (cost competitiveness), relative prices of exported goods and services (pricecompetitiveness), current account (CA) balance as a percentage of GDP and net international investment position (NIIP) as apercentage of GDP. Net saving includes: government, household and corporate net saving, all expressed as a percentage of GDP.Financial stability includes: banks’ size as a percentage of GDP, the share of non-performing loans in total loans, external bank debtas percentage of total banks’ liabilities, and capital and reserves as a proportion of total liabilities (leverage ratio).
Source: OECD calculations based on OECD (2017), OECD Economic Outlook: Statistics and Projections (database), February; OECD (2017), MainEconomic Indicators (database), February; OECD (2017), OECD National Accounts Statistics (database), February; Banco de España (2017),“Statistical Bulletin, 01/2017”, January; and Thomson Reuters Datastream.
1 2 http://dx.doi.org/10.1787/888933458856
-1.0
-0.5
0.0
0.5
1.0Growth sustainability
Pricestability
Externalposition
Net saving
Financialstability
A. Aggregate indicators
-1.0
-0.5
0.0
0.5
1.0Capacity utilisation
Hours worked
Productivity gap
Growth duration
Consumer prices
Cost competitiveness
Price competitiveness
CA balanceNIIP
Gov. net saving
Housh. net saving
Corp. net saving
Banks' size
Non-performing loans
External bank debt
Leverage ratio
B. Individual indicators
Q4 2016 (or latest data available) 2007 Long-term average

ASSESSMENT AND RECOMMENDATIONS
OECD ECONOMIC SURVEYS: SPAIN © OECD 2017 21
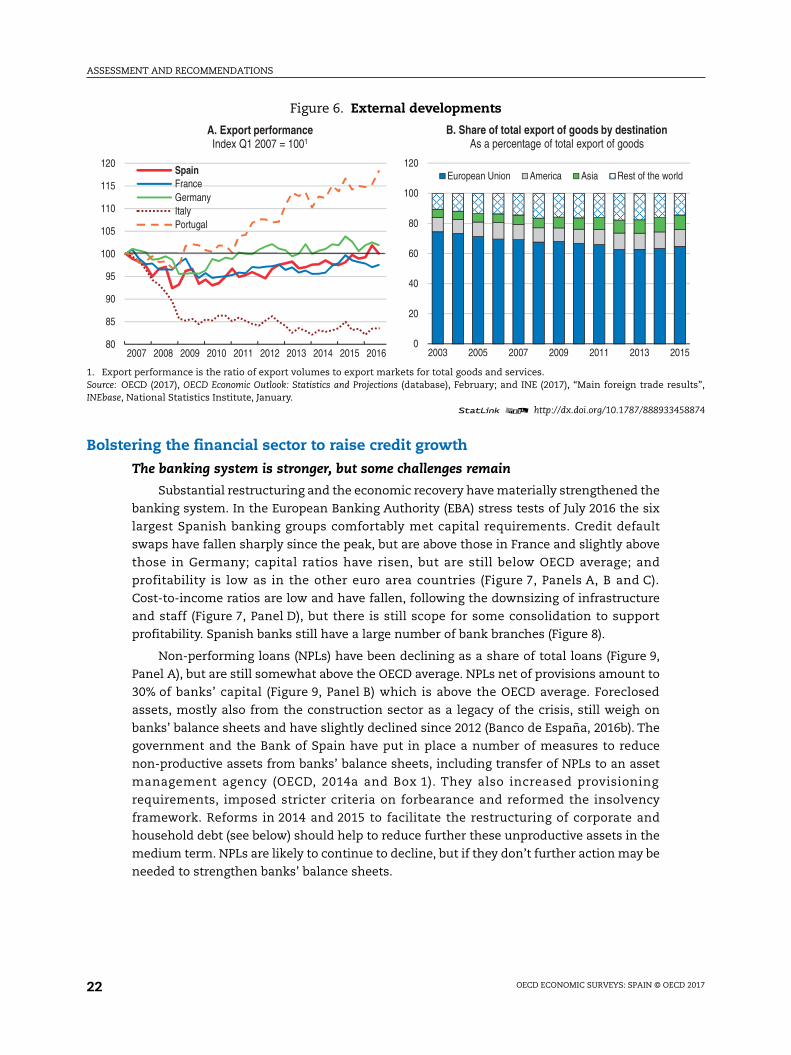
The current account improvement in recent years is in part structural, due to
improved competitiveness, a greater internationalisation of Spanish firms and wider
geographical diversification of exports (Figure 6), but is also due to temporary factors, such
as depressed domestic demand in the recession, especially investment and lower oil prices
(Banco de España, 2016a; European Commission, 2016a). Moreover, there has been a
reduction in the net international debt position as a share of GDP, albeit moderate, due to
an increase in the market price of external liabilities. A prolonged period of large current
account surpluses will be needed to put it on a firmly declining path. This adjustment will
depend on sustained competiveness gains stemming from faster productivity growth,
innovation and attracting more foreign direct investment (Chapter 2).
Figure 5. Macroeconomic and financial vulnerabilities
1. Debt is calculated as the sum of the following liability categories, whenever available/applicable: currency and deposits, securitiesother than shares (except financial derivatives), loans, insurance technical reserves and other accounts payable. Households alsoinclude non-profit institutions serving households.
2. Public sector borrowing refers to general government debt.Source: OECD (2017), “Financial Dashboard”, OECD National Accounts Statistics (database), February; OECD (2017), OECD Economic Outlook:Statistics and Projections (database), February; and Banco de España (2017), “Statistical Bulletin, 01/2017”, January.
1 2 http://dx.doi.org/10.1787/888933458861
0
10
20
30
40
50
60
2005 2007 2009 2011 2013 2015
D. The share of external public sector and central bank borrowing has increased
As a percentage of total gross external debt2
0
20
40
60
80
100
120
140
160
0
20
40
60
80
100
120
140
160
2005 2007 2009 2011 2013 2015
A. Private sector debt is declining1
Households (left axis)
Non-financial corporations (right axis)
% of gross disposable income
Debt to equity ratio, %
0
20
40
60
80
100
120
140
2005 2007 2009 2011 2013 2015
B. Public debt remains highMaastricht definition, as a percentage of GDP
SpainFranceGermanyItalyPortugal
-150
-100
-50
0
50
100
150
200
2005 2007 2009 2011 2013 2015
C. External liabilities remain largeAs a percentage of GDP
Gross external debt
Net international investment position
ASSESSMENT AND RECOMMENDATIONS
OECD ECONOMIC SURVEYS: SPAIN © OECD 201722
Bolstering the financial sector to raise credit growth
The banking system is stronger, but some challenges remain
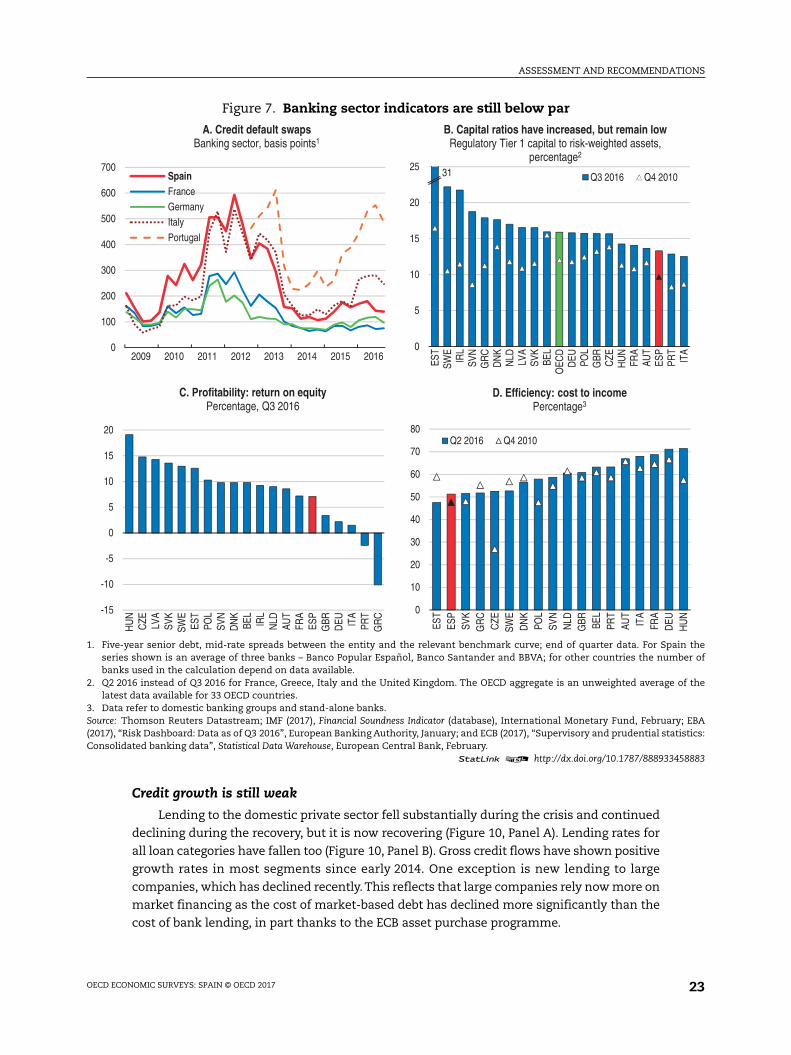
Substantial restructuring and the economic recovery have materially strengthened the
banking system. In the European Banking Authority (EBA) stress tests of July 2016 the six
largest Spanish banking groups comfortably met capital requirements. Credit default
swaps have fallen sharply since the peak, but are above those in France and slightly above
those in Germany; capital ratios have risen, but are still below OECD average; and
profitability is low as in the other euro area countries (Figure 7, Panels A, B and C).
Cost-to-income ratios are low and have fallen, following the downsizing of infrastructure
and staff (Figure 7, Panel D), but there is still scope for some consolidation to support
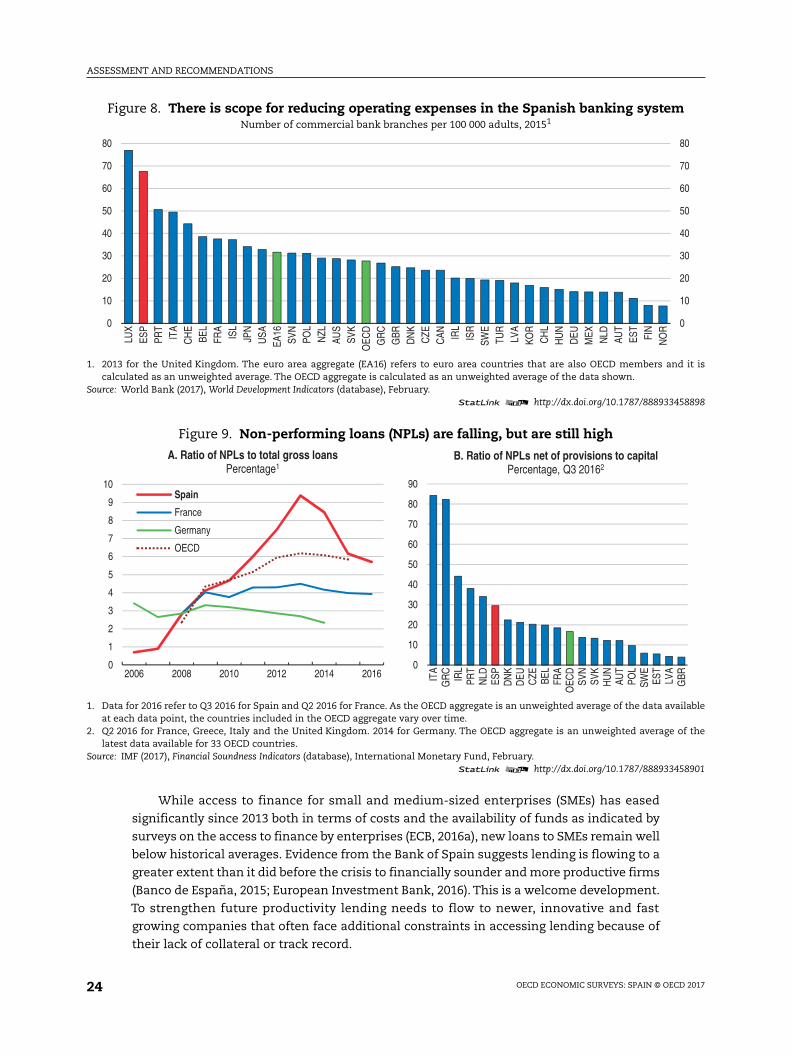
profitability. Spanish banks still have a large number of bank branches (Figure 8).
Non-performing loans (NPLs) have been declining as a share of total loans (Figure 9,
Panel A), but are still somewhat above the OECD average. NPLs net of provisions amount to
30% of banks’ capital (Figure 9, Panel B) which is above the OECD average. Foreclosed
assets, mostly also from the construction sector as a legacy of the crisis, still weigh on
banks’ balance sheets and have slightly declined since 2012 (Banco de España, 2016b). The
government and the Bank of Spain have put in place a number of measures to reduce
non-productive assets from banks’ balance sheets, including transfer of NPLs to an asset
management agency (OECD, 2014a and Box 1). They also increased provisioning
requirements, imposed stricter criteria on forbearance and reformed the insolvency
framework. Reforms in 2014 and 2015 to facilitate the restructuring of corporate and
household debt (see below) should help to reduce further these unproductive assets in the
medium term. NPLs are likely to continue to decline, but if they don’t further action may be
needed to strengthen banks’ balance sheets.
Figure 6. External developments
1. Export performance is the ratio of export volumes to export markets for total goods and services.Source: OECD (2017), OECD Economic Outlook: Statistics and Projections (database), February; and INE (2017), “Main foreign trade results”,INEbase, National Statistics Institute, January.
1 2 http://dx.doi.org/10.1787/888933458874
80
85
90
95
100
105
110
115
120
2007 2008 2009 2010 2011 2012 2013 2014 2015 2016
A. Export performanceIndex Q1 2007 = 1001
SpainFranceGermanyItalyPortugal
0
20
40
60
80
100
120
2003 2005 2007 2009 2011 2013 2015
B. Share of total export of goods by destinationAs a percentage of total export of goods
European Union America Asia Rest of the world
ASSESSMENT AND RECOMMENDATIONS
OECD ECONOMIC SURVEYS: SPAIN © OECD 2017 23
Credit growth is still weak
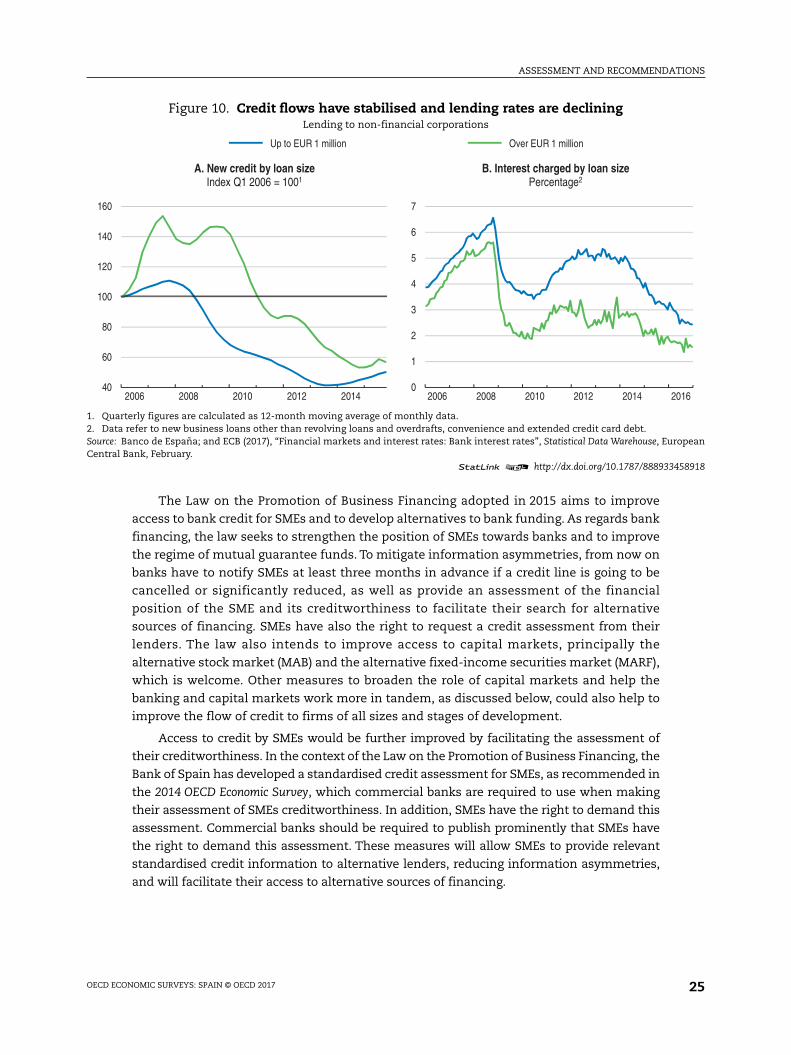
Lending to the domestic private sector fell substantially during the crisis and continued
declining during the recovery, but it is now recovering (Figure 10, Panel A). Lending rates for
all loan categories have fallen too (Figure 10, Panel B). Gross credit flows have shown positive
growth rates in most segments since early 2014. One exception is new lending to large
companies, which has declined recently.This reflects that large companies rely now more on
market financing as the cost of market-based debt has declined more significantly than the
cost of bank lending, in part thanks to the ECB asset purchase programme.
Figure 7. Banking sector indicators are still below par
1. Five-year senior debt, mid-rate spreads between the entity and the relevant benchmark curve; end of quarter data. For Spain theseries shown is an average of three banks – Banco Popular Español, Banco Santander and BBVA; for other countries the number ofbanks used in the calculation depend on data available.
2. Q2 2016 instead of Q3 2016 for France, Greece, Italy and the United Kingdom. The OECD aggregate is an unweighted average of thelatest data available for 33 OECD countries.
3. Data refer to domestic banking groups and stand-alone banks.Source: Thomson Reuters Datastream; IMF (2017), Financial Soundness Indicator (database), International Monetary Fund, February; EBA(2017), “Risk Dashboard: Data as of Q3 2016”, European Banking Authority, January; and ECB (2017), “Supervisory and prudential statistics:Consolidated banking data”, Statistical Data Warehouse, European Central Bank, February.
1 2 http://dx.doi.org/10.1787/888933458883
0
100
200
300
400
500
600
700
2009 2010 2011 2012 2013 2014 2015 2016
A. Credit default swapsBanking sector, basis points1
SpainFranceGermanyItaly
Portugal
0
10
20
30
40
50
60
70
80ES
TES
PSV
KG
RC
CZE
SWE
DN
KPO
LSV
NN
LDG
BR BEL
PRT
AUT
ITA
FRA
DEU
HU
N
D. Efficiency: cost to incomePercentage3
Q2 2016 Q4 2010
-15
-10
-5
0
5
10
15
20
HU
NC
ZE LVA
SVK
SWE
EST
POL
SVN
DN
KBE
LIR
LN
LDAU
TFR
AES
PG
BRD
EU ITA
PRT
GR
C
C. Profitability: return on equityPercentage, Q3 2016
0
5
10
15
20
25
EST
SWE
IRL
SVN
GR
CD
NK
NLD LV
ASV
KBE
LO
ECD
DEU PO
LG
BR CZE
HU
NFR
AAU
TES
PPR
TIT
A
B. Capital ratios have increased, but remain lowRegulatory Tier 1 capital to risk-weighted assets,
percentage2
Q3 2016 Q4 201031
ASSESSMENT AND RECOMMENDATIONS
OECD ECONOMIC SURVEYS: SPAIN © OECD 201724
While access to finance for small and medium-sized enterprises (SMEs) has eased
significantly since 2013 both in terms of costs and the availability of funds as indicated by
surveys on the access to finance by enterprises (ECB, 2016a), new loans to SMEs remain well
below historical averages. Evidence from the Bank of Spain suggests lending is flowing to a
greater extent than it did before the crisis to financially sounder and more productive firms
(Banco de España, 2015; European Investment Bank, 2016). This is a welcome development.
To strengthen future productivity lending needs to flow to newer, innovative and fast
growing companies that often face additional constraints in accessing lending because of
their lack of collateral or track record.
Figure 8. There is scope for reducing operating expenses in the Spanish banking systemNumber of commercial bank branches per 100 000 adults, 20151
1. 2013 for the United Kingdom. The euro area aggregate (EA16) refers to euro area countries that are also OECD members and it iscalculated as an unweighted average. The OECD aggregate is calculated as an unweighted average of the data shown.
Source: World Bank (2017), World Development Indicators (database), February.1 2 http://dx.doi.org/10.1787/888933458898
Figure 9. Non-performing loans (NPLs) are falling, but are still high
1. Data for 2016 refer to Q3 2016 for Spain and Q2 2016 for France. As the OECD aggregate is an unweighted average of the data availableat each data point, the countries included in the OECD aggregate vary over time.
2. Q2 2016 for France, Greece, Italy and the United Kingdom. 2014 for Germany. The OECD aggregate is an unweighted average of thelatest data available for 33 OECD countries.
Source: IMF (2017), Financial Soundness Indicators (database), International Monetary Fund, February.1 2 http://dx.doi.org/10.1787/888933458901
0
10
20
30
40
50
60
70
80
0
10
20
30
40
50
60
70
80
LUX
ESP
PRT
ITA
CH
EBE
LFR
AIS
LJP
NU
SAEA
16SV
NPO
LN
ZLAU
SSV
KO
ECD
GR
CG
BRD
NK
CZE
CAN IR
LIS
RSW
ETU
RLV
AKO
RC
HL
HU
ND
EUM
EX NLD
AUT
EST
FIN
NO
R0
1
2
3
4
5
6
7
8
9
10
2006 2008 2010 2012 2014 2016
A. Ratio of NPLs to total gross loansPercentage1
Spain
France
Germany
OECD
0
10
20
30
40
50
60
70
80
90
ITA
GR
CIR
LPR
TN
LDES
PD
NK
DEU CZE BE
LFR
AO
ECD
SVN
SVK
HU
NAU
TPO
LSW
EES
TLV
AG
BR
B. Ratio of NPLs net of provisions to capitalPercentage, Q3 20162
ASSESSMENT AND RECOMMENDATIONS
OECD ECONOMIC SURVEYS: SPAIN © OECD 2017 25
The Law on the Promotion of Business Financing adopted in 2015 aims to improve
access to bank credit for SMEs and to develop alternatives to bank funding. As regards bank
financing, the law seeks to strengthen the position of SMEs towards banks and to improve
the regime of mutual guarantee funds. To mitigate information asymmetries, from now on
banks have to notify SMEs at least three months in advance if a credit line is going to be
cancelled or significantly reduced, as well as provide an assessment of the financial
position of the SME and its creditworthiness to facilitate their search for alternative
sources of financing. SMEs have also the right to request a credit assessment from their
lenders. The law also intends to improve access to capital markets, principally the
alternative stock market (MAB) and the alternative fixed-income securities market (MARF),
which is welcome. Other measures to broaden the role of capital markets and help the
banking and capital markets work more in tandem, as discussed below, could also help to
improve the flow of credit to firms of all sizes and stages of development.
Access to credit by SMEs would be further improved by facilitating the assessment of
their creditworthiness. In the context of the Law on the Promotion of Business Financing, the
Bank of Spain has developed a standardised credit assessment for SMEs, as recommended in
the 2014 OECD Economic Survey, which commercial banks are required to use when making
their assessment of SMEs creditworthiness. In addition, SMEs have the right to demand this
assessment. Commercial banks should be required to publish prominently that SMEs have
the right to demand this assessment. These measures will allow SMEs to provide relevant
standardised credit information to alternative lenders, reducing information asymmetries,
and will facilitate their access to alternative sources of financing.
Figure 10. Credit flows have stabilised and lending rates are decliningLending to non-financial corporations
1. Quarterly figures are calculated as 12-month moving average of monthly data.2. Data refer to new business loans other than revolving loans and overdrafts, convenience and extended credit card debt.Source: Banco de España; and ECB (2017), “Financial markets and interest rates: Bank interest rates”, Statistical Data Warehouse, EuropeanCentral Bank, February.
1 2 http://dx.doi.org/10.1787/888933458918
0
1
2
3
4
5
6
7
2006 2008 2010 2012 2014 2016
B. Interest charged by loan sizePercentage2
40
60
80
100
120
140
160
2006 2008 2010 2012 2014
A. New credit by loan sizeIndex Q1 2006 = 1001
Up to EUR 1 million Over EUR 1 million

ASSESSMENT AND RECOMMENDATIONS
OECD ECONOMIC SURVEYS: SPAIN © OECD 201726
Fiscal policy
Managing limited fiscal space
Spain has made a considerable effort to reduce public deficits from 2012, when the
deficit peaked at 10.5% of GDP, including financial assistance.This has resulted in substantial
progress. The budget deficit is expected to decline to 4.6% of GDP in 2016 from 5.1% in 2015.
The deficit reduction was driven by dynamic growth and some consolidation measures,
including expenditure cuts for the central and regional government and recent amendments
to the corporate income tax to make up for a loss in revenue. On the basis of current
government plans, the fiscal deficit will be reduced below 3% by 2018. This fiscal path will
provide modest support in 2017 and 2018 and debt will stabilise at around 100% by end-2018.
While more demand is needed to raise growth further and reduce unemployment
significantly, high debt and deficits limit the scope for further fiscal expansion.
Prudent fiscal management should be combined with reforms of the tax structure that
raise long-term growth. There is room to improve the tax mix, as the structure of taxation
remains tilted towards labour income which penalises growth and employment, as
discussed below. Greater expenditure efficiency, as the government has recently
committed to would also be welcome. The fiscal council will carry out a review of the
general government spending in 2017. Moreover, a new public administration reform
programme would yield EUR 900 million in savings over 2017-19. These measures could
help to finance current spending needs, such as labour market programmes to effectively
fight youth and long term unemployment.
The new government should stick to its medium-term fiscal targets to allow a steady
reduction of the debt ratio. Under current government plans, which assume medium-term
nominal GDP growth of 3% a year from 2018 onwards and a primary surplus of 0.9% of GDP
by 2022, public debt is projected to decline very slowly to 94% of GDP by 2030 (the baseline
Table 2. Fiscal indicatorsAs a percentage of GDP
2013 2014 2015 20161 20171 20181
Spending and revenue
Total revenue 38.6 38.9 38.6 38.4 38.4 37.9
Total expenditure 45.6 44.9 43.8 43.0 41.8 40.6
Net interest payments 2.9 3.0 2.7 2.4 2.1 1.8
Budget balance
Fiscal balance -7.0 -6.0 -5.1 -4.6 -3.4 -2.8
Primary fiscal balance -4.1 -3.0 -2.4 -2.2 -1.4 -1.0
Cyclically adjusted fiscal balance2 0.4 0.8 -0.1 -1.2 -1.2 -1.5
Underlying fiscal balance2 0.7 0.6 -0.1 -1.2 -1.2 -1.5
Underlying primary fiscal balance2 3.3 3.3 2.4 1.1 0.8 0.3
Public debt
Gross debt (Maastricht definition) 95.4 100.4 99.8 99.3 99.6 99.4
Net debt 69.7 82.3 82.0 83.8 84.2 83.9
1. Projections.2. As a percentage of potential GDP. The underlying balances are adjusted for the cycle and for one-offs. For more
details, see OECD Economic Outlook Sources and Methods.Source: OECD (2017), OECD Economic Outlook: Statistics and Projections (database), March, projections revised as of3 March 2017.
ASSESSMENT AND RECOMMENDATIONS
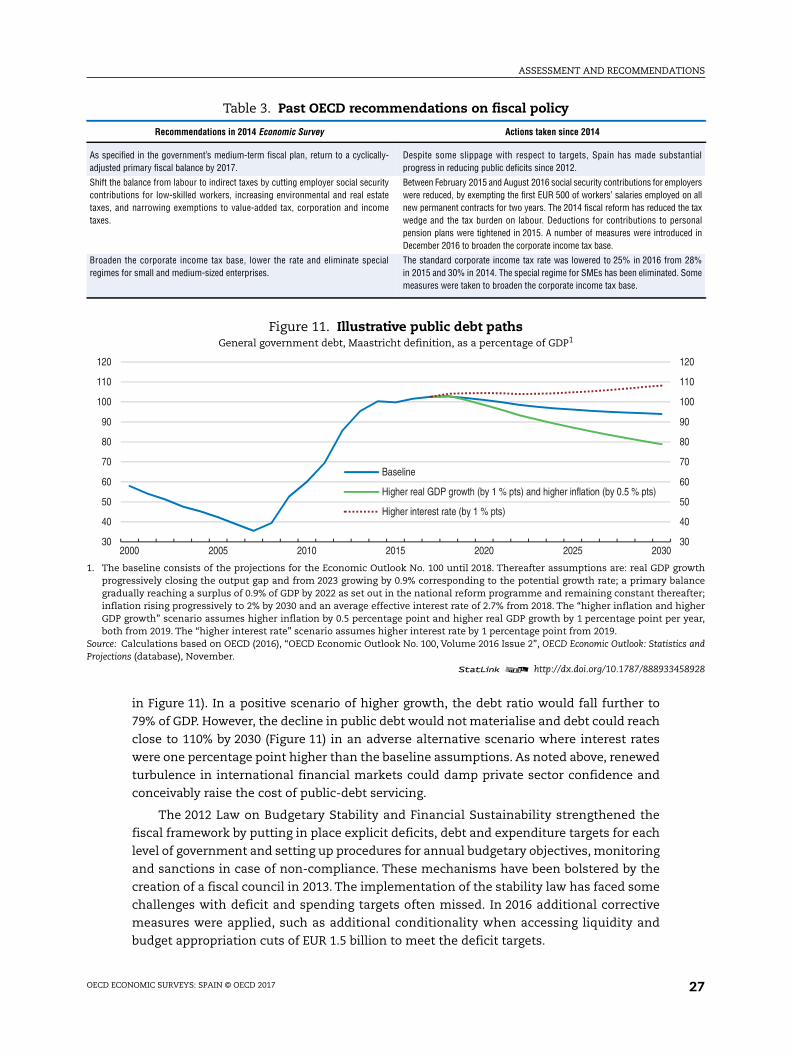
OECD ECONOMIC SURVEYS: SPAIN © OECD 2017 27
in Figure 11). In a positive scenario of higher growth, the debt ratio would fall further to
79% of GDP. However, the decline in public debt would not materialise and debt could reach
close to 110% by 2030 (Figure 11) in an adverse alternative scenario where interest rates
were one percentage point higher than the baseline assumptions. As noted above, renewed
turbulence in international financial markets could damp private sector confidence and
conceivably raise the cost of public-debt servicing.
The 2012 Law on Budgetary Stability and Financial Sustainability strengthened the
fiscal framework by putting in place explicit deficits, debt and expenditure targets for each
level of government and setting up procedures for annual budgetary objectives, monitoring
and sanctions in case of non-compliance. These mechanisms have been bolstered by the
creation of a fiscal council in 2013. The implementation of the stability law has faced some
challenges with deficit and spending targets often missed. In 2016 additional corrective
measures were applied, such as additional conditionality when accessing liquidity and
budget appropriation cuts of EUR 1.5 billion to meet the deficit targets.
Table 3. Past OECD recommendations on fiscal policy
Recommendations in 2014 Economic Survey Actions taken since 2014
As specified in the government’s medium-term fiscal plan, return to a cyclically-adjusted primary fiscal balance by 2017.
Despite some slippage with respect to targets, Spain has made substantialprogress in reducing public deficits since 2012.
Shift the balance from labour to indirect taxes by cutting employer social securitycontributions for low-skilled workers, increasing environmental and real estatetaxes, and narrowing exemptions to value-added tax, corporation and incometaxes.
Between February 2015 and August 2016 social security contributions for employerswere reduced, by exempting the first EUR 500 of workers’ salaries employed on allnew permanent contracts for two years. The 2014 fiscal reform has reduced the taxwedge and the tax burden on labour. Deductions for contributions to personalpension plans were tightened in 2015. A number of measures were introduced inDecember 2016 to broaden the corporate income tax base.
Broaden the corporate income tax base, lower the rate and eliminate specialregimes for small and medium-sized enterprises.
The standard corporate income tax rate was lowered to 25% in 2016 from 28%in 2015 and 30% in 2014. The special regime for SMEs has been eliminated. Somemeasures were taken to broaden the corporate income tax base.
Figure 11. Illustrative public debt pathsGeneral government debt, Maastricht definition, as a percentage of GDP1
1. The baseline consists of the projections for the Economic Outlook No. 100 until 2018. Thereafter assumptions are: real GDP growthprogressively closing the output gap and from 2023 growing by 0.9% corresponding to the potential growth rate; a primary balancegradually reaching a surplus of 0.9% of GDP by 2022 as set out in the national reform programme and remaining constant thereafter;inflation rising progressively to 2% by 2030 and an average effective interest rate of 2.7% from 2018. The “higher inflation and higherGDP growth” scenario assumes higher inflation by 0.5 percentage point and higher real GDP growth by 1 percentage point per year,both from 2019. The “higher interest rate” scenario assumes higher interest rate by 1 percentage point from 2019.
Source: Calculations based on OECD (2016), “OECD Economic Outlook No. 100, Volume 2016 Issue 2”, OECD Economic Outlook: Statistics andProjections (database), November.
1 2 http://dx.doi.org/10.1787/888933458928
30
40
50
60
70
80
90
100
110
120
30
40
50
60
70
80
90
100
110
120
2000 2005 2010 2015 2020 2025 2030
Baseline
Higher real GDP growth (by 1 % pts) and higher inflation (by 0.5 % pts)
Higher interest rate (by 1 % pts)
ASSESSMENT AND RECOMMENDATIONS
OECD ECONOMIC SURVEYS: SPAIN © OECD 201728
The additional conditionality on accessing liquidity is welcome since regional liquidity
mechanisms in the form of conditional loans at low interest rates from the central
government have helped regions, but could lead also to risky fiscal behaviour (Banco de
España, 2016a; IMF, 2015; Cuenca and Ruiz Almedral, 2014). Transparency has improved
with the monthly publication since 2016 of the actions to comply with the expenditure
rule, which has been missed by all levels of government in the past, and regions
adjustment plans to meet their targets.
Dealing with spending pressures due to aging
Fiscal sustainability could also be negatively impacted by contingent liability risks,
such as high pension spending. Spain’s social security regime faces the impact of
population ageing and the legacy of the crisis, which has cut revenues. The problem has
been crystallised in the public debate by the prediction that the pension Reserve Fund will
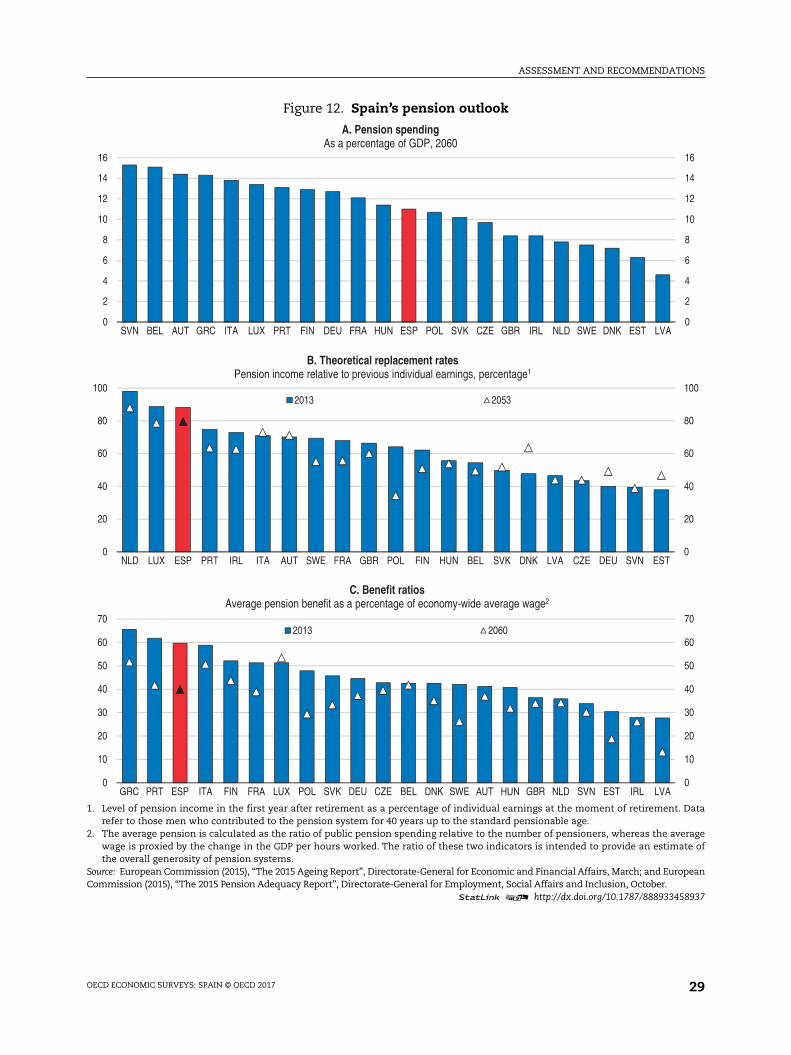
be exhausted by end-2017. Important pension reforms in 2011 and 2013 (Box 1) will help
dampen the increase in aging-related spending in the longer-term. The government
estimates that these reforms will result in 2.5% of GDP lower spending by 2060
(Government of Spain, 2016). As a result pension spending is expected to be 11% of GDP
in 2060 (Figure 12, Panel A), slightly decreasing from 11.8% of GDP in 2013 (European
Commission, 2015). These projections suggest that the reforms substantially reduce fiscal
sustainability risks in the long-term (European Commission, 2015).
Such projections are subject to considerable uncertainty, though, which may require
further reforms. Social security contributions are already high (28% of labour costs
compared with an OECD average of 22.4%) and increasing them further to pay for pensions
could undermine employment and international competitiveness. Instead, pension
financing should be considered in the context of a broader tax reform (see next section),
with a view to raising any needed funds in the most efficient way. The theoretical
replacement ratio for those with a full career remains very high even after the reform
(Figure 12, Panel B). This contrasts with one of the largest reductions in the benefit ratio
– the average benefit among all pensioners – among European countries as of 2060
(Figure 12, Panel C). This reflects the effect of shorter contribution periods that is
comparatively higher in Spain relative to other EU countries (European Commission, 2015)
because of long unemployment spells. The reduction in the benefit ratio calls for reducing
unemployment and temporary jobs further (as discussed below) to ensure the adequacy of
pensions for as many people as possible. Finally, survivors’ pension benefits could be
limited to cases of need, as recommended in previous OECD Surveys (OECD, 2010).
Tax reform to promote growth, employment and environmental quality
Spain implemented a reform in 2015 and 2016 to make the tax system more
redistributive and conducive to growth, including by reducing the tax wedge on labour
(OECD, 2014a, Box 1). The share of labour taxation has declined. However, the structure of
taxation remains tilted towards labour income which penalises growth and employment
(Johansson et al., 2008). In contrast, less distortive recurrent taxes on residential
immovable property, value-added tax (VAT) and environmentally-related taxes are
somewhat under-exploited (Figure 13). Also, narrow tax bases, in particular for the VAT and
the corporate income tax, generate distortions and complexity at the same time as they
reduce revenues.
ASSESSMENT AND RECOMMENDATIONS
OECD ECONOMIC SURVEYS: SPAIN © OECD 2017 29
Figure 12. Spain’s pension outlook
1. Level of pension income in the first year after retirement as a percentage of individual earnings at the moment of retirement. Datarefer to those men who contributed to the pension system for 40 years up to the standard pensionable age.
2. The average pension is calculated as the ratio of public pension spending relative to the number of pensioners, whereas the averagewage is proxied by the change in the GDP per hours worked. The ratio of these two indicators is intended to provide an estimate ofthe overall generosity of pension systems.
Source: European Commission (2015), “The 2015 Ageing Report”, Directorate-General for Economic and Financial Affairs, March; and EuropeanCommission (2015), “The 2015 Pension Adequacy Report”, Directorate-General for Employment, Social Affairs and Inclusion, October.
1 2 http://dx.doi.org/10.1787/888933458937
0
2
4
6
8
10
12
14
16
0
2
4
6
8
10
12
14
16
SVN BEL AUT GRC ITA LUX PRT FIN DEU FRA HUN ESP POL SVK CZE GBR IRL NLD SWE DNK EST LVA
A. Pension spendingAs a percentage of GDP, 2060
0
10
20
30
40
50
60
70
0
10
20
30
40
50
60
70
GRC PRT ESP ITA FIN FRA LUX POL SVK DEU CZE BEL DNK SWE AUT HUN GBR NLD SVN EST IRL LVA
C. Benefit ratiosAverage pension benefit as a percentage of economy-wide average wage2
2013 2060
0
20
40
60
80
100
0
20
40
60
80
100
NLD LUX ESP PRT IRL ITA AUT SWE FRA GBR POL FIN HUN BEL SVK DNK LVA CZE DEU SVN EST
B. Theoretical replacement ratesPension income relative to previous individual earnings, percentage1
2013 2053

ASSESSMENT AND RECOMMENDATIONS
OECD ECONOMIC SURVEYS: SPAIN © OECD 201730
The 2014 personal income tax reform reduced the tax wedge by exempting income up
to EUR 12 000 and lowering personal income tax rates, likely contributing to boost labour
supply, especially among those with low skills. However, the main focus should remain on
creating permanent and quality jobs. A temporary measure to boost permanent jobs
between February 2015 and August 2016 temporarily reduced social security contributions
(SSCs) for employers by exempting the first EUR 500 of workers’ salaries employed on all
new permanent contracts for two years. To further support job creation, the government
should build on this cut in employer SSCs, making it permanent and also restricting it to
low-wage workers. This will have more long lasting positive effects on employment among
Figure 13. The tax structure is tilted towards labour taxesTax revenues as a percentage of total tax revenue, 20151
1. The OECD aggregate is calculated as an unweighted average and due to data availability it does not include Australia, Greece, Japan,Latvia, Mexico and Poland.
2. Labour taxes are calculated as the sum of taxes on income, profits and capital gains of individuals, social security contributions andtaxes on payroll and workforce. Other taxes include all other taxes on property except for recurrent taxes on immovable property,such as recurrent taxes on net wealth, estate, inheritance and gift taxes, taxes on financial and capital transactions and otherrecurrent and non-recurrent taxes on property as well as all other taxes on goods and services except for value-added tax.
3. Self-employed and others include social security contributions of self-employed and other tax revenues that are unallocable betweenemployees, employers and self-employed.
Source: OECD (2016), “Revenue Statistics: Comparative tables”, OECD Tax Statistics (database), December; and OECD (2016), “Green GrowthIndicators”, OECD Environment Statistics (database), December.
1 2 http://dx.doi.org/10.1787/888933458940
51.9
55.0
8.6
7.1
3.2
3.4
20.1
18.8
6.7
5.6
9.7
10.2
0 10 20 30 40 50 60 70 80 90 100
OECD
Spain
A. Overall tax structure2
Labour taxes Taxes on income, profits and capital gains of corporates
Recurrent taxes on immovable property Value-added tax
Environmentally related taxes Other taxes
9.3
5.4
15.0
23.9
2.7
4.4
0 5 10 15 20 25 30 35
OECD
Spain
B. Structure of social security contributions3
Employees Employers Self-employed and others
ASSESSMENT AND RECOMMENDATIONS
OECD ECONOMIC SURVEYS: SPAIN © OECD 2017 31
low-skilled workers, where the need to stimulate labour demand is largest. Such a
reduction in employer SSCs should be considered in the context of a broader tax reform to
improve the tax structure which is currently titled towards labour income which penalises
growth and employment.
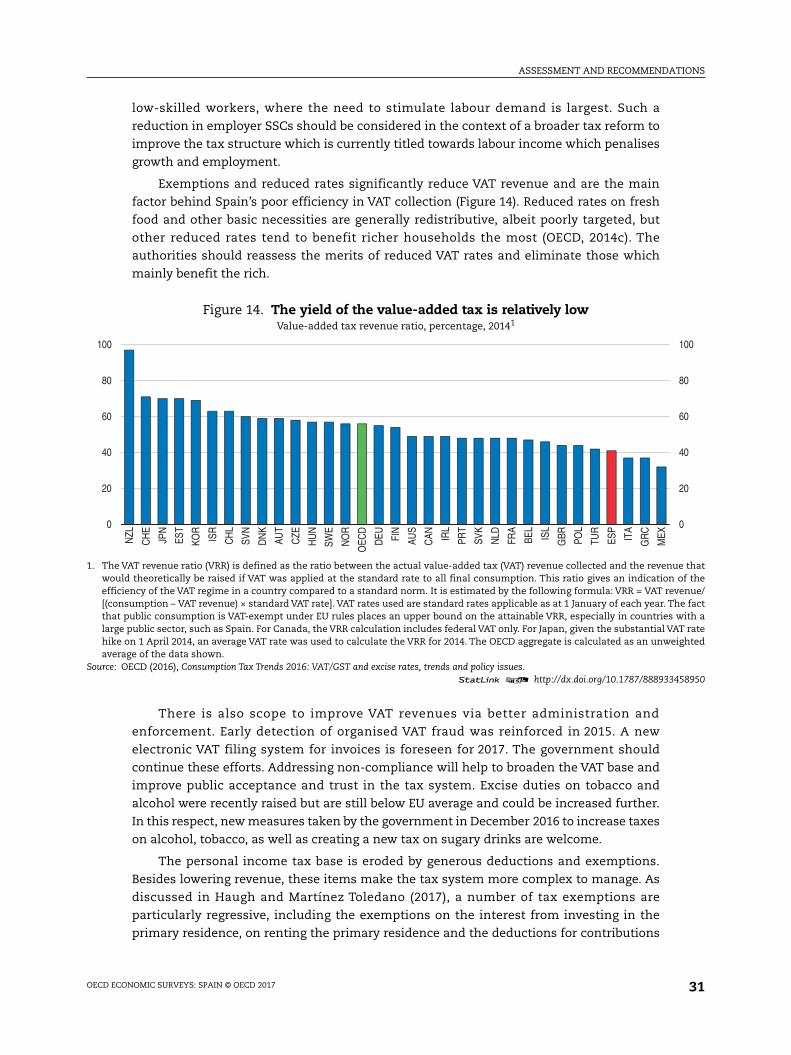
Exemptions and reduced rates significantly reduce VAT revenue and are the main
factor behind Spain’s poor efficiency in VAT collection (Figure 14). Reduced rates on fresh
food and other basic necessities are generally redistributive, albeit poorly targeted, but
other reduced rates tend to benefit richer households the most (OECD, 2014c). The
authorities should reassess the merits of reduced VAT rates and eliminate those which
mainly benefit the rich.
There is also scope to improve VAT revenues via better administration and
enforcement. Early detection of organised VAT fraud was reinforced in 2015. A new
electronic VAT filing system for invoices is foreseen for 2017. The government should
continue these efforts. Addressing non-compliance will help to broaden the VAT base and
improve public acceptance and trust in the tax system. Excise duties on tobacco and
alcohol were recently raised but are still below EU average and could be increased further.
In this respect, new measures taken by the government in December 2016 to increase taxes
on alcohol, tobacco, as well as creating a new tax on sugary drinks are welcome.
The personal income tax base is eroded by generous deductions and exemptions.
Besides lowering revenue, these items make the tax system more complex to manage. As
discussed in Haugh and Martínez Toledano (2017), a number of tax exemptions are
particularly regressive, including the exemptions on the interest from investing in the
primary residence, on renting the primary residence and the deductions for contributions
Figure 14. The yield of the value-added tax is relatively lowValue-added tax revenue ratio, percentage, 20141
1. The VAT revenue ratio (VRR) is defined as the ratio between the actual value-added tax (VAT) revenue collected and the revenue thatwould theoretically be raised if VAT was applied at the standard rate to all final consumption. This ratio gives an indication of theefficiency of the VAT regime in a country compared to a standard norm. It is estimated by the following formula: VRR = VAT revenue/[(consumption – VAT revenue) × standard VAT rate]. VAT rates used are standard rates applicable as at 1 January of each year. The factthat public consumption is VAT-exempt under EU rules places an upper bound on the attainable VRR, especially in countries with alarge public sector, such as Spain. For Canada, the VRR calculation includes federal VAT only. For Japan, given the substantial VAT ratehike on 1 April 2014, an average VAT rate was used to calculate the VRR for 2014. The OECD aggregate is calculated as an unweightedaverage of the data shown.
Source: OECD (2016), Consumption Tax Trends 2016: VAT/GST and excise rates, trends and policy issues.1 2 http://dx.doi.org/10.1787/888933458950
0
20
40
60
80
100
0
20
40
60
80
100
NZL
CH
E
JPN
EST
KOR
ISR
CH
L
SVN
DN
K
AUT
CZE
HU
N
SWE
NO
R
OEC
D
DEU FI
N
AUS
CAN IR
L
PRT
SVK
NLD
FRA
BEL
ISL
GBR PO
L
TUR
ESP
ITA
GR
C
MEX
ASSESSMENT AND RECOMMENDATIONS
OECD ECONOMIC SURVEYS: SPAIN © OECD 201732
to personal pension plans. Deductions for contributions to personal pension plans were
tightened in 2015. While the tax deduction for investing in the primary residence was
recently eliminated, the transitory regime is still benefitting all those who purchased their
house before 2013. This credit is expected to cost EUR 1.2 billion in 2016 (Ministerio de
Hacienda y Administraciones Públicas, 2016) and tends to benefit higher income
households. Removing these exemptions provides an opportunity to improve the equity
and efficiency of the tax system.
The recent reduction in the standard corporate income tax rate from 30% in 2014
to 25% in 2016 – aligning the tax rate for all firms – is welcome, as evidence suggests that
high corporate taxes are relatively harmful for growth (Johansson et al., 2008). However,
more could be done to broaden the corporate income tax base. For instance, making
depreciation allowances more neutral across asset types and businesses by aligning tax
depreciation with the economic depreciation of assets could also contribute to broaden the
base and help reduce distortions to capital allocation (OECD, 2014d).
The government has introduced in December 2016 a number of measures to broaden
the corporate income tax base affecting large companies that is expected to raise
EUR 4.6 billion. Most notably, the measures include limiting how much companies can
deduct past losses (25% for companies with net revenues above EUR 60 million and 50% for
companies with net revenues between EUR 20 and EUR 60 million). It also further limits the
deductibility of impairment losses – i.e. losses that arise because tangible or intangible
goods loose value. The government should carefully monitor the impact of these
measures. Given the deep economic downturn many businesses have made losses, which
they will now partly loose. Such measures might reduce firms’ incentives to take risks in
the future and could also significantly reduce the attractiveness of Spain as a location
for investment.
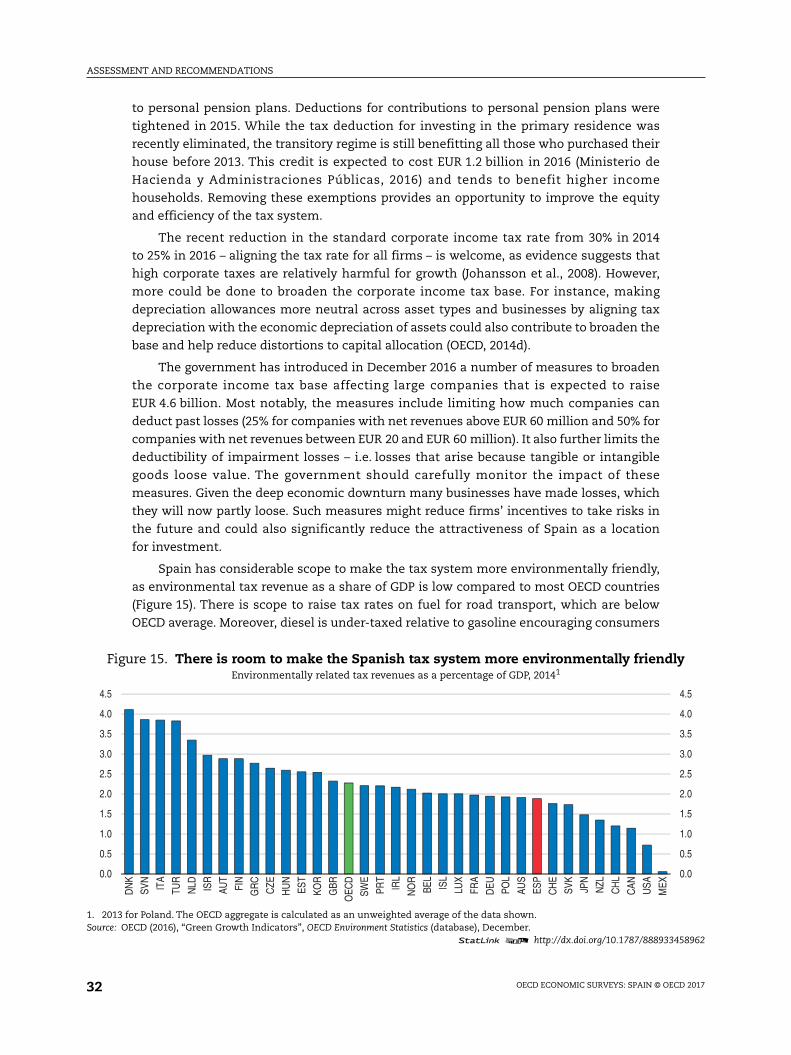
Spain has considerable scope to make the tax system more environmentally friendly,
as environmental tax revenue as a share of GDP is low compared to most OECD countries
(Figure 15). There is scope to raise tax rates on fuel for road transport, which are below
OECD average. Moreover, diesel is under-taxed relative to gasoline encouraging consumers
Figure 15. There is room to make the Spanish tax system more environmentally friendlyEnvironmentally related tax revenues as a percentage of GDP, 20141
1. 2013 for Poland. The OECD aggregate is calculated as an unweighted average of the data shown.Source: OECD (2016), “Green Growth Indicators”, OECD Environment Statistics (database), December.
1 2 http://dx.doi.org/10.1787/888933458962
0.0
0.5
1.0
1.5
2.0
2.5
3.0
3.5
4.0
4.5
0.0
0.5
1.0
1.5
2.0
2.5
3.0
3.5
4.0
4.5
DN
K
SVN
ITA
TUR
NLD IS
R
AUT
FIN
GR
C
CZE
HU
N
EST
KOR
GBR
OEC
D
SWE
PRT
IRL
NO
R
BEL
ISL
LUX
FRA
DEU PO
L
AUS
ESP
CH
E
SVK
JPN
NZL
CH
L
CAN USA
MEX

ASSESSMENT AND RECOMMENDATIONS
OECD ECONOMIC SURVEYS: SPAIN © OECD 2017 33
to buy diesel cars despite diesel cars produce more CO2 emissions per litre than gasoline,
and diesel cars emit more health damaging air pollutants per kilometre driven. The
government should increase taxation per litre of diesel to at least the level of taxes on
gasoline, and should increase diesel prices further if differences in local pollution costs are
to be reflected in fuel prices. Simulations suggest that additional EUR 4 billion of revenues
could be raised by taxing diesel at the same rate in energy terms as gasoline (OECD, 2014d).
OECD research shows that carbon prices are not likely to change the competitiveness of
affected firms; higher energy prices also do not raise particularly strong distributional
concerns (Flues and Thomas, 2015; OECD, 2016c). There is also scope to reduce exemptions
to broaden the environmental tax base, as some users in agriculture, mining, aviation,
navigation and railway transport are exempted from fuel tax or the excise duty on
electricity (OECD, 2015c).
Making growth more inclusive by reducing unemployment and improvingjob quality
Improving the functioning of the labour market and strengthening the skills of
Spanish workers will be paramount to make growth more inclusive and raise well-being.
The labour market faces several problems, the most important of them being very high
unemployment, a low level of skills, and the high share of long-term unemployed (47.8% of
all unemployed in the fourth quarter of 2016).
Moreover, job quality, which deteriorated in the wake of the crisis, needs to improve to
make growth inclusive. Job quality, in the form of earnings, labour market security and the
quality of the working environment, is important for well-being and productivity (OECD,
2014e; Cazes et al., 2015). Spanish workers faced the highest probability of becoming
unemployed in the OECD in 2013, mainly as a result of massive job separation from
temporary contracts. Once unemployed, the expected length of unemployment spells was
also very high by OECD standards. This is likely to have improved somewhat since then given
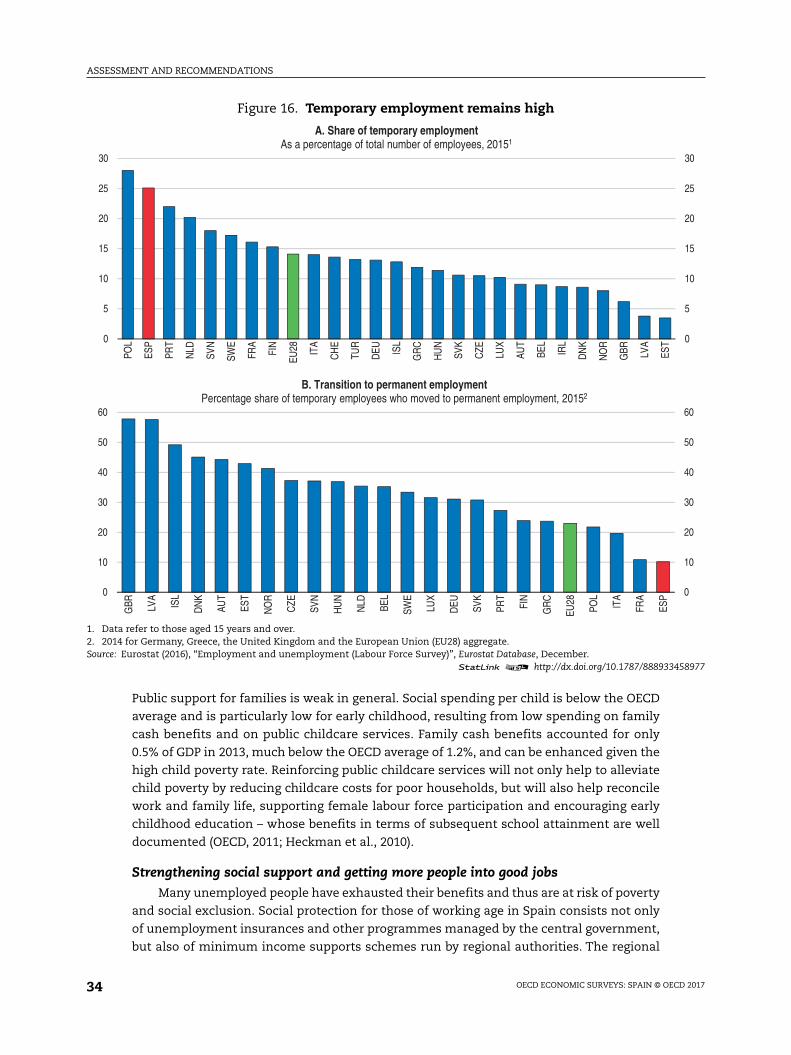
the labour market recovery, as outflows to unemployment have fallen. However, one quarter
of all employees is on temporary jobs, the highest share in the OECD after Poland (Figure 16,
Panel A). In addition, Spain also shows the lowest rate of transition from temporary workers
into permanent employment (Figure 16, Panel B). Average earnings are also comparatively
low reflecting weak worker skills and poor firm productivity (Chapter 1). Finally, job
demands on workers such as time pressure or physical health risks are excessive compared
to the resources they have, including weak access to training.
The steep rise in joblessness in the wake of the crisis and, to a lesser extent, higher
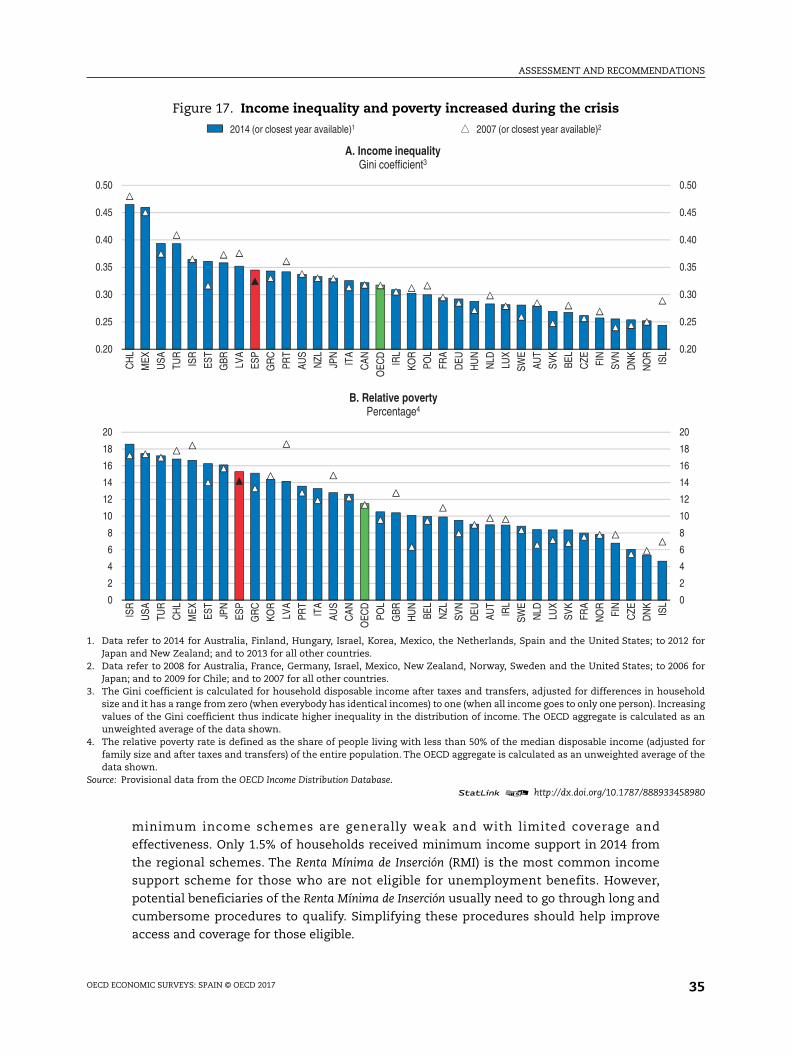
disparity in annual earnings, raised income inequality (Figure 17, Panel A). Jobless
people and temporary workers are at the bottom of the income distribution. The poverty
rate – measured by the share of households living with less than 50% of the median
household disposable income – remains high (Figure 17, Panel B), despite declining
somewhat in 2014, and it is likely to have continued declining since given the improvement
in the labour market. Poverty is particularly high among jobless households, especially
those with children, as reflected by a high child poverty rate of 23.4% compared to an OECD
average of 13.3% in 2013.
The tax and transfer system does help to reduce income inequality and poverty
(Figure 18) and there is some evidence that suggests that the 2014 tax reform might have
contributed to lowering inequality (Instituto de Estudios Fiscales, 2015), but more can be
done. Transfers help to reduce poverty, but are low and benefit the better-off (Figure 19).
ASSESSMENT AND RECOMMENDATIONS
OECD ECONOMIC SURVEYS: SPAIN © OECD 201734
Public support for families is weak in general. Social spending per child is below the OECD
average and is particularly low for early childhood, resulting from low spending on family
cash benefits and on public childcare services. Family cash benefits accounted for only
0.5% of GDP in 2013, much below the OECD average of 1.2%, and can be enhanced given the
high child poverty rate. Reinforcing public childcare services will not only help to alleviate
child poverty by reducing childcare costs for poor households, but will also help reconcile
work and family life, supporting female labour force participation and encouraging early
childhood education – whose benefits in terms of subsequent school attainment are well
documented (OECD, 2011; Heckman et al., 2010).
Strengthening social support and getting more people into good jobsMany unemployed people have exhausted their benefits and thus are at risk of poverty
and social exclusion. Social protection for those of working age in Spain consists not only
of unemployment insurances and other programmes managed by the central government,
but also of minimum income supports schemes run by regional authorities. The regional
Figure 16. Temporary employment remains high
1. Data refer to those aged 15 years and over.2. 2014 for Germany, Greece, the United Kingdom and the European Union (EU28) aggregate.Source: Eurostat (2016), “Employment and unemployment (Labour Force Survey)”, Eurostat Database, December.
1 2 http://dx.doi.org/10.1787/888933458977
0
5
10
15
20
25
30
0
5
10
15
20
25
30
POL
ESP
PRT
NLD
SVN
SWE
FRA
FIN
EU28 ITA
CH
E
TUR
DEU IS
L
GR
C
HU
N
SVK
CZE LU
X
AUT
BEL
IRL
DN
K
NO
R
GBR LV
A
EST
A. Share of temporary employmentAs a percentage of total number of employees, 20151
0
10
20
30
40
50
60
0
10
20
30
40
50
60
GBR LV
A
ISL
DN
K
AUT
EST
NO
R
CZE
SVN
HU
N
NLD BE
L
SWE
LUX
DEU SV
K
PRT
FIN
GR
C
EU28
POL
ITA
FRA
ESP
B. Transition to permanent employmentPercentage share of temporary employees who moved to permanent employment, 20152
ASSESSMENT AND RECOMMENDATIONS
OECD ECONOMIC SURVEYS: SPAIN © OECD 2017 35
minimum income schemes are generally weak and with limited coverage and
effectiveness. Only 1.5% of households received minimum income support in 2014 from
the regional schemes. The Renta Mínima de Inserción (RMI) is the most common income
support scheme for those who are not eligible for unemployment benefits. However,
potential beneficiaries of the Renta Mínima de Inserción usually need to go through long and
cumbersome procedures to qualify. Simplifying these procedures should help improve
access and coverage for those eligible.
Figure 17. Income inequality and poverty increased during the crisis
1. Data refer to 2014 for Australia, Finland, Hungary, Israel, Korea, Mexico, the Netherlands, Spain and the United States; to 2012 forJapan and New Zealand; and to 2013 for all other countries.
2. Data refer to 2008 for Australia, France, Germany, Israel, Mexico, New Zealand, Norway, Sweden and the United States; to 2006 forJapan; and to 2009 for Chile; and to 2007 for all other countries.
3. The Gini coefficient is calculated for household disposable income after taxes and transfers, adjusted for differences in householdsize and it has a range from zero (when everybody has identical incomes) to one (when all income goes to only one person). Increasingvalues of the Gini coefficient thus indicate higher inequality in the distribution of income. The OECD aggregate is calculated as anunweighted average of the data shown.
4. The relative poverty rate is defined as the share of people living with less than 50% of the median disposable income (adjusted forfamily size and after taxes and transfers) of the entire population. The OECD aggregate is calculated as an unweighted average of thedata shown.
Source: Provisional data from the OECD Income Distribution Database.1 2 http://dx.doi.org/10.1787/888933458980
0.20
0.25
0.30
0.35
0.40
0.45
0.50
0.20
0.25
0.30
0.35
0.40
0.45
0.50
CH
L
MEX
USA
TUR
ISR
EST
GBR LV
A
ESP
GR
C
PRT
AUS
NZL
JPN
ITA
CAN
OEC
D
IRL
KOR
POL
FRA
DEU
HU
N
NLD LU
X
SWE
AUT
SVK
BEL
CZE FI
N
SVN
DN
K
NO
R
ISL
A. Income inequalityGini coefficient3
0
2
4
6
8
10
12
14
16
18
20
0
2
4
6
8
10
12
14
16
18
20
ISR
USA
TUR
CH
L
MEX ES
T
JPN
ESP
GR
C
KOR
LVA
PRT
ITA
AUS
CAN
OEC
D
POL
GBR
HU
N
BEL
NZL
SVN
DEU AU
T
IRL
SWE
NLD LU
X
SVK
FRA
NO
R
FIN
CZE
DN
K
ISL
B. Relative povertyPercentage4
2014 (or closest year available)1 2007 (or closest year available)2

ASSESSMENT AND RECOMMENDATIONS
OECD ECONOMIC SURVEYS: SPAIN © OECD 201736
Basic support programmes to address poverty should be rethought. The schemes
should be streamlined, and coverage and the amount of support should be raised,
especially for families with children. Importantly, the social benefits for jobless people
should be strictly conditional on active job search which helps the beneficiaries to stay
connected to the labour market through public employment services. Finding a job is the
best way to get out of poverty durably. The income support system should also be better co-
ordinated with public employment services so that stronger links between protection and
activation are built into the system. The benefit should also be withdrawn more gradually
as earned income rises, instead of one-for-one reductions in the benefit as it is the case
currently, in order not to blunt financial incentives to work.
Policies to get people back into jobs are also critical. Spending on active labour market
measures – such as training and job placement – has increased (Table 4). Also, funding
from the central government is increasingly conditional on the performance in moving
people into work at the regional level, where the programmes are administered. However,
spending remains low (Figure 20) and public employment services still struggle to be
effective in finding jobs for the unemployed. Recent initiatives have been developed to
better profile and serve job seekers and to employ more specialised counsellors. However,
the sheer number of unemployed and the multiple barriers they face require more
targeting, more efficient use of resources and lower caseloads for staff. In providing
support to the long-term unemployed, the regional public employment services should
upgrade their services by improving their profiling tools and the co-ordination with social
services in providing support. Greater digitalisation could help to improve performance in
particular by streamlining processes whilst keeping costs down.
The long-term unemployed need better targeted and more effective programmes. The
existing programmes, Renta Activa de Inserción (RAI), Programa de Recualificación Profesional
(PREPARA) and Programa de Activación para el Empleo, (PAE) launched at different stages and
with different targets could be better co-ordinated or streamlined to become more
effective. The PAE – a major package of income support and training targeted at the
Figure 18. Taxation and transfers reduce inequality in household disposable incomeChanges in the Gini coefficient due to taxation and transfers, 2014 or closest year available1
1. Data refer to 2014 for Australia, Finland, Hungary, Israel, Korea, Mexico, the Netherlands, Spain and the United States; to 2012 forJapan and New Zealand; and to 2013 for all other countries. The Gini coefficient has a range from zero (when everybody has identicalincomes) to one (when all income goes to only one person). Increasing values of the Gini coefficient thus indicate higher inequality inthe distribution of income.
Source: Provisional data from the OECD Income Distribution Database.1 2 http://dx.doi.org/10.1787/888933458994
0.0
0.1
0.2
0.3
0.4
0.5
0.6
0.7
0.0
0.1
0.2
0.3
0.4
0.5
0.6
0.7C
HL
MEX
USA
TUR
ISR
EST
GBR LV
A
ESP
GR
C
PRT
AUS
NZL
JPN
ITA
CAN IR
L
KOR
POL
CH
E
FRA
DEU
HU
N
NLD LU
X
SWE
AUT
SVK
BEL
CZE FI
N
SVN
DN
K
NO
R
ISL
Gini after taxes and transfers Gini before taxes and transfers
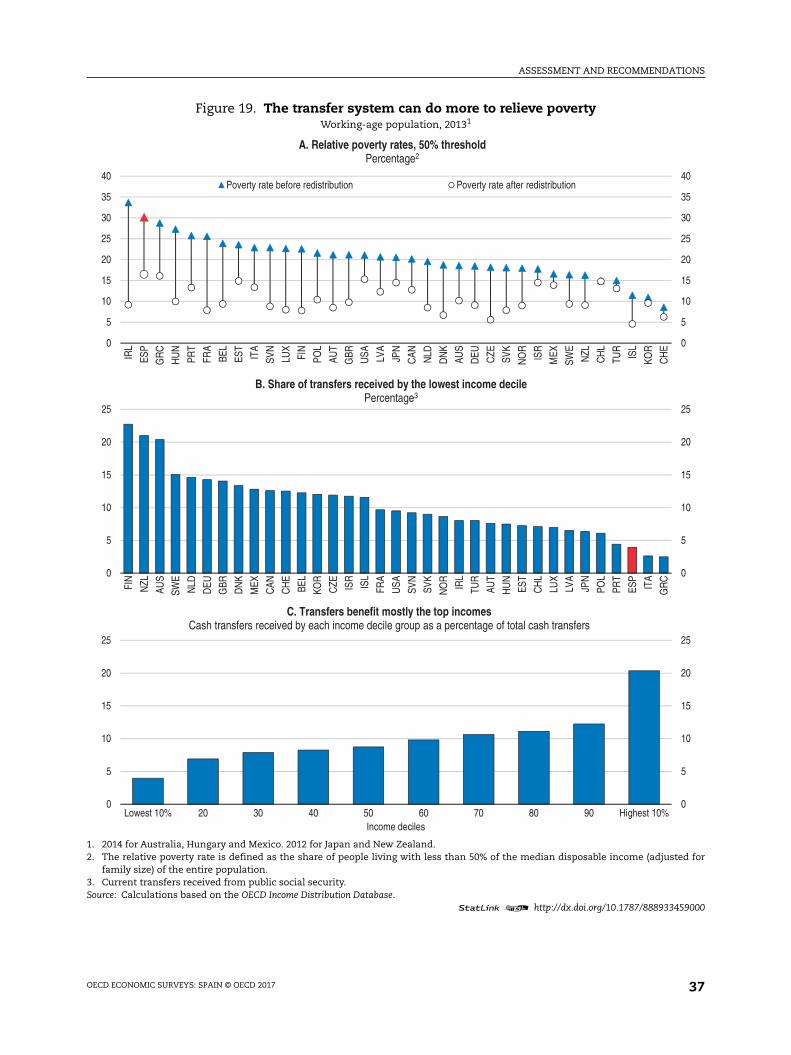
ASSESSMENT AND RECOMMENDATIONS
OECD ECONOMIC SURVEYS: SPAIN © OECD 2017 37
Figure 19. The transfer system can do more to relieve povertyWorking-age population, 20131
1. 2014 for Australia, Hungary and Mexico. 2012 for Japan and New Zealand.2. The relative poverty rate is defined as the share of people living with less than 50% of the median disposable income (adjusted for
family size) of the entire population.3. Current transfers received from public social security.Source: Calculations based on the OECD Income Distribution Database.
1 2 http://dx.doi.org/10.1787/888933459000
0
5
10
15
20
25
0
5
10
15
20
25
Lowest 10% 20 30 40 50 60 70 80 90 Highest 10%
C. Transfers benefit mostly the top incomesCash transfers received by each income decile group as a percentage of total cash transfers
Income deciles
0
5
10
15
20
25
30
35
40
0
5
10
15
20
25
30
35
40
IRL
ESP
GR
C
HU
N
PRT
FRA
BEL
EST
ITA
SVN
LUX
FIN
POL
AUT
GBR USA LV
A
JPN
CAN NLD
DN
K
AUS
DEU CZE
SVK
NO
R
ISR
MEX
SWE
NZL
CH
L
TUR
ISL
KOR
CH
E
A. Relative poverty rates, 50% thresholdPercentage2
Poverty rate before redistribution Poverty rate after redistribution
0
5
10
15
20
25
0
5
10
15
20
25
FIN
NZL
AUS
SWE
NLD
DEU
GBR
DN
K
MEX
CAN
CH
E
BEL
KOR
CZE IS
R
ISL
FRA
USA
SVN
SVK
NO
R
IRL
TUR
AUT
HU
N
EST
CH
L
LUX
LVA
JPN
POL
PRT
ESP
ITA
GR
C
B. Share of transfers received by the lowest income decile Percentage3
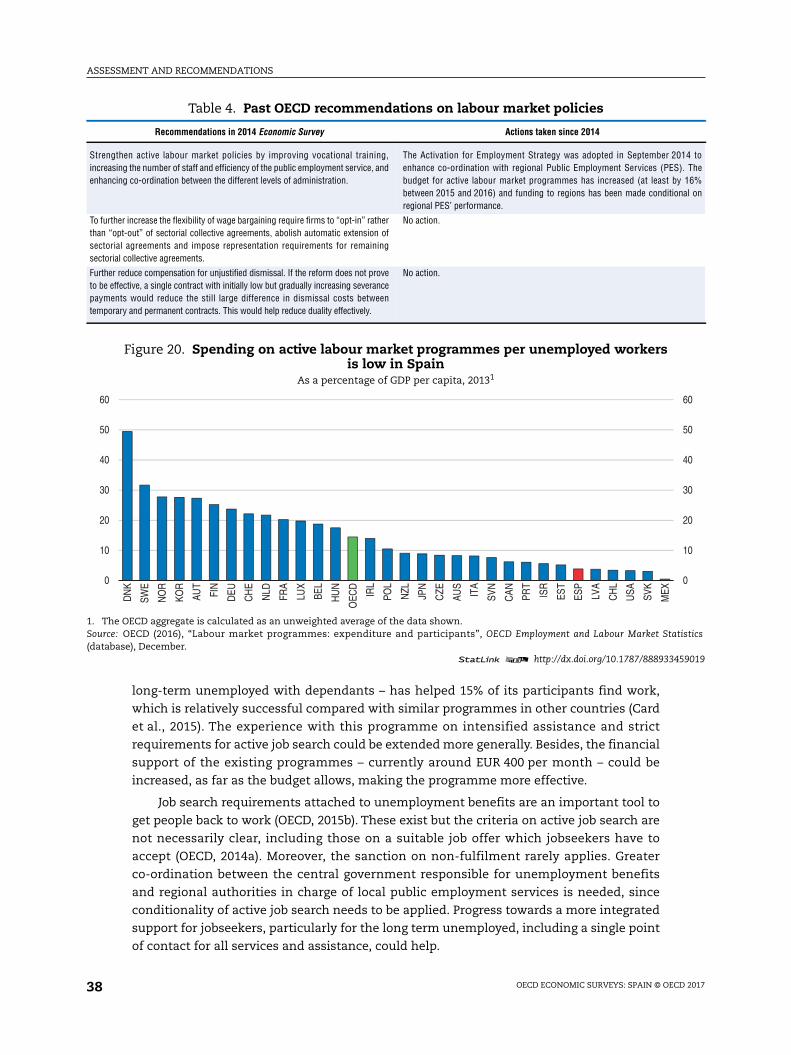
ASSESSMENT AND RECOMMENDATIONS
OECD ECONOMIC SURVEYS: SPAIN © OECD 201738
long-term unemployed with dependants – has helped 15% of its participants find work,
which is relatively successful compared with similar programmes in other countries (Card
et al., 2015). The experience with this programme on intensified assistance and strict
requirements for active job search could be extended more generally. Besides, the financial
support of the existing programmes – currently around EUR 400 per month – could be
increased, as far as the budget allows, making the programme more effective.
Job search requirements attached to unemployment benefits are an important tool to
get people back to work (OECD, 2015b). These exist but the criteria on active job search are
not necessarily clear, including those on a suitable job offer which jobseekers have to
accept (OECD, 2014a). Moreover, the sanction on non-fulfilment rarely applies. Greater
co-ordination between the central government responsible for unemployment benefits
and regional authorities in charge of local public employment services is needed, since
conditionality of active job search needs to be applied. Progress towards a more integrated
support for jobseekers, particularly for the long term unemployed, including a single point
of contact for all services and assistance, could help.
Table 4. Past OECD recommendations on labour market policies
Recommendations in 2014 Economic Survey Actions taken since 2014
Strengthen active labour market policies by improving vocational training,increasing the number of staff and efficiency of the public employment service, andenhancing co-ordination between the different levels of administration.
The Activation for Employment Strategy was adopted in September 2014 toenhance co-ordination with regional Public Employment Services (PES). Thebudget for active labour market programmes has increased (at least by 16%between 2015 and 2016) and funding to regions has been made conditional onregional PES’ performance.
To further increase the flexibility of wage bargaining require firms to “opt-in” ratherthan “opt-out” of sectorial collective agreements, abolish automatic extension ofsectorial agreements and impose representation requirements for remainingsectorial collective agreements.
No action.
Further reduce compensation for unjustified dismissal. If the reform does not proveto be effective, a single contract with initially low but gradually increasing severancepayments would reduce the still large difference in dismissal costs betweentemporary and permanent contracts. This would help reduce duality effectively.
No action.
Figure 20. Spending on active labour market programmes per unemployed workersis low in Spain
As a percentage of GDP per capita, 20131
1. The OECD aggregate is calculated as an unweighted average of the data shown.Source: OECD (2016), “Labour market programmes: expenditure and participants”, OECD Employment and Labour Market Statistics(database), December.
1 2 http://dx.doi.org/10.1787/888933459019
0
10
20
30
40
50
60
0
10
20
30
40
50
60
DN
K
SWE
NO
R
KOR
AUT
FIN
DEU
CH
E
NLD
FRA
LUX
BEL
HU
N
OEC
D
IRL
POL
NZL
JPN
CZE
AUS
ITA
SVN
CAN PR
T
ISR
EST
ESP
LVA
CH
L
USA SV
K
MEX
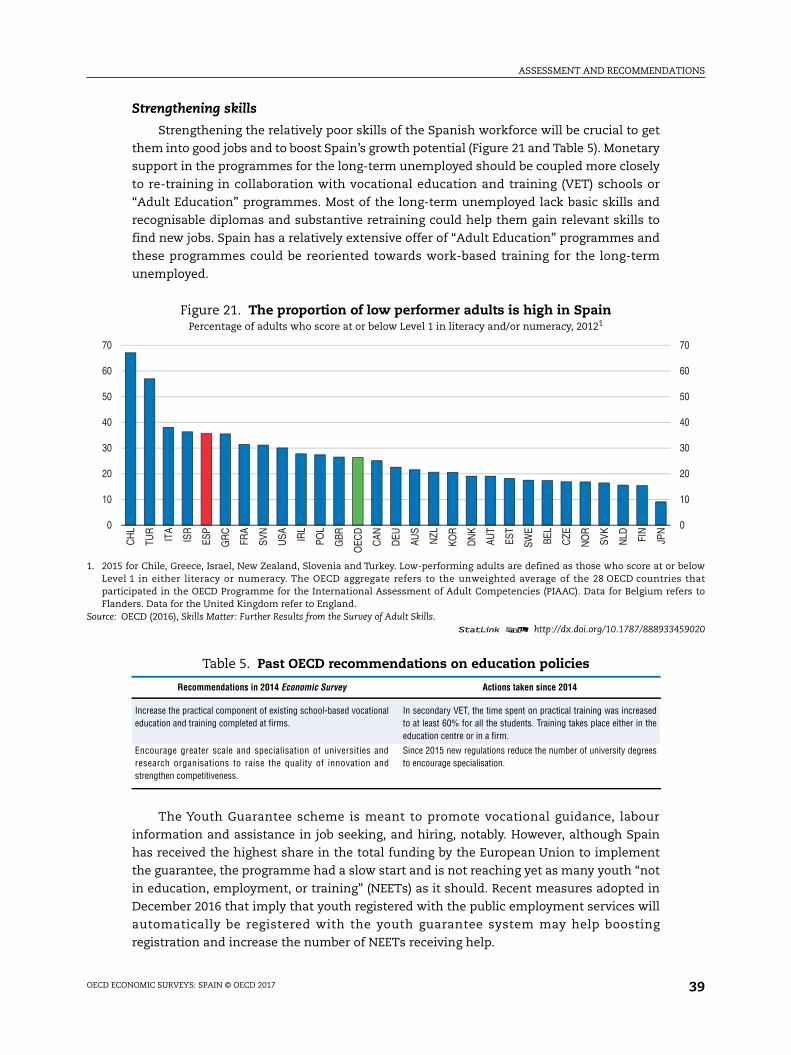
ASSESSMENT AND RECOMMENDATIONS
OECD ECONOMIC SURVEYS: SPAIN © OECD 2017 39
Strengthening skills
Strengthening the relatively poor skills of the Spanish workforce will be crucial to get
them into good jobs and to boost Spain’s growth potential (Figure 21 and Table 5). Monetary
support in the programmes for the long-term unemployed should be coupled more closely
to re-training in collaboration with vocational education and training (VET) schools or
“Adult Education” programmes. Most of the long-term unemployed lack basic skills and
recognisable diplomas and substantive retraining could help them gain relevant skills to
find new jobs. Spain has a relatively extensive offer of “Adult Education” programmes and
these programmes could be reoriented towards work-based training for the long-term
unemployed.
The Youth Guarantee scheme is meant to promote vocational guidance, labour
information and assistance in job seeking, and hiring, notably. However, although Spain
has received the highest share in the total funding by the European Union to implement
the guarantee, the programme had a slow start and is not reaching yet as many youth “not
in education, employment, or training” (NEETs) as it should. Recent measures adopted in
December 2016 that imply that youth registered with the public employment services will
automatically be registered with the youth guarantee system may help boosting
registration and increase the number of NEETs receiving help.
Figure 21. The proportion of low performer adults is high in SpainPercentage of adults who score at or below Level 1 in literacy and/or numeracy, 20121
1. 2015 for Chile, Greece, Israel, New Zealand, Slovenia and Turkey. Low-performing adults are defined as those who score at or belowLevel 1 in either literacy or numeracy. The OECD aggregate refers to the unweighted average of the 28 OECD countries thatparticipated in the OECD Programme for the International Assessment of Adult Competencies (PIAAC). Data for Belgium refers toFlanders. Data for the United Kingdom refer to England.
Source: OECD (2016), Skills Matter: Further Results from the Survey of Adult Skills.1 2 http://dx.doi.org/10.1787/888933459020
0
10
20
30
40
50
60
70
0
10
20
30
40
50
60
70
CH
L
TUR
ITA
ISR
ESP
GR
C
FRA
SVN
USA IR
L
POL
GBR
OEC
D
CAN
DEU AU
S
NZL
KOR
DN
K
AUT
EST
SWE
BEL
CZE
NO
R
SVK
NLD FI
N
JPN
Table 5. Past OECD recommendations on education policies
Recommendations in 2014 Economic Survey Actions taken since 2014
Increase the practical component of existing school-based vocationaleducation and training completed at firms.
In secondary VET, the time spent on practical training was increasedto at least 60% for all the students. Training takes place either in theeducation centre or in a firm.
Encourage greater scale and specialisation of universities andresearch organisations to raise the quality of innovation andstrengthen competitiveness.
Since 2015 new regulations reduce the number of university degreesto encourage specialisation.

ASSESSMENT AND RECOMMENDATIONS
OECD ECONOMIC SURVEYS: SPAIN © OECD 201740
There is also a need to improve compulsory education. The incidence of early school
leave has significantly fallen in recent years (from 26.3% in 2011 to 19.9% in 2015).
Nevertheless, Spain still has the highest incidence of early school leave in the EU
(Figure 22) and educational outcomes are poor (OECD, 2015d). This is explained by a
number of factors: good employment opportunities for low qualified youth in some
regions, reduced number of pathways to upper-level secondary education or the perceived
lower labour market value of some secondary vocational education and training (VET)
degrees. The Organic Law for the Improvement of Educational Quality (LOMCE) has been
gradually rolled out since 2014 with one of its aims being to tackle early drop-out rates
(OECD, 2014a, Box 1). For example, the law created a new Basic VET that will provide a new
path to upper secondary education and provides some tools for improving upper
secondary VET degrees by regions and schools. While it is too early to evaluate the impact
of the law, given its broad scope and uneven implementation across regions, its objectives
go in the right direction, with an increased focus on competencies and skills.
However, more needs to be done to improve teaching quality and educational outcomes.
OECD evidence shows that Spanish teachers are less likely to benefit from on the job support
programmes than teachers in other OECD countries, and that the support they receive is not
very effective (OECD, 2015d). Teachers also lack incentives and support to participate in
development activities. To effectively implement the new pedagogical approaches in the law
and help low achievers, teachers need better training and guidance if the reform is to
improve educational outcomes and reduce early drop-outs. Measures to enhance the quality
of teaching include improving university training, a better selection process, and effective
on-the-job training. Moreover, regions should evaluate how their spending is currently being
allocated in order to more effectively reduce early drop-out rates.
Vocational education and training (VET) can facilitate the transition from school to
work. The Organic Law for the Improvement of Educational Quality introduced the new
Basic VET, a fall-back programme for the least performing students which leads them to
obtaining a certificate recognised by the European Union, which apparently has helped to
reduce the early school leave rate. The Organic Law, in its primal objective for the VET
Figure 22. Early school-leaving rates are highPercentage of the population aged 18 to 24 having attained at most lower secondary education
and not being involved in further education or training, 2015
Source: Eurostat (2016), “Early leavers from education and training”, Eurostat Database, December.1 2 http://dx.doi.org/10.1787/888933459038
0
2
4
6
8
10
12
14
16
18
20
22
0
2
4
6
8
10
12
14
16
18
20
22
ESP
ISL
ITA
PRT
HU
N
EST
EU28
GBR
NO
R
BEL
DEU LU
X
FRA
FIN
NLD
GR
C
DN
K
AUT
SWE
IRL
SVK
CZE
POL
CH
E
SVN
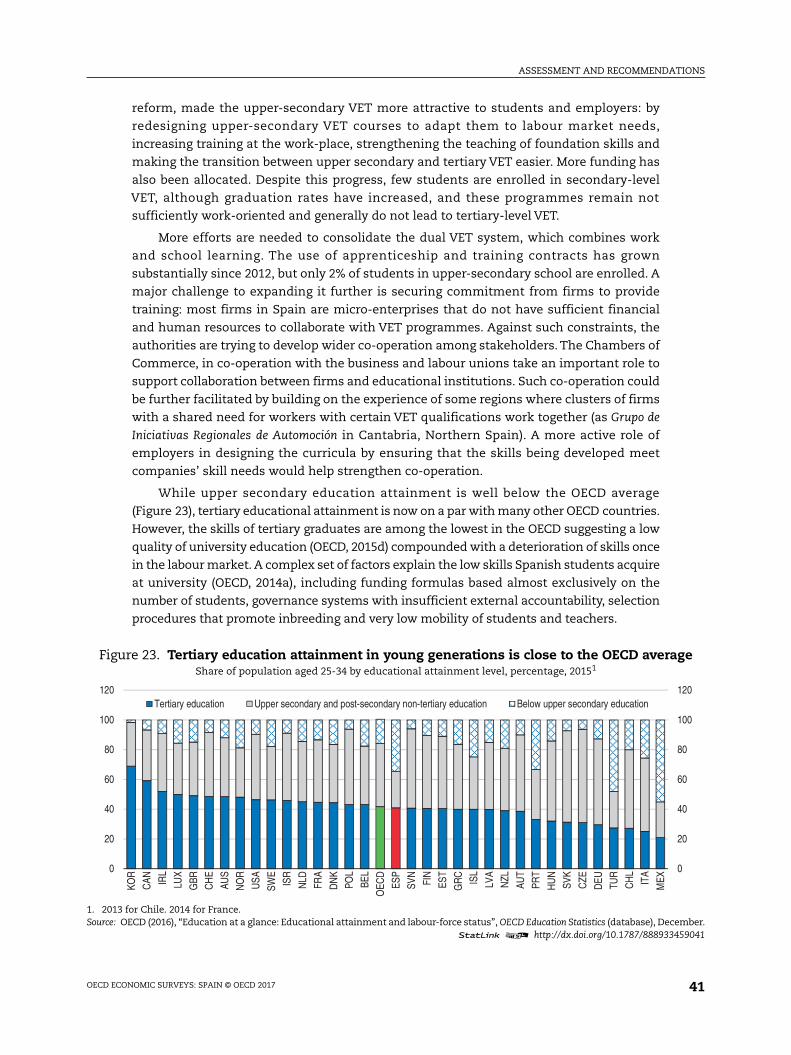
ASSESSMENT AND RECOMMENDATIONS
OECD ECONOMIC SURVEYS: SPAIN © OECD 2017 41
reform, made the upper-secondary VET more attractive to students and employers: by
redesigning upper-secondary VET courses to adapt them to labour market needs,
increasing training at the work-place, strengthening the teaching of foundation skills and
making the transition between upper secondary and tertiary VET easier. More funding has
also been allocated. Despite this progress, few students are enrolled in secondary-level
VET, although graduation rates have increased, and these programmes remain not
sufficiently work-oriented and generally do not lead to tertiary-level VET.
More efforts are needed to consolidate the dual VET system, which combines work
and school learning. The use of apprenticeship and training contracts has grown
substantially since 2012, but only 2% of students in upper-secondary school are enrolled. A
major challenge to expanding it further is securing commitment from firms to provide
training: most firms in Spain are micro-enterprises that do not have sufficient financial
and human resources to collaborate with VET programmes. Against such constraints, the
authorities are trying to develop wider co-operation among stakeholders. The Chambers of
Commerce, in co-operation with the business and labour unions take an important role to
support collaboration between firms and educational institutions. Such co-operation could
be further facilitated by building on the experience of some regions where clusters of firms
with a shared need for workers with certain VET qualifications work together (as Grupo de
Iniciativas Regionales de Automoción in Cantabria, Northern Spain). A more active role of
employers in designing the curricula by ensuring that the skills being developed meet
companies’ skill needs would help strengthen co-operation.
While upper secondary education attainment is well below the OECD average
(Figure 23), tertiary educational attainment is now on a par with many other OECD countries.
However, the skills of tertiary graduates are among the lowest in the OECD suggesting a low
quality of university education (OECD, 2015d) compounded with a deterioration of skills once
in the labour market. A complex set of factors explain the low skills Spanish students acquire
at university (OECD, 2014a), including funding formulas based almost exclusively on the
number of students, governance systems with insufficient external accountability, selection
procedures that promote inbreeding and very low mobility of students and teachers.
Figure 23. Tertiary education attainment in young generations is close to the OECD averageShare of population aged 25-34 by educational attainment level, percentage, 20151
1. 2013 for Chile. 2014 for France.Source: OECD (2016), “Education at a glance: Educational attainment and labour-force status”, OECD Education Statistics (database), December.
1 2 http://dx.doi.org/10.1787/888933459041
0
20
40
60
80
100
120
0
20
40
60
80
100
120
KOR
CAN IR
L
LUX
GBR
CH
E
AUS
NO
R
USA
SWE
ISR
NLD
FRA
DN
K
POL
BEL
OEC
D
ESP
SVN
FIN
EST
GR
C
ISL
LVA
NZL
AUT
PRT
HU
N
SVK
CZE
DEU TU
R
CH
L
ITA
MEX
Tertiary education Upper secondary and post-secondary non-tertiary education Below upper secondary education
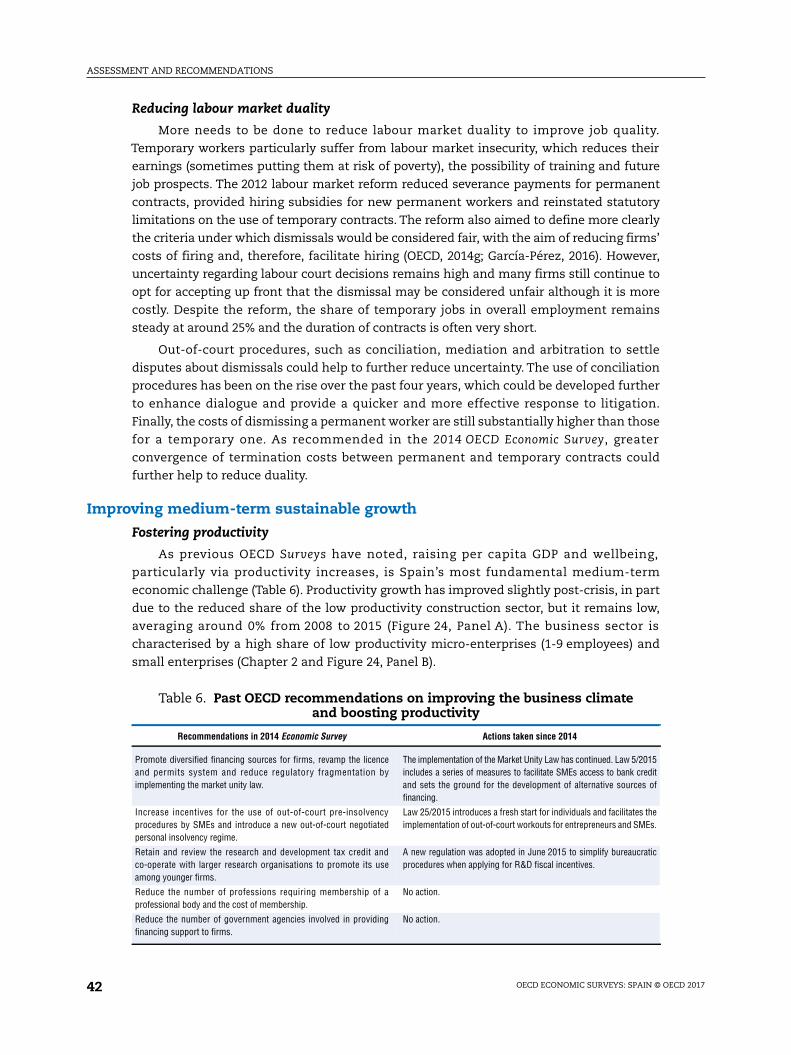
ASSESSMENT AND RECOMMENDATIONS
OECD ECONOMIC SURVEYS: SPAIN © OECD 201742
Reducing labour market duality
More needs to be done to reduce labour market duality to improve job quality.
Temporary workers particularly suffer from labour market insecurity, which reduces their
earnings (sometimes putting them at risk of poverty), the possibility of training and future
job prospects. The 2012 labour market reform reduced severance payments for permanent
contracts, provided hiring subsidies for new permanent workers and reinstated statutory
limitations on the use of temporary contracts. The reform also aimed to define more clearly
the criteria under which dismissals would be considered fair, with the aim of reducing firms’
costs of firing and, therefore, facilitate hiring (OECD, 2014g; García-Pérez, 2016). However,
uncertainty regarding labour court decisions remains high and many firms still continue to
opt for accepting up front that the dismissal may be considered unfair although it is more
costly. Despite the reform, the share of temporary jobs in overall employment remains
steady at around 25% and the duration of contracts is often very short.
Out-of-court procedures, such as conciliation, mediation and arbitration to settle
disputes about dismissals could help to further reduce uncertainty. The use of conciliation
procedures has been on the rise over the past four years, which could be developed further
to enhance dialogue and provide a quicker and more effective response to litigation.
Finally, the costs of dismissing a permanent worker are still substantially higher than those
for a temporary one. As recommended in the 2014 OECD Economic Survey, greater
convergence of termination costs between permanent and temporary contracts could
further help to reduce duality.
Improving medium-term sustainable growth
Fostering productivity
As previous OECD Surveys have noted, raising per capita GDP and wellbeing,
particularly via productivity increases, is Spain’s most fundamental medium-term
economic challenge (Table 6). Productivity growth has improved slightly post-crisis, in part
due to the reduced share of the low productivity construction sector, but it remains low,
averaging around 0% from 2008 to 2015 (Figure 24, Panel A). The business sector is
characterised by a high share of low productivity micro-enterprises (1-9 employees) and
small enterprises (Chapter 2 and Figure 24, Panel B).
Table 6. Past OECD recommendations on improving the business climateand boosting productivity
Recommendations in 2014 Economic Survey Actions taken since 2014
Promote diversified financing sources for firms, revamp the licenceand permits system and reduce regulatory fragmentation byimplementing the market unity law.
The implementation of the Market Unity Law has continued. Law 5/2015includes a series of measures to facilitate SMEs access to bank creditand sets the ground for the development of alternative sources offinancing.
Increase incentives for the use of out-of-court pre-insolvencyprocedures by SMEs and introduce a new out-of-court negotiatedpersonal insolvency regime.
Law 25/2015 introduces a fresh start for individuals and facilitates theimplementation of out-of-court workouts for entrepreneurs and SMEs.
Retain and review the research and development tax credit andco-operate with larger research organisations to promote its useamong younger firms.
A new regulation was adopted in June 2015 to simplify bureaucraticprocedures when applying for R&D fiscal incentives.
Reduce the number of professions requiring membership of aprofessional body and the cost of membership.
No action.
Reduce the number of government agencies involved in providingfinancing support to firms.
No action.
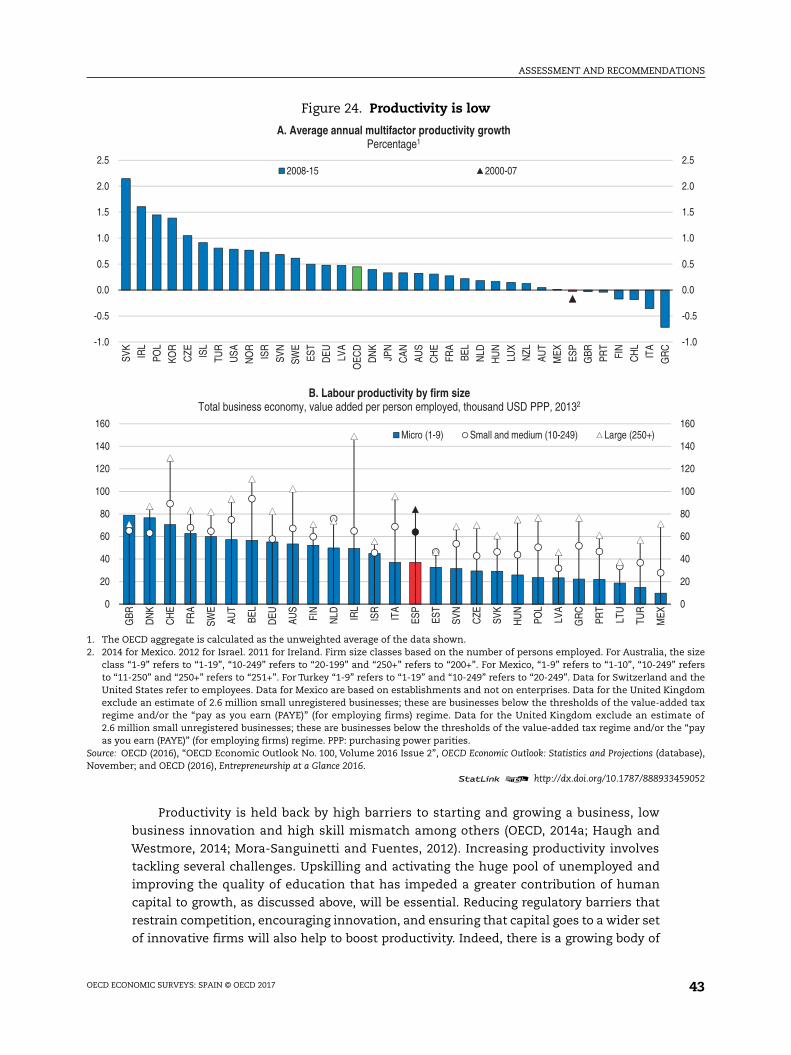
ASSESSMENT AND RECOMMENDATIONS
OECD ECONOMIC SURVEYS: SPAIN © OECD 2017 43
Productivity is held back by high barriers to starting and growing a business, low
business innovation and high skill mismatch among others (OECD, 2014a; Haugh and
Westmore, 2014; Mora-Sanguinetti and Fuentes, 2012). Increasing productivity involves
tackling several challenges. Upskilling and activating the huge pool of unemployed and
improving the quality of education that has impeded a greater contribution of human
capital to growth, as discussed above, will be essential. Reducing regulatory barriers that
restrain competition, encouraging innovation, and ensuring that capital goes to a wider set
of innovative firms will also help to boost productivity. Indeed, there is a growing body of
Figure 24. Productivity is low
1. The OECD aggregate is calculated as the unweighted average of the data shown.2. 2014 for Mexico. 2012 for Israel. 2011 for Ireland. Firm size classes based on the number of persons employed. For Australia, the size
class “1-9” refers to “1-19”, “10-249” refers to “20-199” and “250+” refers to “200+”. For Mexico, “1-9” refers to “1-10”, “10-249” refersto “11-250” and “250+” refers to “251+”. For Turkey “1-9” refers to “1-19” and “10-249” refers to “20-249”. Data for Switzerland and theUnited States refer to employees. Data for Mexico are based on establishments and not on enterprises. Data for the United Kingdomexclude an estimate of 2.6 million small unregistered businesses; these are businesses below the thresholds of the value-added taxregime and/or the “pay as you earn (PAYE)” (for employing firms) regime. Data for the United Kingdom exclude an estimate of2.6 million small unregistered businesses; these are businesses below the thresholds of the value-added tax regime and/or the “payas you earn (PAYE)” (for employing firms) regime. PPP: purchasing power parities.
Source: OECD (2016), “OECD Economic Outlook No. 100, Volume 2016 Issue 2”, OECD Economic Outlook: Statistics and Projections (database),November; and OECD (2016), Entrepreneurship at a Glance 2016.
1 2 http://dx.doi.org/10.1787/888933459052
-1.0
-0.5
0.0
0.5
1.0
1.5
2.0
2.5
-1.0
-0.5
0.0
0.5
1.0
1.5
2.0
2.5
SVK
IRL
POL
KOR
CZE IS
L
TUR
USA
NO
RIS
R
SVN
SWE
EST
DEU LV
A
OEC
DD
NK
JPN
CAN AU
SC
HE
FRA
BEL
NLD
HU
N
LUX
NZL
AUT
MEX ES
PG
BR PRT
FIN
CH
LIT
A
GR
C
A. Average annual multifactor productivity growthPercentage1
2008-15 2000-07
0
20
40
60
80
100
120
140
160
0
20
40
60
80
100
120
140
160
GBR
DN
K
CH
E
FRA
SWE
AUT
BEL
DEU AU
S
FIN
NLD IR
L
ISR
ITA
ESP
EST
SVN
CZE
SVK
HU
N
POL
LVA
GR
C
PRT
LTU
TUR
MEX
B. Labour productivity by firm sizeTotal business economy, value added per person employed, thousand USD PPP, 20132
Micro (1-9) Small and medium (10-249) Large (250+)

ASSESSMENT AND RECOMMENDATIONS
OECD ECONOMIC SURVEYS: SPAIN © OECD 201744
evidence that an important contributor to low productivity in Spain is misallocation of
capital to low productivity firms within all sectors and under-investment in knowledge-
based capital (Figure 25, Chapter 2), while misallocation of capital across sectors plays a
more minor role (Mora-Sanguinetti and Fuentes, 2012; García-Santana et al., 2016).
Figure 25. Innovative investment is low
1. Data for non-residential private investment refer to total investment (i.e. total gross fixed capital formation) minus government andhousing investment. Since data for housing investment for Spain and Portugal may also include government housing, the series fornon-residential private investment may be underestimated.
2. Data refer to business sector excluding real estate [i.e. all activities except for real estate activities (L), public administration anddefence, compulsory social security (O), education (P) and human health and social work activities (Q)]. Investment refers to grossfixed capital formation. Investment in intangibles refers to all knowledge-based capital (KBC) assets. KBC assets that are consistentwith the definition in the System of National Accounts (SNA) 2008 include: software, R&D, entertainment, literary and artisticoriginals, and mineral exploration. Other KBC assets include: design, new product developments in the financial industry, brands,firm-specific training and organisational capital. Investment in tangibles refers to gross fixed capital formation in construction andmachinery and equipment.
Source: OECD (2017), OECD Economic Outlook: Statistics and Projections (database), February; OECD (2017), OECD National Accounts Statistics(database), February; OECD (2015), OECD Science, Technology and Industry Scoreboard 2015: Innovation for growth and society; Corrado, C.,J. Haskel, C. Jona-Lasinio and M. Iommi, (2012), “Intangible Capital and Growth in Advanced Economies: Measurement Methods andComparative Results”, Working Paper, June (available at www.intan-invest.net).
1 2 http://dx.doi.org/10.1787/888933459060
0
20
40
60
80
100
120
140
GBR USA FR
A
SWE
FIN
NLD
DN
K
DEU AU
T
PRT
IRL
ITA
ESP
GR
C
B. Ratio of investment in intangibles relative to tangibles
Percentage, 20132
0
5
10
15
20
25
30
35
2000 2002 2004 2006 2008 2010 2012 2014 2016
A. Breakdown of total investment in Spain As a percentage of GDP1
TotalNon-residential privateHousingPublic
0
5
10
15
20
25
2000 2002 2004 2006 2008 2010 2012 2014 2016
C. Construction investmentAs a percentage of GDP
Spain
France
Germany
Portugal
0
2
4
6
8
10
12
14
2000 2002 2004 2006 2008 2010 2012 2014 2016
D. Non-construction investmentAs a percentage of GDP
Spain
France
Germany
Portugal
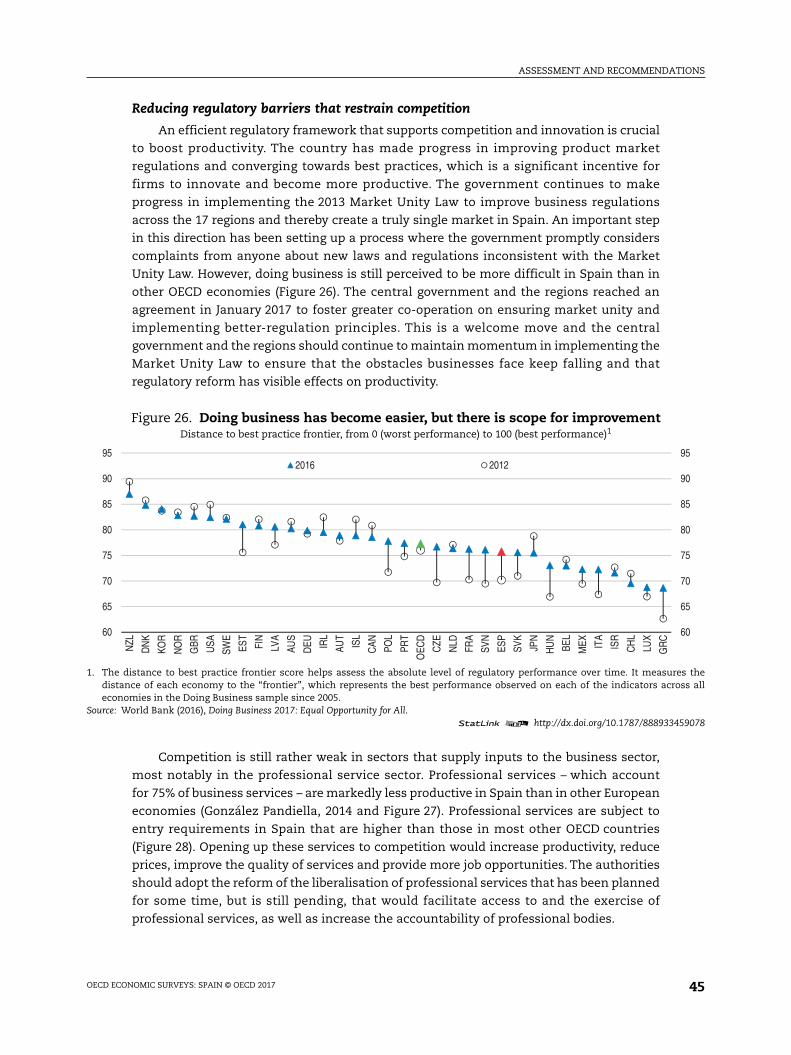
ASSESSMENT AND RECOMMENDATIONS
OECD ECONOMIC SURVEYS: SPAIN © OECD 2017 45
Reducing regulatory barriers that restrain competition
An efficient regulatory framework that supports competition and innovation is crucial
to boost productivity. The country has made progress in improving product market
regulations and converging towards best practices, which is a significant incentive for
firms to innovate and become more productive. The government continues to make
progress in implementing the 2013 Market Unity Law to improve business regulations
across the 17 regions and thereby create a truly single market in Spain. An important step
in this direction has been setting up a process where the government promptly considers
complaints from anyone about new laws and regulations inconsistent with the Market
Unity Law. However, doing business is still perceived to be more difficult in Spain than in
other OECD economies (Figure 26). The central government and the regions reached an
agreement in January 2017 to foster greater co-operation on ensuring market unity and
implementing better-regulation principles. This is a welcome move and the central
government and the regions should continue to maintain momentum in implementing the
Market Unity Law to ensure that the obstacles businesses face keep falling and that
regulatory reform has visible effects on productivity.
Competition is still rather weak in sectors that supply inputs to the business sector,
most notably in the professional service sector. Professional services – which account
for 75% of business services – are markedly less productive in Spain than in other European
economies (González Pandiella, 2014 and Figure 27). Professional services are subject to
entry requirements in Spain that are higher than those in most other OECD countries
(Figure 28). Opening up these services to competition would increase productivity, reduce
prices, improve the quality of services and provide more job opportunities. The authorities
should adopt the reform of the liberalisation of professional services that has been planned
for some time, but is still pending, that would facilitate access to and the exercise of
professional services, as well as increase the accountability of professional bodies.
Figure 26. Doing business has become easier, but there is scope for improvementDistance to best practice frontier, from 0 (worst performance) to 100 (best performance)1
1. The distance to best practice frontier score helps assess the absolute level of regulatory performance over time. It measures thedistance of each economy to the “frontier”, which represents the best performance observed on each of the indicators across alleconomies in the Doing Business sample since 2005.
Source: World Bank (2016), Doing Business 2017: Equal Opportunity for All.1 2 http://dx.doi.org/10.1787/888933459078
60
65
70
75
80
85
90
95
60
65
70
75
80
85
90
95
NZL
DN
K
KOR
NO
R
GBR USA
SWE
EST
FIN
LVA
AUS
DEU IR
L
AUT
ISL
CAN PO
L
PRT
OEC
D
CZE
NLD
FRA
SVN
ESP
SVK
JPN
HU
N
BEL
MEX IT
A
ISR
CH
L
LUX
GR
C
2016 2012

ASSESSMENT AND RECOMMENDATIONS
OECD ECONOMIC SURVEYS: SPAIN © OECD 201746
The Spanish wage bargaining system has been essentially characterised by collective
bargaining at the sector level for long time.The extension of collective agreements at the sector
level is automatic across the country, regardless of the representativeness of parties involved
in collective bargaining. Such collective agreements then bind not only wages but also other
employment conditions such as working time and shifts, unless firm-level agreements exist.
The 2012 reform gave priority to firm-level collective agreements and relaxed the conditions
for firms to opt-out (OECD, 2014g). The reform contributed to wage moderation (OECD, 2014g;
Doménech et al., 2016; García-Pérez, 2016), but firm-level agreements have been concluded
essentially only in large firms, and less than five per cent of all firms, many large ones, have
opted-out. The authorities should reconsider the conditions under which the statutory
collective agreements are extended, in particular, by gradually requiring higher and stricter
representativeness of business associations and by checking that such representativeness
applies. This would help avoid the situation that collective agreements are driven excessively
by a limited number of the best performing firms.
Figure 27. Productivity in professional services is lowApparent labour productivity, gross value added in thousand EUR per person employed, 20141
1. 2012 for Ireland.2. Accounting, bookkeeping and auditing; tax consultancy.3. Including related technical consultancy.Source: Eurostat (2017), “Structural business Statistics – Services”, Eurostat Database, February.
1 2 http://dx.doi.org/10.1787/888933459084
0
20
40
60
80
100
120
140
160
CH
EN
OR
SWE
DN
KLU
XFR
ABE
LFI
NG
BR IRL
NLD
AUT
EU28
DEU IT
AES
PSV
NES
TC
ZEH
UN
PRT
SVK
POL
LVA
GR
C
A. Legal
0
20
40
60
80
100
120
140
160
LUX
CH
EN
OR
DN
KG
BR FRA
SWE
NLD IR
LAU
TBE
LD
EU FIN
EU28 ITA
ESP
SVN
CZE
GR
CSV
KPR
TPO
LES
TH
UN
LVA
B. Accounting2
0
20
40
60
80
100
120
140
160
NO
RG
BR LUX
DN
KSW
EFR
AD
EU FIN
AUT
NLD IR
LEU
28BE
LIT
ASV
KES
PSV
NPO
LPR
TG
RC
HU
NLV
AC. Architecture
0
20
40
60
80
100
120
140
160
NO
RG
BR LUX
DN
KBE
LSW
EN
LDFR
AD
EU AUT
EU28 FIN
ESP
ITA
SVN
EST
PRT
SVK
POL
HU
NG
RC
LVA
D. Engineering3
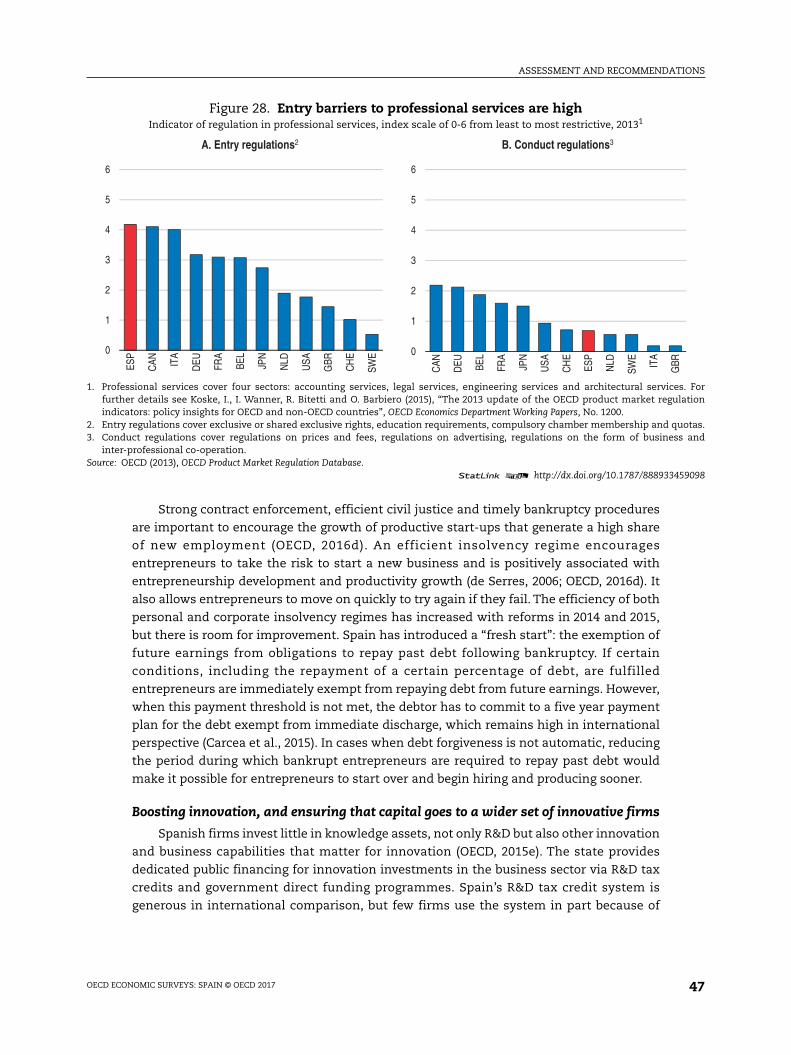
ASSESSMENT AND RECOMMENDATIONS
OECD ECONOMIC SURVEYS: SPAIN © OECD 2017 47
Strong contract enforcement, efficient civil justice and timely bankruptcy procedures
are important to encourage the growth of productive start-ups that generate a high share
of new employment (OECD, 2016d). An efficient insolvency regime encourages
entrepreneurs to take the risk to start a new business and is positively associated with
entrepreneurship development and productivity growth (de Serres, 2006; OECD, 2016d). It
also allows entrepreneurs to move on quickly to try again if they fail. The efficiency of both
personal and corporate insolvency regimes has increased with reforms in 2014 and 2015,
but there is room for improvement. Spain has introduced a “fresh start”: the exemption of
future earnings from obligations to repay past debt following bankruptcy. If certain
conditions, including the repayment of a certain percentage of debt, are fulfilled
entrepreneurs are immediately exempt from repaying debt from future earnings. However,
when this payment threshold is not met, the debtor has to commit to a five year payment
plan for the debt exempt from immediate discharge, which remains high in international
perspective (Carcea et al., 2015). In cases when debt forgiveness is not automatic, reducing
the period during which bankrupt entrepreneurs are required to repay past debt would
make it possible for entrepreneurs to start over and begin hiring and producing sooner.
Boosting innovation, and ensuring that capital goes to a wider set of innovative firms
Spanish firms invest little in knowledge assets, not only R&D but also other innovation
and business capabilities that matter for innovation (OECD, 2015e). The state provides
dedicated public financing for innovation investments in the business sector via R&D tax
credits and government direct funding programmes. Spain’s R&D tax credit system is
generous in international comparison, but few firms use the system in part because of
Figure 28. Entry barriers to professional services are highIndicator of regulation in professional services, index scale of 0-6 from least to most restrictive, 20131
1. Professional services cover four sectors: accounting services, legal services, engineering services and architectural services. Forfurther details see Koske, I., I. Wanner, R. Bitetti and O. Barbiero (2015), “The 2013 update of the OECD product market regulationindicators: policy insights for OECD and non-OECD countries”, OECD Economics Department Working Papers, No. 1200.
2. Entry regulations cover exclusive or shared exclusive rights, education requirements, compulsory chamber membership and quotas.3. Conduct regulations cover regulations on prices and fees, regulations on advertising, regulations on the form of business and
inter-professional co-operation.Source: OECD (2013), OECD Product Market Regulation Database.
1 2 http://dx.doi.org/10.1787/888933459098
0
1
2
3
4
5
6
ESP
CAN IT
A
DEU FR
A
BEL
JPN
NLD
USA
GBR
CH
E
SWE
A. Entry regulations2
0
1
2
3
4
5
6
CAN
DEU BE
L
FRA
JPN
USA
CH
E
ESP
NLD
SWE
ITA
GBR
B. Conduct regulations3
ASSESSMENT AND RECOMMENDATIONS
OECD ECONOMIC SURVEYS: SPAIN © OECD 201748
complex procedural requirements. To boost take up, the procedures should be simplified
and well publicised. Moreover, in the past few years, a significant part of the government
budget for innovation was not spent because it was allocated to loans to firms for R&D but
the loans were not taken up. To improve the effectiveness of R&D support, the government
should favour the financing of performance based grants and public-private collaborative
projects to increase firms’ R&D and to slow the very high brain drain of talented
researchers over the financing of repayable loans.
To foster firm productivity it will be important to ensure that financing goes to the
most promising projects. The successful recapitalisation of the banking system following
the crisis has laid the foundations for a better allocation of capital in Spain. The authorities
have also taken measures to expand capital market finance, introducing an alternative
fixed-income securities market, MARF, and an alternative stock market, MAB. Both are
expanding, but to gain access to the market a firm still has to be reasonably large with an
average bond issue size on the MARF of EUR 20 million (Guijarro and Mañueco, 2013).
Improving the flow of capital to a wider class of new innovative firms requires more
education for entrepreneurs on how to access finance. It also requires making banking and
capital markets work more in tandem to combine banks’ in-depth knowledge of individual
clients with the capacity of capital markets to spread risk widely. This is especially
important for SMEs, which have more difficulties than large firms accessing either of these
channels because their high riskiness impedes their access to bank finance and a lack of
information and their size impedes them from accessing capital markets.
To increase the flow of funds to SMEs more can be done to tailor securitisation and
mutual guarantee schemes to make it more attractive to list and buy securitised SME debt
on MARF or MAB. The government could introduce risk sharing mechanisms, such as
providing guarantees to SME bond funds that purchase either loans securitised by banks or
smaller bonds issued directly by small firms. To reduce financial risks, the banks
originating the loans should be required to retain a stake and the loans should be mutually
guaranteed by the banks themselves, as is done in France with bond issues as low as
EUR 500 000 (OECD, 2015f).
State funding for firms can be better prioritised. The state-owned bank Instituto de
Crédito Oficial (ICO) provides second-floor facilities funds to SMEs where commercial
banks assume the credit risk of the loan. In addition ICO provides direct financing activities
directed to large projects in different economic sectors. ICO should encourage banks to
focus more on lending to innovative companies. ICO also provides equity capital via several
instruments. One of these is a “fund of funds” public venture capital fund, Fond-ICO Global,
introduced in 2013. Fond-ICO Global should put emphasis at the early and late stages of the
venture capital cycle, where there is less provision of private capital.
The public national innovation company (ENISA) helps to finance early stage start-ups,
allowing them to establish a long enough track record to convince private venture capitalists
to invest. ENISA’s funding is very modest, though has increased recently. The government
should consider further increasing ENISA’s funding subject to the overall expenditure review
because it plays a complementary role to market finance. It funds early stage start-ups that
would not be financed by the private sector, allowing these firms to establish a long enough
track record to convince private venture capitalists to invest.

ASSESSMENT AND RECOMMENDATIONS
OECD ECONOMIC SURVEYS: SPAIN © OECD 2017 49
Centro de Desarrollo Tecnológico Industrial (CDTI) is the main public actor funding
business R&D and innovation projects in Spain. The “Innvierte” programme of CDTI aims to
promote business innovation by supporting venture capital investment in technology based
and innovative companies and to foster the entry of private venture capital to support their
technological activities and internationalisation. The CDTI’s share of funding available for
grants has declined over time and there should be a partial shift of loan funding towards
grants, especially to SMEs with technological and innovative development projects.
Making growth greener
Over the past decade, Spain reduced the carbon, energy and resource intensity of its
economy despite the financial crisis and following recession and significantly expanded
protected natural areas (OECD, 2015f). Yet, important environmental pressures remain
(Figure 29). Spain is committed to fulfil jointly with other EU member states the 2020 target
of reducing GHG emissions by 20% from 1990 levels. Moreover, Spain aims to reduce its
non-ETS GHG emissions by 10% from 2005 levels by 2020. Making the tax system more
environmentally friendly, on which there has been little progress recently (Table 7), would
help to reach that goal. Spain remains less successful than many countries in making use
of waste either by recycling or recovering energy in incineration; landfill remains the main
treatment method for municipal waste and its share has increased in recent years.
Spain has one of the highest levels of water stress in the OECD (Figure 30), partly due
to large use of water for agricultural irrigation (OECD, 2015g). In some regions, especially in
southern parts where irrigated agriculture is a key industry, a substantial share of
groundwater resources is at risk of being overexploited and agriculture run-offs are hurting
groundwater quality contributing to the degradation of ecosystems, including important
wetlands. Moreover, low prices of water in Spain have encouraged capital misallocation to
water intensive, low productivity uses in the agricultural sector, weighing down on
productivity (Chapter 2). Greater use of water price signals, including cost-effective water
pricing and water trading as advised in the 2010 Economic Survey would help to generate
incentives to use water-saving technology more extensively in agricultural production.
Recent temporary measures introduced by decree law in 2015 in response to the drought,
including allowing the sale of water rights to a wider set of users and selling water rights
not used in the previous year, go in the right direction and should be made permanent.
Better pricing of water that more fully reflects all costs involved in the provision of water
services would further help to improve the efficiency in water use.
Spain’s investment and research in improving environmental performance is
relatively low. To a large extent policies to encourage green innovation and adoption are
the same as those to foster innovation and firm growth more generally. However,
environmental policies themselves, if properly designed, can provide critical incentives to
green industries and to spur investment in low-carbon technologies (OECD, 2014a and
Table 7). The government should continue to foster the entry of new firms with greener
technologies by reducing entry barriers and improving framework conditions for green
investment (OECD, 2015e). Tighter regulatory standards can also play a role.
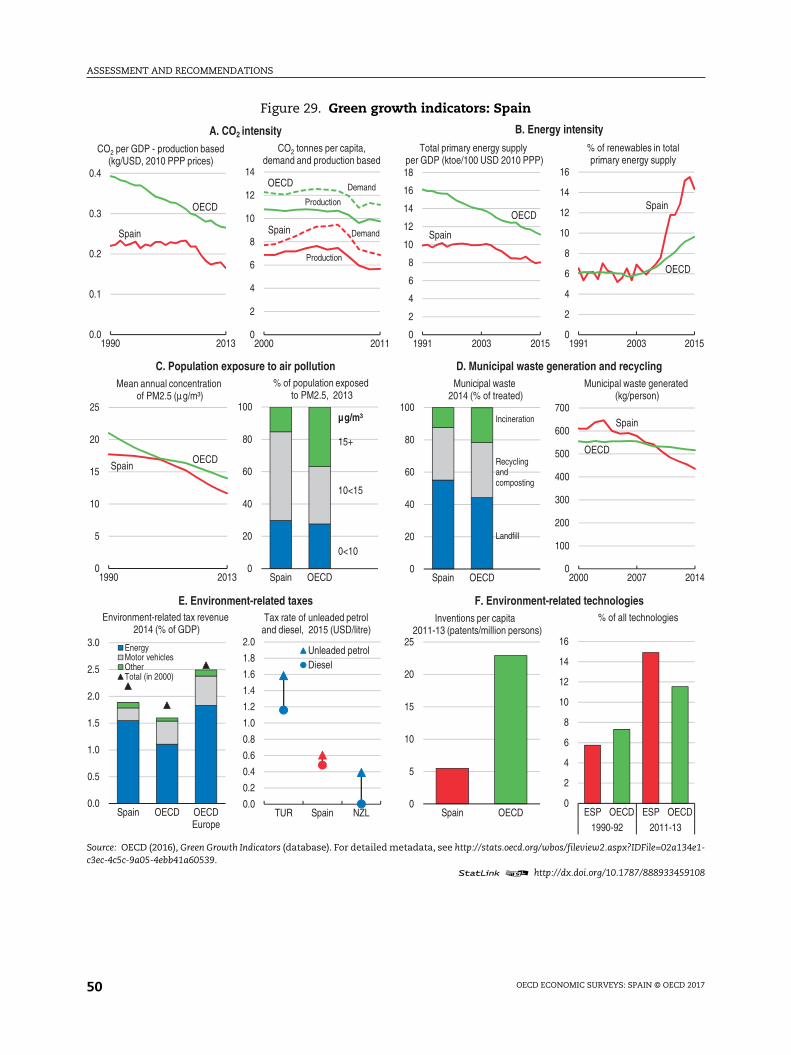
ASSESSMENT AND RECOMMENDATIONS
OECD ECONOMIC SURVEYS: SPAIN © OECD 201750
Figure 29. Green growth indicators: Spain
Source: OECD (2016), Green Growth Indicators (database). For detailed metadata, see http://stats.oecd.org/wbos/fileview2.aspx?IDFile=02a134e1-c3ec-4c5c-9a05-4ebb41a60539.
1 2 http://dx.doi.org/10.1787/888933459108
A. CO2 intensity B. Energy intensity
C. Population exposure to air pollution D. Municipal waste generation and recycling
E. Environment-related taxes F. Environment-related technologies
0.0
0.1
0.2
0.3
0.4
1990 2013
CO2 per GDP - production based(kg/USD, 2010 PPP prices)
OECD
Spain
0
2
4
6
8
10
12
14
2000 2011
CO2 tonnes per capita,demand and production based
OECD
Spain
Demand
Demand
Production
Production
0
2
4
6
8
10
12
14
16
18
1991 2003 2015
Total primary energy supply per GDP (ktoe/100 USD 2010 PPP)
OECD
Spain
0
2
4
6
8
10
12
14
16
1991 2003 2015
% of renewables in totalprimary energy supply
OECD
Spain
0
5
10
15
20
25
1990 2013
Mean annual concentration of PM2.5 (μg/m³)
OECDSpain
0
20
40
60
80
100
Spain OECD
% of population exposed to PM2.5, 2013
μg/m³
15+
10<15
0<10
0
20
40
60
80
100
Spain OECD
Municipal waste 2014 (% of treated)
Incineration
Recycling and composting
Landfill
0
100
200
300
400
500
600
700
2000 2007 2014
Municipal waste generated (kg/person)
OECD
Spain
0.0
0.5
1.0
1.5
2.0
2.5
3.0
Spain OECD OECDEurope
EnergyMotor vehiclesOtherTotal (in 2000)
Environment-related tax revenue 2014 (% of GDP)
0.0
0.2
0.4
0.6
0.8
1.0
1.2
1.4
1.6
1.8
2.0
TUR Spain NZL
Unleaded petrolDiesel
Tax rate of unleaded petroland diesel, 2015 (USD/litre)
0
5
10
15
20
25
Spain OECD
Inventions per capita 2011-13 (patents/million persons)
0
2
4
6
8
10
12
14
16
ESP OECD ESP OECD
1990-92 2011-13
% of all technologies

ASSESSMENT AND RECOMMENDATIONS
OECD ECONOMIC SURVEYS: SPAIN © OECD 2017 51
Bibliography
Banco de España (2015), “Credit and the economic recovery”, Annual Report 2014.
Banco de España (2016a), “Economic Bulletin, the Balance of Payments and International InvestmentPosition of Spain in 2015”.
Banco de España (2016b), Financial Stability Report, May 2016.
Carcea, M.C., D. Ciriraci, C. Cuerpo, D. Lorenzani and P. Pontuch (2015), “The Economic Impact ofRescue and Recovery Frameworks in the EU”, European Commission Discussion Papers, No. 4.
Card, D., J. Kluve and A. Weber (2015), “What Works? A Meta-Analysis of Recent Active Labor MarketProgram Evaluations”, NBER Working Paper, No. 21431.
Cazes, S., A. Hijzen and A. Saint-Martin (2015), “Measuring and assessing job quality: the OECD jobquality framework”, OECD Social, Employment and Migration Working Papers, No. 174, OECD Publishing,Paris, http://dx.doi.org/10.1787/5jm58qvzd6s4-en.
Cuenca, A. and V. Ruiz Almedral (2014), “Budgetary stability in the autonomous regions: Beyondconstitutional reform”, Spanish Economic and Financial Outlool, Vol. 3(4), pp. 53-62.
ECB (2016a), “The Euro Area bank lending survey”, First quarter of 2016, April 2016.
EIB (2016), “Investment and Investment Finance in Europe, Financing Productivity Growth”, Box 2,Chapter 6, Economics Department, European Investment Bank.
European Commission (2015), “The 2015 Ageing Report: Economic and Budgetary Projections for theEU28 Member States (2013-2060)”, European Economy, No. 3, Publications Office of the European Union,Luxembourg.
Table 7. Past OECD recommendations on environmental sustainability
Recommendations in 2014 Economic Survey Actions taken since 2014
Equalise pricing of greenhouse gas emissions across sources to contain carbonemissions and thereby promote green industry and jobs.
No action has been taken to increase taxation per litre of diesel to equalise itscarbon price with that of gasoline.
Ensure predictable policy support to low-carbon technologies. In July 2014, new mechanisms to gradually eliminate the accumulated tariff deficitin the gas sector were put in place. It remains to be seen whether the governmentwill maintain its strong long-term commitment to balancing the costs andrevenues in the gas sector.
Figure 30. Water stress is one of the highest among OECD countriesTotal freshwater abstraction as a percentage of total available renewable resources, 20121
1. 2013 for Germany. 2011 for Australia, Belgium, Canada and Japan. 2010 for New Zealand, Sweden and the United States. 2009 forIreland. 2008 for Italy. 2007 for Greece, Norway and Portugal.
Source: OECD (2017), “Green Growth Indicators”, OECD Environment Statistics (database), February.1 2 http://dx.doi.org/10.1787/888933459111
0
5
10
15
20
25
30
35
40
45
50
0
5
10
15
20
25
30
35
40
45
50
ITA
ISR
ESP
BEL
TUR
USA JP
N
POL
MEX FR
A
DEU ES
T
GR
C
PRT
NLD
CZE
OEC
D
GBR
HU
N
CH
E
AUS
DN
K
SVN
LUX
IRL
SWE
NZL
CAN SV
K
LVA
NO
R
ASSESSMENT AND RECOMMENDATIONS
OECD ECONOMIC SURVEYS: SPAIN © OECD 201752
European Commission (2016a), “Country Report Spain 2016. Including an In-Depth Review on theprevention and correction of macroeconomic imbalances”.
Flues, F. and A. Thomas (2015), “The distributional effects of energy taxes”, OECD Taxation WorkingPapers, No. 23, OECD Publishing, Paris, http://dx.doi.org/10.1787/5js1qwkqqrbv-en.
García-Pérez, J.I. (2016), “El efecto de la Reforma Laboral de 2012 sobre la dualidad y el empleo: Cambiosen la contratación y el despido por tipo de contrato”, Fedea Policy Papers, No. 2016/06.
García-Santana, M., J. Pijoan-Mas, E. Moral-Benito and R. Ramos (2016), “Growing like Spain 1995-2007”,CEPR Discussion Paper Series, No. 11144.
González Pandiella, A. (2014), “Moving Towards a More Dynamic Business Sector in Spain”, OECD EconomicsDepartment Working Papers, No. 1173, OECD Publishing, Paris, http://dx.doi.org/10.1787/5jxszm2k7fnw-en.
Government of Spain (2016), Actualización del Programa de Estabilidad 2016-2019 (Stability Programme Update).
Guijarro, P. and P. Mañueco (2013), “MARF: Perspectives and risks for Spain’s new alternative fixedincome market”, Spanish Economic and Financial Outlook, Vol. 2, pp. 27-35.
Haugh, D. and B. Westmore (2014), “Better Harnessing Talent and Knowledge to Boost SustainableMedium-term Growth in Spain”, OECD Economics Department Working Papers, No. 1172, OECDPublishing, Paris, http://dx.doi.org/10.1787/5jxszm4fwdjg-en.
Haugh, D. et al. (2016), “Cardiac arrest or dizzy spell: Why is world trade so weak and what can policy doabout it?”, OECD Economic Policy Paper, No. 18, September 2016, OECD Publishing, Paris, http://dx.doi.org/10.1787/5jlr2h45q532-en.
Haugh, D. and C. Martinez Toledano (2017), “The distribution of taxable income and fiscal benefits inSpain: New evidence from personal income tax returns (2002-2011)”, OECD Economics DepartmentWorking Papers, forthcoming.
Heckman, J., S.H Moon, R. Pinto, P. Savelyev and A. Yavitz (2010), “A New Cost-benefit and rate of returnanalysis for the Perry School Program”, NBER Working Paper Series, No. 16180, July, www.nber.org/papers/w16180.
IMF (2015), “2015 Article IV Consultation”.
Instituto de Estudios Fiscales (2015), “Evaluación de la Reforma del IRPF de 2015”, Ministerio de Hacienday Administraciones Públicas, Secretaría de Estado de Hacienda.
Johansson, Å., C. Heady, J. Arnold, B. Brys and L. Vartia (2008), “Taxation and Economic Growth”, OECDEconomics Department Working Papers, No. 620, OECD Publishing, Paris, http://dx.doi.org/10.1787/241216205486.
Medina Cas, S. and I. Peresa (2016), “What makes a good Bad Bank? The Irish, Spanish and GermanExperience”, European Economy Discussion Paper, No. 036.
Ministerio de Hacienda y Administraciones Públicas (2016), Presupuestos Generales del Estado 2016.Memoria de Beneficios Fiscales, www.sepg.pap.minhap.gob.es/Presup/PGE2016Proyecto/MaestroTomos/PGE-ROM/doc/L_16_A_A2.pdf.
Mora-Sanguinetti, J.S. and A. Fuentes (2012), “An Analysis of Productivity Performance in Spain beforeand during the crisis: Exploring the Role of Institutions”, OECD Economics Department Working Papers,No. 973, OECD Publishing, Paris, http://dx.doi.org/10.1787/5k9777lqshs5-en.
OECD (2010), OECD Economic Surveys: Spain 2010, OECD Publishing, Paris, http://dx.doi.org/10.1787/eco_surveys-esp-2010-en.
OECD (2011), Doing Better for Families, OECD Publishing, Paris, http://dx.doi.org/10.1787/9789264098732-en.
OECD (2014a), OECD Economic Surveys: Spain 2014, OECD Publishing, Paris, http://dx.doi.org/10.1787/eco_surveys-esp-2014-en.
OECD (2014b), “Spain: From Administrative Reform to Continuous Improvement”, OECD PublicGovernance Reviews, OECD Publishing, Paris, http://dx.doi.org/10.1787/9789264210592-en.
OECD (2014c), Consumption Tax Trends 2014: VAT/GST and excise rates, trends and policy issues, OECDPublishing, Paris, http://dx.doi.org/10.1787/ctt-2014-en.
OECD (2014d), “Inclusive and Sustainable Economic Growth through Fundamental Tax Reform inSpain”, OECD Publishing, Paris.
OECD (2014e), OECD Employment Outlook 2014, OECD Publishing, Paris, http://dx.doi.org/10.1787/empl_outlook-2014-en.
ASSESSMENT AND RECOMMENDATIONS
OECD ECONOMIC SURVEYS: SPAIN © OECD 2017 53
OECD (2014f), Skills Beyond School: Synthesis Report, OECD Reviews of Vocational Education and Training,OECD Publishing, Paris, http://dx.doi.org/10.1787/9789264214682-en.
OECD (2014g), The 2012 Labour Market Reform in Spain: A Preliminary Assessment, OECD Publishing, Paris,http://dx.doi.org/10.1787/9789264213586-en.
OECD (2015a), Pensions at a Glance 2015: OECD and G20 indicators, OECD Publishing, Paris, http://dx.doi.org/10.1787/pension_glance-2015-en.
OECD (2015b), OECD Employment Outlook 2015, OECD Publishing, Paris, http://dx.doi.org/10.1787/empl_outlook-2015-en.
OECD (2015c), OECD Environmental Performance Reviews: Spain 2015, OECD Publishing, Paris, http://dx.doi.org/10.1787/9789264226883-en.
OECD (2015d), OECD Skills Strategy Diagnostic Report: Spain 2015, OECD Publishing, Paris.
OECD (2015e), OECD Science, Technology and Industry Scoreboard 2015: Innovation for growth and society,OECD Publishing, Paris, http://dx.doi.org/10.1787/sti_scoreboard-2015-en.
OECD (2015f), New Approaches to SME and Entrepreneurship Financing: Broadening the Range of Instruments,OECD Publishing, Paris, http://dx.doi.org/10.1787/9789264240957-en.
OECD (2015g), “Policies to Manage Agricultural Groundwater Use: Spain”, Country Profile, OECD Publishing,Paris, www.oecd.org/tad/sustainable-agriculture/groundwater-country-note-SPA-2015%20final.pdf.
OECD (2015h), Policy Guidance for Investment in Clean Energy Infrastructure Expanding Access to Clean Energyfor Green Growth and Development, OECD Publishing, Paris, http://dx.doi.org/10.1787/9789264212664-en.
OECD (2016a), OECD Public Governance Reviews: Spain 2016 – Linking Reform to Results for the Country andits Regions, OECD Publishing, Paris, http://dx.doi.org/10.1787/9789264263024-en.
OECD (2016b), OECD Economic Outlook, Volume 2016 Issue 1, OECD Publishing, Paris, http://dx.doi.org/10.1787/eco_outlook-v2016-1-en.
OECD (2016c), Effective Carbon Rates Pricing CO2 through Taxes and Emissions Trading Systems, OECDPublishing, Paris, http://dx.doi.org/10.1787/9789264260115-en.
OECD (2016d), “No Country for Young Firms? Start-up Dynamics and National Policies”, OECD Science,Technology and Industry Policy Papers, No. 29, OECD Publishing, Paris, http://dx.doi.org/10.1787/5jm22p40c8mw-en.


OECD Economic Surveys: Spain
© OECD 2017
55
ANNEX
Progress in main structural reforms
This annex reviews action taken on recommendations from previous Surveys sincethe July 2014 Survey.

ANNEX. PROGRESS IN MAIN STRUCTURAL REFORMS
OECD ECONOMIC SURVEYS: SPAIN © OECD 201756
Recommendations in previous Surveys Actions taken
A. Public Finance
As specified in the government’s medium-term fiscal plan, return to a cyclically-adjusted primary fiscal balance by 2017.
Despite some slippage with respect to targets, Spain has made progress inreducing public deficits since 2012. The fiscal deficit continued to be reducedin 2015 but the pace of consolidation slowed with the general government deficitreaching 5.1% of GDP in 2015, above the excessive deficit procedure targetof 4.2%. The 2017 Budget aims at bringing the general government fiscal deficitto 3.1% of GDP.
Shift the balance from labour to indirect taxes by cutting employer social securitycontributions for low-skilled workers, increasing environmental and real estate taxes,and narrowing exemptions to value-added tax, corporation and income taxes.
A temporary measure to boost permanent jobs between February 2015 andAugust 2016 temporarily reduced social security contributions (SSCs) foremployers (deduction of the first EUR 500). It was limited to newly-hiredpermanent workers and targets, in particular, those at low earnings levels.
The 2014 tax reform reduced the statutory income tax rates, in particular, forlow-paid workers and simplified different deductions on labour earnings.
The reform also eliminated several tax benefits: the former EUR 1 500 dividend taxexemption; the tax benefits for the land lord renting; the exemption for severancepayments and the corrective coefficients when computing capital gains.
Broaden the corporate tax base, lower the rate and eliminate special regimes forsmall and medium-sized enterprises (SMEs).
The 2014 tax reform reduced the general corporate income tax rate from 30%in 2014 to 25% in 2016 by aligning it to that which had applied for the SMEsspecial regime.
Some measures were taken to broaden the corporate income tax base: furtherlimits on the tax deductibility of financial expenses; simplification of amortisation;non-deductibility of impairment losses; limitation to the compensation of previousnegative tax bases to 60% without temporal limit; and limitation of the deductibilityof representation expenses.
In December 2016, a number of measures to broaden the corporate income taxbase affecting large companies were introduced. Most notably, the measuresinclude limiting how much companies can deduct past losses (25% for companieswith net revenues above EUR 60 million and 50% for companies with net revenuesbetween EUR 20 and EUR 60 million). It also further limits the deductibility ofimpairment losses – i.e. losses that arise because tangible or intangible goodsloose value because of damage- due to equity holdings or participations.
B. Labour market and education reform
Strengthen active labour market policies by improving vocational training,increasing the number of staff and efficiency of the public employment service, andenhancing co-ordination between the different levels of administration.
The Activation for Employment Strategy was adopted in September 2014, aimingto enhance co-ordination with regional Public Employment Services (PES). Thebudget for active labour market programmes has been increased and funding toregions has been made conditional on regional PESs’ results based on a widerange of performance indicators. A Common Catalogue of Services was adopted inFebruary 2015, to ensure minimum quality standards in PESs.
A comprehensive reform of the professional training system for workers andjobseekers was adopted in September 2015.
Encourage greater scale and specialisation of universities and researchorganisations to raise the quality of innovation and strengthen competitiveness.
Since 2015 new regulations reduce the number of university degrees to encouragespecialisation.
Increase the practical component of existing school-based vocational educationand training (VET) completed at firms.
In secondary VET, the time spent on practical training was increased to 60% for allthe students. Training takes place either in the education centre or in a firm.
Further reduce compensation for unjustified dismissal. If the reform does notprove to be effective, a single contract with initially low but gradually increasingseverance payments would reduce the still large difference in dismissal costsbetween temporary and permanent contracts. This would help reduce dualityeffectively.
No action.
To further increase the flexibility of wage bargaining require firms to “opt-in” ratherthan “opt-out” of sectorial collective agreements, abolish automatic extension ofsectorial agreements and impose representation requirements for remainingsectorial collective agreements.
No action.
To improve the rental housing market and labour mobility, introduce a network oflocal arbitration bodies to handle landlord-tenant disputes, introduce periodicrolling leases and shift some funding from social housing to means tested housingbenefits.
The State Plan for promotion of housing renting, the building rehabilitation andregeneration and urban renewal 2013-16 contains an aid programme to promote apublic park to facilitate rental housing.

ANNEX. PROGRESS IN MAIN STRUCTURAL REFORMS
OECD ECONOMIC SURVEYS: SPAIN © OECD 2017 57
Recommendations in previous Surveys Actions taken
C. Boost the performance of the business sector
Promote diversified financing sources for firms, revamp the licence and permitssystem and reduce regulatory fragmentation by implementing the market unity law.
The implementation of the market unity law has continued.
Law 22/2014 revises the legal framework for risk capital to channel resources tocompanies in the first stages of development.
Law 5/2015 includes a series of measures to facilitate SMEs access to bankingcredit in the short term. It sets the ground for the development of alternativesources of financing, establishing regulation on crowd-funding, revising theregulatory framework of securitisations and facilitating access to capital marketsfor all types of companies.
Increase incentives for the use of out-of-court pre-insolvency procedures by SMEsand introduce a new out-of-court negotiated personal insolvency regime.
Law 25/2015 includes the so-called “fresh start” for individuals, as a secondopportunity mechanism. Law 17/2014 promotes the adoption of creditors’agreements after the debtor detects any early warning of insolvency risk.
Retain and review the research and development tax credit and co-operate withlarger research organisations to promote its use among younger firms.
A new regulation was adopted in June 2015 to simplify bureaucratic procedureswhen applying for R&D fiscal incentives.
As a part of the corporate income tax reform reform (1 January 2015), companiesallocating more than 10% of their turnover to R&D activities are allowed to furtherbenefit from the R&D+I tax credit for an additional amount of EUR 2 million.
Reduce the number of government agencies involved in providing financingsupport to firms.
No action.
Pursue efforts to diversify the financing mix. In the short-term, strengthen OfficialCredit Institute (ICO) intermediation facilities and mutual guarantee schemes.
Law 5/2015 aims to facilitate bank credit to SMEs and to foster alternatives to bankfinancing, such as financing platforms. It also introduced legal changes withregard to the counter-guarantee provided to mutual guarantee societies by CERSA,a public company.
ICO has continued to support SMEs by granting over EUR 30 billion in 2014and 2015 through second floor facilities. At the same time, ICO, through FONDICOGlobal, aimed to enhance capitalisation of Spanish entrepreneurs, SMEs andmidcaps through private funds, thus promoting the venture capital industry.
CDTI Innvierte Program has increased its venture capital activities together withprivate investors to support technology based and innovative firms, especially SMEs.
Establish a comprehensive credit registry for SMEs along the Banque de Francemodel, including information on payment performance, financial transactions andbalance sheet positions. Make that information available to all banks.
Law 5/2015 introduced the “SME credit information” report including the credithistory of the SME, a chronological list of defaults and bank’s internal scoring. Thisinformation is standardised by the Bank of Spain, The credit information isavailable on demand.
D. Product market reform
Further reduce the costs and procedures necessary to create businesses andeliminate sector-specific entry barriers, including for professional services as wellas rail and road transport.
The Market Unity Law intends to replace prior authorisation schemes andrequirements with less restrictive means of ex post control in order to simplifylicensing procedures.
A draft law, opening up professional services and clarifying the legal regime ofprofessional bodies, has been prepared.
Law 37/2015 on roads promotes competition in the service areas. Law 38/2015 onrailways transposed EU Directive 2012/34/EU, establishing a single Europeanrailway area.
Reduce the number of professions requiring membership of a professional bodyand the cost of membership.
No action.
E. Environmental sustainability
Equalise pricing of greenhouse gas emissions across sources to contain carbonemissions and thereby promote green industry and jobs.
No action has been taken to increase taxation per litre of diesel to equalise itscarbon price with that of gasoline.
Ensure predictable policy support to low-carbon technologies. In July 2014, new mechanisms to gradually eliminate the accumulated tariff deficitin the gas sector were put in place. It remains to be seen whether the government,will maintain its strong long- term commitment to balancing the costs andrevenues in the gas sector.
In 2014, the government approved a new regulatory framework for renewableenergy source regulating production of electricity from renewable energy sources,cogeneration and waste. In 2015, the legal framework for self-consumption ofelectricity was approved (Royal Decree 900/2015, of 9 October). The governmentalso approved in 2015 a new regulatory framework establishing targets forbiofuels until 2020 (Royal Decree 1085/2015, of 4 December).