oecd strategic education governance a perspective for scotland · oecd strategic education...
TRANSCRIPT
OECD Strategic Education
Governance
A perspective for Scotland
Claire Shewbridge
25 October 2017
Edinburgh
CERI overview
What CERI does
Generate forward-looking research analyses and syntheses
Identify and stimulate educational innovation
Promote international exchange of knowledge and experience
OECD CERI Strategic Education Governance
– Fed into the consultation document for proposed reform in
Scotland
• Empowering teachers, parents and communities to achieve:
Excellence and equity in education, pp 4-5
A few key findings from an OECD review of the Scottish school
system in 2015
Further insights from PISA 2015 results (released December 2016)
Some considerations for a successful reform
– The need to balance autonomy with a constructive accountability
mechanism
– Not an easy task! A challenge shared among OECD systems
– Promoting more strategic education governance
This presentation….
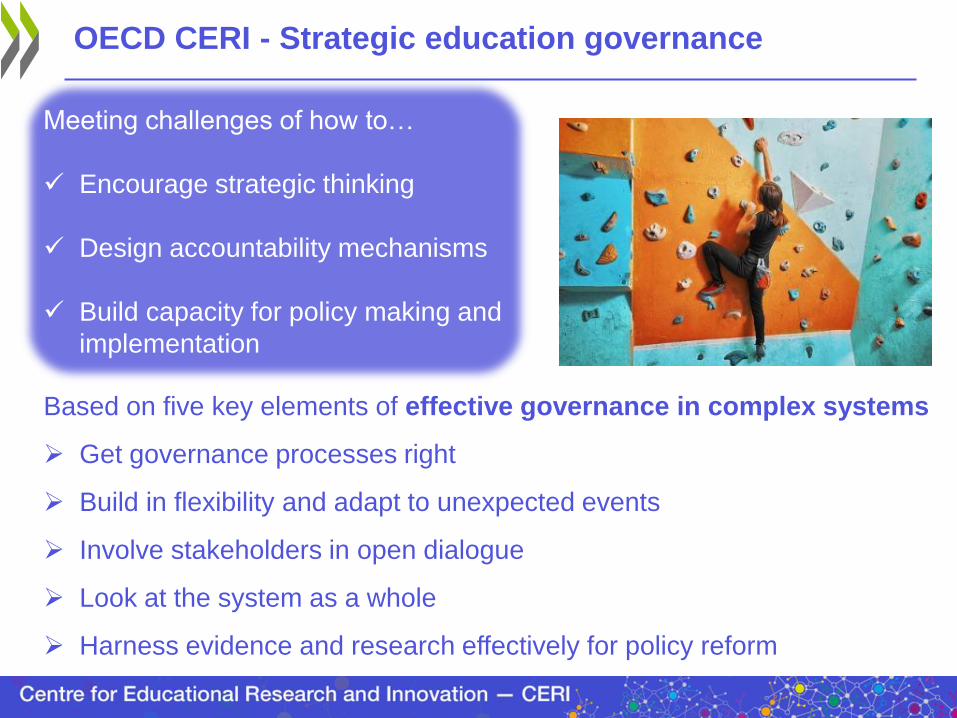
OECD CERI - Strategic education governance
Based on five key elements of effective governance in complex systems
Get governance processes right
Build in flexibility and adapt to unexpected events
Involve stakeholders in open dialogue
Look at the system as a whole
Harness evidence and research effectively for policy reform
Meeting challenges of how to…
Encourage strategic thinking
Design accountability mechanisms
Build capacity for policy making and
implementation

Mixed evidence on overall quality of
Scottish schooling
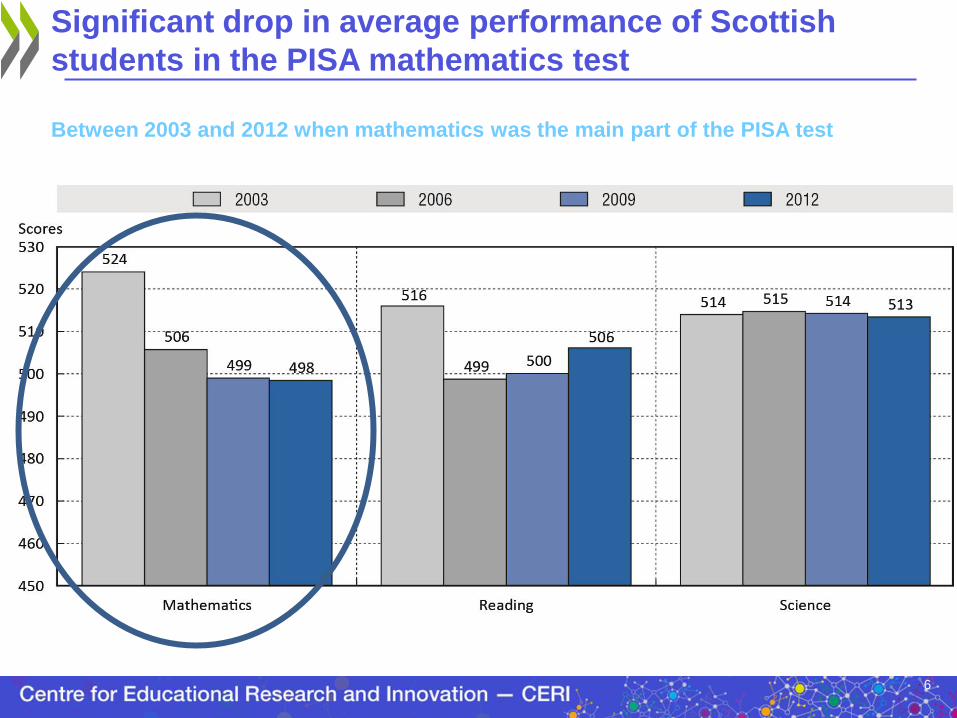
– Scottish students performing above
the OECD average in science and
reading and at the average in
mathematics (PISA 2012)
– But some declining achievement
levels on international data … and
also on Scottish data
– Positive attitudes reported by Scottish
teenagers (PISA 2012)
Positive points for equity
– Scottish schools are inclusive
– Migrant students do well
– But national data show persistent
gaps between students in least and
most deprived areas
OECD review in 2015
6
Significant drop in average performance of Scottish
students in the PISA mathematics test
Between 2003 and 2012 when mathematics was the main part of the PISA test
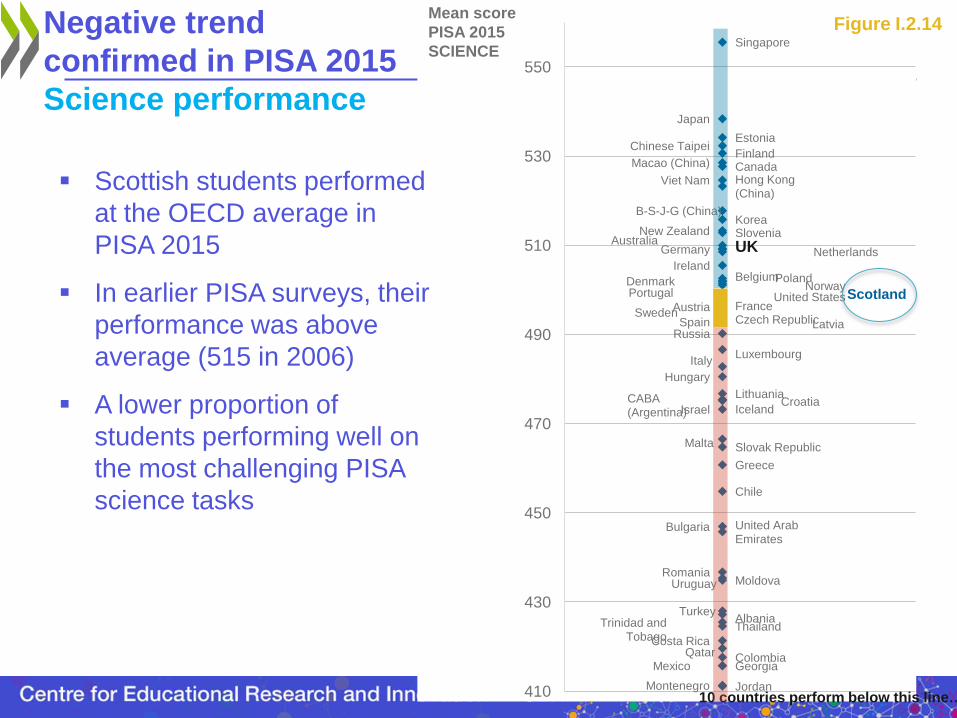
Negative trend
confirmed in PISA 2015
Science performance
Singapore
Japan
Estonia Chinese Taipei
Finland Macao (China) Canada
Viet Nam Hong Kong (China)
B-S-J-G (China) Korea
New Zealand Slovenia Australia UK Germany Netherlands
Ireland Belgium Denmark Poland
Portugal Norway
United States Austria France
Sweden Czech Republic Spain Latvia
Russia
Luxembourg Italy
Hungary
Lithuania Croatia CABA
(Argentina) Iceland Israel
Malta Slovak Republic
Greece
Chile
Bulgaria United Arab Emirates
Romania Uruguay Moldova
Albania Turkey
Trinidad and Tobago
Thailand
Costa Rica Qatar Colombia
Mexico Georgia
Montenegro Jordan 410
430
450
470
490
510
530
550
Mean score
PISA 2015
SCIENCE
10 countries perform below this line…
Figure I.2.14
Scotland
Scottish students performed
at the OECD average in
PISA 2015
In earlier PISA surveys, their
performance was above
average (515 in 2006)
A lower proportion of
students performing well on
the most challenging PISA
science tasks
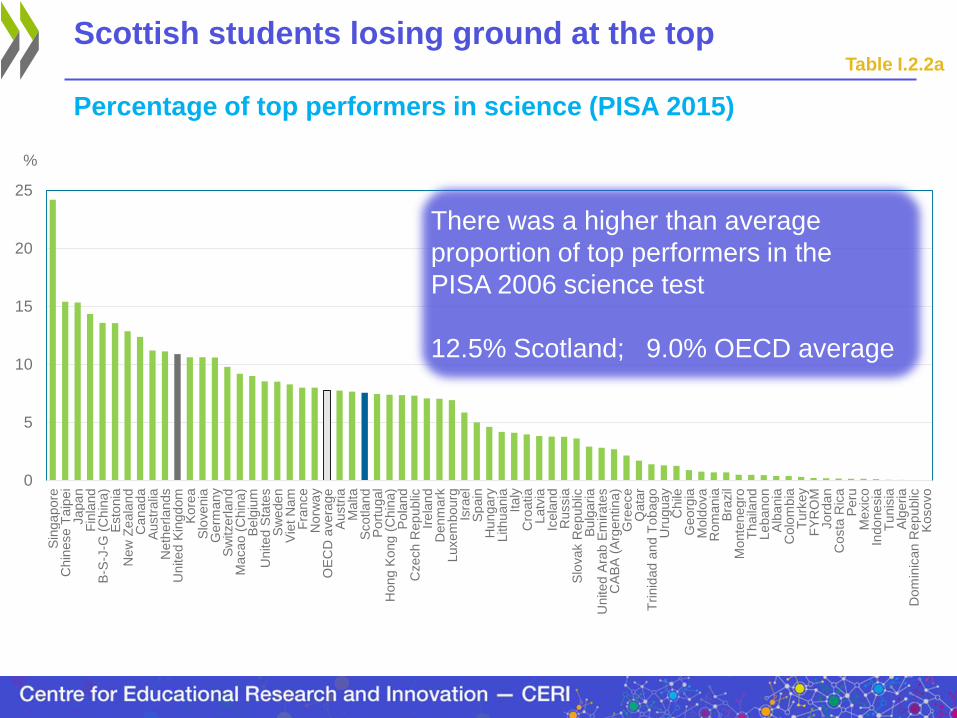
Scottish students losing ground at the top
Percentage of top performers in science (PISA 2015)
Table I.2.2a
0
5
10
15
20
25
Sin
gapore
C
hin
ese T
aip
ei
Japan
Fin
land
B
-S-J
-G (
Chin
a)
Esto
nia
N
ew
Zeala
nd
C
anada
Austr
alia
N
eth
erlands
United K
ingdom
K
ore
a
Slo
venia
G
erm
any
Sw
itzerlan
d
Macao (
Chin
a)
Belg
ium
U
nited S
tate
s
Sw
eden
Vie
t N
am
F
rance
Norw
ay
OE
CD
avera
ge
Austr
ia
Malta
Scotland
Port
ugal
Hong K
ong (
Chin
a)
Pola
nd
Czech R
epublic
Ir
ela
nd
D
enm
ark
Luxem
bourg
Is
rael
Spain
H
ungary
Lithuania
Italy
C
roatia
Latv
ia
Icela
nd
Russia
S
lovak R
epublic
B
ulg
aria
U
nited A
rab E
mirate
s
CA
BA
(A
rgentina)
Gre
ece
Q
ata
r T
rinid
ad a
nd T
obago
U
ruguay
Chile
G
eorg
ia
Mold
ova
Rom
ania
B
razil
Monte
negro
T
haila
nd
Lebanon
Alb
ania
C
olo
mbia
T
urk
ey
FY
RO
M
Jord
an
Costa
Ric
a
Peru
M
exic
o
Indonesia
T
unis
ia
Alg
eria
Dom
inic
an R
epublic
K
osovo
%
There was a higher than average
proportion of top performers in the
PISA 2006 science test
12.5% Scotland; 9.0% OECD average

Percentage of lowest performers in science (PISA 2015)
Table I.2.2a
0
10
20
30
40
50
60
70
80
90
Vie
t N
am
M
acao (
Chin
a)
Esto
nia
H
ong K
ong (
Chin
a)
Sin
gapore
Japan
Canada
Fin
land
C
hin
ese T
aip
ei
Kore
a
Slo
venia
Ir
ela
nd
D
enm
ark
B
-S-J
-G (
Chin
a)
Pola
nd
Germ
any
Latv
ia
Port
ugal
United K
ingdom
N
ew
Zeala
nd
A
ustr
alia
R
ussia
S
pain
S
witzerlan
d
Neth
erlands
Norw
ay
Scotland
B
elg
ium
U
nited S
tate
s
Czech R
epublic
A
ustr
ia
OE
CD
avera
ge
S
weden
Fra
nce
C
AB
A (
Arg
entina)
Italy
C
roatia
Lithuania
Ic
ela
nd
Luxem
bourg
H
ungary
S
lovak R
epublic
Is
rael
Malta
Gre
ece
C
hile
B
ulg
aria
Rom
ania
U
ruguay
Alb
ania
U
nited A
rab E
mirate
s
Mold
ova
Turk
ey
Trinid
ad a
nd T
obago
C
osta
Ric
a
Thaila
nd
M
exic
o
Colo
mbia
Jord
an
Q
ata
r G
eorg
ia
Monte
negro
In
donesia
B
razil
Peru
Lebanon
F
YR
OM
T
unis
ia
Kosovo
A
lgeria
Dom
inic
an R
epublic
%
Lowest performers in PISA 2006 science test
19.3% OECD average
14.6% Scotland
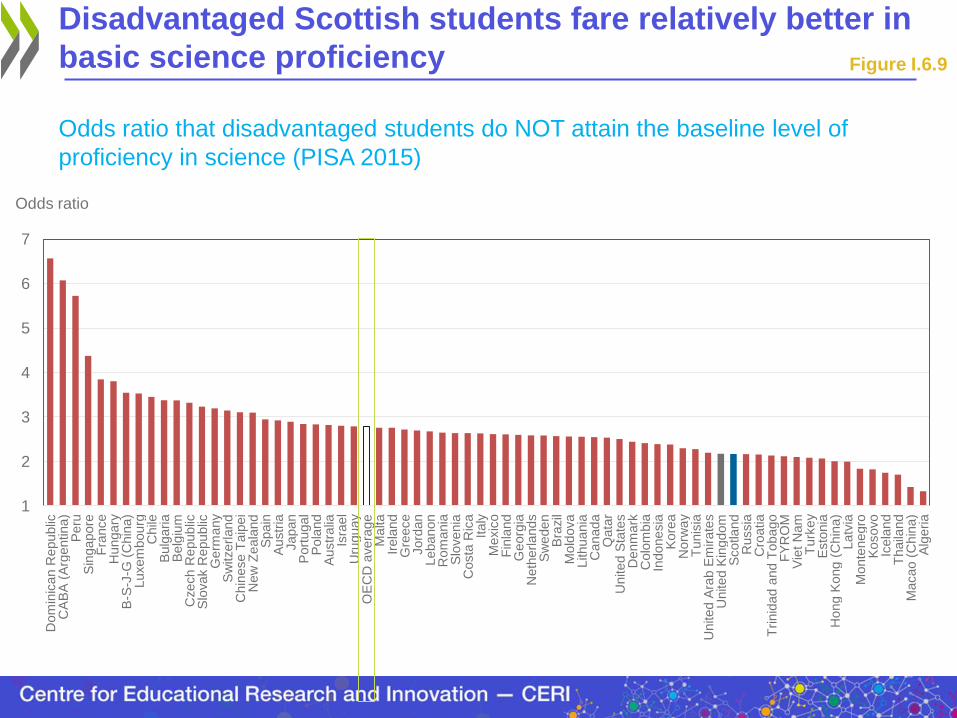
Disadvantaged Scottish students fare relatively better in
basic science proficiency
Odds ratio that disadvantaged students do NOT attain the baseline level of
proficiency in science (PISA 2015)
Figure I.6.9
1
2
3
4
5
6
7
Dom
inic
an R
epublic
C
AB
A (
Arg
entina)
Peru
S
ingapore
F
rance
H
ungary
B
-S-J
-G (
Chin
a)
Luxem
bourg
C
hile
B
ulg
aria
Belg
ium
C
zech R
epublic
S
lovak R
epublic
G
erm
any
Sw
itzerlan
d
Chin
ese T
aip
ei
New
Zeala
nd
S
pain
A
ustr
ia
Japan
P
ort
ugal
Pola
nd
A
ustr
alia
Is
rael
Uru
guay
OE
CD
avera
ge
M
alta
Irela
nd
G
reece
Jord
an
Lebanon
Rom
ania
S
lovenia
C
osta
Ric
a
Italy
M
exic
o
Fin
land
G
eorg
ia
Neth
erlands
Sw
eden
Bra
zil
Mold
ova
Lithuania
C
anada
Qata
r U
nited S
tate
s
Denm
ark
C
olo
mbia
In
donesia
K
ore
a
Norw
ay
Tunis
ia
United A
rab E
mirate
s
United K
ingdom
S
cotland
Russia
C
roatia
T
rinid
ad a
nd T
obago
F
YR
OM
V
iet
Nam
T
urk
ey
Esto
nia
H
ong K
ong (
Chin
a)
Latv
ia
Monte
negro
K
osovo
Icela
nd
Thaila
nd
Macao (
Ch
ina)
Alg
eria
Odds ratio
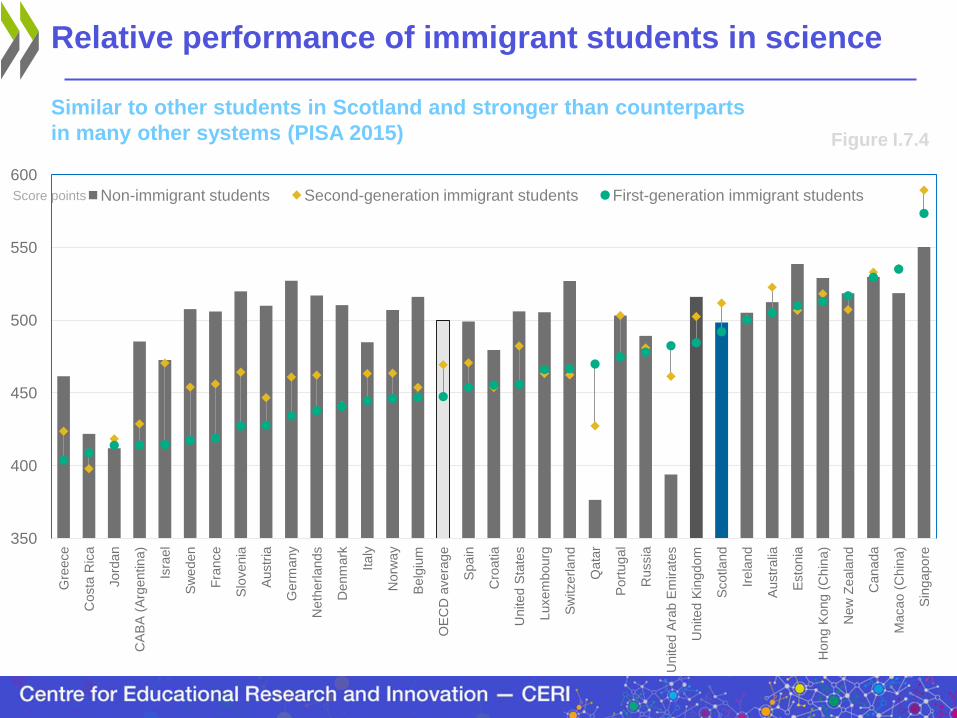
Relative performance of immigrant students in science
Similar to other students in Scotland and stronger than counterparts
in many other systems (PISA 2015) Figure I.7.4
350
400
450
500
550
600
Gre
ece
Costa
Ric
a
Jord
an
CA
BA
(A
rgentina)
Isra
el
Sw
eden
Fra
nce
Slo
venia
Austr
ia
Germ
any
Neth
erlands
Denm
ark
Italy
Norw
ay
Belg
ium
OE
CD
avera
ge
Spain
Cro
atia
United S
tate
s
Luxem
bourg
Sw
itzerlan
d
Qata
r
Port
ugal
Russia
United A
rab E
mirate
s
United K
ingdom
Scotland
Irela
nd
Austr
alia
Esto
nia
Hong K
ong (
Chin
a)
New
Zeala
nd
Canada
Macao (
Chin
a)
Sin
gapore
Score points Non-immigrant students Second-generation immigrant students First-generation immigrant students
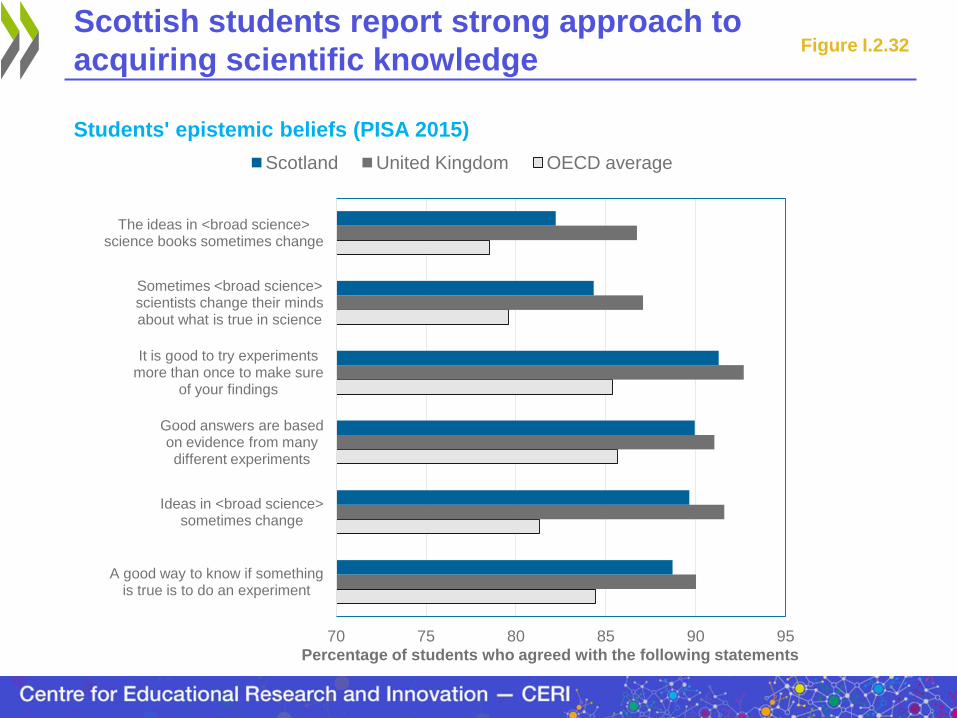
Scottish students report strong approach to
acquiring scientific knowledge
Students' epistemic beliefs (PISA 2015)
70 75 80 85 90 95
A good way to know if something is true is to do an experiment
Ideas in <broad science> sometimes change
Good answers are based on evidence from many different experiments
It is good to try experiments more than once to make sure
of your findings
Sometimes <broad science> scientists change their minds about what is true in science
The ideas in <broad science> science books sometimes change
Percentage of students who agreed with the following statements
Scotland United Kingdom OECD average
Figure I.2.32
PISA survey cycles have allowed insight to the greater number of
actors involved in decision making
– Well established trend to greater responsibility at the school level
– But starting to reverse between 2009 and 2015
• Fewer principals reported having considerable responsibility
over budget, hiring teachers or courses offered at school
PISA 2015 highlighted the interplay between autonomy and
accountability
– Science performance better when principals report greater
autonomy over resources, curriculum and other school policies
– But especially in countries where
• achievement data are tracked over time or posted publicly
• principals report higher levels of educational leadership
OECD Governance in Complex Education Systems case studies
revealed challenges in striking this balance in all systems
Complex systems: many actors involved and the need
for a constructive accountability system
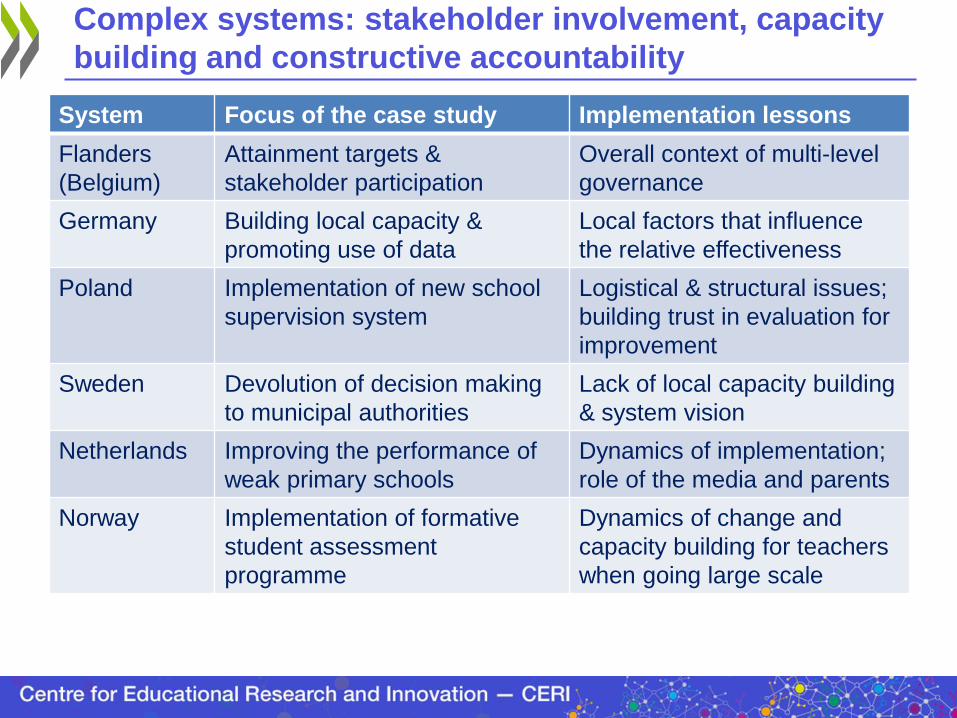
System Focus of the case study Implementation lessons
Flanders
(Belgium)
Attainment targets &
stakeholder participation
Overall context of multi-level
governance
Germany Building local capacity &
promoting use of data
Local factors that influence
the relative effectiveness
Poland Implementation of new school
supervision system
Logistical & structural issues;
building trust in evaluation for
improvement
Sweden Devolution of decision making
to municipal authorities
Lack of local capacity building
& system vision
Netherlands Improving the performance of
weak primary schools
Dynamics of implementation;
role of the media and parents
Norway Implementation of formative
student assessment
programme
Dynamics of change and
capacity building for teachers
when going large scale
Complex systems: stakeholder involvement, capacity
building and constructive accountability
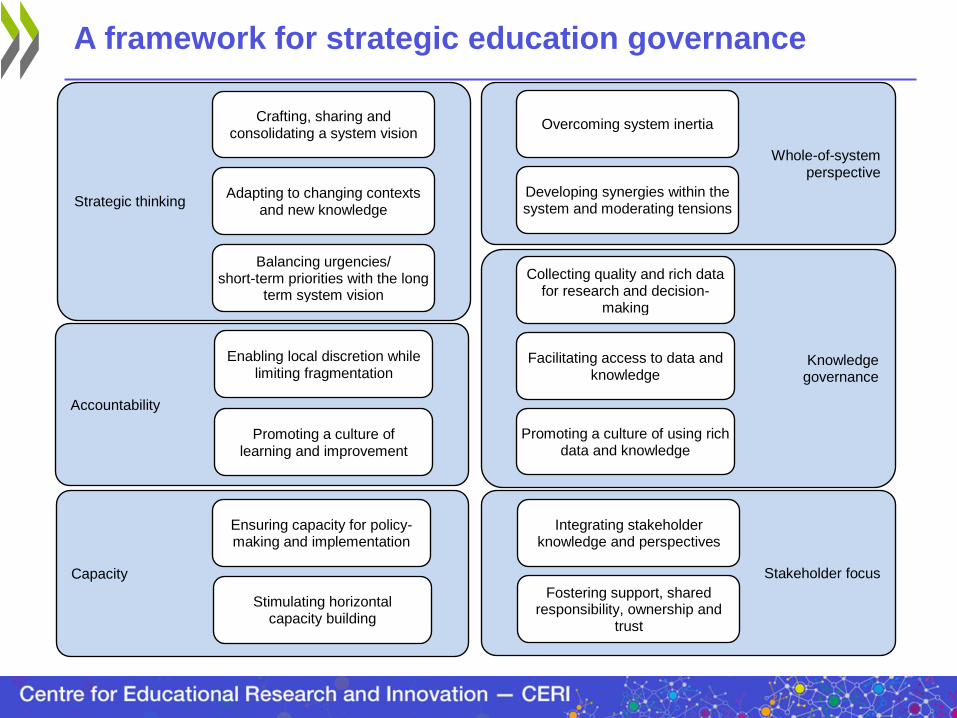
A framework for strategic education governance
Stakeholder focus
Whole-of-system perspective
Strategic thinking
Capacity
Accountability
Enabling local discretion while limiting fragmentation
Promoting a culture of learning and improvement
Ensuring capacity for policy-making and implementation
Stimulating horizontal capacity building
Crafting, sharing and consolidating a system vision
Adapting to changing contexts and new knowledge
Balancing urgencies/ short-term priorities with the long
term system vision
Developing synergies within the system and moderating tensions
Overcoming system inertia
Integrating stakeholder knowledge and perspectives
Fostering support, shared responsibility, ownership and
trust
Knowledge governance
Collecting quality and rich data for research and decision-
making
Facilitating access to data and knowledge
Promoting a culture of using rich data and knowledge
Thank you!
www.oecd.org/edu/ceri/strategic-education-governance