oeconomia - repository.mruni.eu
TRANSCRIPT

OeconomiA
copernicana
Volume 10 Issue 2 June 2019
p-ISSN 2083-1277, e-ISSN 2353-1827 www.oeconomia.pl
ORIGINAL ARTICLE Citation: Mačerinskienė, I., & Survilaitė, S. (2019). Company’s intellectual capital impact on market value of Baltic countries listed enterprises. Oeconomia Copernicana, 10(2), 309–339. doi: 10.24136/oc.2019.016 Contact to corresponding author: [email protected]; Vilnius University, Faculty of Economics & Business Administration, Saulėtekio ave. 9, LT-10222, Vilnius, Lithuania Received: 3.10.2018; Revised: 4.02.2019; Accepted: 11.03.2019; Published online: 2.04.2019 Irena Mačerinskienė Mykolas Romeris University, Lithuania orcid.org/0000-0002-8266-6775 Simona Survilaitė Vilnius University, Lithuania orcid.org/0000-0001-7613-3932 Company’s intellectual capital impact on market value of Baltic countries listed enterprises JEL Classification: A10; G32; O34; J24 Keywords: intellectual capital; human capital; structural capital; juridical capital; relational capital; market value Abstract Research background: Currently the topic of a company’s intellectual capital is being widely investigated by various researchers. Nevertheless, only a small number of studies on the compa-ny’s intellectual capital impact on its market value were conducted. What is more, the concept of a company’s intellectual capital itself is not unified. There are some discrepancies in defining a company’s intellectual capital, unifying structural model of the company’s intellectual capital, and harmonizing the research methods and models of how to evaluate a company’s intellectual capital. Purpose of the article: The aim of the article is to examine various scientific approaches of the company’s intellectual capital and its impact on the market value of a respective company; to prepare a model of company’s intellectual capital and its impact on the market value. What is more, the aim of this article is to check and test the model effectiveness using an example of the Baltic States listed companies. Methods: Data on 58 Baltic States’ companies that are listed in Nasdaq Baltic stock exchange were taken as the basis of the research. Based on four component model (human capital, structural capital, juridical capital, relational capital) a set of indicators for assessing company’s intellectual

Oeconomia Copernicana, 10(2), 309–339
310
capital was formed. Expert evaluation was used in order to assign weights for different structural parts of intellectual capital. An exploratory factor analysis was conducted in order to find out what factors are the most significant for a company’s intellectual capital. In order to find out how specific elements affect company’s intellectual capital, a pair-wise multiple correlation and re-gression analysis were used. An average comparison method was used to reveal differences between companies of different countries. Findings & Value added: The study contributes to the Baltic States’ knowledge on intellectual capital. It was detected that it is appropriate to use human capital, structural capital, juridical capital, and relational capital structural parts as components of company’s intellectual capital while investigating its impact on market value of a respective company. According to the ob-tained results, the model of a company’s intellectual capital and its impact on the market value was created, optimized, and its validity checked using exploratory factor analysis. The model was used to test the Baltic States listed companies and how their intellectual capital affects the market value. It was identified that intellectual capital in the listed companies of the Baltic States has a positive impact on their market value. Nevertheless, the study revealed that intellectual capital structural parts do not equally affect the market value of listed companies. The findings support the conclusion that human capital and relational capital have the greatest influence on the market value of listed companies. Companies where structural capital comprises the largest proportion of intellectual capital had lower levels of intellectual capital aggregated index, which could be exam-ined in future studies.
Introduction Nowadays companies face a huge variety of challenges affecting their mar-ket value. Previously scientists and researchers constantly stressed the im-portance of tangible assets. This approach has slightly changed leading to the intellectual capital of a company being the most significant factor. Some studies show a huge importance for innovations, new ideas, which are generated by human capital which is considered to be a structural part of an intellectual capital. Modern economy is characterized by increasing importance of knowledge related to the quality of human capital and knowledge embedded in the products (Balcerzak, 2016, pp. 11–27). Intel-lectual capital is investigated by various specialists from different areas: heads of companies, scientists, researchers, international institutions, politi-cians, accountants, economists, and etc. Nevertheless, it is difficult to eval-uate the intellectual capital of a company. Only several elements of the intellectual capital are provided in the financial statements of various com-panies, which is not sufficient to determine the aggregate value of the intel-lectual capital of a company. What is more, the concept of the intellectual capital of a company is still under the investigation itself and researchers do not have one common position. There is no common universally used defi-nition of the intellectual capital of a company, no common structure of the intellectual capital, and there are numerous methods to assess the intellec-tual capital of a company. Nevertheless, the importance of intellectual capi-tal is indisputable. In the modern world, intellectual capital has become one

Oeconomia Copernicana, 10(2), 309–339
311
of the most valuable assets of an organization, region or state (Markhaichuk & Zhuckovskaya, 2019, p. 90). This article is designed in order to align the discrepancies faced in the scientific literature and to solve the research problem described below.
The research problem of this article is how to assess the intellectual cap-ital of a respective company and what effect it has on the market value. The purpose of the article is as follows: to examine various scientific approach-es of the intellectual capital of a respective company and to assess its im-pact on the market value; to prepare a model of company’s intellectual capital and its impact on the market value. What is more, the aim of this article is to check and test the effectiveness of the abovementioned model using an example of the Baltic States listed companies. The object of the research is the impact of a respective company’s intellectual capital on its market value.
The composition of the article is organised as follows. Firstly, the con-cept of a company’s intellectual capital and its market value is presented in the theoretical part. The main features of the company’s intellectual capital are discussed, the development stages of the intellectual capital concept are also presented and discussed. The analysis showed that although research papers regarding intellectual capital are constantly conducted, no common intellectual capital concept is being provided yet. Different researchers provide multiple intellectual capital definitions, features, structural parts. In this article a unified company’s intellectual capital definition is proposed. Secondly, the next part of the article explains the methodology and data collection. In order to identify intellectual capital’s impact on a company’s market value an inductive approach was selected and is described in the research part. The formation of the model of intellectual capital evaluation is presented and discussed. Finally, the last two parts present and discuss empirical results, provides discussion points, main conclusions, and suggest opportunities for potential future studies. The theoretical aspects of company’s intellectual capital and its market value To begin with, the theory of the intellectual capital of a company starts in 1969, when American–Canadian economist John Kenneth Galbraith men-tioned the notion of intellectual capital itself. Although the topic has been investigated by a lot of scientists and researchers, there is still no common and widely used definition of it. Also, no mutual agreement is reached re-garding the structure of intellectual capital. In order to understand the con-

Oeconomia Copernicana, 10(2), 309–339
312
cept better and indicate the main features of it, the scientific literature re-view was conducted. During the investigation, it was identified that the development of the intellectual capital concept can be divided into four main stages (Figure 1).
The development stages shown in the picture above (Figure 1) represent the intellectual capital concept phases, which were divided into four main stages based on the scientific literature review. These stages could poten-tially be compared with Tuckman’s group/team formation theory stages as the development of both is quite similar. Firstly, the initial stage of the con-cept of intellectual capital should be considered as a forming period. It is understood as an opening, elemental period when only the notion of the intellectual capital is present. According to Cooper and Sherer (1984, pp. 998–1020), intellectual capital at that time was understood as an invisible concept, but with clearly visible benefits. During the forming period, only the rudiments of the intellectual capital concept were noticed and a low number of scientific papers were released with the keyword “intellectual capital”. The second stage of the intellectual capital concept development should be considered as a storming phase when there was a boost of intel-lectual capital scientific research. The majority of scientists (Roos & Roos, 1997, pp. 413–426; Stewart, 1997, p. 265; Edvinsson & Malone, 1997, p. 217; Sullivan, 1998, p. 384; Bontis, 1998, pp. 63–76; Nahapiet & Ghoshal, 1998, pp. 242–266) investigated intellectual capital, how to define it, what its main features and structural parts are. Nevertheless, it was noticed that during this stage between scientists and researchers there were a lot of dis-crepancies regarding the definition of intellectual capital, its main features and functions. The opinions of different researchers of intellectual capital were not harmonised and aligned together.
The third stage of the intellectual capital concept development could be considered as a norming phase, when the majority of scientists and re-searchers (Shatrevich et al., 2015, pp. 76–94; Yli-Renko et al., 2001, pp. 279–304; Serenko & Bontis, 2004, pp. 185–198; Shapiro, 2006, pp. 324–335; Cabrita & Bontis, 2008, pp. 212–237; F-Jardón & Martos, 2009, pp. 600–616; Yang & Lin, 2009, pp. 1965–1984) had a common goal — to understand how the intellectual capital should be measured and evaluated. Although the majority of researchers shared the same goal, they used dif-ferent definitions of intellectual capital, accentuated various features of intellectual capital and investigated intellectual capital using distinct struc-tural parts. During this period, many authors (Chesbrough, 2003, p. 227; Youndt et al., 2004, pp. 335–361; Subramaniam & Youndt, 2005, pp. 450–463; Gray, 2006, pp. 793–819; Menor et al., 2007, pp. 559–578; Wu et al., 2007, pp. 279–296; Hsu & Fang, 2009, pp. 664–677; Yang & Lin, 2009,

Oeconomia Copernicana, 10(2), 309–339
313
pp. 1965–1984) analysed intellectual capital and company performance by choosing different factors or indexes and investigating intellectual capital’s impact on respective variables in various companies. Nevertheless, no common theory was identified and intellectual capital definition, features, function, structural parts were still under discussion.
The fourth stage, which can be considered as a performing phase, is still ongoing. Scientists and researchers investigate intellectual capital from a broader perspective: not only stronger social, economic, environmental systems in various companies and organizations, but also in multiple coun-tries, cities, and communities. A majority of studies (Carmona-Lavado et al., 2010, pp. 681–690; Namvar et al., 2010, pp. 676–697; Sharabati et al., 2010, pp. 105–131; Cabello-Medina et al., 2011, pp. 807–828; Delgado-Verde et al., 2011, pp. 722–737; Huizingh, 2011, pp. 2–9; Leitner, 2011, pp. 1–18; Hsu & Sabherwal, 2012, pp. 664–677; Dumay, 2013, pp. 5–9; Edvinsson, 2013, pp. 163–172; Wang & Chen, 2013, pp. 861–879; Dameri & Ricciardi, 2015, p. 860–887; Inkinen, 2015, pp. 518–565) revealed that intellectual capital is the key factor of a successful company and it increas-es the company’s value, market value, sustainability, by raising the compet-itiveness of an individual company. Some researchers (Schaffers et al., 2011, pp. 431–446; Chourabi et al., 2012, pp. 2289–2297; Ricciardi & Za, 2014, pp. 163–171; Dameri & Ricciardi, 2015, pp. 860–887) concentrate not only on companies, they accentuate the importance of knowledge, in-novations and provide the vision of a smart city, where all aspects men-tioned before are considered as a priority. What is more, new topics of in-tellectual capital research are currently investigated, for instance, intellec-tual capital protection issues (Olander et al., 2015, pp. 742–762). The ques-tion each company faces is how to maintain an employee who has excep-tional knowledge, skills, experience, is highly motivated, creative, innova-tive, knows working procedures very well, and is capable of solving issues independently and quickly.
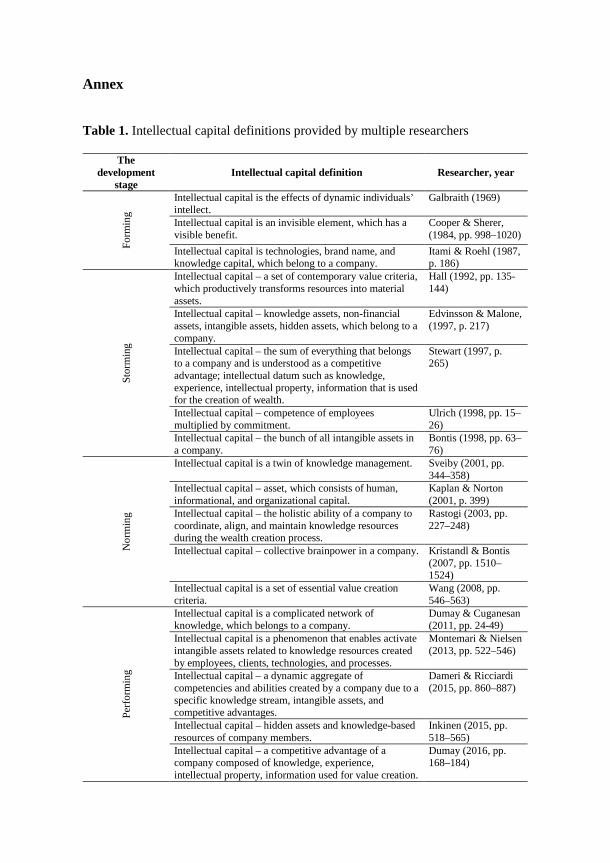
Although studies regarding intellectual capital are constantly conducted, no common intellectual capital concept has been provided yet. Different researchers propose multiple intellectual capital definitions, features, struc-tural parts. The table below presents various intellectual capital definitions provided by multiple researchers (Table 1).
Table 1 is designed according to the development stages of intellectual capital concept. It was noticed that intellectual capital definitions provided by multiple researchers are not equally understood and there is no harmo-nised and widely recognised definition of intellectual capital. Different sources agree that the initial stage of the intellectual capital concept itself is 1969, when famous the United States and Canada economist John Kenneth

Oeconomia Copernicana, 10(2), 309–339
314
Galbraith wrote a letter to his friend Michael Kalecki stating: “I wonder if you realize how much those of us in the world around have owed to the intellectual capital you have provided over these past decades.” The phrase was quickly taken into account and spread all over the world. Nevertheless, not all researchers explain the concept of intellectual capital in the same way. Some researchers accentuate the knowledge, experience, education, which belongs to a respective company. Others highlight the intangible and hidden value in a company, which creates a competitive advantage. There are opinions that intellectual capital is all intangible elements that belong to a respective company and increases its value. Also, intellectual capital is understood as a rare and unique resource, which is both dynamic and irre-placeable for the successful activity of a company. In this scientific paper a definition of a company’s intellectual capital was proposed based on the most used features and descriptions provided by various researchers from different stages of intellectual capital concept.
Company’s intellectual capital — the aggregate of intangible resources a company has at its disposal that enables a company to operate at its best, creates a competitive advantage and increases market value.
There are many ways to describe intellectual capital, but the abovemen-tioned definition provides a broader understanding of what intellectual capital is in a company and what its major advantages are.
It is helpful to clarify the structure of the intellectual capital of a compa-ny in order to represent the definition better. Nevertheless, there is a vast number of structural parts of the intellectual capital of a company and the majority of them overlap. The most frequently used model of the intellectu-al capital structure is the combination of human capital, structural capital, and customer capital (Roos & Roos, 1997, pp. 413–426; Stewart, 1997, p. 265; Bontis, 1998, pp. 63–76; Zéghal & Maaloul, 2010, pp. 39–60). Based on the review of the scientific literature, human capital by now is the only structural part, which is considered by all researchers in their investiga-tions. The only exception is human-centered assets, provided by a re-searcher Brooking (1996, p. 224), but the content of this structural part of intellectual capital clearly refers to human capital. Other structural parts of intellectual capital are widely used, but a lot of discrepancies, overlaps, synonyms are present. Structural capital is used by various researchers versus organisational capital, innovation capital, process capital, physical capital, infrastructure assets, internal structure, research and development, informational technologies, collective values, and etc. Juridical capital is used in different researches as intellectual property, market assets, intellec-tual property assets, market capital, innovations, technologies, and etc. What is more, relational capital in various researches is used as reputa-

Oeconomia Copernicana, 10(2), 309–339
315
tional capital, client capital, customer capital, social capital, external structure, communicational capital, trademark value, and etc. The review conducted on scientific literature revealed that some of the abovementioned intellectual capital structural parts are used in different scientific papers as synonyms, some overlap, while some of them signify totally different ap-proaches. In this scientific paper, the intellectual capital of a company is considered as the sum of four structural parts: human capital, structural capital, juridical capital, and relational capital. The structure of the intel-lectual capital of a company is provided in the picture below (Figure 2).
Figure 2 represents the intellectual capital structure proposed to use in this scientific paper. The structure was adopted in accordance with Stewart (1997, pp. 265) by adding an extra structural part, which is significantly important for a company — juridical capital. Intellectual capital of a re-spective company is understood as a whole and the competitive advantage and value are created only when all structural parts are fluently working together. First of all, human capital can be understood as an employee knowledge, skills, wisdom, competence, motivation, experience, psycho-logical health, and similar elements that help to perform daily tasks and achieve targets of a company. The elements of human capital can be grouped into three main sections: employees, their education, and invest-ments in employees. Secondly, structural capital in this scientific paper is perceived as all elements in a company, which help employees to perform routine tasks in business, the supporting infrastructure that enables human capital — employees — to operate (i.e.: strategy, culture, procedures, fi-nancial resource allocation decisions, and etc.). It is useful to group struc-tural capital elements into three parts as well: corporate identity, financial leverage, and Selling, General & Administrative costs (SG&A), which are not related to the direct production of a respective company. Corporate identity examples are as follows: a company’s strategy, vision and mission, management style, routines, culture, procedures, codes of conduct, and etc. Thirdly, juridical capital comprises the elements in a company that protect the laws and regulations and create a competitive advantage. All elements of juridical capital are grouped into two basic parts: intangible assets and legally protected information. Finally, relational capital is a customer rela-tionship strength and loyalty of clients or institutions to which the company sells the product or service, the value of relationships, the value of a com-pany, which is seen by stakeholders, and similar. The elements of relational capital can be classified into three main parts: the social characteristics of a company, relations, and relational expenses.
The importance of intellectual capital is indisputable, but it is extremely useful to clarify how a company’s intellectual capital is connected to its

Oeconomia Copernicana, 10(2), 309–339
316
market value. The management board is willing to increase the market val-ue of their companies in order to foster the successful activity, continuity, and infuse additional funds and resources. The latter factors are the most important for joint-stock companies, which are willing to increase their companies’ market value, which can be easily calculated based on the mar-ket capitalization. There are some researchers (Abdolmohammadi, 2005, pp. 397–416; Chen et al., 2005, pp. 159–176; Tseng & Goo, 2005, pp. 187–201; Liu et al., 2009, pp. 260–276; Clarke et al., 2010, pp. 505–530; Ferra-ro & Veltri, 2011, pp. 66–84; Celenza & Rossi, 2014, pp. 22–34; Shakina & Molodchik, 2014, pp. 87–100) who investigate the company’s intellectu-al capital impact on its market value. Their analysis showed a strong statis-tically significant correlation between a company’s intellectual capital and its market value. To be more precise, the company’s market value in this scientific paper is considered as a multiplication of a number of company’s shares in circulation and market price of a single share. It was noticed that a company’s market value might be influenced by many factors, for in-stance: external economic, social, and political factors; market factors; em-ployees of a respective company; intangible assets of a respective compa-ny; financial factors, and etc. One of the factors, namely, the company’s intellectual capital was selected to investigate further.
To sum up, company’s intellectual capital in this scientific paper is de-scribed as the aggregate of intangible resources a company has at its dis-posal that enables a company to operate at its best, creates a competitive advantage, and increases market value. Intellectual capital structure in this scientific paper is proposed as follows: human capital, structural capital, juridical capital, and relational capital. The main goal of this scientific pa-per is to identify the company’s intellectual capital impact on its market value. In the next paragraph, the methodological approach is presented.
Research methodology In order to identify the impact of a company’s intellectual capital on its market value, an inductive approach was selected. At this step, the compa-ny’s intellectual capital indicators are selected and subsequently, the model of intellectual capital evaluation is formed. The next step is a formulation of hypothesis and the last step is to describe regression models (Figure 3).
In order to create an adequate system for the company's intellectual cap-ital evaluation model, only the most informative and important indicators are chosen. Although every company is very different, the goal was to cre-ate such a model, which is comparable and could have been repeated in

Oeconomia Copernicana, 10(2), 309–339
317
various geographic areas or for different types of businesses. What is more, data availability and comparability over time have been taken into consid-eration.
For the empirical test of a model of a company’s intellectual capital and its impact on the market value, Baltic listed companies (Estonia, Latvia, and Lithuania) have been selected. The data was collected from their finan-cial statements, consolidated annual reports, independent auditor’s findings, websites and social networks if needed. All of the three countries’ compa-nies prepare their financial documentation in accordance with International Financial Reporting Standards (IFRS) as adopted by the European Union. The data is audited, reliable, and public. Such data enables econometrically correct assessments. A five-year period from 2011 to 2015 was chosen. In total, a total population of Nasdaq Baltic stock exchange consisting of 58 companies was included in the research (Estonia — 13, Latvia — 24, Lith-uania — 21).
In this scientific paper, a company’s intellectual capital is calculated as an aggregate of four structural parts — human capital, structural capital, juridical capital, and relational capital. Factor values were calculated using the regression method. Data standardization was automatically performed, due to this, variables with a large standard deviation are no longer dominant and do not distort the results. Also, the standardization allows for compari-sons between different measurement scales of data with each other. Data standardization is done by subtracting the average of the time series and dividing by the variance, so a standardized data average is 0 and variance is 1. For the calculation of aggregate values of intellectual capital factors a simple additive weighting method SAW was chosen.
The hardest part is the correct identification of the indicators’ weights. Usually, different fields put an importance on different intellectual capital structural parts. For example, management focuses more on human capital, whereas economists stress the balance of all elements of intellectual capital. Therefore, it is rather difficult to appropriately determine their weights. Researchers (Kannan & Aulbur, 2004, pp. 389–414; Cabrita & Bontis, 2008, pp. 212–237; Kim & Kumar, 2009, pp. 277–293; Cricelli & Greco, 2013, pp. 1–7; Montemari & Nielsen, 2013, pp. 522–546; Morariu, 2014, pp. 392–410; Cricelli et al., 2014, pp. 880–901; Mačerinskienė & Ale-knavičiūtė, 2017, pp. 573–592) often use an expert judgement for the set-ting the weights of company’s intellectual capital structural parts. Giving equal weights would not be scientifically correct since different structural parts of intellectual capital do not have the same significance. In this scien-tific paper, an expert evaluation was conducted in order to determine the weights of the company’s intellectual capital structural parts.

Oeconomia Copernicana, 10(2), 309–339
318
The expert evaluation was conducted on November–December 2016. In total, 17 experts from all three Baltic countries and Nasdaq Baltic stock exchange participated in the research. Five experts were from Lithuania: two managers from Lithuanian listed companies and three social science academics from Mykolas Romeris University, Vilnius University, and Vil-nius Gediminas Technical University. Five experts were from Latvia: two managers from Latvian listed companies and three social science academics from Riga technical university. Four experts were from Estonia: two man-agers from Estonian listed companies and two social science academics from Tallinn technical university. Three experts were employees of Nasdaq Baltic stock exchange. All experts from the academic field have doctoral degrees of social science, all experts from listed companies and Nasdaq Baltic stock exchange have master degree. The expert evaluation results were also checked using competency coefficients formulas and the validity of the test was checked using Kendall’s W coefficient, which was 0,797. The results are provided in the diagram below (Table 2).
The results revealed that the highest weight was given to human capital and the lowest to juridical capital. Relational capital was on the second and structural capital on the third place according to the importance. Most sci-entists in their studies also get similar results, showing that human capital is very important.
The construct validity is checked using exploratory factor analysis. The exploratory factor analysis it is important to draw attention to the problem of multicollinearity. As a result, indicators correlation coefficients are checked and if the latter is higher than 0,8, it is assessed whether it is ap-propriate to remove any indicator. Verifying the indicators (variables) suit-able for factor analysis is conducted using anti-image matrixes consisting of partial correlation coefficients with a minus sign. The diagonal matrix has the variable eligibility factors MSA (Measure of Sampling Adequacy) and KMO (Kaiser, Meyer and Olkin) measure is used for decision if varia-bles should be removed from the construct. If KMO is less than 0,5, the respective factor is unacceptable.
The assumption in factor analysis is taken that variation of variables can be explained by the distinguishing factor because the calculations do not include a margin of error. It calculates the covariance matrix of the eigen-values and own vectors. Factor number is selected according to the Scree chart and calculated eigenvalues. According to the Kaiser recommendation, the number of properly calculated number of factors is determined by the eigenvalues, which are greater than one. If the results show that the indica-tors selected represent one construct, it means that the indicators are properly selected and reflect one area of interest. If the results show that the
Oeconomia Copernicana, 10(2), 309–339
319
indicators represent several different constructs, the obtained factors are determined by the map. Ongoing factors rotation is conducted in order to highlight the template of factors. In this research, it was chosen as an oblique factor rotation method Promax.
Based on the factor analysis results, an aggregate model of the compa-ny’s intellectual capital was suggested (Figure 4).
The abovementioned model is used not only for evaluation of a compa-ny’s intellectual capital itself but also for the determination about the com-pany’s intellectual capital and its impact on the market value. In order to check, if there is a statistically significant relationship between a compa-ny’s intellectual capital and its market value, the following steps were tak-en: 1) formulation of two hypotheses:
H0: correlation coefficient of zero (r = 0). H1: the correlation coefficient is different from zero (r ≠ 0).
2) the determination coefficient R2 is assessed. This ratio shows what part
of the dependent variable is explained by regressors. The determination coefficient varies in the range of [0, 1] and should be greater than 0,2.
3) the statistical significance of the model is determined. This is conducted using ANOVA p-values. The indicator shows if there are regressors as-sociated with the dependent variable. If the p-value is greater than 0,05, it means that no variables are statistically significant. If the p-value is less than 0,05, it means that there are statistically significant variables and the model is appropriate to use for further review.
4) checking if all independent variables are statistically significant. Student t-tests are used for that and if the test p-value is less than 0,05, it means that the variable is statistically significant and it can be included in the model. If the p-value is greater than 0,05, the variable is not statistically significant.
5) checking multicollinearity using the dispersion decreasing multiplier VIF, which indicates whether the regressors are correlated with each other. VIF is calculated for each regressor and it is acceptable that VIF should be less than four.
6) the data contain outliers are verified. Cook measure is calculated for each set of regressors and it should not exceed 1. If it is higher, then it is concluded that the model has the outliers.
7) standardized residual errors are assessed. They are used to check wheth-er the normality assumptions are met. The most commonly studied

Oeconomia Copernicana, 10(2), 309–339
320
standardized residues histogram, which is compared with the normal curve, standardized residual errors curve, and the normal random varia-ble relative percentages of frequencies (P-P plot). If the points are drawn closer to the line, the data is considered as normal. Standardized errors sanity is checked using Shapiro and Wolf, Kolmogorov and Smirnov tests. If these criteria p-values are greater than 0,05, it can be stated that the standardized errors are normal.
8) autocorrelation is assessed. Autocorrelation is not considered if Durbin-Watson's statistical significance is in the range of 1,5–2,5. It can be stat-ed that the observations are auto correlated, if Durbin-Watson statistical significance is close to 0 or 4. In order to calculate the company's intellectual capital aggregated index
or its components change, the company's market value change during the research period, the value of present year is divided by the value of previ-ous year and deducted by one. The resulting figure is expressed as a per-centage.
Hypotheses are confirmed if the resulting regression models are statisti-cally significant and consistent with the criteria specified above. If the re-sulting regression models are not statistically significant, the null hypothe-sis is accepted, which means that there is no statistically significant rela-tionship between a company’s intellectual capital and its market value.
To sum up, the company’s intellectual capital evaluation model is com-posed and checked using exploratory factor analysis. In order to check if there is a statistically significant relationship between a company’s intellec-tual capital and its market value, a pair-wise and multiple correlation and regression analysis is conducted. The empirical test of the latter model has been checked for Baltic companies (Estonia, Latvia, and Lithuania) listed in Nasdaq Baltic stock exchange. The weights of the company’s intellectual capital structural parts were determined using an experts’ evaluation. The results of the abovementioned research are presented in the next paragraph.
The Empirical test of a model of company’s intellectual capital and its impact on the market value
The data was collected using companies that are listed in Nasdaq Baltic stock exchange. According to the information provided in the platform, there were 17 Estonian listed companies, 27 Latvian listed companies, and 28 Lithuanian listed companies. Some of the companies were removed from the research due to discrepancies in the data or data absence. The empirical test of the company’s intellectual capital and its market value

Oeconomia Copernicana, 10(2), 309–339
321
model was checked using five years’ data from 2011 to 2015. The more recent data was not available. For some of the listed companies (“LHV Group”, “Linda Nektar”, “Pro Kapital Grupp”, “Baltic Telekom”, “Han-saMatrix”, “Amber Grid”, “Energijos Skirstymo Operatorius”, “INVL Bal-tic Farmland”, “INVL Baltic Real Estate”, “INVL Technology”, “K2 LT”), old data records were not present as some of them were newly established. One company was removed from the research due to the fact that no em-ployees were present in it (“Trigon Property Development”). In total, 13 Estonian listed companies, 24 Latvian listed companies, and 21 Lithuanian listed companies were included in the empirical test. All companies that were selected are listed in Nasdaq Baltic stock exchange and meet the crite-ria of the listing agreement. The companies are from various sectors as follows: travel and leisure industry, retail, telecommunications, banks, health care, financial services, media, chemicals, construction and materi-als, basic resources, automobiles and parts, food and beverage, real estate, personal and household goods, industrial goods and services, and utilities. All companies belong to the small capitalization group.
The results of the Baltic listed companies’ intellectual capital index re-vealed that the greatest values of intellectual capital were in Estonian listed companies (Table 3).
The results (Table 3) show that lower-than-average intellectual capital aggregated index value is in Lithuanian and Latvian listed companies. It is appropriate to consider how intellectual capital index values are distributed among the industry level (Figure 5).
The graph (Figure 5) shows that the aggregated index of intellectual capital values is the highest in companies that work in the travel and leisure industry. Other industries in which the aggregated index of intellectual capital values are higher than the average: retail, telecommunications, banks, health care, financial services, media, chemicals and construction and materials. It was also detected that the lowest intellectual capital aggre-gated index values are in companies that belong to the basic resources in-dustry. Other industries where intellectual capital aggregated index value is lower than the average are as follows: automobiles and parts, food and bev-erage, real estate, personal and household goods, industrial goods and ser-vices, and utilities. It is worth noting that Estonian companies belong to the travel and leisure industry and earlier the research showed that the Estonian companies’ intellectual capital aggregated index value is the highest.
The analysis of the structure of the intellectual capital index revealed that companies where intellectual capital aggregated index is high, have one commonality: their human capital and relational capital constitute the largest part of intellectual capital. For instance: it was identified that the

Oeconomia Copernicana, 10(2), 309–339
322
company, in which the value of intellectual capital is largest (Estonian trav-el and leisure company “Tallink Grupp”), structural capital is less than the average of the Baltic countries. It can be concluded that structural capital reduces the aggregate value of the intellectual capital index. It was also detected that the companies, where human capital takes up the major part, have higher values of the aggregate intellectual capital index.
The final part of the research was to check if there is a statistically sig-nificant relationship between a company’s intellectual capital and its mar-ket value. The results are provided in the scheme below (Figure 6). The final results are provided in the annex (Table 4).
The results of the abovementioned research revealed that there is a sta-tistically significant relationship between a company’s intellectual capital and its market value in the Baltic listed companies. This is represented by the regression model which is given in the formula below (Formula 1).
������ = 72275 + 65191�� − 17450�� + 1172�� + 15424��, (1)
where: BSLCMV – Baltic States’ listed companies’ market value; HC – company’s human capital; SC – company’s structural capital; JC – company’s juridical capital; RC – company’s human capital.
It was detected that the Baltic listed companies with a higher intellectual
capital aggregated index value have a higher market value (in these enter-prises intellectual capital explains 58 per cent of their market value varia-tion). The analysis of the regression model was also conducted separately for the three Baltic countries as well. It was found that in all of the Baltic countries, the regression model is statistically significant. In the case of Latvia, the intellectual capital and market value dependence are best re-flected by the exponential model that explains 61 per cent of their market value variation. In the case of Lithuania, the intellectual capital and market value dependence are best reflected by the sixth-degree polynomial equa-tion that explains 28 per cent of their market value variation. What is more, graphically displayed variables showed that Lithuanian and Latvian com-panies were divided into two groups. In one group companies with similar intellectual capital index values have high market value, while others have smaller market value. These differences showed that intellectual capital in various enterprises can be utilized differently.
The second regression model was also statistically significant, and it was identified that the Baltic listed companies’ market value depends not
Oeconomia Copernicana, 10(2), 309–339
323
only on the intellectual capital aggregated index values but also on the in-tellectual capital structural parts. The model explains 45 per cent of the Baltic listed companies market value variation. The examination of the second regression model separately for three Baltic countries revealed that in all three countries, the criteria established for the models were statistical-ly significant. For Estonia, the greatest impact on the market value of listed companies has human capital, for Latvia — structural capital. However, in this case, the structural capital factor regression coefficient was negative, which led to the conclusion that the company’s structural capital increase is followed by the market value decrease. The importance of structural capital was accentuated in other studies by various researchers, but the results they obtained were similar to this (Maddocks & Beaney, 2002, pp. 16–17; Kan-nan & Aulbur, 2004, pp. 389–414; Znakovaitė & Pabedinskaitė, 2010, pp. 126–133; Stankevičienė & Liučvaitienė, 2012, pp. 79–93). There might be two main concerns that arise from such results: not proper evaluation of company’s structural capital or the difficulty to measure the structural capi-tal on its overall basis. This phenomenon is analysed in the discussion and recommendations part. In the case of Lithuania, only human capital was included as a statistically significant variable.
In general, it was observed that human capital and relational capital have the largest influence for the market value of listed companies. In en-terprises where structural capital represents a major intellectual capital ag-gregated index part, a lower level of intellectual capital was observed. Discussion and recommendations The results revealed that there is a statistically significant relationship be-tween a company’s intellectual capital and its market value. Human capital plays a major role in the market value of listed companies in the Baltic States. The results are consistent with Chen et al. (2005, pp. 159–176), Wang (2008, pp. 546–563) and Shakina and Barajas (2014, pp. 861–881) studies that revealed that the company’s intellectual capital has an impact on its market value, and human capital has the greatest impact on the com-pany’s market value. However, other researchers’ (Firer & Williams, 2003, pp. 348–360; Rahman, 2012, pp. 46–77; Shiu, 2006, pp. 356–365; Ting & Lean, 2009, pp. 588–599; Zéghal & Maaloul, 2010; 2011, pp. 39–60, pp. 262–274; Nimtrakoon, 2015, pp. 587–618; Zhang et al., 2006, pp. 10–17) studies were based on the assumption that the company’s intellectual capi-tal operates in efficient markets. Companies with higher intellectual capital have been found to have a higher market value. The practical significance
Oeconomia Copernicana, 10(2), 309–339
324
of research results is revealed by the peculiarity of the company’s intellec-tual capital influence on its market value valuation model, which allows to study the company’s intellectual capital in a complex way, to compare the intellectual capital of individual companies, its components and their influ-ence on their market value. The study revealed the uneven influence of the company’s intellectual capital components. The results showed that com-panies with human capital that is higher than average are characterized by an increase in the number of employees, the number of employees and the share of personnel costs. The results showed that companies with structural capital which is higher than average, has a low debt-to-equity ratio and high strategy implementation rates. Nevertheless, interesting result requires more research and studies: the structural capital factor regression coeffi-cient was negative, which led to the conclusion that the company’s struc-tural capital increase is followed by the market value decrease. The results are consistent with some other studies (Maddocks & Beaney, 2002, pp. 16–17; Kannan & Aulbur, 2004, pp. 389–414; Znakovaitė & Pabedinskaitė,
2010, pp. 126–133; Stankevičienė & Liučvaitienė, 2012, pp. 79–93). The phenomenon can be explained with more future research as the main issue is that companies do not have a measurement system of their structural capital. This leads to the improper evaluation of company’s structural capi-tal which can result in incorrect structural capital and company’s market value ratio. In addition to this, companies where juridical capital is higher than average focus on increasing intangible assets with a higher number of patents, licenses, and brands. Current studies (Sachpazidu-Wójcicka, 2017, pp. 287–299) also suggest that innovation, technology, product and process innovations are important elements for the success of any enterprise. Also, the results have revealed that in companies where relational capital is high-er than average there is an increase in marketing costs, companies have one of the largest citations in search engines, their website quality and social networking indicators are very high.
It would be appropriate to develop research into ways to incorporate ad-ditional indicators that reflect the company’s intellectual capital or its com-ponents. Only the most important and most characteristic indicators of the company’s intellectual capital were included in the model, but it would be useful to analyze which additional indicators could be included in the mod-el for the creation of the aggregate index of intellectual capital.
Another limitation was the lack of data — the data of longer time series of listed companies of the Baltic States were not available, so it would be recommended to repeat the study. The study can also be conducted in other homogeneous groups of companies to verify the validity of model not only in the Baltic listed companies. It is worth to study the intellectual capital of

Oeconomia Copernicana, 10(2), 309–339
325
other countries and other types of companies and to analyze which compo-nents of intellectual capital have the greatest influence on the market value.
The current model can be used by business executives, stock exchange representatives, business analysts in order to monitor intellectual capital in individual companies. Continuous monitoring of the company’s intellectual capital would make it possible to develop a strategy for the development of the intellectual capital and their components in various companies. It would be appropriate to include in the model indicators that are not publicly avail-able, but companies can calculate them individually. Testing such models would be valuable because they would reveal the importance of items that are not included in the companies’ financial statements, websites, social networks, or other media.
It would also be advisable to develop a model by incorporating qualita-tive factors into it. One of the most important elements of human capital is employee motivation, but the indicator that reflects it has not been found. Current studies (Vlacseková & Mura, 2017, pp. 111–130) on employee motivation suggests that “enterprise managers should recognize that moti-vation is personal, as Maslow and Herzberg demonstrated that employees are motivated by many different factors. Enterprise managers therefore need to find out the personal goals of their employees.” It would also be appropriate to be able to assess the value of one of the elements of the communication capital — customer satisfaction. Studies conducted current-ly (Skvarciany et al., 2018, pp. 7–28) revealed the importance of custom-ers’ trust for a successful competitiveness and attraction of new customers. However, these indicators are not publicly available and not all companies tend to collect data on them. However, it should be emphasized that such research would be useful in assessing the impact and weight of qualitative indicators on the aggregate index of a company’s intellectual capital.
The study was conducted in small capitalization companies, but the im-pact of the company’s intellectual capital on its market value in medium and high capitalization companies was not investigated. Also, as the study identified a similar structure of intellectual capital, the data could be com-pared across industries. Such research would be useful in identifying whether intellectual capital has a statistically significant impact on market value in different capitalization firms and in different industries. Conclusions
To conclude, although the company’s intellectual capital is a relevant and essential concept, various scientists analyze it through different features,

Oeconomia Copernicana, 10(2), 309–339
326
take into consideration various components or interfaces. The research in the company's intellectual capital area is full of different terms (concepts), a variety of intellectual capital structure models, and different intellectual capital research methods. After analyzing the company's intellectual capital concept, a definition of a company's intellectual capital was suggested, namely, the aggregate of intangible resources a company has at its disposal that enables a company to operate at its best, creates a competitive ad-vantage, and increases market value. Intellectual capital structure in this scientific paper is proposed as follows: human capital, structural capital, juridical capital, and relational capital.
Company’s intellectual capital evaluation model was composed and checked using exploratory factor analysis. The main aim was to check if there is a statistically significant relationship between a company’s intellec-tual capital and its market value. To accomplish the latter aim, a pair-wise and multiple correlation and regression analysis was conducted. The empir-ical test of the company’s intellectual capital and its market value model was checked in 58 Baltic companies (Estonia, Latvia, and Lithuania) listed in Nasdaq Baltic stock exchange. The weights of the company’s intellectual capital structural parts were determined using an experts’ evaluation. The results showed that there is a statistically significant relationship between a company’s intellectual capital and its market value in the Baltic listed companies. It was detected that the Baltic listed companies with a higher intellectual capital aggregated index value have a higher market value. The results have also revealed that the company's structural capital increase is determined by the market value decrease. Human capital and relational capital showed to have the largest influence on the market value of listed companies. In enterprises where structural capital represents a major intel-lectual capital aggregated index part, a lower level of intellectual capital was observed.
For future research, it would be appropriate to develop the model further in finding ways to involve the company's intellectual capital qualitative and subjective elements. In the model presented in this scientific paper only the most important indicators were included. The limitations were presented in the discussion and recommendations part, but the most important area of opportunity is to proceed further with supplementary research by using additional factors that would describe company’s intellectual capital. It would be useful to include various individual criteria of the respective companies. Human capital is considered as the most important structural part of the company’s intellectual capital, but the major element of it — motivation of employees — was not included. It would be good to examine the latter indicator, but by now none of the companies has been willing to

Oeconomia Copernicana, 10(2), 309–339
327
publicize this information. Nevertheless, it would be valuable to test these kinds of patterns as they reveal the elements that are not presented in the financial statements of companies.
References Abdolmohammadi, M. J. (2005). Intellectual capital disclosure and market capital-
ization. Journal of Intellectual Capital, 6(3). doi: 10.1108/14691930510611 139.
Balcerzak, A. P. (2016). Multiple-criteria evaluation of quality of human capital in the European Union countries. Economics & Sociology, 9(2). doi: 10.14254/ 2071-789X.2016/9-2/1.
Bontis, N. (1998). Intellectual capital: an exploratory study that develops measures and models. Management Decision, 36(2). doi: 10.1108/00251749810204142.
Brooking, A. (1996). Intellectual capital core asset for the third millennium enter-prise. London: International Thomson Business Press.
Cabello–Medina, C., López–Cabrales, A., & Valle–Cabrera, R. (2011). Leveraging the innovative performance of human capital through HRM and social capital in Spanish firms. International Journal of Human Resource Management, 22(4). doi: 10.1080/09585192.2011.555125.
Cabrita, M., & Bontis, N. (2008). Intellectual capital and business performance in the Portuguese banking industry. International Journal of Technology Man-agement, 43(1-3). doi: 10.1504/IJTM.2008.019416.
Carmona–Lavado, A., Cuevas–Rodríguez, G., & Cabello–Medina, C. (2010). So-cial and organizational capital: building the context for innovation. Industrial Marketing Management, 39(4). doi: 10.1016/j.indmarman.2009.09.003.
Celenza, D., & Rossi, F. (2014). Intellectual capital and performance of listed companies: empirical evidence from Italy. Measuring Business Excellence, 18(1). doi: 10.1108/MBE-10-2013-0054.
Chen, M. C., Cheng, S. J., & Hwang, Y. (2005). An empirical investigation of the relationship between intellectual capital and firms’ market value and financial performance. Journal of Intellectual Capital, 6(2). doi: 10.1108/146919305 10592771.
Chesbrough, H. (2003). Open innovation: the new imperative for creating and profiting from technology. Boston: Harvard Business School Press. doi: 10.1108/14601060410565074.
Chourabi, H., Nam, T., Walker, S., Gil–Garcia, J. R., Mellouli, S., Nahon, K., & Scholl, H. J. (2012). Understanding smart cities: an integrative framework. In System science (HICSS), 45th Hawaii international conference, IEEE. doi: 10.1109/HICSS.2012.615.
Clarke, M., Seng, D., & Whiting, R. H. (2010). Intellectual capital and firm per-formance in Australia. Working Paper Series, Department of Accountancy and Business Law, University of Otago, 12 doi: 10.1108/14691931111181706.

Oeconomia Copernicana, 10(2), 309–339
328
Cooper, D., & Sherer, M. J. (1984). The value of corporate accounting reports: arguments for a political economy of accounting. Accounting, Organizations and Society, 3(4). doi: 10.1016/0361-3682(84)90008-4.
Cricelli, L., & Greco, M. (2013). Relational capital and performances in interuni-versity research consortia. International Journal of Engineering Business Man-agement, 5(4). doi: 10.5772/56001.
Cricelli, L., Greco, M., & Grimaldi, M. (2014). An overall index of intellectual capital. Management Research Review, 37(10). doi: 10.1108/MRR-04-2013-0088.
Dameri, R. P., & Ricciardi, F. (2015). Smart city intellectual capital: an emerging view of territorial systems innovation management. Journal of Intellectual Capital, 16(4). doi: 10.1108/JIC-02-2015-0018.
Delgado–Verde, M., Navas–López, J. E., Cruz–González, J., & Amores–Salvadó, J. (2011). Radical innovation from relations-based knowledge: empirical evi-dence in Spanish technology-intensive firms. Journal of Knowledge Manage-ment, 15(5). doi: 10.1108/13673271111174294.
Dumay, J. (2013). The third stage of IC: towards a new IC future and beyond. Journal of Intellectual Capital, 14(1). doi: 10.1108/14691931311288986.
Dumay, J. (2016). A critical reflection on the future of intellectual capital: from reporting to disclosure. Journal of Intellectual Capital, 17(1). doi: 10.1108/JIC-08-2015-0072.
Dumay, J., & Cuganesan, S. (2011). Making sense of intellectual capital complexi-ty: measuring through narrative. Journal of Human Resource Costing & Ac-counting, 15(1). doi: 10.1108/14013381111125305.
Edvinsson, L. (2013). IC 21: reflections from 21 years of IC practice and theory. Journal of Intellectual Capital, 14(1). doi: 10.1108/14691931311289075.
Edvinsson, L., & Malone, M. S. (1997). Intellectual capital: realising your compa-ny’s true value by finding its hidden brainpower. New York: Harper Collins Publishers Inc.
F-Jardón, C. M., & Martos, M. S. (2009). Intellectual capital and performance in wood industries of Argentina. Journal of Intellectual Capital, 10(4). doi: 10.1108/14691930910996670.
Ferraro, O., & Veltri, S. (2011). The value relevance of intellectual capital on the firm’s market value: an empirical survey on the Italian listed firms. Interna-tional Journal of Knowledge-Based Development, 2(1). doi: 10.1016/j.sbspro. 2013.12.934.
Firer, S., & Williams, S. M. (2003). Intellectual capital and traditional measures of corporate performance. Journal of Intellectual Capital, 4(3). doi: 10.1108/ 14691930310487806.
Gray, R. (2006). Social, environmental and sustainability reporting and organisa-tional value creation? Whose value? Whose creation? Accounting, Auditing & Accountability Journal, 19(6). doi: 10.1108/09513570610709872.
Hall, R. (1992). The strategic analysis of intangible resources. Strategic Manage-ment Journal, 13(2). doi: 10.1002/smj.4250130205.

Oeconomia Copernicana, 10(2), 309–339
329
Hsu, I. C., & Sabherwal, R. (2012). Intellectual capital and new product develop-ment performance: the mediating role of organizational learning capability. Technological Forecasting and Social Change, 76(5). doi: 10.1016/j.techfore. 2008.03.012.
Hsu, Y.–H., & Fang, W. (2009). Intellectual capital and new product development performance: the mediating role of organizational learning capability. Techno-logical Forecasting and Social Change, 76(5). doi: 10.1016/j.techfore.2008 .03.012.
Huizingh, E. K. R. E. (2011). Open innovation: state of the art and future perspec-tives. Technovation, 31(1). doi: 10.1016/j.technovation.2010.10.002.
Inkinen, H. (2015). Review of empirical research on intellectual capital and firm performance. Journal of Intellectual Capital, 16(3). doi: 10.1108/JIC-01-2015-0002.
Itami, H., & Roehl, T. W. (1987). Mobilizing invisible assets. Cambridge, Massa-chusetts and London: Harvard University Press.
Kannan, G., & Aulbur, W. G. (2004). Intellectual capital: measurement effective-ness. Journal of Intellectual Capital, 5(3). doi: 10.1108/14691930410550363.
Kaplan, R. S., & Norton, D. P. (2001). The strategy-focused organization: how balanced scorecard companies thrive in the new business environment. Boston: Harvard Business School Press. doi: 10.1108/sl.2001.26129cab.002.
Kim, D., & Kumar, V. (2009). A framework for prioritization of intellectual capital indicators in R&D. Journal of Intellectual Capital, 10(2). doi: 10.1108 /14691930910952669.
Kristandl, G., & Bontis, N. (2007). Defining intangible assets and intellectual capi-tal. Management Decision, 45(9).
Leitner, K. H. (2011). The effect of intellectual capital on product innovativeness in SMEs. International Journal of Technology Management, 53(1). doi: 10.15 04/IJTM.2011.037235.
Liu, D. I., Tseng, K. A. & Yen, S. W. (2009). The incremental impact of intellec-tual capital on value creation. Journal of Intellectual Capital, 10(2). doi: 10.1108/14691930910952650.
Mačerinskienė, I., & Aleknavičiūtė, R. (2017). National intellectual capital influ-ence on economic growth in the European Union countries. Equilibrium. Quar-terly Journal of Economics and Economic Policy, 12(4). doi: 10.24136/eq.v12i4.30.
Maddocks, J., & Beaney, M. (2002). See the invisible and intangible. Knowledge Management, March.
Markhaichuk, M., & Zhuckovskaya, I. (2019). The spread of the regional intellec-tual capital: the case of the Russian Federation. Oeconomia Copernicana, 10(1). doi: 10.24136/oc.2019.005.
Menor, L. J., Kristal, M. M., & Rosenzweig, E. D. (2007). Examining the influence of operational intellectual capital on capabilities and performance. Manufactur-ing and Service Operations Management, 9(4). doi: 10.1287/msom.1060.0131.

Oeconomia Copernicana, 10(2), 309–339
330
Montemari, M., & Nielsen, C. (2013). The role of causal maps in intellectual capi-tal measurement and management. Journal of Intellectual Capital, 14(4). doi: 10.1108/JIC-01-2013-0008.
Morariu, C. M. (2014). Intellectual capital performance in the case of Romanian public companies. Journal of Intellectual Capital, 15(3). doi: 10.1108/JIC-05-2014-0061.
Nahapiet, J., & Ghoshal, S. (1998). Social capital, intellectual capital and the or-ganizational advantage. Academy of Management Review, 23(2). doi: 10.5465/AMR.1998.533225.
Namvar, M., Fathian, M., Akhavan, P., & Gholamian, M. R. (2009). Exploring the impacts of intellectual property on intellectual capital and company perfor-mance: the case of Iranian computer and electronic organizations. Management decision, 48(5). doi: 10.1108/00251741011043876.
Nimtrakoon, S. (2015). The relationship between intellectual capital, firms’ market value and financial performance. Empirical evidence from the ASEAN. Journal of Intellectual Capital, 16(3). doi: 10.1108/JIC-09-2014-0104.
Olander, H., Hurmelinna–Laukkanen, P., & Heilmann, P. (2015). Human resources – strength and weakness in protection of intellectual capital. Journal of Intellec-tual Capital, 16(4). doi: 10.1108/JIC-03-2015-0027.
Rahman, S. (2012). The role of intellectual capital in determining differences be-tween stock market and financial performance. International Research Journal of Finance and Economics, 89.
Rastogi, P. N. (2003). The nature and role of IC: Rethinking the process of value creation and sustained enterprise growth. Journal of Intellectual Capital, 4(2). doi: 10.1108/14691930310472848.
Ricciardi, F., & Za, S. (2014). Smart city research as an interdisciplinary cross-roads: a challenge for management and organization studies. In L. Mola, F. Pennarola & S. Za (Eds.). From information to smart society: environment, pol-itics and economics. Lecture notes in information systems and organisation. Springer International Publishing. doi: 10.1007/978-3-319-09450-2_14.
Roos, G., & Roos, J. (1997). Measuring your company’s intellectual performance. Long Range Planning, 30(3). doi: 10.1016/S0024-6301(97)00022-8.
Sachpazidu-Wójcicka, K. (2017). Innovation as a determinant of the competitive- ness of Polish enterprises. Oeconomia Copernicana, 8(2). doi: 10.24136/ oc.v8i2.18.
Schaffers, H., Komninos, N., Pallot, M., Trousse, B., Nilsson, M., & Oliveira, A. (2011). Smart cities and the future Internet: towards cooperation frameworks for open innovation. Berlin and Heidelberg: Springer. doi: 10.1007/978-3-642-20898-0_31.
Serenko, A., & Bontis, N. (2004). Meta-review of knowledge management and intellectual capital literature: citation impact and research productivity rank-ings. Knowledge and Process Management, 11(3). doi: 10.1002/kpm.203.
Shakina, E., & Barajas, A. (2014). The dynamics of intellectual resources during the economic crisis. Economic Research-Ekonomska Istraživanja, 27(1). doi: 10.1080/1331677X.2014.974918.

Oeconomia Copernicana, 10(2), 309–339
331
Shakina, E., & Molodchik, M. (2014). Intangible-driven value creation: supporting and obstructing factors. Measuring Business Excellence, 18(3). doi: 10.1108/ MBE-12-2013-0063.
Shapiro, J. M. (2006). Smart cities: quality of life, productivity, and the growth effects of human capital. Review of Economics and Statistics, 88(2). doi: 10.1162/rest.88.2.324.
Sharabati, A.–A. A., Jawad, S. N., & Bontis, N. (2010). Intellectual capital and business performance in the pharmaceutical sector of Jordan. Management De-cision, 48(1). doi: 10.1108/00251741011014481.
Shatrevich, V., Ščeulovs, D., & Gaile-Sarkane, E. (2015). Dynamic intellectual capital model in a company. Business, Management and Education, 13(1). doi: 10.3846/bme.2015.265.
Shiu, H. J. (2006). The application of the value added intellectual coefficient to measure corporate performance: evidence from technological firms. Interna-tional Journal of Management, 23(2).
Skvarciany, V., Jurevičienė, D., Iljins, J., & Gaile-Sarkane, E. (2018). Factors influencing a bank’s competitive ability: the case of Lithuania and Latvia. Oeconomia Copernicana, 9(1). doi: 10.24136/oc.2018.001.
Stankevičienė, A., & Liučvaitienė, A. (2012). Intelektinio kapitalo vertinimo aspektai. Verslas: Teorija ir praktika, 13(1). doi: 10.3846/btp.2012.09.
Stewart, T. A. (1997). Intellectual capital: the new wealth of organizations. New York: Doubleday Dell Publishing Group. doi: 10.1002/pfi.4140370713.
Subramaniam, A., & Youndt, M. A. (2005). The influence of intellectual capital on the types of innovative capabilities. Academy of Management Journal, 48(3). doi: 10.1016/j.sbspro.2014.09.025.
Sullivan, H. P. (1998). Profiting from intellectual capital: extracting value from innovation. New York: Wiley. doi: 10.1108/13673279910275585.
Sveiby, K. E. (2001). A knowledge‐based theory of the firm to guide in strategy formulation. Journal of Intellectual Capital, 2(4). doi: 10.1108/146919301 10409651.
Ting, I. W. K., & Lean, H. H. (2009). Intellectual capital performance in financial institutions in Malaysia. Journal of Intellectual Capital, 10(4). doi: 10.1108/ 14691930910996661.
Tseng, C. Y., & Goo, Y. J. J. (2005). Intellectual capital and corporate value in an emerging economy: empirical study of Taiwanese manufacturers. R&D Man-agement, 35(2). doi: 10.1111/j.1467-9310.2005.00382.x.
Ulrich, D. (1998). Intellectual capital equals competence x commitment. Sloan Management Review, 39. doi: 10.1177/031289620202701S09.
Vlacseková, D., & Mura, L. (2017). Effect of motivational tools on employee satis-faction in small and medium enterprises. Oeconomia Copernicana, 8(1). doi: 10.24136/oc.v8i1.8.
Wang, D., & Chen, S. (2013). Does intellectual capital matter? High-performance work systems and bilateral innovative capabilities. International Journal of Manpower, 34(8). doi: 10.1108/IJM-07-2013-0167.

Oeconomia Copernicana, 10(2), 309–339
332
Wang, J. C. (2008). Investigating market value and intellectual capital for S&P 500. Journal of Intellectual Capital, 9(4). doi: 10.1108/14691930810913159.
Wu, S.–H., Lin, L.–Y. & Hsu, M.–Y. (2007). Intellectual capital, dynamic capa-bilities and innovative performance of organisations. International Journal of Technology Management, 39(3-4). doi: 10.1504/IJTM.2007.013496.
Yang, C.–C. & Lin, C. Y.–Y. (2009). Does intellectual capital mediate the rela-tionship between HRM and organizational performance? Perspective of a healthcare industry in Taiwan. International Journal of Human Resource Management, 20(9). doi: 10.1080/09585190903142415.
Yli-Renko, H., Autio, E., & Tontti, V. (2001). Social capital, knowledge, and the international growth of technology-based new firms. International Business Review, 11(3). doi: 10.1016/S0969-5931(01)00061-0.
Youndt, M. A., Subramaniam, A., & Snell, S. A. (2004). Intellectual capital pro-files: an examination of investments and returns. Journal of Management Stud-ies, 41(2). doi: 10.1111/j.1467-6486.2004.00435.x.
Zéghal, D., & Maaloul, A. (2010). Analysing value added as an indicator of intel-lectual capital and its consequences on company performance. Journal of intel-lectual capital, 11(1). doi: 10.1108/14691931011013325.
Zhang, J., Zhu, N., & Kong, Y. (2006). Study on intellectual capital and enter-prise’s performance: empirical evidence on the Chinese securities market. Journal of Accounting and Auditing, 2(1).
Znakovaitė, A., & Pabedinskaitė, A. (2010). Intelektinio kapitalo valdymas transporto sektoriuje, Verslas XXI amžiuje, 2(2). doi: 10.3846/mla.2010.045.
Annex
Table 1. Intellectual capital definitions provided by multiple researchers
The development
stage Intellectual capital definition Researcher, year
Fo
rmin
g
Intellectual capital is the effects of dynamic individuals’ intellect.
Galbraith (1969)
Intellectual capital is an invisible element, which has a visible benefit.
Cooper & Sherer, (1984, pp. 998–1020)
Intellectual capital is technologies, brand name, and knowledge capital, which belong to a company.
Itami & Roehl (1987, p. 186)
Sto
rmin
g
Intellectual capital – a set of contemporary value criteria, which productively transforms resources into material assets.
Hall (1992, pp. 135-144)
Intellectual capital – knowledge assets, non-financial assets, intangible assets, hidden assets, which belong to a company.
Edvinsson & Malone, (1997, p. 217)
Intellectual capital – the sum of everything that belongs to a company and is understood as a competitive advantage; intellectual datum such as knowledge, experience, intellectual property, information that is used for the creation of wealth.
Stewart (1997, p. 265)
Intellectual capital – competence of employees multiplied by commitment.
Ulrich (1998, pp. 15–26)
Intellectual capital – the bunch of all intangible assets in a company.
Bontis (1998, pp. 63–76)
No
rmin
g
Intellectual capital is a twin of knowledge management. Sveiby (2001, pp. 344–358)
Intellectual capital – asset, which consists of human, informational, and organizational capital.
Kaplan & Norton (2001, p. 399)
Intellectual capital – the holistic ability of a company to coordinate, align, and maintain knowledge resources during the wealth creation process.
Rastogi (2003, pp. 227–248)
Intellectual capital – collective brainpower in a company. Kristandl & Bontis (2007, pp. 1510–1524)
Intellectual capital is a set of essential value creation criteria.
Wang (2008, pp. 546–563)
Pe
rfo
rmin
g
Intellectual capital is a complicated network of knowledge, which belongs to a company.
Dumay & Cuganesan (2011, pp. 24-49)
Intellectual capital is a phenomenon that enables activate intangible assets related to knowledge resources created by employees, clients, technologies, and processes.
Montemari & Nielsen (2013, pp. 522–546)
Intellectual capital – a dynamic aggregate of competencies and abilities created by a company due to a specific knowledge stream, intangible assets, and competitive advantages.
Dameri & Ricciardi (2015, pp. 860–887)
Intellectual capital – hidden assets and knowledge-based resources of company members.
Inkinen (2015, pp. 518–565)
Intellectual capital – a competitive advantage of a company composed of knowledge, experience, intellectual property, information used for value creation.
Dumay (2016, pp. 168–184)
Table 2. The weights of a company’s intellectual capital structural parts
Human capital Structural capital Juridical capital Relational capital 39% 19% 17% 25%
Table 3. Deviation from the mean of the Baltic listed companies’ intellectual capital aggregated index (2011–2015)
Latvia Lithuania Estonia -0.165 -0.072 0.420
Table 4. The results of the modified multi-regression model of the evaluation of intellectual capital influence of listed companies of Estonia, Latvia and Lithuania on their market value
Criteria Estonian
listed companies
Latvian listed
companies
Lithuanian listed
companies
Pair correlation coefficients HC = 0.790 RC = 0.694
HC = 0.502 SC = -0.419 RC = 0.473
HC = 0.657
Level of significance of correlation coefficients HC = 0.000 RC = 0.000
HC = 0.000 SC = 0.000 RC = 0.000
HC = 0.000
Determination coefficient (R2) 0.667 0.385 0.432
ANOVA p 0.000 0.000 0.000
Cook’s distance 0.019 0.013 0.020
VIF HC = 1.903 RC = 1.903
HC = 1.586 SC = 1.071 RC = 1.540
HC = 1
Histogram of standardized residues
P-P
Diagram of Standardized Residue and Regression Estimated Values
Table 4. Continued
Criteria Estonian
listed companies
Latvian listed
companies
Lithuanian listed
companies
Shapiro–Wilk test 0.002 0.000 0.000
Kolmogorov–Smirnov test 0.000 0.001 0.000
Durbin–Watson statistic 0.865 0.546 0.508
Student's t-test HC = 0.000 RC = 0.006
HC = 0.003 SC = 0.000 RC = 0.006
HC = 0.000
Standardized Variables Beta Coefficients HC = 0.593 RC = 0.286
HC = 0.277 SC = -0.302 RC = 0.252
HC = 0.657
Figure 1. The development stages of the Intellectual Capital concept
Source: own assumptions based on Tuckman’s (1965) group/team formation theory stages.

Figure 2. The structure of the intellectual capital of a company
Source: adapted in accordance with Stewart (1997, p. 265).
Intellectual capital of a company
Human capital
Employees
Employee education
Investments in employees
Structural capital
Corporate identity
Financial leverage
Selling, General & Administrative Costs
(SG&A)
Juridical capital
Intangible assets
Legally protected information
Relational capital
Social characteristics of a
company
Relations
Relational expenses

Figure 3. The stages of a company’s intellectual impact on its market value research methodology
Company’s intellectual capital components model is chosen
Company’s intellectual capital evaluation model is formed
Company’s intellectual capital evaluation method is chosen
Company’s intellectual capital elements are chosen and evaluation scorecard is formed
The aggregation method of a company’s intellectual capital valuation indicators is selected
Research sample and period is defined, data is collected
The evaluation system validity and reliability of a model is checked
A model of company’s intellectual capital is modified
Company’s intellectual capital components weights are determined
Variables are aggregated, the value of company’s intellectual capital is calculated
Hypotheses are formulated, the methods of investigation are described
Models of company’s intellectual capital impact on its market value are described
I st
age
II st
age
Co
mp
any’
s in
telle
ctu
al c
apita
l eva
luat
ion
De
scrip
tion
of
eva
luat
ion
mo
dels

Figure 4. Company’s intellectual capital evaluation model
Figure 5. Deviation from the mean of the Baltic listed companies’ intellectual capital aggregated index by industry level (2011–2015)
COMPANY'S INTELLECTUAL
CAPITAL
Human capital
Number of employees
Education of employees
Ratio of costs of employees
Costs per employee
Structural capital
Financial leverage
Company's age
Strategy implementation
SG&A
Juridical capital
Patents, licences, trademarks
Intangible assets
Number of subsidiaries
Relational capital
Relational expenses
Citations in search engines
Company’s web site quality
Social networks
-1
-0.5
0
0.5
1
1.5
2
Ba
sic
Re
sour
ces
Aut
omo
bile
s &
Par
ts
Foo
d &
Bev
era
ge
Re
al E
sta
te
Pe
rson
al &
Hou
seh
old
Goo
dsIn
dust
rial G
ood
s &
Se
rvic
es
Util
itie
s
Co
nstr
uctio
n &
Ma
teria
ls
Ch
emic
als
Me
dia
Fin
anc
ial S
ervi
ces
He
alth
Car
e
Ba
nks
Tel
ecom
mun
icat
ions
Re
tail
Tra
vel &
Lei
sure

Fig
ure
6. F
inal
Bal
tic s
tate
s lis
ted
co
mp
anie
s’ in
telle
ctua
l cap
ital a
nd it
s m
arke
t va
lue
reg
ress
ion
mo
del
s