of agro-food industries measuring competitiveness
TRANSCRIPT

Please cite this paper as:
Wijnands, J., S. van Berkum and D. Verhoog (2015-08-01),“Measuring Competitiveness of Agro-Food Industries: TheSwiss Case”, OECD Food, Agriculture and Fisheries Papers,No. 88, OECD Publishing, Paris.http://dx.doi.org/10.1787/5jrvvkrhtmwg-en
OECD Food, Agriculture and FisheriesPapers No. 88
Measuring Competitivenessof Agro-Food Industries
THE SWISS CASE
Jo H. M. Wijnands,
Siemen van Berkum,
David Verhoog

OECD FOOD, AGRICULTURE AND FISHERIES PAPERS
This paper is published under the responsibility of the Secretary-General of the OECD. The
opinions expressed and the arguments employed herein do not necessarily reflect the official
views of OECD member countries.
The publication of this document has been authorised by Ken Ash, Director of the Trade and
Agriculture Directorate.
Comments are welcome and may be sent to [email protected].
OECD (2015)
You can copy, download or print OECD content for your own use, and you can include excerpts from OECD publications, databases and multimedia products in your own documents, presentations, blogs, websites and teaching materials, provided that suitable acknowledgment of OECD as source and copyright owner is given. All requests for commercial use and translation rights should be submitted to [email protected].
OECD FOOD, AGRICULTURE AND FISHERIES PAPER N°88 © OECD 2015
Abstract
MEASURING COMPETITIVENESS OF AGRO-FOOD INDUSTRIES:
THE SWISS CASE
This paper presents an assessment of the competiveness performance of Swiss food
industries. The approach taken here is to measure revealed performance, relying on indicators
such as market performance, trade success and revealed comparative advantage indicators.
The analysis of competitiveness examines the ex post performance of the industry in
Switzerland compared to the same industry in benchmark countries in the European Union.
This paper served as the basis for Chapter 4 of the OECD Review of Agricultural Policies: Switzerland 2015.
Keywords: Agro-food industries, international competitiveness, Switzerland.
JEL: L6; L66
Acknowledgements
This paper was prepared by Jo H.M. Wijnands (co-ordinator), Siemen van Berkum and
David Verhoog from LEI Wageningen UR. It was reviewed by Frank van Tongeren, Carmel
Cahill and Václav Vojtech from OECD/TAD. Statistical assistance was provided by Karine
Souvanheuane, and assistance and editing was provided by Martina Abderrahmane. Valuable
comments were also provided by the Swiss Delegation to the OECD APM Working Party.
This report was declassified by the Working Party on Agricultural Policies and Markets
on 19-21 May 2015 on the responsibility of the Secretary-General.

MEASURING COMPETITIVENESS OF AGRO-FOOD INDUSTRIES: THE SWISS CASE – 3
OECD FOOD, AGRICULTURE AND FISHERIES PAPER N°88 © OECD 2015
Table of Contents
Executive summary ....................................................................................................................................... 6
1. Introduction ............................................................................................................................................... 7
2. Competitiveness assessment: Method and data ...................................................................................... 7
2.1. Competitiveness: comparison of indicators of a specific entity............................................................ 7
2.2. Competitiveness indicators: based on international economics ............................................................ 8
2.3. Data sources and industry classification ............................................................................................. 13
2.4. Benchmark countries selected on trade relation ................................................................................. 15
3. Competitiveness of the Swiss food industries ........................................................................................ 16
3.1. Swiss food industries: An overview ................................................................................................... 16
3.2. Manufacturing of food & beverages products .................................................................................... 19
3.3. Manufacture of “other food” products ................................................................................................ 23
4. Discussion and conclusions ..................................................................................................................... 27
4.1 Strong industries: Export focused and footloose resource base .......................................................... 27
4.2 Objective of the study limited ............................................................................................................. 28
4.3 Economic data sources weak for Switzerland ..................................................................................... 28
4.4 Conclusions ......................................................................................................................................... 28
References ..................................................................................................................................................... 29
Annex 1. Competitiveness graphs based on Z-scores ................................................................................... 31
Annex 2. Competitiveness, structure and raw material based of food processing subsectors ....................... 33
Tables
Table 2.1. Example of impact of indicators and market shares development ..................................... 9
Table 2.2. Industries taken into account according to the NOGA/NACE classification .................. 14
Table 2.3. Agricultural Swiss export to other countries and import by Switzerland in 2012 ........... 15
Table 2.4. Characteristic of the economies of Switzerland and benchmark countries in 2012 ......... 16
Table 3.1. Key-figures of the Swiss food industry ............................................................................ 17
Table 3.2. Overview of raw material supply and self-sufficiency .................................................... 19
Table 3.3. Structure of the food & beverages industry in 2011 ........................................................ 21
Table 3.4. Share of food industry in manufacturing and labour productivity
(based on turnover) .......................................................................................................... 22
Table 3.5. Trade and market shares in food and beverages products ................................................ 22
Table 3.6. Structure of the other food industry in 2011 .................................................................... 25
Table 3.7. Distribution of the sub industries of the Manufacture of other
food products industry ..................................................................................................... 25
Table 3.8. Share of other food industry in manufacturing and labour productivity
(based on turnover) .......................................................................................................... 26
Table 3.9. Trade and market shares in .............................................................................................. 26 Table A1.1. Values of indicators and Z-scores .................................................................................... 31

4 – MEASURING COMPETITIVENESS OF AGRO-FOOD INDUSTRIES: THE SWISS CASE
OECD FOOD, AGRICULTURE AND FISHERIES PAPER N°88 © OECD 2015
Table A2.1. Structure of the meat industry in 2011 ............................................................................. 35
Table A2.2. Production of apples and potatoes in the period 1991-2011 ............................................ 37
Table A2.3. Structure of the fruit and vegetable processing industry in 2011 ..................................... 38
Table A2.4. Structure of oils and fats manufacturing in 2011 ............................................................. 40
Table A2.5. Production and self-sufficiency of milk ........................................................................... 42
Table A2.6. Structure of the dairy industry in 2011 ............................................................................ 43
Table A2.7. Structure of the grain mill and starches industry in 2011 ................................................ 45
Table A2.8. Structure of the bakery products industry in 2011 ........................................................... 47
Table A2.9. Structure of the animal feed products industry in 2011 ................................................... 49
Table A2.10. Structure of beverage manufacturing in 2011 (Switzerland 2008) .................................. 51
Table A2.11. Distribution of the sub industries of beverage manufacturing ......................................... 52
Figures
Figure 3.1. Competitiveness of the Swiss food sub-industries benchmarked
against selected EU countries .......................................................................................... 18
Figure 3.2. Competitiveness of the food & beverages industry ......................................................... 20
Figure 3.3. Lorenz curve of number of firms and turnover of
the food industry (beverages excluded) ........................................................................... 21
Figure 3.4. Processed food and beverage trade indicators ................................................................. 23
Figure 3.5. Competitiveness of the other food products industry ...................................................... 24
Figure 3.6. Trade indicators of the other food industry ...................................................................... 27
Figure A1.1. Competitiveness of the food & beverages industry ......................................................... 32
Figure A2.1. Competitiveness of the meat industry .............................................................................. 34
Figure A2.2. Meat production and self-sufficiency .............................................................................. 34
Figure A2.3. Farmers’ prices for meat from 1991 to 2011 ................................................................... 35
Figure A2.4. Competitiveness of the fruit and vegetable manufacturing industry ................................ 37
Figure A2.5. Prices of apples and potatoes ........................................................................................... 38
Figure A2.6. Competitiveness of the oils and fats manufacturing ........................................................ 39
Figure A2.7. Price of rapeseed .............................................................................................................. 40
Figure A2.8. Competitiveness of the dairy industry ............................................................................. 42
Figure A2.9. Farmers’ prices of milk from 1991 to 2011 ..................................................................... 43
Figure A2.10. Competitiveness of the grain mill and starches industry ................................................. 44
Figure A2.11. Wheat prices (USD/tonnes) ............................................................................................. 45
Figure A2.12. Competitiveness of the bakery products industry ............................................................ 46
Figure A2.13. Competitiveness of the animal feed industry ................................................................... 48
Figure A2.14. Animal feed trade ............................................................................................................. 49
Figure A2.15. Competitiveness of the beverages manufacturing............................................................ 50
Figure A2.16. Prices of grapes in USD/tonne ......................................................................................... 51

MEASURING COMPETITIVENESS OF AGRO-FOOD INDUSTRIES: THE SWISS CASE – 5
OECD FOOD, AGRICULTURE AND FISHERIES PAPER N°88 © OECD 2015
Glossary and acronyms
BFS Bundesamt für Statistik (Switzerland)
bn Billion
Billion 1 000 000 000 = 109
Eurostat EU statistics database
Eurostat-
SBS
Eurostat Structural Business Statistics
FAO Food and Agriculture Organization of the United Nations
FAOstat The Statistics Division of the FAO
NACE Nomenclature générale des Activités économiques dans les Communautés Européennes
(European Classification of Economic Activities)
NOGA General Classification of Economic Activities of Switzerland
Million 1 000 000=106
OECD Organisation for Economic Co-operation and Development
RMA Relative Import Advantage index
RTA Relative Trade Advantage is the difference between RXA and RMA
RXA Relative Export Advantage index
Country abbreviations
AT Austria
CH Switzerland
DE Germany
ES Spain
EU European Union
FR France
IT Italy
NL Netherlands
UK United Kingdom

6 – MEASURING COMPETITIVENESS OF AGRO-FOOD INDUSTRIES: THE SWISS CASE
OECD FOOD, AGRICULTURE AND FISHERIES PAPER N°88 © OECD 2015
Executive Summary
This report presents an assessment of the competiveness performance of Swiss food
industries. The approach taken here is to measure revealed performance, relying on indicators
such as market performance, trade success and revealed comparative advantage indicators.
The analysis of competitiveness examines the ex post performance of the industry in
Switzerland compared to the same industry in benchmark countries in the European Union.
The method relies on data that are available in many countries from public sources. This
feature renders the method potentially applicable in other countries, and provides a way to
assess the performance of national food industries and provides a basis for assessing their
participation in global value chains.
Competitiveness of the food industry is defined as the sustained ability to achieve
profitable gains and maintain market share in domestic and export markets in which the
industry is active. The selected indicators to quantify the competitiveness of an industry are
trade related indicators (market shares on the world market and trade specialisation) and
economic performance indicators (annual growth rates of real turnover, labour productivity
and shares in total manufacturing). These indicators recognise the competition on world
market as well as competition for means of production on the domestic market.
As competitiveness is a relative concept, the performance of the Swiss food industries is
compared with the food industries in benchmark countries. The selected EU countries, which
are the main market for the Swiss food industry, represent 86% of the Swiss export value to
the EU and 89% of Swiss import value from the EU.
The competitiveness of the Swiss food and beverage industry is almost entirely driven by
sub-branches that source most of their raw material inputs abroad or where inputs are non-
agricultural (mineral water). The turnover of cocoa and chocolate manufacturing grew
annually by 10%, almost twice as fast as the overall food and beverages industry (5.8%) in the
period 2001-2011. Together with beverages this industry counts for 72% of the exports of the
Swiss agro-food industry.
The weakest sectors are meat and dairy processing, which mainly rely on domestic
primary agriculture for their inputs. These industries as well as the weak animal feed sector,
have to pay relatively high prices for their material inputs, well above the EU price levels.
Additionally, these less competitive sectors have a relatively low growth of labour
productivity and are relatively labour intensive.

MEASURING COMPETITIVENESS OF AGRO-FOOD INDUSTRIES: THE SWISS CASE – 7
OECD FOOD, AGRICULTURE AND FISHERIES PAPER N°88 © OECD 2015
1. Introduction
As part of the 2013-14 OECD Programme of Work and Budget of the Committee for
Agriculture, the OECD undertook an evaluation of agricultural policy reforms in Switzerland.
The study assessed the economic and environmental impacts of agricultural policies,
considering the implementation of policy reforms since the mid-1990s. The study also
contained an evaluation of competitiveness of the Swiss food industry. The OECD study was
published in March 2015 (OECD, 2015)
This report describes in more detail the methods employed to assess the competitiveness
of Swiss agro-food industries which was developed in a background report by LEI
Wageningen UR. The background report applies a similar method as used in Wijnands et al.
(2007, 2008) that evaluated the competitiveness of the EU food industry at member state level
and in comparison with the United States, Australia, Brazil and Canada.
As competitiveness is a relative concept, the performance of the Swiss food industries are
compared with the food industries in benchmark countries. Because the EU is the main
market for the Swiss food industry, the study compares Switzerland with selected EU
countries.
This report provides a detailed description of the methodology used to assess the
competitiveness of the Swiss food industry and provides the main results for the whole food
and beverage industry and for various subsectors of the food industry. The structure of the
report is as follows:
Chapter 2 elaborates the approach method and data.
Chapter 3 presents the competiveness assessment for the Swiss food & beverages industry
in total and the largest sub-sector “Other food products” All other subsectors are concisely
presented in Annex 2.
Chapter 4 addresses the conclusions and discussion.
2. Competitiveness assessment: Method and data
This chapter presents first the competiveness concept, the indicators used and the method
of assessing competitiveness. Second, the data sources are discussed. Third, the selection of
the EU-benchmark countries is presented.
2.1. Competitiveness: Comparison of indicators of a specific entity
Although competitiveness does not have a precise definition in economic theory, it can be
understood as the ability to successfully face competition. In this sense, competitiveness is the
ability to sell products that meet demand requirements (price, quality, quantity) and, at the
same time, ensure profits over time that enable the firm to thrive. Competitiveness is a relative
concept and should be measured with respect to a benchmark. Competition may be within
domestic markets (in which case firms within one sector or entire sectors in the same country
are compared with each other) or international (in this case, comparisons are made between
countries). An illustration of the complexity of the concept is found in (Spence and Hazard,
1998):
“The problem of international competitiveness has been defined in highly
diverse ways. These definitions (and the proposed solutions to the problem)
are partially inconsistent, and thoroughly confusing to most academics,
politicians, policy-makers, and business managers. There is good reason for
this confusion. The collection of problems alluded to as “competitiveness” is
genuinely complex. Disagreements frequently occur not only at the level of

8 – MEASURING COMPETITIVENESS OF AGRO-FOOD INDUSTRIES: THE SWISS CASE
OECD FOOD, AGRICULTURE AND FISHERIES PAPER N°88 © OECD 2015
empirical effects and of policies, but also in the very definition of the
problem. Well-intentioned and reasonable people find themselves talking at
cross purposes; sometimes it almost seems they are addressing different
subjects.”
Sagheer et al. (2009) present an overview of various approaches for assessing
competitiveness. Their overview, by far not exhaustive, shows that competitiveness is
measured on different entity levels and by different theories. The theories differ from strategic
management approaches generally applied at firm or business unit level (e.g. Thompson and
Strickland, 2003; Wright et al., 1998) to international economics comparing the performances
of countries (e.g. Krugman and Obstfeld, 2006; Siggel, 2006). This study focuses on countries
and industries: the competitiveness of the Swiss food industry benchmarked against the
industry in selected third countries. Therefore, focus is on indicators derived from the theory
of international economics and emphasise productivity differences as drivers for
competitiveness (Krugman and Obstfield, 1988; O'Mahoney and Van Ark, 2003)
According to Porter, sustainable competitive advantage is the fundamental source for
above-average performance in the long run (Porter, 1980; Porter, 1990). In line with Porter’s
viewpoints, competitiveness of the food industry is defined as the sustained ability to achieve profitable gain and maintain market share in domestic and export markets in which the
industry is active.
As competitiveness is a broad concept and there is no general agreement on how to define
it or how to measure it precisely, studies often adopt own definitions and chose a specific
measurement method. Measurement can identify revealed performance, relying on indicators
such as market performance, trade success, revealed comparative advantage indicators, etc.
(Latruffe, 2010). In this study, competitiveness is the ex post performance of an industry in
one country compared to the same industry in benchmark countries. The approach of
O’Mahoney and van Ark (2003) is followed by measuring performance as the growth of
indicators in a certain period. Below the selection of indicators is discussed.
2.2. Competitiveness indicators: Based on international economics
In this section, the indicators selected to be used in this study are summarised. A
distinction is made between trade and the economic performance indicators of
competitiveness. The selection of indicators is mainly based on previous work of Wijnands et
al. (2007, 2008), Latuffe (2010) and Frohberg and Hartmann (1997).
Trade related indicators
In Wijnands et al. (2007) raw materials as well as processed products are included in
assessing the competitiveness of the food industry. In this earlier work trade in raw materials
is seen as a determinant of the competitiveness of the primary sector, while processed
products are linked to the competitiveness of the processing industry. The present report
revisits that approach and distinguishes between processed and raw materials. To that end, the
UNComtrade product codes are linked to the NACE industry codes.1 The revision envisages
selecting only processed products from the trade database for assessing the food industry’s
competitiveness for the “trade” indicators.2
1. The correspondence table is based on:
unstats.un.org/unsd/trade/conversions/HS%20Correlation%20and%20Conversion%20tables.htm.
2. To correct for the influences of consumer price inflation, real values of variable expressed in
monetary terms are obtained by deflating them with the consumer price index (2005=100) of the
World Development Indicators database.

MEASURING COMPETITIVENESS OF AGRO-FOOD INDUSTRIES: THE SWISS CASE – 9
OECD FOOD, AGRICULTURE AND FISHERIES PAPER N°88 © OECD 2015
Market shares on the world market
The export share on the world market is a straightforward performance indicator and it
reflects the outcome of the international competitive process. The difference is taken between
two periods of a country’s export share on the world market. The growth is measured as the
change and not an annual growth rate between two periods, as used for other indicators.
Growth rates of market shares between two periods have a strong flaw. Very small exporters
can have large growth rates, but remain small exporters. Conversely, even with small growth
rates, large exporters will have a larger impact on the market. The definition of this indicator
reflects the strong interdependency between the exports of the different countries. By taking
the absolute change, the real impact on the world market is taken into account. Furthermore,
the total sum of all changes of market shares is by definition zero. Table 2.1 gives an example
of the discussion above taken from (Wijnands, 2007).
Table 2.1. Example of impact of indicators and market shares development
Market share (%)
1996-1998 2002-2004 Change Growth
Country A 1 2 1 100%
Country B 50 51 1 2%
Country C 20 20 0 0%
Country D 29 27 -2 -7%
The mathematical formulation is as follows:
(1)21 ictictict MSMSGES
GESict Growth export share on the world market for industry i for country c between
period t1 and t2
MSict Export share on the world market for industry i for country c in period t
c Selected country
i Selected industry according to classification of NACE
t Selected year
(2) iwt
ictict X
XMS
ictX The export value of industry i, country c in period t.
iwtX The export value of industry i of the world (as a whole) in period t.
Revealed comparative advantage indices
The relative importance of an industry in the total trade is usually measured by the
Revealed Comparative Advantage (RCA) also called Balassa or specialisation index (Fertö
and Hubbard, 2003; Latruffe, 2010; Wijnands, 2008). If it is related to the export, it measures
the export share of a product of one country in the total export of the world relative to the
country’s export share in the world of all products. The relative export advantage index is as
follows:

10 – MEASURING COMPETITIVENESS OF AGRO-FOOD INDUSTRIES: THE SWISS CASE
OECD FOOD, AGRICULTURE AND FISHERIES PAPER N°88 © OECD 2015
(3)
wt
ct
iwt
ict
ict
XTXT
XX
RXA Export value of specific industry i from country c in period t.
ictRXA The relative export advantage index for industry i, country c in period t.
ictX The export value of industry i, country c in period t.
ctXT The total export value of all industries of country c in period t.
wtXT The total export value of all industries in the world in period t.
The total export value of all industries from one country is the total of all export:
unprocessed or processed agriculture commodities, or industrial products or services.
A potential flaw of this index is that re-export might suggest high competitiveness of one
industry. These transit activities might be influenced by a good performance of another
industry, i.e. logistics or by beneficial geographical or infrastructural conditions like sea- or
airports.
A RXA index of 1 indicates that a country is equally specialised as the total world
exports. A level below 1 means relatively unspecialised and above 1 relatively specialised.
The latter indicates an export advantage, as relatively more is exported than the world
average. In fact it indicates the export focus of an industry and is therefore externally oriented.
Again the annual growth between the first and last time period will be used. The index is only
relevant for exporting industries.
The opposite of the relative export advantage index is the relative import advantage index:
(4)
wt
ct
iwt
ict
ict
MTMT
MM
RMA Import value of specific industry i from country c in period t.
ictRMA The relative import advantage index for industry i, country c in period t.
ictM The import value of industry i of country c or of the world w in total in
period t.
ctMT The import value of all industry i of country c or of the world w in total in
period t.
The interpretation of the index is reversed from that of RXA. A value below unity (=1)
shows that a country imports less than the world average and can be indicated as a
competitive advantage; a value above unity indicates a relative higher import level.
High levels or re-export of products, due to comparative advantage of other sectors or
country’s location, might explain a high value.
The Relative Trade Advantage index is defined by Scott and Vollrath as difference
between the RXA and RMA (Scott and Vollrath, 1992).
(5) ictictict RMARXARTA

MEASURING COMPETITIVENESS OF AGRO-FOOD INDUSTRIES: THE SWISS CASE – 11
OECD FOOD, AGRICULTURE AND FISHERIES PAPER N°88 © OECD 2015
A positive RTA indicates a competitive advantage: the exports exceed the imports.
Negative values signify competitive disadvantages (Scott and Vollrath, 1992).
The advantage of these indices is the simplicity to calculate these indicators based on
readily available data. In this report, the values of all three indices are presented. As metrics in
the assessment of the competiveness, the absolute growth between 2 periods of the Relative
Trade Advantage will be used as this index summarises the export and import developments.
This index has an advantage above the indices based on either export or imports (Frohberg
and Hartmanm, 1997). This indicator is a modification of the approach of Wijnands et al.
(2008). A positive growth indicates an increase in domestic supply of that product, meaning
that the industry gains competitiveness compared to other countries.
Other indices based on trade
Several other indicators related to international trade are available, such as the Net Trade
Ratio that expresses the ratio between imports and exports of a country, or the Grubel-Loyd
intra-industry trade index, Porter-adapted index of RXA or the Dunning adapted RXA.
Furthermore, several modifications of the indices mentioned above are discussed in the
literature (Frohberg and Hartmanm, 1997; Gellynck, 2002; Latruffe, 2010). These indices are
not considered as the export and import advantage indices whose interpretation is less
complicated in terms of competitiveness. The Porter and Dunning index include outward and
inbound production. This index is not considered as data from national accounts are used that
include only domestic production, as presented below.
Economic indicators
The selected indicators for quantifying the industry’s competitiveness are taken from
Wijnands et al. (2008). A major disadvantage when assessing the Swiss food competitiveness
is data availability (see below): the preferred measure is value added but data on this variable
could not be retrieved and therefore the turnover has been used as a proxy. Data that are fully
comparable with those of EU countries are available only for the period 2009 to 2011.
Due to insufficient data, turnover is used, as value added was not available, unless
otherwise stated. Therefore, in this section both indicators are indicated by the same acronym.
Growth of real turnover
Creating added value is an important economic indicator. It is related to the industrial
dynamism. Total value added is not only based on the production factor labour but also on the
production factor capital and land. In the study, real turnover of the food industry (or sub-
industry) is used as proxy for value added. The annually growth is taken as an indicator, so
that countries can be compared despite differences in purchasing power parity.
To derive the real turnover, the nominal turnover is deflated by the consumer price index.
(6) ct
ictict
CP
TORTO
ictRTO Real turnover for industry i in in country c for period t
ictTO Nominal turnover for industry i in country c for period t
ctCP Consumer price indicator for country c in period t

12 – MEASURING COMPETITIVENESS OF AGRO-FOOD INDUSTRIES: THE SWISS CASE
OECD FOOD, AGRICULTURE AND FISHERIES PAPER N°88 © OECD 2015
Real turnover shares in the manufacture industry
The importance of a specific sub-industry is derived from its turnover share in the food
industry. A growth in the share reflects a competitive advantage. The industry is then able to
attract resources for their production. This reflects the competition for production factors
(labour and/or capital) between different industries within a country.
The manufacturing industry is used for comparison, both for a sub-industry of the food
industry, e.g. dairy processing, or the food industry as a whole. The metrics is the growth of
the turnover share of the specific industry in the food industry. A positive growth shows a
better than average performance than the food industry as a whole.
(7) mct
ictict
RTO
RTOSRTO
itSRTO Share of the real value added/ turnover for industry i in total manufacturing
industry (m) in country c for period t
m Manufacturing industry as a whole
Labour productivity based on real turnover
Labour productivity affects prices in the market. Growth of labour productivity improves
industrial competitiveness in international markets. Labour productivity is often seen as a
crucial determinant of competitiveness. Labour productivity is the real value added (or
turnover) divided by the number of employees. This indicator cannot be compared between
different countries due to different levels of Purchasing Power Parities. As the growth rate of
labour productivity is taken, the indices of different countries can be compared.
(8) ict
ictict
E
RTORLP
ticRLP is real labour productivity for industry i in country c for period t
ictE is number of employees in industry i in country c for period t
Exchange rates
All indicators are growth percentages. Growth percentages are not influenced by
exchange rates, so they can be calculated in the original currency. The nominal values in
the descriptive parts are all converted to euros with the exchange rate as published by
Eurostat.
Competitiveness assessment and presentation
Annual growth rates of the indices
According to Porter, sustainable competitive advantage is the fundamental source for
above-average performance in the long run (Porter, 1980; Porter, 1990). In line with this
view, competitiveness of the food industry is defined as the sustained ability to achieve
profitable gain and market share in domestic and export markets in which the industry is
active. Annual growth rates (except for market shares on the world market and for the relative
trade advantage index) between two periods are used as indicators. High growth rates indicate
high ex post performance, compared to other industries of a particular country.

MEASURING COMPETITIVENESS OF AGRO-FOOD INDUSTRIES: THE SWISS CASE – 13
OECD FOOD, AGRICULTURE AND FISHERIES PAPER N°88 © OECD 2015
Comparison of indicators and overall competition
The food industries will be benchmarked against a number of selected countries. The
above-mentioned indicators have different scales. To compare the different scales the values
are standardised around the mean by using a Z-transformation:
iX is observation i=1,n (ic number of countries)
n
XX
i
n
)XX(s
2i
s
XXz i
i
As a result of this transformation all variables will have the same scale and are
dimensionless and can then easily be presented in one figure. Furthermore, the mean of these
values can be calculated as an indication of the overall competitiveness. In this case, the
implicit assumption is that all indicators have equal weight or importance. While it is possible
to impose different weights for each indicator, no empirical evidence is currently available
that would provide a basis for using different weights.
However, this method also has a disadvantage. The standard scores depend on the number
of the countries and the levels of indicators in the sample: the standard scores are not fixed. It
is in fact a benchmark, and if the benchmark countries or the level of one indicator in one
country changes, the position of the countries will also change. It is a relative position.
Annex 1 provides for the food industry the calculated values and Z-score of the indicators
for the food industry.
2.3. Data sources and industry classification
Industry classification
The industry classification is taken from the EU NACE rev. 2 system, which is used from
2005 onward. Before 2005, the NACE rev. 1.1 system was in force. The two systems are
linked together based on the correspondence table provided by Eurostat (EC, 2008). The
NACE system distinguished industries at a 4-digit level. In this report, the analyses are based
on a 3-digit level. Switzerland has a similar system called NOGA. In 1995, the Swiss Federal
Statistical Office adopted the European NACE system. “Therefore, both classifications are
identical up to level 4 ... ” p6 (FSO, 2008). Table 2.2 presents the industries taken into
account. Level “C” manufacturing is used as benchmark for the food industry. As beverages
are not part of the food industry C10 in the NACE rev 2 system, but is in the NACE rev 1.1
system and in the NOGA system, C11 is added (which is identical to C110) to C10 as “Food
total”.

14 – MEASURING COMPETITIVENESS OF AGRO-FOOD INDUSTRIES: THE SWISS CASE
OECD FOOD, AGRICULTURE AND FISHERIES PAPER N°88 © OECD 2015
Table 2.2. Industries taken into account according to the NOGA/NACE classification
# NACE/ NOGA
Description Short name
1 C Manufacturing Manufacturing total
2 C10 (+C11)
Manufacture of food and beverages products Eurostat does not include C11 beverages in C10, in the NACE rev1.1, beverages were a part of the food industry just as in FBS NOGA statistics.
Food total
3 C101 Processing and preserving of meat and production of meat products
Meat
Not included
C102 Processing and preserving of fish, crustaceans and molluscs Seafood
4 C103 Processing and preserving of fruit and vegetables Fruit and vegetable
5 C104 Manufacture of vegetable and animal oils and fats Oils and fats
6 C105 Manufacture of dairy products Dairy
7 C106 Manufacture of grain mill products, starches and starch products Cereals and starches
8 C107 Manufacture of bakery and farinaceous products Bakery
9 C108 Manufacture of other food products Other food
10 C109 Manufacture of prepared animal feeds Animal feeds
11 C110 Manufacture of beverages Beverages
Data sources
This section discusses the main data sources for assessing the competitiveness of the
Swiss food industry: Trade data and Structural Business data. Next to these two main sources
other public accessible statistics are used, for instance from the FAO (FAOstat) or from the
World Bank (World Development Indicators).
Trade flows: UNcomtrade data
Trade data for all countries are taken from UNComtrade database. That database provides
a consistent set of data for trade flows of products for all countries. In this study however, the
focus is on industries as aggregation of enterprises and not on commodities or products.
Therefore, the codes of commodities have to be linked to the industries codes (see above) in a
correspondence table. Based on that aggregation, the market share and trade advantage
indices are calculated for the selected sub-industries. Raw materials trade is not linked to the
business data; processed foods are only linked to the food industries and sub-industries.
EU structural business statistics
The data source for the business economic data for EU countries is the Structural
Business Statistics (SBS) from Eurostat. This database provides data for all countries of the
EU. The NACE rev 1.1 is used from 1995 to 2008 and the NACE rev 2 version is used from
2008 to 2011. This database provides the information for the economic indicators (see above).
In addition, this database provides similar data of the Swiss food industry for the years 2009-
2011, but not for previous years. Data for previous years are selected from other sources. For
the EU countries, the period 2001 to 2011 is used.

MEASURING COMPETITIVENESS OF AGRO-FOOD INDUSTRIES: THE SWISS CASE – 15
OECD FOOD, AGRICULTURE AND FISHERIES PAPER N°88 © OECD 2015
Swiss Value Added Tax (Mehrwertsteuer) data
Swiss companies have no legal obligations to file their accounts, like most EU countries.
Public quoted companies make their financial statements available and in general, these are
the source to construct national account data. However, the national accounts distinguish
industries at 2-digit level: e.g. “C10 Manufacture of food products” and as a consequence,
data for the food industry at 3-digit level is lacking. The value added tax statistics (BFS,
2013) as well the employment statistics (see website STAT-TAB in reference list) provide
information at 3-digit NOGA level.
The tax statistics provide annual information from 1995 onwards on a number of
enterprises and turnover3. However, due to revision of the tax law a trend break occurred in
2009. For 2008, observations for the old and new system are available. As the series for the
old system was until 2008, corrected the data of the new system with the ratio between the old
and new system in 2008. This ratio has been calculated for each sub-sector of the food
industry. In this way, a time series was constructed indicating the turnover and number of
firms for the period 1995 until 2011.
The labour statistics provide information for 1995, 2001, 2005 and 2008, restricting the
possibilities of choosing years for comparison. Because of the labour data availability,
economic data for the period 2001-2008 for Switzerland for the labour productivity is used.
For other economic indicators the period 2001 to 2011 is used.
2.4. Benchmark countries selected on trade relation
As competitiveness is a relative concept, the performance of the Swiss food industries
should be compared with the food industries in benchmark countries. Because the EU is by
far the main market for the Swiss food industry, the study compares Switzerland with selected
EU countries. The benchmark countries are selected on the following criteria:
Countries that have a strong trade relationship with Switzerland;
EU countries that have a comparable level of GDP per capita.
A “strong” trade relationship is defined as export to an EU country above 5% of the total
exports to the EU or the imports from an EU country above 5% of the total imports of the EU
by Switzerland. The selected benchmark countries represent 86% of the total export to the
EU-28 and 89% of all imports.
Table 2.3. Agricultural Swiss export to other countries and import by Switzerland in 2012
# Country Export Import
(Million USD) (%) (Million USD) (%)
2 Austria 299 5.7 380 4.4
3 France 1 017 19.3 1 689 19.4
4 Germany 1 421 26.9 1 959 22.5
5 Italy 485 9.2 1 785 20.5
6 Netherlands 367 7.0 855 9.8
7 Spain 386 7.3 833 9.6
8 United Kingdom 542 10.3 215 2.5
Other EU countries 757 14.3 976 11.3
Source: (Calculation based on) UNComtrade.
3. The turnover statistics in Switzerland include enterprises with a minimum turnover of
CHF 100 000. Enterprises with less turnover are not considered.

16 – MEASURING COMPETITIVENESS OF AGRO-FOOD INDUSTRIES: THE SWISS CASE
OECD FOOD, AGRICULTURE AND FISHERIES PAPER N°88 © OECD 2015
Values of import from and export to EU countries by Switzerland provide information on
the agricultural trade relationships. Trade concerns all agricultural products within the code
HS 01 to HS 23. Table 2.3 provides an overview of the EU countries that meet the
aforementioned definition. This selection includes all neighbouring countries and the largest
countries in the EU-15.
In 2012, Switzerland had a GPD per capita of USD 79 000, higher than all EU countries
except for Luxembourg. Regarding the second selection criterion, Italy and Spain might be
included as well, due to rather low GDP per capita. Excluding Italy results in excluding an
import trade partner and neighbouring country. This would not be desirable for the analysis.
Spain is slightly less important as trade partner compared to Italy, but Spain is included as
well as a benchmark country. The countries in Table 2.3 represent 86% of the Swiss export
value to the European Union and 89% of the Swiss import value from the European Union.
Table 2.4 presents a few characteristics of Switzerland and the benchmark countries. Of
all selected countries, Switzerland has the smallest population and smallest area of
agricultural land. A relatively small population indicates a relatively low demand for food.
The land area per capita indicates the domestic production possibilities of raw materials: in
Switzerland it is at the same level as Germany and Italy, above the area per capita in the
Netherlands and below the other countries.
Table 2.4. Characteristic of the economies of Switzerland and benchmark countries in 2012
Country Population GDP GDP/capita Agricultural land (in 2011)
(Million) (Billion USD) (1 000 USD) (Million ha) Sq. Metres/ capita
1 Switzerland 8.0 631.2 78.9 1.5 1 904
2 Austria 8.5 394.7 46.6 2.9 3 390
3 France 65.7 2 612.9 39.8 29.1 4 428
4 Germany 81.9 3 428.1 41.9 16.7 2 042
5 Italy 60.9 2 014.7 33.1 13.9 2 287
6 Netherlands 16.8 770.6 46.0 1.9 1 130
7 Spain 46.2 1 323.0 28.6 27.5 5 957
8 United Kingdom
63.2 2 471.8 39.1 17.2 2 715
Source: World Development Indicators.
3. Competitiveness of the Swiss food industries
3.1. Swiss food industries: An overview
Structure of the food industry
“Other food” manufacturing accounts for the majority of the Swiss food industry’s
turnover and exports. The group other food “includes the production of sugar and
confectionery, prepared meals and dishes, coffee, tea and spices, as well as perishable and
specialty food products” (EC, 2008). The dairy industry has the most enterprises and is
second in turnover. Beverages manufacturing takes a quarter of the exports and imports of the
processed food. In terms of turnover and trade, manufacturing of “other food” determines the
food industry with a share of 60% in the total turnover of the food & beverage industry. Other
important sectors are dairy (12% share in the food industry), meat (10%) and beverages (8%).
The remaining sub-industries count for 12% of the total turnover. However these remaining
industries have a significant share of 42% in the number of employees and are dominated by
relatively small scale firms (Table 3.1.).

MEASURING COMPETITIVENESS OF AGRO-FOOD INDUSTRIES: THE SWISS CASE – 17
OECD FOOD, AGRICULTURE AND FISHERIES PAPER N°88 © OECD 2015
Table 3.1. Key-figures of the Swiss food industrya
NACE Manufacturing Industry
Enterprises
2011
Turnover
2011
Employees
2008
Export
2012
Import
2012
Number % Billion EUR
% 1 000 % Million USD
Million USD
C10&11 Food total 2 410 100 41.6 100 73.1 100 7 889 100 8 237 100
C101 Meat 257 10.7 4.1 9.9 11.9 16.3 113 1 943 11
C103 Fruit and vegetable
67 2.8 0.7 1.7 2.2 3.0 224 3 714 9
C104 Oils and fats 21 0.9 0.4 1.0 0.4 0.5 83 1 385 5
C105 Dairy 768 31.9 4.9 11.8 8.2 11.2 761 10 516 6
C106 Grain and starches
89 3.7 0.6 1.4 1.3 1.8 11 0 93 1
C107 Bakery 219 9.1 2.1 5.0 14.6 20.0 728 9 743 9
C108 Other food 471 19.5 24.4 58.7 15.1 20.7 3 896 49 1 760 21
C109 Animal feeds 142 5.9 1.3 3.1 1.9 2.6 214 3 575 7
C110 Beverages 367 15.2 3.2 7.7 7.1 9.7 1 851 23 1 901 23 a
Sum of sub-sector differs from Food total, because C102 “Processing and preserving of fish, crustaceans and molluscs” is not included.
Source: LEI calculation based on FBS and UNComtrade.
The Swiss food industry is a net exporter of “other food” products and dairy products.
Other food manufacturing (C108) amounts to around 59% of the turnover and half of the
exports. The sub-industry “Processing and preserving of fish, crustaceans and molluscs” C102
is not included in the study. This industry has a substantial import: 7% of total food industry
imports. The Swiss food industries are “specialised importers” of beverages and bakery
products: the Relative Import Advantage (RMA) indices are above unity in 2012: 1.6 and 1.2
respectively. On the other hand, they are also specialised exporters with a Relative Export
Advantage (RXA) indices above unity for beverages (RXA=1.3) and other food products
(RXA=1.8) in 2012. For “other food” and dairy the Swiss food industry is a net exporter.
Table 2.3 above presents the trade relations with the selected EU-countries
Competitiveness of all sub-sectors
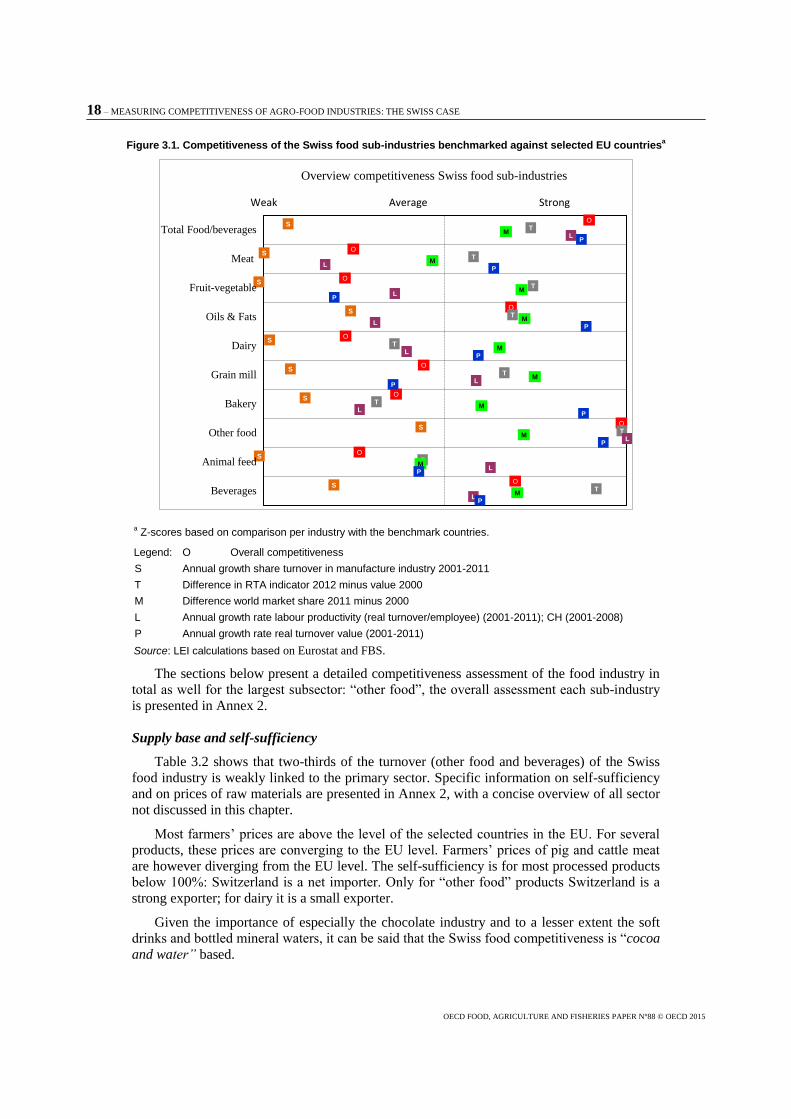
Figure 3.1 presents the competitiveness of all sub-industries of the Swiss food industry.
Some observations are:
The growth of the turnover share of each food industry or sub-industry in total
manufacturing (S) is below average, despite the strong growth of the food industry.
The growth of the manufacturing industry was higher than of the food industry. The
competitiveness for means of production is thus strong. In this respect, the overall
food industry is weak. However, this weak position did not hamper the industry to
have above growth levels of the turnover (P), meaning that the food industry is able
to attract sufficient means of production by paying a competitive price.
The share on the world market (M) increased for most of the industries and sub-
industries because of higher export rates than world average: meat and feed is below
average.
The competitiveness of the food & beverage industry is largely based on the sub-
industry “other food” that had a large share (Table 3.1) in the total turnover and a
strong growth rate.
18 – MEASURING COMPETITIVENESS OF AGRO-FOOD INDUSTRIES: THE SWISS CASE
OECD FOOD, AGRICULTURE AND FISHERIES PAPER N°88 © OECD 2015
Figure 3.1. Competitiveness of the Swiss food sub-industries benchmarked against selected EU countriesa
a Z-scores based on comparison per industry with the benchmark countries.
Legend: O Overall competitiveness
S Annual growth share turnover in manufacture industry 2001-2011
T Difference in RTA indicator 2012 minus value 2000
M Difference world market share 2011 minus 2000
L Annual growth rate labour productivity (real turnover/employee) (2001-2011); CH (2001-2008)
P Annual growth rate real turnover value (2001-2011)
Source: LEI calculations based on Eurostat and FBS.
The sections below present a detailed competitiveness assessment of the food industry in
total as well for the largest subsector: “other food”, the overall assessment each sub-industry
is presented in Annex 2.
Supply base and self-sufficiency
Table 3.2 shows that two-thirds of the turnover (other food and beverages) of the Swiss
food industry is weakly linked to the primary sector. Specific information on self-sufficiency
and on prices of raw materials are presented in Annex 2, with a concise overview of all sector
not discussed in this chapter.
Most farmers’ prices are above the level of the selected countries in the EU. For several
products, these prices are converging to the EU level. Farmers’ prices of pig and cattle meat
are however diverging from the EU level. The self-sufficiency is for most processed products
below 100%: Switzerland is a net importer. Only for “other food” products Switzerland is a
strong exporter; for dairy it is a small exporter.
Given the importance of especially the chocolate industry and to a lesser extent the soft
drinks and bottled mineral waters, it can be said that the Swiss food competitiveness is “cocoa
and water” based.
O
O
O
O
O
O
O
O
O
O
S
S
S
S
S
S
S
S
S
S
T
T
T
T
T
T
T
T
T
T
M
M
M
M
M
M
M
M
M
M
L
L
L
L
L
L
L
L
L
L
P
P
P
P
P
P
P
P
P
P
Total Food/beverages
Meat
Fruit-vegetable
Oils & Fats
Dairy
Grain mill
Bakery
Other food
Animal feed
Beverages
Overview competitiveness Swiss food sub-industries
Weak Average Strong

MEASURING COMPETITIVENESS OF AGRO-FOOD INDUSTRIES: THE SWISS CASE – 19
OECD FOOD, AGRICULTURE AND FISHERIES PAPER N°88 © OECD 2015
Table 3.2. Overview of raw material supply and self-sufficiency
Product Production raw materials Price raw materials Self-sufficiency
Meat Cattle and pig meat declining
Poultry strongly increasing
All above benchmark countries
Poultry prices converging
Cattle and pig meat diverging
Not self-sufficient in meat
Net importer of meat products
Fruit and Vegetables
Little information available, relatively small production
Apples and Potatoes declining
Apples above EU, below the UK level. Diverging
Potatoes above EU level, converging
Net importer of processed products
Net exporter of apples Net importer of potatoes
Twenty per cent self- sufficiency in tomatoes
Oils and fats
Few oilseeds produced
Rapeseed slightly increasing
Above EU countries, converging
Net importer of oils and fats
Dairy Milk production slightly increasing
Above EU countries, converging
Net exporter of dairy products
Grain mill and starches
Wheat is largest product
Wheat production declined slightly
Above EU countries, converging
Price peak in 2008 mitigated in Switzerland
Net importer of grain mill and starches products
Bakery See grain mill Very small net importer
Other food Mainly footloose based on imported products such as cocoa
Large net exporter
Net importer of sugar
Animal feed
No information Net importer, especially oil cakes
Beverages Stable production of wine grapes
No specific information for other raw materials
Prices of grapes are far above the EU level
Small net importer of beverages
Self-sufficient in grapes for wine
3.2. Manufacturing of food & beverages products
Manufacturing of foods products (NACE code C10) includes the processing of the
products of agriculture, forestry and fishing into food for humans or animals, and includes the
production of various intermediate products that are not directly food products. Beverages
products are added to this category. The category beverages (NACE code C11) includes
manufacture of beverages, such as non-alcoholic beverages and mineral water, manufacture of
alcoholic beverages mainly through fermentation, beer and wine, and the manufacture of
distilled alcoholic beverages (EC, 2008).
The overall competitiveness (O) of the Swiss food industry is the strongest of all selected
countries, due to a strong “other food manufacturing” sector. The main developments indicate
that:
The share of the turnover of the food industry in total manufacture (S) declined in
Switzerland and Germany. Other countries showed a growth, the small growth rate in
Austria and the Netherlands were below average. The food industry’s share (9.6%) in
the manufacturing turnover is among the lowest and almost half the level of Spain or
the Netherlands.
The growth rate of the real turnover (P) of the food is the strongest and above the levels
of the Netherlands (second strongest) and Austria (third).
The growth rate of the labour productivity (real turnover per employee (L)) is also the
strongest compared to all benchmark countries except the Netherlands.

20 – MEASURING COMPETITIVENESS OF AGRO-FOOD INDUSTRIES: THE SWISS CASE
OECD FOOD, AGRICULTURE AND FISHERIES PAPER N°88 © OECD 2015
The change in the Swiss Relative Trade Advantage (T) index is above average.
Switzerland remained a small net importer of food products. The export grew at a
higher level than the imports.
The performance of the export share on the world market (M) of Switzerland is above
average: Switzerland gained market share. Germany gained a significant share of 0.5%.
France – one of the leading EU exporters – lost market share.
In addition, the following observations are made:
The total turnover of the Swiss food industry grew quicker than all selected countries.
However, the total turnover is among the smallest of all countries, just like the
population size.
“Other food” manufacturing (C108) is most competitive and takes two-thirds of the
turnover and half of the exports. It is the most important food-manufacturing sub-sector
(Section 3.3). The sub-sector chocolate manufacturing grew rapidly and had a share of
around 50% in the turnover in 2011 in the “other food” sector.
The distribution of the firm sizes is skewed: the 3% largest firms account for 60% of
the turnover.
Figure 3.2. Competitiveness of the food & beverages industry (detailed data in Annex 1)
Legend: O Overall competitiveness
S Annual growth share turnover in manufacture industry, 2001-2011
T Difference in RTA indicator 2012 minus value 2000
M Difference world market share 2011 minus 2000
L Annual growth rate labour productivity (real turnover/employee) (2001-2011); CH (2001-2008)
P Annual growth rate real turnover value (2001-2011)
Source: LEI calculations based on Eurostat and FBS.
O
O
O
O
O
O
O
O
S
S
S
S
S
S
S
S
T
T
T
T
T
T
T
T
M
M
M
M
M
M
M
M
L
L
L
L
L
L
L
L
P
P
P
P
P
P
P
P
Switzerland
Austria
Germany
Spain
France
Italy
Netherlands
UK
Manufacture of food products and beverages (C10-C11)
Weak Average Strong

MEASURING COMPETITIVENESS OF AGRO-FOOD INDUSTRIES: THE SWISS CASE – 21
OECD FOOD, AGRICULTURE AND FISHERIES PAPER N°88 © OECD 2015
Structure and economic indicators of the food processing industry
The Swiss food industry is one of the smallest of all selected countries in terms of
turnover and number of enterprises. However, in turnover it is 2.5 times the Austrian food
industry: both countries have the lowest population with around 8 million inhabitants. The
growth of the turnover is the highest of all countries as is the average turnover per enterprise.
Table 3.3. Structure of the food & beverages industry in 2011
Country Turnover Enterprises Average turnover
per enterprise
Employees
Billion
(EUR)
Growtha
(%)
Number Growtha
(%)
Million
(EUR)
Growtha
(%)
1 000 Growtha
(%)
Switzerlanda 41.6 5.8 2 410 -1.0 17.3 6.8 73.1 0.0
Austria 19.3 4.6 3 837 -1.0 5.0 5.7 77.5 -0.1
Germany 180.4 2.4 32 204 -1.0 5.6 3.4 887.5 0.8
Spain 101.5 3.6 27 722 -1.3 3.7 5.0 365.9 -0.1
France 168.9 1.9 59 405 -1.2 2.8 3.1 604.4 -0.4
Italy 124.3 2.5 58 074 -1.6 2.1 4.2 433.5 0.0
Netherlands 62.9 3.7 4 477 -1.2 14.1 5.0 125.3 -2.5
United Kingdom 105.8 0.0 7 492 -0.3 14.1 0.2 376.3 -3.0
a Annual growth rate from 2001 to 2011. Swiss labour data are for 2008 and growth rate2001-2008.
Source: Eurostat for EU countries and BFS for Switzerland.
The distribution of the firm sizes is skewed: the 3% largest Swiss firms count 60% of the
turnover, the 13% largest counts 80 (2009) to 85% (2012). The skewedness increased in the
period 2009 to 2011. Furthermore all Swiss food sub-industries show such skewedness as
well as the food industries in most other countries. For this reason, the size and turnover
distribution for the food industry sub-industries will not be discussed further.
Figure 3.3. Lorenz curve of number of firms and turnover of the food industry (beverages excluded)
Source: Based on Eurostat.
Despite the strong growth of the turnover of the food industry, other manufacturing grew
at a higher pace and hence the share of the food industry in the manufacturing industry
declined in the period 2001-2011. In all other selected countries except Germany, the share of the food industry remained at the same level or increased. Second, the labour productivity
0
10
20
30
40
50
60
70
80
90
100
0 10 20 30 40 50 60 70 80 90 100
Turn
over
Number
2011 Food (C10)
Germany
Spain
France
Italy
Austria
UK
Netherlands
Switzerland
Equality

22 – MEASURING COMPETITIVENESS OF AGRO-FOOD INDUSTRIES: THE SWISS CASE
OECD FOOD, AGRICULTURE AND FISHERIES PAPER N°88 © OECD 2015
increased with almost the highest growth percentage far above all other countries. Only the
Netherlands showed a slightly higher growth pace.
Table 3.4. Share of food industry in manufacturing and labour productivity (based on turnover)
Country Share in manufacturing turnover Labour productivity
(EUR 1 000 turnover per employee)
2001 (%) 2011 (%) Growtha (%) 2001 2011 Growth
a (%)
Switzerland a 11.8 9.6 -2.0 319 482 6.1
Austria 11.0 11.1 0.2 153 191 2.2
Germany 9.6 9.2 -0.4 165 167 0.1
Spain 17.5 21.6 2.1 193 208 0.8
Francea 14.8 18.8 2.4 212 226 0.6
Italy 11.7 13.5 1.4 216 219 0.1
Netherlands 18.9 20.3 0.7 255 483 6.6
United Kingdom 14.3 17.9 2.3 202 195 -0.3
a Annual growth rate from 2001 to 2011. Swiss labour data are for 2008 and growth rate2001-2008.
Source: Eurostat for EU countries and BFS for Switzerland.
Trade in food products and trade indicators
The export of processed food and beverages products of Switzerland grew fast (15.2%)
and above the world average (12.6%). The share on the world market increased. On the other
hand, the Swiss import grew less than world average resulting in a smaller share as importer
of food from the world market. Switzerland is a small trader, just as Austria with shares of
around 1% on the export or import world market: the other countries have higher shares. As
largest exporter and importer, Germany has shares of 7%. France has lost its position: the
export share decreased from 8.5% in 2000 to 6.0% in 2012. The UK is the largest net importer
and the Netherlands the largest net exporter of the selected countries. The export-import
balance is slightly negative for Switzerland, which is a net importer. The Relative Trade
Advantage for Switzerland is just smaller than -0.2, indicating a non-specialised importer.
Table 3.5. Trade and market shares in food and beverages products
Country Export Import
Export 2012
(Million USD)
Growth 2000 -
2011 (%)
Market share
2000 (%)
Market share
2011 (%)
Import 2012
(Million USD)
Growth 2000 -
2011 (%)
Market share
2000 (%)
Market share
2011 (%)
Switzerland 7 889 15.2 0.6 0.9 8 237 9.2 1.1 1.0
Austria 10 069 13.9 0.9 1.1 9 248 12.1 0.9 1.1
Germany 64 446 12.5 6.4 7.1 59 075 10.2 7.4 7.1
Spain 29 024 11.1 3.1 3.0 23 520 9.7 3.2 2.9
France 53 620 7.8 8.5 6.0 43 276 9.1 5.9 5.0
Italy 32 574 10.2 4.0 3.6 32 122 9.0 4.7 3.9
Netherlands 59 633 11.3 6.8 6.7 41 461 12.9 3.7 4.6
United Kingdom 26 212 7.7 4.2 2.9 47 147 8.2 6.9 5.3
Source: LEI calculation based on UNComtrade

MEASURING COMPETITIVENESS OF AGRO-FOOD INDUSTRIES: THE SWISS CASE – 23
OECD FOOD, AGRICULTURE AND FISHERIES PAPER N°88 © OECD 2015
Figure 3.4. Processed food and beverage trade indicators
Source: LEI calculations based on UNComtrade.
3.3. Manufacture of “other food” products
This group “other food” (Nace code C108) “includes the production of sugar and
confectionery, prepared meals and dishes, coffee, tea and spices, as well as perishable and
specialty food products” (EC, 2008). With59% share in the total food processing industry
this is the largest sub-sector. The overall competitiveness (O) of the Swiss “other food”
processing industry (C108) is very strong compared to the benchmark countries. The main
developments indicate that:
The share of the turnover of the “other food” products industry in total manufacture
(S) increased in Switzerland, however stronger in several benchmark countries. Thus,
Switzerland is performing lower than average on this indicator.
The growth of the real turnover (P) of the “other food” industry is rather strong and
the highest of all selected countries.
The growth of the labour productivity (real turnover per employee (L)) is strong
above average. In the period 2001 to 2008, the growth was 14% annually far above
the second in rank: the Netherlands with a growth of 3% annually.
The Relative Trade Advantage (T) index of Switzerland outperforms all other
countries. Switzerland is a net-exporter of “other food” products.
-2.5 -2.0 -1.5 -1.0 -0.5 0.0 0.5 1.0 1.5 2.0 2.5 3.0
RXA
RMA
RTA
RXA
RMA
RTA
RXA
RMA
RTA
RXA
RMA
RTA
RXA
RMA
RTA
RXA
RMA
RTA
RXA
RMA
RTA
RXA
RMA
RTAU
KN
LIT
FR
ES
DE
AT
CH
Trade indicators (Manufacture of food products and beverages)
2012 2005 1995

24 – MEASURING COMPETITIVENESS OF AGRO-FOOD INDUSTRIES: THE SWISS CASE
OECD FOOD, AGRICULTURE AND FISHERIES PAPER N°88 © OECD 2015
In addition, the performance of the export share on the world market (M) of
Switzerland is the strongest.
In addition, the following observations are made:
The sub-industry “other food products” is a rather diverse industry and includes
among others manufacturing of sugar, chocolate, tea, coffee, condiment, seasonings,
prepared meals, food preparations and dietetic food. It is the largest food sub-industry
in turnover, employment and trade.
Cocoa and chocolate manufacturing takes around half of the turnover of the “other
food” industry. This industry is largely footloose: the raw materials are imported.
The Swiss average turnover per enterprise is the highest of all selected countries: 3 to
15 times higher than in other countries.
Figure 3.5. Competitiveness of the “other food products” industry
Legend: O Overall competitiveness
S Annual growth share turnover in manufacture industry 2001-2011
T Difference in RTA indicator 2012 minus value 2000
M Difference world market share 2011 minus 2000
L Annual growth rate labour productivity (real turnover/employee) (2001-2011); CH (2001-2008)
P Annual growth rate real turnover value (2001-2011)
Source: LEI calculations based on Eurostat and FBS.
Structure and economic indicators of the “other food” processing industry
The turnover of the “other food” industry in Switzerland grew extremely fast: 10%
annually, far above the levels of other countries that also have significant growth figures. The
number of enterprises grew at a slower pace resulting in a strong growth of the average
turnover per enterprise. The Swiss average turnover is 2.5 times higher than in the
Netherlands and Germany (the second and third highest) and 15 times higher than in Italy (the
O
O
O
O
O
O
O
O
S
S
S
S
S
S
S
S
T
T
T
T
T
T
T
T
M
M
M
M
M
M
M
M
L
L
L
L
L
L
L
L
P
P
P
P
P
P
P
P
Switzerland
Austria
Germany
Spain
France
Italy
Netherlands
UK
Manufacture of other food products (C108)
Weak Average Strong

MEASURING COMPETITIVENESS OF AGRO-FOOD INDUSTRIES: THE SWISS CASE – 25
OECD FOOD, AGRICULTURE AND FISHERIES PAPER N°88 © OECD 2015
lowest). Despite this turnover growth, the number of employees declined only in Switzerland.
In addition, Switzerland ranks third in the total turnover after Germany and France.
Table 3.6. Structure of the “other food” industry in 2011
Country Turnover Enterprises Average turnover
per enterprise
Employees a
Billion
(EUR)
Growtha
(%)
Number Growtha
(%)
Million
(EUR)
Growtha
(%)
1,000 Growtha
(%)
Switzerlanda 24.4 10.0 471 3.1 51.9 6.7 15.1 -0.6
Austria 2.1 5.5 175 5.2 11.8 0.2 7.3 2.3
Germany 30.9 1.8 1 455 7.2 21.2 -5.0 101.5 1.3
Spain 10.8 3.6 2 480 -2.4 4.3 6.1 45.6 0.7
France 25.7 2.3 3 737 5.9 6.9 -3.4 79.5 3.2
Italy 19.9 4.0 5 443 1.7 3.7 2.3 57.6 3.0
Netherlands 11.3 6.8 521 5.5 21.7 1.2 22.4 4.1
United Kingdom 19.6 2.1 1 242 -0.2 15.8 2.3 92.3 2.2
a Annual growth rate from 2001 to 2011. Swiss labour data are for 2008 and growth rate2001-2008.
Source: Eurostat for EU countries and BFS for Switzerland.
The industry “Manufacture of other food products”, NACE C108, is a rather diverse
industry and is subdivided into 7 sub-industries (see table 3.7). Almost half of the turnover
comes from the cocoa and chocolate manufacturing in 2011. The share of this sub-industry
grew strongly from 20% in 2001 to 47% in 2011 of the total of the “other food” industry. It
will be clear that the turnover of sub-industry cocoa and chocolate manufacturing grew
extremely: 18% annually. Switzerland exports mainly luxury chocolate products (an export
value share of over 90%) with relatively high prices. Also Germany the largest exporter of
cocoa based products has a high share (over 80%) in the high value products. The
Netherlands, the second largest exporter of the benchmark countries, has a more diversified
export portfolio with 40% of luxury products and the remaining part mainly as intermediate
processed commodities like cocoa butter, paste or powder.
Table 3.7. Distribution of the sub industries of the “Manufacture of other food products” industry
NOGA/NACE Description 2001 2011
Number
(%)
Turnover
(%)
Number
(%)
Turnover
(%)
108 Manufacture of other food products 100.0 100.0 100.0 100.0
1082 Manufacture of cocoa, chocolate and sugar confectionery
24.8 22.4 21.4 48.1
108201 Manufacture of cocoa, chocolate 11.8 19.6 13.6 46.8
108202 Manufacture of sugar confectionery 13.0 2.8 7.8 1.4
1083 Processing of tea and coffee 18.4 2.3 16.7 2.0
1084 Manufacture of condiments and seasonings 8.1 4.0 5.7 0.7
1085 Manufacture of prepared meals and dishes 17.0 0.9 7.2 2.5
1086 Manufacture of homogenised food preparations and dietetic food
8.1 2.1 9.3 0.7
1089; 1081 Manufacture of sugar and Manufacture of other food products n.e.c.
23.6 68.3 39.6 45.9
Source: BFS Mehrwertsteuer Schweiz.

26 – MEASURING COMPETITIVENESS OF AGRO-FOOD INDUSTRIES: THE SWISS CASE
OECD FOOD, AGRICULTURE AND FISHERIES PAPER N°88 © OECD 2015
The industry is largely footloose: the raw materials have to be imported and are not
produced in the country itself, such as cocoa, tea or coffee. Hence, the raw materials base is
also rather diverse, mainly based on imports or intermediate products from other industries.
Sugar beets are grown in Switzerland, but the country is a net-importer of refined sugar. The
self-sufficiency of refined sugar equivalents is around between 50 and 60%.
The Swiss share of the “other food” industry in total manufacturing was already the
highest of all selected countries and increased. However, the annually growth was in most of
the other countries even stronger compared to total manufacturing. In Swiss labour
productivity (real turnover per employees) is by far the highest of all countries and the growth
of this indicator outperforms all other countries.
Table 3.8. Share of “other food” industry in manufacturing and labour productivity (based on turnover)
Country Share in manufacturing turnover Labour productivitya
(EUR1 000 turnover per employee)
2001 (%) 2011 (%) Growtha (%) 2001 2011 Growth
a (%)
Switzerland a 4.7 5.6 1.9 587 1 497 14.3
Austria 1.1 1.2 1.0 200 215 0.7
Germany 1.7 1.6 -1.0 275 250 -1.0
Spain 1.8 2.3 2.2 177 177 0.0
Francea 2.2 2.9 2.8 333 261 -2.4
Italy 1.6 2.2 2.9 300 264 -1.3
Netherlands 2.5 3.6 3.8 363 485 2.9
United Kingdom 2.1 3.3 4.5 207 147 -3.3
a Annual growth rate from 2001 to 2011. Swiss labour data are for 2008 and growth rate2001-2008.
Source: Eurostat for EU countries and BFS for Switzerland
Trade in “other food” and trade indicators
Switzerland strengthened its position on the export market, due to an above average
growth rate: the world market grew with 13.9%, the Swiss export with 16.4% in the period
2000-2011. Switzerland is a net exporter. Compared to the other benchmark countries, the
Swiss trade is among the smallest: Germany, the Netherlands and France exports and imports
are significant higher levels.
Table 3.9. Trade and market shares in “other food”
Country Export Import
Export 2012
(Million USD)
Growth 2000 -
2011 (%)
Market share
2000 (%)
Market share
2011 (%)
Import 2012
(Million USD)
Growth 2000 -
2011 (%)
Market share
2000 (%)
Market share
2011 (%)
Switzerland 3 896 16.4 1.7 2.5 1 760 11.3 1.3 1.2
Austria 1 672 13.2 1.0 1.1 2 138 12.5 1.3 1.3
Germany 14 093 13.0 8.4 8.8 10 308 11.1 7.4 6.5
Spain 3 072 10.9 2.2 1.9 4 030 12.9 2.7 2.8
France 7 519 7.9 7.4 4.7 8 078 10.8 6.0 5.1
Italy 5 323 12.8 3.1 3.1 4 270 12.3 2.6 2.6
Netherlands 10 896 13.8 6.2 7.0 7 030 14.6 3.8 4.7
United Kingdom 3 883 6.0 4.6 2.4 8 370 8.8 7.3 5.1
Source: LEI calculation based on UNComtrade

MEASURING COMPETITIVENESS OF AGRO-FOOD INDUSTRIES: THE SWISS CASE – 27
OECD FOOD, AGRICULTURE AND FISHERIES PAPER N°88 © OECD 2015
The aforementioned developments are reflected in the trade indicators presented in
Figure 3.6. The Relative Export Advantage (RXA) index for Switzerland is above unity: the
country is a specialized exporter. The Relative Trade Advantage (RTA) indicator almost
tripled from 0.3 in 1995 to 0.8 in 2012. Also France and the Netherlands have a RXA above
unity (=1). In addition, these countries are also specialised importers of “other food”: the
Relative Import Advantage (RMA) is also above unity. These countries are thus relatively
specialised in trade of “other food” products. Austria, Spain, France and the United Kingdom
are net-importers. Some have negative values for RTA. The data shows that the
competitiveness of Switzerland on the world market increased.
Figure 3.6. Trade indicators of the “other food” industry
Source: LEI calculations based on UNComtrade.
4. Discussion and conclusions
4.1. Strong industries: Export focused and footloose resource base
The three strongest industries are “other food”, “beverages” and “oils and fats”. The first
two industries count for 72% of the exports. A major part of the raw materials is imported
(e.g. cocoa) or non-agricultural (mineral water). The oils and fats industry is strongly linked to
the “other food” industry as supplier of intermediate products to produce condiments,
-1.0 -0.5 0.0 0.5 1.0 1.5 2.0 2.5
RXA
RMA
RTA
RXA
RMA
RTA
RXA
RMA
RTA
RXA
RMA
RTA
RXA
RMA
RTA
RXA
RMA
RTA
RXA
RMA
RTA
RXA
RMA
RTA
UK
NL
ITFR
ESD
EA
TC
H
Trade indicators (Manufacture of other food products)
2012 2005 1995

28 – MEASURING COMPETITIVENESS OF AGRO-FOOD INDUSTRIES: THE SWISS CASE
OECD FOOD, AGRICULTURE AND FISHERIES PAPER N°88 © OECD 2015
seasonings or meals. On the other hand, the weakest industries, meat, dairy and animal feed
are largely based on domestic resources.
4.2 Objective of the study limited
The main objective of this study is an ex post performance assessment of the
competiveness of Swiss agro-food industries. Furthermore, this study provides information on
the structure of the Swiss food industry and its raw materials base. Unanswered questions are
for instance: are the small sub-industries small because their weak competitiveness in the
past? Are the industries weak because of the prices of raw materials?
4.3 Economic data sources weak for Switzerland
In economic studies, added value is used for assessing competitiveness. The data sources
did not provide this information for the sub-industries of the food industry on a 3 or 4-digit
level. The impact on the competitiveness is unclear.
4.4 Conclusions
In the aggregate, the Swiss food and beverage industry appears to be very strong
compared to the selected EU countries. On four of the five indicators, the Swiss food and
beverage manufacturing ranks the strongest or among the strongest. An exception is the share
in manufacturing: Swiss is the weakest on this indicator. The turnover of the Swiss food
industry grew the fastest of all selected countries. Nevertheless, the food industry lost share in
total manufacturing. The total manufacturing grew even faster.
The picture of strong aggregate competitiveness is driven by the performance of other
food manufacturing (C108) which takes around 60% of the turnover and half of the exports.
Almost half of the turnover of this industry comes from the cocoa and chocolate
manufacturing in 2011. This sub-industry’s turnover grew annually even with 10%: almost
twice as fast as the overall food & beverages industry (5.8%) in the period 2001-2011
Industries that are strongly linked to the local agriculture are performing the weakest:
meat, fruit and vegetables, dairy and animal feed. Most farmers’ prices are above the level of
the selected countries in the European Union. For several products, these prices are
converging to the EU level. Farmers’ prices of pig and cattle meat are diverging from the EU
level.
The size distribution of the firms is skewed: the 3% largest Swiss firms counts 60% of the
turnover, the 13% largest counts 85% in 2012. A similar skewedness can be observed for the
EU-benchmark countries. Nevertheless, the average turnover per enterprises is the highest of
all countries.

MEASURING COMPETITIVENESS OF AGRO-FOOD INDUSTRIES: THE SWISS CASE – 29
OECD FOOD, AGRICULTURE AND FISHERIES PAPER N°88 © OECD 2015
References
BFS (2013), Die Mehrwertsteuer in der Schweiz 2010–2011. Resultate und Kommentare,
Bundesamt für Statistik (BFS), Neuchâtel.
EC (2008), NACE Rev. 2 – Statistical classification of economic activites in the European
Community, European Commission: Office for Official Publications of the European
Communities, Luxembourg. pp. 363.
Fertö, I. and L.J.Hubbard (2003), "Revealed Comparative Advantage and Competitiveness in
Hungarian Agri–Food Sectors", The World Economy 26:247–259.
Frohberg, K. and M. Hartmanm (1997), "Comparing measures of competitveness, Institute of
Agricultural Development in Central and Eastern Europe", Halle.
FSO (2008), NOGA 2008 General Classification of Economic Activities, Federal Statistical
Office, Neuchâtel.
Gellynck, X. (2002), Changing Environment and Competitiveness in the Food Industry, Faculteit
Economie en Bedrijfskunde, University Gent, Gent.
Krugman, P.R. and M. Obstfeld (2006), International Economics: Theory and Policy
Pearson/Addison-Wesley, Boston.
Krugman, P.R. and M. Obstfield (1988), International economics:theory and implications. 6th ed.
Addison-Wesley, Boston.
Latruffe, L. (2010), "Competitiveness, Productivity and Efficiency in the Agricultural and Agri-
Food Sectors", OECD Food, Agriculture and Fisheries Papers, No. 30, OECD Publishing,
Paris.
DOI: http://dx.doi.org/10.1787/5km91nkdt6d6-en
OECD (2015), OECD Review of Agricultural Policies: Switzerland 2015, OECD Publishing,
Paris.
DOI: http://dx.doi.org/10.1787/9789264168039-en
O'Mahoney M. and B. van Ark (2003), EU-productivity and competitiveness: an industry
perspective, Office for Official Publication of the European Community, Luxembourg. pp. 273.
Porter, M.E. (1980), Competitive strategy: Techniques for Analyzing Industries and Competitiors
The Free Press, New York.
Porter, M.E. (1990), The competitive advantage of nations, The MacMillan Press Ltd, London.
Sagheer, S., S.S.Yadav and S.G. Deshmukh (2009), "Developing a conceptual framework for
assessing competitiveness of India's agrifood chain", International Journal of Emerging
Markets 4:137-159.
Scott, L. and T. Vollrath (1992), Global Competitive Advantages and Overall Bilateral
Complementarity in Agriculture: A Statistical Review, Economic Research Service,U.S.
Department of Agriculture, Washington.
Siggel, E. (2006), "International competitiveness and comparative advantage: a survey and a
proposal for measurement", Journal of Industry, Competition and Trade 6:137-159.

30 – MEASURING COMPETITIVENESS OF AGRO-FOOD INDUSTRIES: THE SWISS CASE
OECD FOOD, AGRICULTURE AND FISHERIES PAPER N°88 © OECD 2015
Spence, A.M. and H.A.Hazard (1998), International Competitiveness, Ballinger Publishing
Company, Cambridge, MA.
Thompson, A.A. and A.J. Strickland (2003), Strategic management. Concepts and Cases, McGraw
Hill, New York.
Wijnands, J.H.M., H.J. Bremmers, B.M.J. van der Meulen and K.J. Poppe, (2008), "An economic
and legal assessment of the EU food industry's competitiveness", Agribusiness, 24: 417–439.
doi: 10.1002/agr.20167
Wijnands, J.H.M., B.M.J. van der Meulen, K.J. Poppe (2007) Competitiveness of the European
Food Industry : an economic and legal assessment, Office for Official Publications of teh
European Communities, , Luxemburg. pp. 328.
Wright P., Kroll M.J., Parnell J. (1998) Strategic Management Concepts Prentice Hall, London.
WEBSITES
Mehrwertsteuer Schweiz
www.estv.admin.ch/dokumentation/00075/00076/00714/index.html?lang=de
Number of firms and employees
STAT-TAB: Institutionelle Einheiten und Beschäftigte nach Kanton und Wirtschaftsart (BZ).
www.pxweb.bfs.admin.ch/Dialog/varval.asp?ma=px-d-06-
2J05&ti=Institutionelle+Einheiten+und+Besch%E4ftigte+nach+Kanton+und+Wirtschaftsart+
%28BZ%29&path=../Database/German_06%20-
%20Industrie%20und%20Dienstleistungen/06.2%20-
%20Unternehmen/&lang=1&prod=06&openChild=true&secprod=2
Price, production and food supply balances:
FAOstat: http://faostat.fao.org/
Eurostat :Structural Business Statistics (SBS)
epp.eurostat.ec.europa.eu/portal/page/portal/european_business/data/database
from HS codes to SITC codes for matching trade product data to industry data:
unstats.un.org/unsd/trade/conversions/HS%20Correlation%20and%20Conversion%20tables.ht
m
Correspondence tables between NACE rev. 1.1 and NACe rev. 2:
epp.eurostat.ec.europa.eu/portal/page/portal/nace_rev2/correspondence_tables

MEASURING COMPETITIVENESS OF AGRO-FOOD INDUSTRIES: THE SWISS CASE – 31
OECD FOOD, AGRICULTURE AND FISHERIES PAPER N°88 © OECD 2015
Annex 1
Competitiveness graphs based on Z-scores
The competitiveness graphs in Section 3 present the values of the indicators as Z-scores.
A “Z-score” of 0 means an average score, a negative Z-score a weak score and a positive Z-
score means a strong score. This has the advantage that all variables have the distribution with
a mean of 0 and a standard deviation of 1. In this way the indicators can be compared. To
illustrate the impact, Table A1.1 presents the values and Z-scores of the indicators for the
food and beverages sector (C10 +C11) the Z-scores are depicted in the figure below.
Table A1.1. Values of indicators and Z-scores
Switzerlan
d Austri
a German
y Spain
France
Italy Netherland
s UK
O = Overall
Average Z-scores
0.56 0.20 -0.05 0.13 -0.43 -
0.06 0.11
-0.47
Z-score 1.68 0.59 -0.15 0.39 -1.27 -
0.17 0.33
-1.39
S = Annual growth share turnover in manufacturing
Value -2.00 0.16 -0.45 2.14 2.37 1.44 0.72 2.27
Z-score -1.84 -0.44 -0.83 0.85 1.00 0.40 -0.07 0.93
T = Difference RTA indicator
Value 0.20 0.04 0.03 0.00 -0.11 0.06 -0.69 -
0.02
Z-score 0.96 0.38 0.36 0.22 -0.18 0.45 -2.34 0.15
M = Difference world market share
Value 0.26 0.24 0.70 -
0.10 -2.60
-0.46
-0.09 -
1.31
Z-score 0.64 0.62 1.06 0.30 -2.05 -
0.04 0.31
-0.84
L = Annual growth rate labour productivity
Value 6.06 2.25 0.13 0.76 0.64 0.13 6.60 -
0.34
Z-score 1.46 0.08 -0.69 -
0.46 -0.50
-0.69
1.65 -
0.85
P = Annual growth rate real added value
Value 5.53 2.19 0.88 0.62 0.23 0.18 3.96 -
3.32
Z-score 1.59 0.34 -0.15 -
0.25 -0.39
-0.41
1.00 -
1.72

32 – MEASURING COMPETITIVENESS OF AGRO-FOOD INDUSTRIES: THE SWISS CASE
OECD FOOD, AGRICULTURE AND FISHERIES PAPER N°88 © OECD 2015
Figure A1.1. Competitiveness of the food & beverages industry
Legend: O Overall competitiveness
S Annual growth share turnover in manufacture industry, 2001-2011
T Difference in RTA indicator 2012 minus value 2000
M Difference world market share 2011 minus 2000
L Annual growth rate labour productivity (real turnover/employee) (2001-2011); CH (2001-2008)
P Annual growth rate real turnover value (2001-2011)
Source: LEI calculations based on Eurostat and FBS.
Additional remarks
Some positive values of the indicators will lead to negative Z-scores. For instance, Austria realised
a growth (S) on the world market of 0.16%: the difference of the share in 2012 (1.14%) and the
share in 2000 (0.88%) on the world market. The Z-score is negative, as the average growth of the
share of all countries was 0.8%, and thus Austria performs weaker than the average of all countries.
Figure A1.1 provides the graphs of the Z-scores. That figure shows that not only Switzerland and
Germany with negative values on the growth of the world market (S) are weak, but also countries
that score below average such as Austria and the Netherlands. An indication “strong” only means
that a country has an above average value. For instance, all countries might have negative values on
an indicator. The strongest country means that that country performed better than all others and the
Z-score will be on the right side.
The “O” overall value is the average of the Z-scores of the 5 indicators. This value is also
standardised in Z-scores, meeting the requirement of a mean of 0 and a standard deviation of 1. The
result might be that the overall score is outside the Z-scores of the individual scores. This is visible
in the “O” (overall) score of Switzerland. Switzerland is by far the strongest of all countries on the
overall competitiveness.
By standardising the values, most Z-scores will be in the interval “-2” to “+2”. For instance, the
high values for labour productivity growth (L) of Switzerland and the Netherlands are within that
range. However, some indicators are outside that interval. These values are depicted on the border
of the interval -2.2 to + 2.2 of the graphs. An example is the difference of the Relative Trade
Advantage indicator (T) for the Netherlands; the Z-score -2.34, thus smaller than -2.2. In the Figure
above it can be seen that Z-scores are depicted outside the left border. The Z-score of the French
market share (M)-2.05 is just inside the interval.

MEASURING COMPETITIVENESS OF AGRO-FOOD INDUSTRIES: THE SWISS CASE – 33
OECD FOOD, AGRICULTURE AND FISHERIES PAPER N°88 © OECD 2015
Annex 2.
Competitiveness, structure and raw material
based on food processing subsectors
Meat and meat products
This subsector processing and preserving of meat and production of meat products
(NACE code C101, (EC, 2008)) counts for round 10% of food & beverage industry’s turnover
and is third largest.
The overall competitiveness (O) of the Swiss meat processing industry is the weakest of
all selected countries. The main developments indicate that:
The Swiss share of the turnover of the meat industry in total manufacture (S) declined
considerably: Switzerland performed as weakest.
The growth of the real turnover (P) of the meat industry is above average and on the same
level as Austria, Spain and the Netherlands.
The growth of the labour productivity (real turnover per employee (L)) is also the weakest
compared to all benchmark countries.
The Swiss Relative Trade Advantage (T) index was stable and is above average.
Switzerland remained a net-importer of meat products.
The performance of the export share on the world market (M) of Switzerland is just below
average: Switzerland gained an insignificant small market share (0.1% points). Germany
gained a significant share from 5 to 9% (4% points).
In addition, the following observations are made:
The raw material supply for the Swiss meat industry declined for cattle and pig meat and
increased for poultry meat in the period 1991-2011.
The farmers’ prices in Switzerland are higher than those in the EU countries. The pig meat
farmers’ prices are converging and for other cattle and chicken meat, the price difference
increased.
The Swiss average turnover per enterprise is third in rank after the Netherlands and UK and
significantly higher than the Swiss neighbouring countries.

34 – MEASURING COMPETITIVENESS OF AGRO-FOOD INDUSTRIES: THE SWISS CASE
OECD FOOD, AGRICULTURE AND FISHERIES PAPER N°88 © OECD 2015
Figure A2.1. Competitiveness of the meat industry
Legend: O Overall competitiveness
S Annual growth share turnover in manufacture industry 2001-2011
T Difference in RTA indicator 2012 minus value 2000
M Difference world market share 2011 minus 2000
L Annual growth rate labour productivity (real turnover/employee) (2001-2011); CH (2001-2008)
P Annual growth rate real turnover value (2001-2011)
Source: LEI calculations based on Eurostat and FBS.
In the period 1991-2012, the annual Swiss cattle and pig meat production declined,
respectively -0.9 and -0.4%. The production of chicken meat grew 4.2% annually, which was
the highest growth level after Germany (5%).The Swiss self-sufficiency for all meat products
remained below 100%.
Figure A2.2. Meat production and self-sufficiency
Source: LEI calculation based on FAOstat.
O
O
O
O
O
O
O
O
S
S
S
S
S
S
S
S
T
T
T
T
T
T
T
T
M
M
M
M
M
M
M
M
L
L
L
L
L
L
L
L
P
P
P
P
P
P
P
P
Switzerland
Austria
Germany
Spain
France
Italy
Netherlands
UK
Processing and preserving of meat and production of meat products
(C101)Weak Average Strong
0
1,000
2,000
3,000
4,000
5,000
6,000
CH AT FR DE IT NL ES UK
Meat production 2012, 1,000 ton
cattle Chicken Pig
0
50
100
150
200
250
CH AT FR DE IT NL ES
Selfsufficiency 2009
Bovine Pig Poultry

MEASURING COMPETITIVENESS OF AGRO-FOOD INDUSTRIES: THE SWISS CASE – 35
OECD FOOD, AGRICULTURE AND FISHERIES PAPER N°88 © OECD 2015
The Swiss farmers’ meat prices for all categories are above the levels of all other selected
countries. The trend for pig meat is converging to the other levels. In contrast, the prices
differences for the cattle and chicken are increasing between Switzerland and the benchmark
countries.
Figure A2.3. Farmers’ prices for meat from 1991 to 2011
Source: Based on FAOstat.
The meat industry in Switzerland is the smallest of all selected countries; however, the
average turnover per enterprise is far above that of most other countries. The average turnover
decreased, whereas most other countries showed a growth. The number of employees did not
decline in the same pace as the decline in the turnover.
Table A2.1. Structure of the meat industry in 2011
Country Turnover Enterprises Average turnover per enterprise
Employeesa
Billion (EUR)
Growtha
(%) Number Growth
a
(%) Million (EUR)
Growtha
(%) 1,000 Growth
a
(%)
Switzerlanda 4.1 1.3 257 1.5 16.0 -0.1 11.9 -0.1
Austria 3.7 3.9 986 -1.6 3.8 5.6 16.9 -0.2
Germany 44.1 4.2 11 295 -2.6 3.9 7.0 202.1 -0.4
Spain 20.9 3.7 4 062 -0.7 5.1 4.4 83.3 1.4
France 34.9 0.0 6 540 -5.9 5.3 6.2 127.9 -3.0
Italy 19.8 1.6 3 601 -0.3 5.5 2.0 59.3 0.5
Netherlands 9.2 0.6 519 -4.5 17.8 5.4 13.9 -6.6
United Kingdom 16.9 -1.3 1 024 -1.2 16.5 0.0 74.5 -4.7 a
Annual growth rate from 2001 to 2011. Swiss labour data for 2008; growth rate for 2001-2008.
Source: Eurostat for EU countries and BFS for Switzerland.
0
500
1,000
1,500
2,000
2,500
3,000
1991
1993
1995
1997
1999
2001
2003
2005
2007
2009
2011
Meat live weight, chicken (USD/ton)
Austria GermanyItaly NetherlandsSpain SwitzerlandUK Linear (Austria)Linear (Netherlands) Linear (Switzerland)
0
1000
2000
3000
4000
5000
6000
1991
1993
1995
1997
1999
2001
2003
2005
2007
2009
2011
Meat live weight, cattle (USD/ton)
Austria GermanyItaly NetherlandsSpain SwitzerlandUK Linear (Austria)Linear (Netherlands) Linear (Switzerland)
0
500
1,000
1,500
2,000
2,500
3,000
3,500
1991
1993
1995
1997
1999
2001
2003
2005
2007
2009
2011
Meat live weight, pig (USD/ton)
Austria GermanyItaly NetherlandsSpain SwitzerlandUK Linear (Austria)Linear (Netherlands) Linear (Switzerland)

36 – MEASURING COMPETITIVENESS OF AGRO-FOOD INDUSTRIES: THE SWISS CASE
OECD FOOD, AGRICULTURE AND FISHERIES PAPER N°88 © OECD 2015
Processing and preserving of fruit and vegetables
This subsector (NACE code C103) has a share of 1.7% in the total food & beverage
processing industry’s turnover.
The overall competitiveness (O) of the Swiss fruit and vegetable processing industry is
together with France the weakest of the selected countries. The main developments indicate
that:
The share of the turnover of the fruit and vegetable processing industry in total manufacture
(S) is the weakest. Switzerland had a significant decline in the share.
The growth of the real turnover (P) of the fruit and vegetable processing industry is below
average and on the same level as the UK.
The growth of the labour productivity (real turnover per employee (L)) is also weak (UK is
the weakest) compared to all benchmark countries.
The Swiss Relative Trade Advantage (T) index is among the strongest of all selected
countries. Switzerland remained a net importer of fruit and vegetable products.
The performance of the export share on the world market (M) of Switzerland is strong and
after Austria the highest. However, the export growth of all selected countries is below
world market average, resulting in declining markets shares. Austria showed the lowest
decline.
In addition, the following observations are made:
The Swiss apple price is rather high and rising and the production decline is moderate. The
Swiss potato price is also rather high but stable and the production is strongly declining.
Little data have been found on the processing of single fruit or vegetable products.
The total turnover has a small share (2%) in the total food industry, strongly declining and
small compared to all benchmark countries.
FAOstat indicates that only other fruits and grapes are processed in Switzerland. Grapes
are processed for wine production. In 2012 apples (USD 331 million), potatoes
(USD 260 million), lettuce & chicory (USD 202 million), onions & shallots
(USD 194 million) and tomatoes (USD 102 million) had a production value of above
USD 100 million according to FAOstat. Switzerland is more than self-sufficient in
apples, a net-importer of potatoes with a self-sufficiency between 60 and 90 in the
period 1991 to 2009 and for tomatoes heavily dependent on imports (self-sufficiency
below 20%). For other products, no data or insufficient data are available in the
FAOstat database.
Apples and potatoes will be discussed, as these have the highest production value and
are single commodities. The apple production in Switzerland declined as in most
selected countries. However, in the neighbouring countries, Austria and Italy the
production grew in the period 1991 to 2011. The price of apples is rising since 2000 and
the highest after the prices in the United Kingdom. The price difference with Italy, the
largest producer of the selected countries, increased.

MEASURING COMPETITIVENESS OF AGRO-FOOD INDUSTRIES: THE SWISS CASE – 37
OECD FOOD, AGRICULTURE AND FISHERIES PAPER N°88 © OECD 2015
Figure A2.4. Competitiveness of the fruit and vegetable manufacturing industry
Legend: O Overall competitiveness
S Annual growth share turnover in manufacture industry 2001-2011
T Difference in RTA indicator 2012 minus value 2000
M Difference world market share 2011 minus 2000
L Annual growth rate labour productivity (real turnover/employee) (2001-2011); CH (2001-2008)
P Annual growth rate real turnover value (2001-2011)
Source: LEI calculations based on Eurostat and FBS.
Also, the potato production declined, as in most selected countries. The price
development is slightly positive; the price growth in Germany, the largest producer of the
selected countries, is higher. Italy has the highest price since 2001 and over the period 1991-
2011 the highest growth rate.
Concluding: the Swiss apple price is rather high and rising and the production decline is
moderate. The Swiss potato price is also rather high but stable and the production is strongly
declining.
Table A2.2. Production of apples and potatoes in the period 1991-2011
Apples (1 000 tonnes) Potatoes (1 000 tonnes)
2011 average Stdev (%) 2011 average Stdev Growth (%)
Switzerland 327 273 74 -0.7 515 578 135 -2.9
Austria 547 434 79 3.0 816 710 73 -0.5
France 1 857 2 216 330 -1.6 7 440 6 489 564 1.0
Germany 898 1 100 537 -0.5 11 800 11 606 1 046 -0.1
Italy 2 411 2 171 153 0.5 1 547 1 916 235 -1.9
Netherlands 418 446 105 -1.5 7 333 7 199 712 -0.3
Spain 670 782 146 -1.6 2 455 3 207 844 -3.7
UK 234 243 64 -2.5 6 115 6 502 553 -0.8
Source: Based on FAOstat

38 – MEASURING COMPETITIVENESS OF AGRO-FOOD INDUSTRIES: THE SWISS CASE
OECD FOOD, AGRICULTURE AND FISHERIES PAPER N°88 © OECD 2015
Figure A2.5. Prices of apples and potatoes
Source: Based on FAOstat.
All structure indicators show a negative trend for Switzerland, indicating the fruit and
vegetable processing industry is weak.
Table A2.3. Structure of the fruit and vegetable processing industry in 2011
Country Turnover Enterprises Average turnover per enterprise
Employeesa
Billion (EUR)
Growtha
(%) Number Growth
a
(%) Million (EUR)
Growtha
(%) 1,000 Growth
a
(%)
Switzerlanda 0.7 -2.1 67 0.8 11.0 -2.9 2.2 -5.4
Austria 1.4 3.3 118 -1.5 11.5 4.9 3.5 0.6
Germany 9.7 2.4 654 0.2 14.8 2.2 31.8 0.3
Spain 7.8 4.9 1,247 5.3 6.3 -0.4 31.5 0.2
France 7.7 1.5 1,176 0.3 6.6 1.2 25.2 -0.6
Italy 9.8 3.8 1,788 -1.0 5.5 4.9 29.8 0.0
Netherlands 5.0 4.6 149 1.0 33.6 3.6 9.4 -0.2
United Kingdom 6.9 0.9 488 -1.0 14.2 2.0 33.2 -0.6 a
Annual growth rate from 2001 to 2011. Swiss labour data are for 2008 and growth rate2001-2008.
Source: Eurostat for EU countries and BFS for Switzerland.
Manufacture of vegetable and animal oils and fats
This group includes the manufacture of crude and refined oils and fats from vegetable or
animal materials, except rendering or refining of lard and other edible animal fats (NACE
code C104, EC, 2008).This subsector has a share of 1.0% in the total food & beverage
processing industry’s turnover.
The overall competitiveness (O) of the Swiss oils and fats processing industry (C104) is
above average and on the same level as France and the Netherlands. The main developments
indicate that:
The growth of the share of the turnover of the oils and fats processing industry in total
manufacture (S) is below average and together with the German industry the weakest.
The growth of the real turnover (P) is the strongest.
0
200
400
600
800
1000
1200
1400
1991
1992
1993
1994
1995
1996
1997
1998
1999
2000
2001
2002
2003
2004
2005
2006
2007
2008
2009
2010
2011
Apples (USD/ton)
Austria France
Germany Italy
Netherlands Spain
Switzerland UK
Linear (Italy) Linear (Switzerland)
0
100
200
300
400
500
600
1991
1992
1993
1994
1995
1996
1997
1998
1999
2000
2001
2002
2003
2004
2005
2006
2007
2008
2009
2010
2011
Potatoes (USD/ton)
Austria FranceGermany Italy
Netherlands SpainSwitzerland UKLinear (Germany) Linear (Italy)Linear (Switzerland)

MEASURING COMPETITIVENESS OF AGRO-FOOD INDUSTRIES: THE SWISS CASE – 39
OECD FOOD, AGRICULTURE AND FISHERIES PAPER N°88 © OECD 2015
The growth of the labour productivity (real turnover per employee (L)) is also the
weakest compared to all benchmark countries.
The Swiss Relative Trade Advantage (T) index is among the highest of all selected
countries. Switzerland remained a net importer of oils and fats products.
The performance of the export share on the world market (M) of Switzerland is strong
and on the same level as France and the Netherlands. However, the Swiss market share
of 0.1% is very small. Most countries have a market share below 1%, except Spain and
the Netherlands, which have more than 2% market share.
In addition, the following observations are made:
The Swiss oils and fats manufacturing is very small: a turnover of EUR0.4bn, just 1%
of the total turnover of the food industry (C10)
Switzerland produces little oilseeds, mainly rapeseed. The production is around 3% of
the levels of France, Germany or the UK. The price is above the level of EU countries,
despite a strong decline in the nineties
The turnover is small compared to most other benchmark countries but also as share
(1%) in the total food industry. The turnover increased strongly over last decade.
Figure A2.6. Competitiveness of the oils and fats manufacturinga
Legend: O Overall competitiveness
S Annual growth share turnover in manufacture industry 2001-2011
T Difference in RTA indicator 2012 minus value 2000
M Difference world market share 2011 minus 2000
L Annual growth rate labour productivity (real turnover/employee) (2001-2011); CH (2001-2008)
P Annual growth rate real turnover value (2001-2011)
a Austria and the UK are not included, due to insufficient information on the economic indicators.
Source: LEI calculations based on Eurostat and FBS.

40 – MEASURING COMPETITIVENESS OF AGRO-FOOD INDUSTRIES: THE SWISS CASE
OECD FOOD, AGRICULTURE AND FISHERIES PAPER N°88 © OECD 2015
Switzerland is a small producer of oil seeds. The farmers’ production value of rapeseed
was on average USD 53 million, around 74 000 tonnes in 2012, and increased slightly since
2000. Compared to France (5 400 000 tonnes in 2012), Germany (3 900 000 tonnes) or the
UK (2 700 000 tonnes), Switzerland is a small producer. Other oil crops have even produced
in lower quantities; the farmers’ value of sunflowers is second with USD 9 million. The self-
sufficiency for rape and mustard seeds is during the period 2002 to 2009 around 80%.
Little information on the oil supply balance has been found in the FAO statistics.
Information on animal fats for edible oil is fully lacking.
The price of rapeseed in Switzerland is above selected countries with a large production.
In the period 1991 to 2000, the Swiss was substantial above the price of EU countries but the
price declined and converged to the EU prices. Since 2000 the Swiss price follows the EU
countries’ prices but is still above.
Figure A2.7. Price of rapeseed
Source: LEI calculation based on FAOstat.
The turnover of the Swiss oils and fats manufacturing grew strongly, the industry is small
with 17 enterprises and a total turnover of EUR 400 million. The average turnover per
enterprise is in the range of those of Germany, France and the UK. In addition, it is above the
level of Spain that has the highest total turnover of all selected countries.
Table A2.4. Structure of oils and fats manufacturing in 2011
Country Turnover Enterprises Average turnover per enterprise
Employeesa
Billion (EUR)
Growtha
(%) Number Growth
a
(%) Million (EUR)
Growtha
(%) 1 000 Growth
a
(%)
Switzerlanda 0.4 6.0 21 7.6 21.0 -1.5 0.4 3.4
Austria 0.5 73 6.7 7.1 0.7
Germany 6.0 1.1 163 13.0 36.7 -10.5 4.9 -3.1
Spain 10.1 5.6 1,510 -1.1 6.7 6.8 13.1 -0.7
France 4.1 2.5 213 1.3 19.4 1.2 3.0 -1.9
Italy 5.9 2.7 3,344 -2.4 1.8 5.2 10.7 -1.9
Netherlands 7.0 2.8 38 9.7 183.7 -6.3 2.7 -2.5
United Kingdom 1.3 -8.7 50 -2.7 25.6 -6.1 a
Annual growth rate from 2001 to 2011. Swiss labour data are for 2008 and growth rate2001-2008. Source: Eurostat for EU countries and BFS for Switzerland.
0
500
1000
1500
2000
1991
1992
1993
1994
1995
1996
1997
1998
1999
2000
2001
2002
2003
2004
2005
2006
2007
2008
2009
2010
2011
Rapeseed (USD/ton)
Austria France Germany Switzerland
United Kingdom Linear (France) Power (Switzerland)

MEASURING COMPETITIVENESS OF AGRO-FOOD INDUSTRIES: THE SWISS CASE – 41
OECD FOOD, AGRICULTURE AND FISHERIES PAPER N°88 © OECD 2015
Manufacture of dairy products
This subsector (NACE code C105) has a share of round 12% in the total food & beverage
processing industry’s turnover and is the second largest subsector after “other foods”.
The overall competitiveness (O) of the Swiss dairy processing industry is weak compared
to the benchmark countries. The main developments indicate that:
The share of the turnover of the dairy industry in total manufacture (S) declined strongly
and Switzerland is the weakest on this indicator.
The growth of the real turnover (P) of the dairy industry is above average.
The growth of the labour productivity (real turnover per employee (L)) is weak, especially
compared to the Netherlands, but slightly better than in Austria.
The Relative Trade Advantage (T) index of Switzerland declined, Switzerland below
average and relatively weak. Nevertheless, Switzerland remained a net exporter of dairy
products.
The growth of the export share on the world market (M) of Switzerland is above average:
the decline was less than the leading EU exporters France, Germany and the Netherlands.
In addition, the following observations are made:
The raw material base for the Swiss dairy industry did not change significantly during the
period 1990 to 2009. The self-sufficiency increased modestly.
The farmers’ prices in Switzerland are above those of the EU countries. The prices are
converging: the price trend in Switzerland is negative and positive in Germany – the largest
milk producer of the selected countries.
The Swiss average turnover per enterprise is one of the lowest, together with Italy and
Spain. The Dutch and German enterprises have an average turnover that is 5 to 8 times
more than the Swiss.
Milk production in Switzerland and benchmark countries was rather stable during the
period from 1991 to 2009: a small standard deviation. Nevertheless a small growth for some
countries including Switzerland can be observed and a decline in the milk production for
some others. The self-sufficiency in Switzerland was increasing, but slowly. Countries like
Austria and the Netherlands showed a strong growth, whereas Spain and the United Kingdom
showed a decline. Based on these developments it is concluded that the raw material base in
for the Swiss dairy industry did not change significantly.
The farmers’ prices in Switzerland are above those of the selected EU countries. The
prices are converging: in the early nineties, the Swiss producer price was around 1.9 times the
German price and in 2011, around 1.5 times. German is the largest milk producer of the
selected EU countries. Nevertheless, a considerable difference in farmers’ prices of milk can
be observed. Within the European Union, the farmers’ prices in Italy – the highest in the
European Union – are 40% higher than in the United Kingdom – the lowest prices – from
2009 to 2011.
The Swiss growth rate of the average turnover is among the lowest of the selected
countries, all though the number of dairy processing firms declined strongly in Switzerland,
stronger than in Italy, Spain or United Kingdom. The other countries show even a growth in
the number of firms. This decline in firms and in turnover resulted in a rather strong growth of
scale of firms: 4% growth of the average turnover per enterprise.

42 – MEASURING COMPETITIVENESS OF AGRO-FOOD INDUSTRIES: THE SWISS CASE
OECD FOOD, AGRICULTURE AND FISHERIES PAPER N°88 © OECD 2015
Figure A2.8. Competitiveness of the dairy industry
Legend: O Overall competitiveness
S Annual growth share turnover in manufacture industry 2001-2011
T Difference in RTA indicator 2012 minus value 2000
M Difference world market share 2011 minus 2000
L Annual growth rate labour productivity (real turnover/employee) (2001-2011); CH (2001-2008)
P Annual growth rate real turnover value (2001-2011)
Source: LEI calculations based on Eurostat and FBS.
Table A2.5. Production and self-sufficiency of milk
Country Production (million tonnes) Self-sufficiencya (%)
2009 1991-2009 2009 1991-2009
Mean Stdev growth Mean Stdev growth
Switzerland 4.1 3.9 0.1 0.2 117.3 113.3 2.8 0.2
Austria 3.3 3.2 0.1 -0.1 136.5 118.9 10.1 1.2
France 24.2 25.7 0.6 -0.6 127.6 124.0 3.8 0.4
Germany 29.2 28.4 0.4 0.0 121.3 122.0 5.5 -0.1
Italy 11.4 12.2 0.6 -0.3 68.8 69.4 1.9 0.1
Netherlands 11.5 11.1 0.3 0.2 163.3 135.1 12.7 0.9
Spain 7.4 7.1 0.3 0.1 70.2 80.3 6.0 -1.2
United Kingdom 13.2 14.6 0.5 -0.6 77.8 91.1 5.9 -1.1
a Self-sufficiency is the domestic supply (=supply for domestic use, FAO:
faostat.fao.org/site/379/DesktopDefault.aspx?PageID=379) as percentage of the production.
Source: based on FAOStat commodity balances: FAO item code 2848 “Milk - Excluding Butter”.

MEASURING COMPETITIVENESS OF AGRO-FOOD INDUSTRIES: THE SWISS CASE – 43
OECD FOOD, AGRICULTURE AND FISHERIES PAPER N°88 © OECD 2015
Figure A2.9. Farmers’ prices of milk from 1991 to 2011
Source: Calculation based on FAOStat.
Table A2.6. Structure of the dairy industry in 2011
Country Turnover Enterprises Average turnover per enterprise
Employeesa
Billion (EUR)
Growtha
(%) Number Growth
a
(%) Million (EUR)
Growtha
(%) 1 000 Growth
a
(%)
Switzerlanda 4.9 0.8 768 -4.0 6.4 5.0 8.2 -2.2
Austria 2.4 2.1 157 3.3 15.5 -1.2 4.9 0.8
Germany 27.5 2.1 472 3.9 58.2 -1.7 40.1 0.1
Spain 10.6 4.0 1 445 -0.3 7.3 4.3 26.8 0.5
France 27.2 0.9 1 958 2.7 13.9 -1.7 57.2 -1.2
Italy 18.1 0.5 3 382 -1.2 5.4 1.7 44.1 -1.8
Netherlands 10.5 3.4 304 2.6 34.7 0.8 12.4 -0.5
United Kingdom 9.9 -0.1 573 -0.5 17.3 0.4 26.4 -3.5
a Annual growth rate from 2001 to 2011. Swiss labour data are for 2008 and growth rate2001-2008.
Source: Eurostat for EU countries and BFS for Switzerland.
Manufacturing of grain mill products and starch products
This group includes the milling of flour or meal from grains or vegetables, the milling,
cleaning and polishing of rice, as well as the manufacture of flour mixes or doughs from these
products (EC, 2008). This subsector (NACE code C106) has a share of 1.4% in the total food
& beverage processing industry’s turnover and is a rather small subsector.
The overall competitiveness (O) of the Swiss grain mill and starches industry (C106) is
weak similar to several benchmark countries. Austria is the strongest and also the UK is
above average. The main developments indicate that:
The share of the turnover of the industry in total manufacture (S) in Switzerland is
weak: the country showed a major decline compared to the benchmark countries.
The growth of the real turnover (P) of the grain mill and starches industry is below
average as in most benchmark countries. Austria performed extremely well.
The growth of the labour productivity (real turnover per employee (L)) is also weak as
in most benchmark countries. The Netherlands performed extremely well.
200
300
400
500
600
700
800
900
1991
1992
1993
1994
1995
1996
1997
1998
1999
2000
2001
2002
2003
2004
2005
2006
2007
2008
2009
2010
2011
Whole milk (USD/ton)
France Germany IrelandItaly Netherlands SpainSwitzerland UK Linear (Germany)Linear (Switzerland)

44 – MEASURING COMPETITIVENESS OF AGRO-FOOD INDUSTRIES: THE SWISS CASE
OECD FOOD, AGRICULTURE AND FISHERIES PAPER N°88 © OECD 2015
The Relative Trade Advantage (T) index of Switzerland is above average, the Dutch
performed the weakest. Nevertheless, Switzerland remained a net exporter of grain mill
and starches products.
The performance of the export share on the world market (M) of Switzerland is above
average: the decline was lower than the leading EU exporters France, Germany, Italy
and the United Kingdom.
In addition, the following observations are made:
The raw material base for the Swiss grain mail and starches industry is mainly wheat.
The self-sufficiency declined modestly. The prices declined in the nineties and are
nowadays still above the EU level. The 2008 peak in Switzerland was mitigated.
The Swiss average turnover per enterprise is amongst the lowest comparable as in
selected southern European countries
Figure A2.10. Competitiveness of the grain mill and starches industrya
Legend: O Overall competitiveness
S Annual growth share turnover in manufacture industry 2001-2011
T Difference in RTA indicator 2012 minus value 2000
M Difference world market share 2011 minus 2000
L Annual growth rate labour productivity (real turnover/employee) (2001-2011); CH (2001-2008)
P Annual growth rate real turnover value (2001-2011)
a
UK had insufficient data to calculate the labour productivity.
Source: LEI calculations based on Eurostat and FBS.
Switzerland is a small producer of cereals. The farmers’ production value of wheat in
2011 was USD 291 million and has been declining since 1991. The producer values of barley
(USD 67 million in 2011), maize (53) or Triticale (22) are far below these levels. Compared
to France (36 million tonnes in 2012), Germany (23 million tonnes) or the United Kingdom
(15 million tonnes), Switzerland (0.6 million tonnes) is a small wheat producer. Furthermore,
the Swiss production quantity declined slightly. The self-sufficiency for wheat declined from
60 to 70% in nineties to 50 % in 2012.

MEASURING COMPETITIVENESS OF AGRO-FOOD INDUSTRIES: THE SWISS CASE – 45
OECD FOOD, AGRICULTURE AND FISHERIES PAPER N°88 © OECD 2015
The Swiss wheat prices are above the level of the EU countries. The prices declined in the
nineties and showed a similar pattern as the EU prices. However, the peak in 2008 was
mitigated: less price increase compared to the EU countries.
Figure A2.11. Wheat prices (USD/tonnes)
Source: Based on FAOstat.
The total turnover is small as share (1.4%) in the total food industry and small compared
to all benchmark countries. Furthermore, the Swiss turnover grew the least. Due to a decline
in the number of enterprises, the turnover per enterprise grew. Nevertheless, the turnover per
enterprise is amongst the lowest comparable with the levels in selected southern European
countries: the average turnover in the United Kingdom is nine times the Swiss level.
Table A2.7. Structure of the grain mill and starches industry in 2011
Country Turnover Enterprises Average turnover
per enterprise Employees
a
Billion (EUR)
Growtha
(%) Number Growth
a
(%) Million (EUR)
Growtha
(%) 1,000 Growth
a
(%)
Switzerlanda 0.6 0.6 89 -3.0 7.1 3.8 1.3 -3.9
Austria 1.0 14.1 129 0.6 7.4 13.4 2.3 7.5
Germany 6.7 5.0 623 2.5 10.7 2.5 15.9 2.0
Spain 3.4 3.1 532 -4.6 6.4 8.1 6.4 -1.6
France 7.2 3.2 512 -2.8 14.0 6.2 14.5 0.1
Italy 6.9 2.3 1 067 -5.6 6.5 8.4 8.9 -2.7
Netherlands 2.2 1.5 113 4.2 19.3 -2.6 3.5 -14.4
United Kingdom 7.6 4.3 120 -1.9 63.7 6.4
a Annual growth rate from 2001 to 2011. Swiss labour data are for 2008 and growth rate2001-2008.
Source: Eurostat for EU countries and BFS for Switzerland.
Manufacture of bakery and farinaceous products
This sub-industry includes the production of bakery products, macaroni, noodles and
similar products(EC, 2008). This subsector (NACE code C107) has a share of 5% in the total
food & beverage processing industry’s turnover and is a medium sized subsector.
The overall competitiveness (O) of the Swiss grain bakery industry (C107) is weak. The
main developments indicate that:
0
100
200
300
400
500
600
700
800
1991
1992
1993
1994
1995
1996
1997
1998
1999
2000
2001
2002
2003
2004
2005
2006
2007
2008
2009
2010
2011
Wheat (USD/ton)
Austria France GermanySwitzerland United Kingdom ItalySpain Linear (France) Linear (Switzerland)
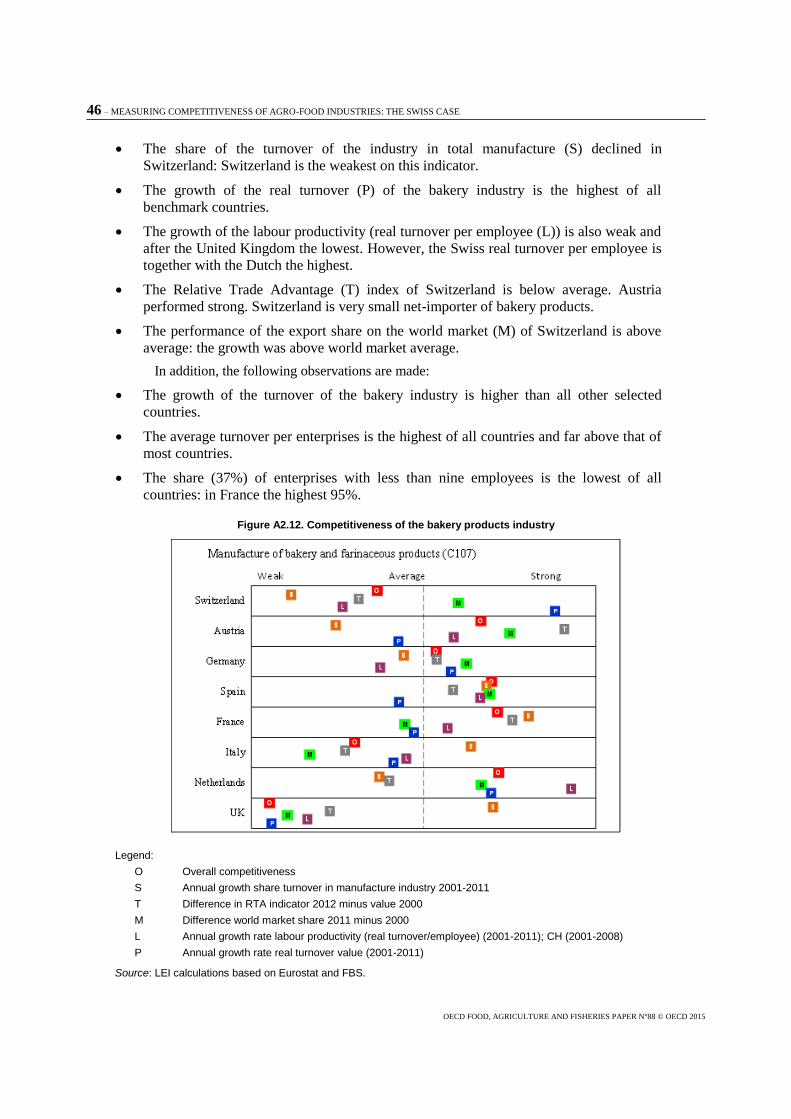
46 – MEASURING COMPETITIVENESS OF AGRO-FOOD INDUSTRIES: THE SWISS CASE
OECD FOOD, AGRICULTURE AND FISHERIES PAPER N°88 © OECD 2015
The share of the turnover of the industry in total manufacture (S) declined in
Switzerland: Switzerland is the weakest on this indicator.
The growth of the real turnover (P) of the bakery industry is the highest of all
benchmark countries.
The growth of the labour productivity (real turnover per employee (L)) is also weak and
after the United Kingdom the lowest. However, the Swiss real turnover per employee is
together with the Dutch the highest.
The Relative Trade Advantage (T) index of Switzerland is below average. Austria
performed strong. Switzerland is very small net-importer of bakery products.
The performance of the export share on the world market (M) of Switzerland is above
average: the growth was above world market average.
In addition, the following observations are made:
The growth of the turnover of the bakery industry is higher than all other selected
countries.
The average turnover per enterprises is the highest of all countries and far above that of
most countries.
The share (37%) of enterprises with less than nine employees is the lowest of all
countries: in France the highest 95%.
Figure A2.12. Competitiveness of the bakery products industry
Legend:
O Overall competitiveness
S Annual growth share turnover in manufacture industry 2001-2011
T Difference in RTA indicator 2012 minus value 2000
M Difference world market share 2011 minus 2000
L Annual growth rate labour productivity (real turnover/employee) (2001-2011); CH (2001-2008)
P Annual growth rate real turnover value (2001-2011)
Source: LEI calculations based on Eurostat and FBS.

MEASURING COMPETITIVENESS OF AGRO-FOOD INDUSTRIES: THE SWISS CASE – 47
OECD FOOD, AGRICULTURE AND FISHERIES PAPER N°88 © OECD 2015
The Swiss based raw material source is wheat, which is discussed already above. The
growth of the turnover of the bakery industry is higher than all other selected countries. Also,
the average turnover per enterprise is the highest of all countries and far above that of most
countries.
Table A2.8. Structure of the bakery products industry in 2011
Country Turnover Enterprises Average turnover
per enterprise Employees
a
Billion (EUR)
Growtha
(%) Number Growth
a
(%) Million (EUR)
Growtha
(%) 1,000 Growth
a
(%)
Switzerlanda 2.1 4.5 219 -0.3 9.7 4.7 14.6 2.4
Austria 2.4 2.3 1 773 -2.3 1.3 4.8 30.7 -0.6
Germany 23.3 2.6 14 766 -0.8 1.6 3.5 396.8 2.0
Spain 7.3 2.9 10 429 -2.4 0.7 5.4 79.6 -1.3
France 21.2 2.1 41 552 -0.7 0.5 2.9 222.8 0.0
Italy 16.9 2.1 35 664 -2.0 0.5 4.2 173.8 0.0
Netherlands 4.5 2.0 2 348 -2.5 1.9 4.7 43.3 -1.2
United Kingdom 11.3 -0.6 2 218 0.0 5.1 -0.7 108.5 -1.2
a Annual growth rate from 2001 to 2011. Swiss labour data are for 2008 and growth rate 2001-2008.
Source: Eurostat for EU countries and BFS for Switzerland.
Manufacture of prepared animal feeds
This sector (NACE Code C109) includes 1) manufacture of prepared feeds for farm
animals, including concentrated animal feed and feed supplements; 2) preparation of unmixed
(single) feeds for farm animals; and 3) manufacture of prepared feeds for pets, including dogs,
cats, birds, fish etc.(EC, 2008). This subsector has a share of 3.1% in the total food &
beverage processing industry’s turnover.
The overall competitiveness (O) of the Swiss animal feed processing industry is weak
compared to the benchmark countries. This position is linked to the position of dairy and meat
products; the main buyers from the animal feed industry. The developments indicate that:
The share of the turnover of the animal feed products industry in total manufacture (S)
is very weak and declined considerable. The shares grew in all other countries.
The growth of the real turnover (P) of the animal feed industry is below average.
The growth of the labour productivity (real turnover per employee (L)) is above
average, just like in Austria, below the Dutch level.
The Relative Trade Advantage (T) index of Switzerland is also below average. The
Netherlands is the weakest despite the above average export growth. The imports grew
even faster.
The performance of the export share on the world market (M) of Switzerland is also
below average. The Dutch showed the best performance, with the highest increase.
In addition, the following observations are made:
Only the turnover of the Swiss animal feed industry declined, the industry in all other
countries showed a growth. The average turnover per enterprise is low but comparable
with the German and Italian.

48 – MEASURING COMPETITIVENESS OF AGRO-FOOD INDUSTRIES: THE SWISS CASE
OECD FOOD, AGRICULTURE AND FISHERIES PAPER N°88 © OECD 2015
The imports of oil cakes – a basic ingredient for concentrated feed – increased strongly.
Cat and dog feed takes an important share in the imports (40%) and in the exports
(75%)
Figure A2.13. Competitiveness of the animal feed industry
Legend: O Overall competitiveness
S Annual growth share turnover in manufacture industry 2001-2011
T Difference in RTA indicator 2012 minus value 2000
M Difference world market share 2011 minus 2000
L Annual growth rate labour productivity (real turnover/employee) (2001-2011); CH (2001-2008)
P Annual growth rate real turnover value (2001-2011)
Source: LEI calculations based on Eurostat and FBS.
The animal feed industry is for their raw materials not directly linked to the primary
industry. Important sources of raw materials are cakes from oilseeds, processed by the oils
and fats manufacturing. As shown above that is a relatively small industry. The total turnover
of the oils and fats industry (EUR 0.4m) is just one third of that of the animal feed industry
(EUR 1.3million). Furthermore, the feed industry is a supplier to the livestock husbandry.
O
O
O
O
O
O
O
O
S
S
S
S
S
S
S
S
T
T
T
T
T
T
T
T
M
M
M
M
M
M
M
M
L
L
L
L
L
L
L
L
P
P
P
P
P
P
P
P
Switzerland
Austria
Germany
Spain
France
Italy
Netherlands
UK
Manufacture of prepared animal feeds (C109)
Weak Average Strong

MEASURING COMPETITIVENESS OF AGRO-FOOD INDUSTRIES: THE SWISS CASE – 49
OECD FOOD, AGRICULTURE AND FISHERIES PAPER N°88 © OECD 2015
The average turnover per enterprise is low but comparable with almost that in the other
countries. Austria has an average turnover per enterprise that is 2.5 times higher than
Switzerland and the highest level of all selected countries.
Table A2.9. Structure of the animal feed products industry in 2011
Country Turnover Enterprises Average turnover
per enterprise Employees
a
Billion (EUR
)
Growtha
(%) Number Growth
a
(%) Million (EUR)
Growtha
(%) 1 000 Growt
ha (%)
Switzerlanda 1.3 1.5 142 -2.8 8.9 4.4 1.9 -4.4
Austria 1.0 9.3 56 -1.3 17.4 10.7 2.0 3.5
Germany 10.2 4.9 563 2.6 18.0 2.3 16.2 1.3
Spain 10.2 3.9 809 -1.4 12.7 5.4 13.4 -1.0
France 12.3 3.2 441 -2.4 28.0 5.8 18.3 -0.6
Italy 5.5 1.4 523 -1.5 10.5 2.9 7.7 -1.4
Netherlands 7.6 3.3 174 -1.9 43.5 5.3 7.4 -2.1
United Kingdom 7.9 1.6 396 -3.6 20.0 5.4 14.8 -1.1 a
Annual growth rate from 2001 to 2011. Swiss labour data are for 2008 and growth rate2001-2008.
Source: Eurostat for EU countries and BFS for Switzerland.
Swiss imports of oil cake and feed preparations - basic ingredients for feed concentrates -
increased strongly last decade. Trade in dog and cat feed is remarkable: imports and imports
take a significant share in imports (39%) and even more in the exports (76%) in 2012.
Figure A2.14. Animal feed trade
Source: Based on UNComtrade.
Manufacture of beverages
This sector includes the manufacture of beverages, such as non-alcoholic beverages and
mineral water, manufacture of alcoholic beverages mainly through fermentation, beer and
wine, and the manufacture of distilled alcoholic beverages. Excluded are production of fruit
and vegetable juices (NACE C103), of milk-based drinks (NACE C105) and of coffee, tea
and mate products (NACE C108).(EC, 2008) The subsector beverages has a share of 7.7% in
the total food & beverage processing industry’s turnover and ranks on position 4 in total
turnover.
0
20
40
60
80
100
120
140
160
180
200
1995
1996
1997
1998
1999
2000
2001
2002
2003
2004
2005
2006
2007
2008
2009
2010
2011
Import (million €)
Dog/cat food Oil cake
Feed preparations Other
0
20
40
60
80
100
120
140
160
180
200
1995
1996
1997
1998
1999
2000
2001
2002
2003
2004
2005
2006
2007
2008
2009
2010
2011
2012
Export (million€)
Dog/cat food Feed preparation
Other

50 – MEASURING COMPETITIVENESS OF AGRO-FOOD INDUSTRIES: THE SWISS CASE
OECD FOOD, AGRICULTURE AND FISHERIES PAPER N°88 © OECD 2015
The overall competitiveness (O) of the Swiss beverages manufacturing industry (C11) is
above average compared to the benchmark countries. The Austrian and Dutch industry is
slightly stronger. The main developments indicate that:
The share of the turnover of the beverages industry in total manufacture (S) is weak and
declined in Switzerland.
The growth of the real turnover (P) of the beverages manufacturing is above average:
the Netherlands and Austria outperform Switzerland.
The growth of the labour productivity (real turnover per employee (L)) is below
average.
The Relative Trade Advantage (T) index of Switzerland outperforms all other countries.
Nevertheless, Switzerland is a small net importer of beverages.
In addition, the performance of the export share on the world market (M) of Switzerland
is the strongest after Germany. Their export grew twice as fast as the world average.
In addition, the following observations are:
The sub-industries of beverages manufacturing are soft drinks and bottled water (40-
45% of total turnover), producing beer (32-34%) and grape wine making (12-15%). The
shares remained rather stable during the period 2001-2011.
The production of grapes is small and stable. The farmers’ prices of grapes are
relatively high: at least two times the EU level.
Figure A2.15. Competitiveness of the beverages manufacturing
Legend: O Overall competitiveness
S Annual growth share turnover in manufacture industry 2001-2011
T Difference in RTA indicator 2012 minus value 2000
M Difference world market share 2011 minus 2000
L Annual growth rate labour productivity (real turnover/employee) (2001-2011); CH (2001-2008)
P Annual growth rate real turnover value (2001-2011)
Source: LEI calculations based on Eurostat and FBS.

MEASURING COMPETITIVENESS OF AGRO-FOOD INDUSTRIES: THE SWISS CASE – 51
OECD FOOD, AGRICULTURE AND FISHERIES PAPER N°88 © OECD 2015
The FAO statistics showed that processing of grapes is around the amount of domestic
produced grapes: since 2000 slightly above 100%. Imported grapes are mainly for fresh
consumption or “processed” into ready-to-eat fruit salads. Wine-grapes are generally not
transported over long distances. The raw material base for wine is thus mainly domestically.
The production is rather stable in the period 1991 to 2011. The production of 130 000 tonnes
of grapes is negligible compared to the 6 million tonnes in France, Italy or Spain. Austria
produces twice as Switzerland. The prices of Swiss grapes are high compared to the EU
benchmark countries. For beer cereals are needed, those developments are discussed in the
previous section on grain mill products (C106).
Figure A2.16. Prices of grapes in USD/tonne
Source: Based on FAOstat.
The Swiss beverages manufacturing turnover showed a modest growth (3%), higher than
Germany and the UK (both -0.4%), lower than Austria and the Netherlands (10-12%). The
average turnover is in the range of the Southern European countries, but around 60% below of
the non-wine-producing Northern European benchmark countries.
Table A2.10. Structure of beverage manufacturing in 2011 (Switzerland 2008)
Country Turnover Enterprises Average turnover per enterprise
Employeesa
Billion (EUR)
Growtha
(%) Number Growth
a
(%) Million (EUR)
Growtha
(%) 1 000 Growth
a
(%)
Switzerlanda 3.2 4.5 367 1.6 8.6 2.8 7.1 2.1
Austria 4.9 9.7 365 3.2 13.4 6.3 9.0 -0.2
Germany 20.1 -0.4 2 019 0.1 10.0 -0.6 70.5 -1.2
Spain 15.8 1.6 4 557 0.2 3.5 1.4 47.8 -0.5
France 25.1 3.0 2 959 -1.7 8.5 4.7 44.1 -0.5
Italy 19.0 4.5 2 871 -0.4 6.6 4.9 35.9 -0.2
Netherlands 4.7 12.1 189 6.6 25.1 5.2 7.0 -3.0
United Kingdom 21.3 -0.4 1 033 3.3 20.6 -3.6
a Annual growth rate from 2001 to 2011. Swiss labour data are for 2008 and growth rate 2001-2008.
Source: Eurostat for EU countries and BFS for Switzerland.
0
1,000
2,000
3,000
4,000
19
91
19
92
19
93
19
94
19
95
19
96
19
97
19
98
19
99
20
00
20
01
20
02
20
03
20
04
20
05
20
06
20
07
20
08
20
09
20
10
20
11
Austria France Germany Italy Spain Switzerland
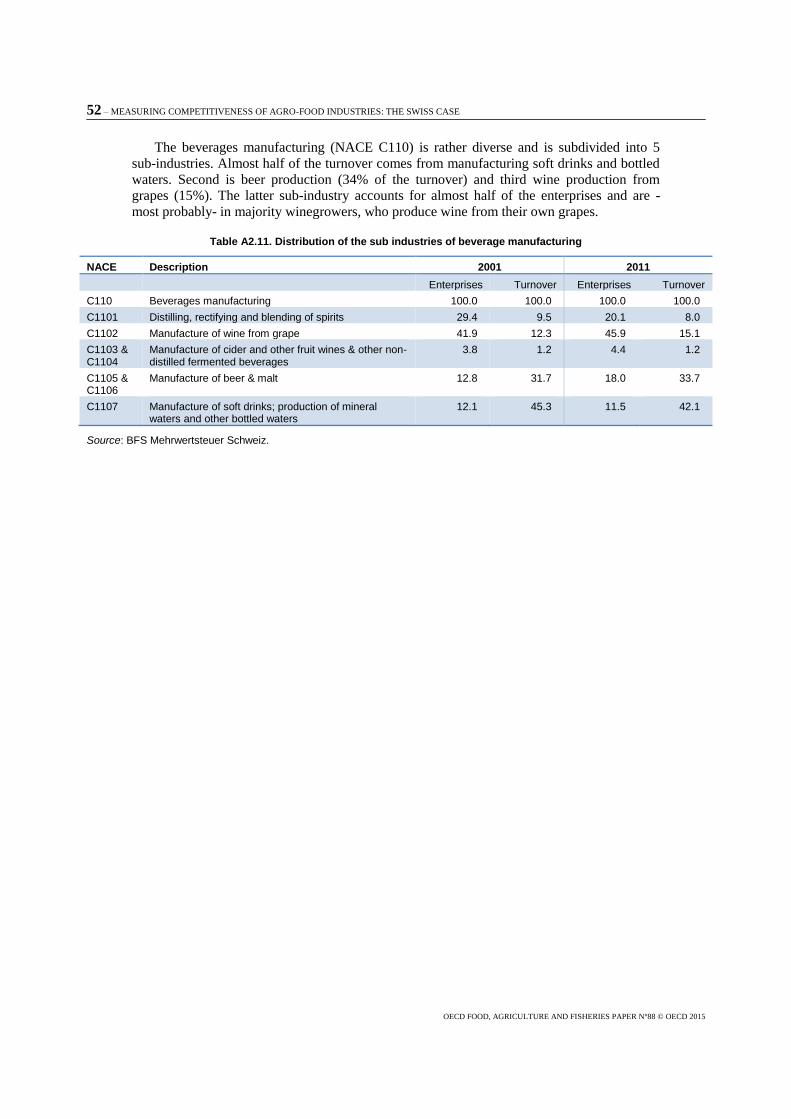
52 – MEASURING COMPETITIVENESS OF AGRO-FOOD INDUSTRIES: THE SWISS CASE
OECD FOOD, AGRICULTURE AND FISHERIES PAPER N°88 © OECD 2015
The beverages manufacturing (NACE C110) is rather diverse and is subdivided into 5
sub-industries. Almost half of the turnover comes from manufacturing soft drinks and bottled
waters. Second is beer production (34% of the turnover) and third wine production from
grapes (15%). The latter sub-industry accounts for almost half of the enterprises and are -
most probably- in majority winegrowers, who produce wine from their own grapes.
Table A2.11. Distribution of the sub industries of beverage manufacturing
NACE Description 2001 2011
Enterprises Turnover Enterprises Turnover
C110 Beverages manufacturing 100.0 100.0 100.0 100.0
C1101 Distilling, rectifying and blending of spirits 29.4 9.5 20.1 8.0
C1102 Manufacture of wine from grape 41.9 12.3 45.9 15.1
C1103 & C1104
Manufacture of cider and other fruit wines & other non-distilled fermented beverages
3.8 1.2 4.4 1.2
C1105 & C1106
Manufacture of beer & malt 12.8 31.7 18.0 33.7
C1107 Manufacture of soft drinks; production of mineral waters and other bottled waters
12.1 45.3 11.5 42.1
Source: BFS Mehrwertsteuer Schweiz.