of bc local governments - ubcmand~policy/policy... · of bc local governments ... be an appropriate...
TRANSCRIPT

AApprriill 22001100
EEvvaalluuaattiinngg tthhee EEccoonnoommiicc DDeevveellooppmmeenntt RRoollee
ooff BBCC LLooccaall GGoovveerrnnmmeennttss
AA SSnnaappsshhoott ooff CCoommmmuunniittyy EEffffoorrtt aanndd OOppppoorrttuunniittyy

All photographs in this publication have been gratefully provided by the local governments they represent
unless otherwise noted.
Front Cover Photographs (Left to Right): District of Mission, District of Maple Ridge (Memorial Peace
Park), Regional District of Central Okanagan, City of Nanaimo (City Hall), Fort St. James (Caledonia
Classic Dog Sled Race).
A publication by the Union of BC Municipalities (UBCM) with funding from the BC Ministry of
Small Business, Technology and Economic Development.
Photo credit: Michael Braun

FORWARD
It is our hope that the stories and information shared in this publication will
inspire local governments to be forward-looking and realize the economic
development opportunities inherent within their own communities.
In a 2004 survey on local government concerns UBCM members ranked economic development as the
number one priority for their communities. In response to that original survey UBCM ramped up its efforts in
economic development with additional funding support provided by the provincial government. In 2006 we held
a conference on economic development for local government elected officials, chief administrative officers and
senior economic development practitioners. This was a first of its kind for UBCM and it gave local
governments a venue to share successes and talk about issues.
UBCM’s early efforts were facilitated in large part by then Prince George Councillor, Dan Rogers. As the chair
of the Community Economic Development (CED) Committee at that time, Rogers put forward a proposal to the
Province to fund this initiative as a way to address the lack of research regarding the local government role in
economic development. We are grateful to him for his vision and pivotal role in the early stages of this project.
Economic development remains a top-of-mind issue for local governments, particularly given the economic
downturn and uncertainty facing all communities. This report represents the culmination of the work UBCM
has undertaken in economic development, but focuses on the findings from a survey on the roles of local
governments in economic development undertaken in the summer and fall of 2009. We are thankful to
members for their patience and support as we brought this project to fruition and we are grateful to those
members that contributed, both in the project’s early stages as well as in recent months. The committee also
extends a huge thanks to Joanne Gauci who has provided staff support to this initiative since its inception.
The stories of local government action aimed at bettering the economic and social well-being of their
communities and regions are numerous. This report provides a snapshot of these stories plus additional
resources in an effort to promote dialogue at the local level. The main objective of this publication is to
promote dialogue and inspire solutions to the challenges local governments face with respect to economic
development planning. We hope that this publication will serve as a valuable resource for UBCM members.
Feedback or comments about this publication can be directed to the CED Committee by email at:
Chair, Mayor Mary Sjostrom
Union of BC Municipalities’
Community Economic Development Committee


5
Table of Contents
Forward …………………………………………………………………………………………3
List of Charts…………………………………………………………………………………...7
Introduction……………………………………………………………………………………..9
Section 1 Economic Development Delivery Models………………………………… 13
1.1 Delivery Models – Overview of Survey Findings………………………………….. 14
1.2 Financing Economic Development…………………………………………………. 22
1.3 Thinking Regionally……………………………………………………………………23
1.4 Choosing A Delivery Model – Factors for Consideration………………………… 25
1.5 Conclusions…………………………………………………………………………… 28
Section 2 Planning for Economic Development …………………………………….. 29
2.1 Local Government Priorities – Overview of Survey Findings……………………..31
2.2 A Change in Focus – Looking Inward Not Outward………………………………. 32
2.3 The Economic Development Plan…………………………………………………...36
2.4 Barriers and Challenges to Economic Development Planning…………………...43
2.5 Conclusions…………………………………………………………………………….46
Section 3 Foundations for Success……………………………………………………… 47
3.1 Key Elements of Success – Overview of Survey Findings………………………. 49
3.2 The Imperatives – A Framework for Dialogue……………………………………...50
3.3 Exploring Partnerships……………………………………………………………….. 60
Section 4 Concluding Remarks…………………………………………………………… 63
Section 5 Economic Development Resources........................................................... 65
Appendix 1 – List of Survey Respondents…………………………………………….. 67
Endnotes and References …………………………………………………………………. 69

6

7
List of Charts*
Chart 1: 2009 Survey responses by population category...………………………………………………… 9
Chart 2: How does your local government deliver economic development?......................................... 14
Chart 3: How many full-time equivalencies does your local government devote to economic development?........................................................................................................................... 15
Chart 4: If you utilize an economic development officer, please indicate if it is a full-time, part-time, or shared position................................................................................................................... 15
Chart 5: Does your local government have a budget specifically for economic development?.............22
Chart 6: Is there an expectation that your local government’s economic development expenditures will increase, decrease, or remain the same in the next three to five years?........................... 22
Chart 7: Comparison of in-house versus arms-length delivery models................................................. 26
Chart 8: What are the top three priorities that represent the focus of your local government’s economic development efforts?............................................................................................... 31
Chart 9: Does your local government have an economic development plan or strategy?.................... 36
Chart 10: How often is your economic development plan updated?....................................................... 36
Chart 11: What stakeholder groups were involved in the process of developing your economic development plan? ………………………………………………………………………………….. 37
Chart 12: How effective has your economic development plan been at fostering economic development in your community?............................................................................................ 38
Chart 13: What are the top two internal and external barriers to economic development in your community?.............................................................................................................................. 43
Chart 14: What impact has the current global financial crisis had on your community?......................... 44
Chart 15: Foundations for success – an examination of critical factors ……………..……………………. 44
* Please note that the charts report on questions asked in UBCM’s 2009 survey on economic development and for ease of reference the chart title often corresponds with the wording of the survey question.

8
Photo credits (top to bottom, left to right): Prince Rupert and Port Edward Economic Development Corporation; Regional District
of Central Okanagan; Chilliwack Economic Partners Corporation.

9
Introduction
Project Background and Goals
In 2005 the UBCM Community Economic Development (CED) Committee responded to a members’ list of priority
issues by embarking on a survey of local government economic development practices. With the passing of four
years and a dramatic shift in the global economic climate underway it was considered by the UBCM Executive to
be an appropriate time to revisit the issue of economic development planning within BC local governments.
This report is not intended to be an exhaustive review of economic development in BC, nor is it intended to
duplicate efforts made by economic development umbrella organizations. Economic development planning by
local governments faces many challenges as local leaders and practitioners try to find the resources, expertise
and time to devote to this policy area in the face of increasing fiscal constraints and competing demands. While
healthy skepticism about the efficacy of local governments in stimulating economic development exists, this report
does not focus on this aspect of the contemporary debate.
Methodology
The UBCM CED Committee embarked on a second survey of local government members in June of 2009. The
survey had a 66 percent response rate1, with 124 of 189 local governments completing the survey (see Appendix
1 for a list of respondents). An excellent cross-section of responses was received from small to metropolitan
communities, as shown in Chart 1. The report presents the findings in the following categories, based on how
local governments identified themselves in the survey2:
• Small communities (less than 5,000 population);
• Mid-size communities (5,000 to 20,000 population);
• Large communities (20,000 – 50,000 population); and
• Metropolitan communities (50,000 + population)3.
The survey did not differentiate regional districts from
municipalities. Where possible the regional district
experience is reported on separately.
The 2005 survey provided the starting point for the design
of the 2009 survey, with many questions being repeated
and refined. In 2006 UBCM hosted a conference for local
elected officials and senior staff with the aid of provincial
government funding. Where appropriate this report also
draws on the findings from this conference.
By providing a snapshot of current practice, this report is intended to serve as a basis
for further discussion and exploration of the local government role in economic
development, with the objective of facilitating effective local government participation in
the economic development process.
Chart 1: 2009 survey responses by
population category
Small
40%
Mid-sized
25%
Large
14%
Metropolitan
21%

10
What do we mean by economic development?
Economic development means different things to different people. It involves a number of stakeholders –
government, non-government, community and private sector organizations – and it can imply different outcomes –
job creation, increased productivity or improved quality of life. For the purposes of this survey, a definition of
economic development has been loosely adapted from the World Bank4:
While there are many stakeholders in the economic development process, this report concerns itself with the local
government role in economic development. This role is varied and complex and is not characterized solely by
explicit economic development policies and programs. Local governments are increasingly adopting formal
economic development functions, programs and policies, but they also facilitate the development of their local
economy through core service delivery, like infrastructure provision and the carrying out of community planning
and development. This is an important and often undervalued contribution.
Why bother with local government economic development?
Local governments face a number of complex challenges and to remain economically competitive and sustainable
in a global and dynamic environment many have found it necessary to increase the scope and extent of their
economic development efforts. Local governments in metropolitan areas often face the challenge of meeting the
demands of a robust economy and growing population, while other local governments consider how to maintain
economic viability in the face of an over-dependence on resource industries, stagnating economies and declining
populations.
It is well accepted that local governments play a significant role in the economic development process and that
economic development success is largely dependent on effective local government participation5. While there is
substantial literature on the “how-to” of economic development there remains very little documentation of the
different roles of local governments in the process. As the representative body for local governments in BC,
UBCM is well positioned to address this research gap and provide a resource for UBCM members on this evolving
policy area.
Economic development is a collaborative process between all levels of government and
non-government organizations that builds up the economic and social capacity of an
area to improve its economic future and overall quality of life
(adapted from World Bank 20104).

11
An evolving policy area for local governments
The 2005 UBCM economic development survey revealed that local
governments have been playing a significant role in economic
development planning for quite some time but that the level of
intervention varies greatly across the local government landscape6.
While this suggests that economic development is not a new
responsibility for local governments, the degree and type of
intervention chosen is highly dependent on a number of external and
internal factors. Demographics, economic conditions, financial and
human resources, and the civic culture of a local government7 are but
some of the key determinants influencing economic development
decision-making at the local government level. 8
A trend toward a more formal economic development function has also been facilitated by changes to BC’s local
government enabling legislation – a process that began in the late 1990s and culminated with the enactment of the
Community Charter in 2004. While a full discussion of these changes is beyond the scope of this project, it is
important to note that the Community Charter affords local government greater autonomy and decision-making
power over issues that affect their local communities9.
As opposed to prescriptively setting out a series of rules that restrict local governments, the current legislation
provides broad powers “that allow local governments the maximum flexibility and scope needed to do their job”
and “provide any service they feel necessary or desirable”10. Economic development falls into the category of a
voluntary service and continues to compete with other essential services for the allocation of resources.
Document Outline
This report presents the findings of the survey and supplementary research along key thematic lines.
• Section 1 discusses delivery models and funding.
• Section 2 explores planning for economic development, including the process of plan-making, barriers to
economic development planning, planning in transition times, and creating effective plans.
• Section 3 explores the foundations for success, through the identification of six key imperatives, case studies
and a closer look at the role of partnerships in economic development.
• Section 4 presents concluding remarks.
• Section 5 provides a list of resources.
An underlying goal of the report is to provide a snapshot of local government practice throughout the province and
this is done through a series of Community Snapshots and insets throughout the document.
If interested only in the statistical findings from the 2009 survey, please refer to the supplementary document to
this report found on the UBCM website (www.ubcm.ca). The supplementary statistical report provides a summary
for each survey question response and a further discussion of the survey’s limitations.
All levels of government
have been involved in
economic development but
the balance of
responsibility and the types
of interventions have
changed8.

12

Section 1
Economic Development Delivery Models

14
1.1 Delivery Models - Overview of Survey Findings
For those local governments that adopt an economic development function, choosing a delivery model or
organizational structure is an essential consideration. Local government delivery of economic development
can take a variety of forms - some local governments employ an economic development officer (EDO), others
cover the economic development function through the planning department, while others fund an arms-length
organization or contract to an external organization on a fee-for-service basis.
This section illustrates that there is no single right answer for the best type of delivery model for all
communities. Local governments considering which organizational structure is best suited to their needs have
two main options but, as will be noted throughout this chapter, can also consider a blend of these options:
The “in-house model” is where an economic
development function is established within the
local government. This may be a single individual
with sole responsibility for economic development,
a multi-person department, or an individual or
department that handles economic development in
addition to other responsibilities.
The “arms-length model” is where the local
government provides funding, usually through a
fee-for-service arrangement, to an arms-length
organization. This can be a dedicated economic
development entity (such as a non-profit society or
development corporation), or an organization like a
Chamber of Commerce or Community Futures
Development Corporation.
Please note: Blue denotes in-house options and gray denotes arms-length options. Percentages do not add to 100, as multiple choices were allowed.
Chart 2: How does your local government deliver economic development?
(n=124)
2%
4%
12%
13%
16%
18%
18%
18%
21%
21%
35%
0% 10% 20% 30% 40%
Other
Chamber of Commerce
Private corporation or organization on fee-for-service basis
Related department
Economic development department
Regional District
We don't have an ED function
Non-profit society
Staff assigned to ED in addition to other duties
Voluntary committee mandated by local government
Economic Development Officer or equivalent

15
Degrees of Capacity
The level of institutional capacity for economic development among local governments varies, with 18 percent
of communities identifying that they do not have an explicit economic development function (see Chart 2).
This number is higher for regional districts, with 26 percent reporting that they do not have an economic
development function. While there is a trend toward local governments assuming more formal economic
development roles, there is still a large discrepancy in the level of intervention. This reflects the evolving and
voluntary nature of economic development as a local government service. By reason of necessity or choice,
many local governments still do not play an active role in economic development.
Reliance on In-House Delivery
For those local governments that have an economic development function the majority operate economic
development in-house, relying on some combination of less formal delivery mechanisms, such as the use of
voluntary committees, the services of a planning department or other related department, and/or the use of a
staff member with primary responsibilities other than economic development. Only 16 percent of survey
respondents identified having a separate economic development department (see Chart 2). Arms-length
delivery models such as the non-profit society and the private corporation are most prevalent among the 5,000
– 20,000 and 50,000 + population categories.
Modest Staffing Resources
Approximately one third of local governments employ
an EDO (Chart 2), making it the most commonly
identified delivery model. Of those that do employ an
EDO, the majority of these positions tend to be full-
time (75% as indicated in Chart 4). The majority of
local governments (55%), however, devote less than
one full-time equivalency to economic development
(Chart 3). As well, a significant proportion of local
governments (21% as indicated in Chart 2) continue
to rely on other staff – namely CAO’s, planners,
finance directors, clerks – to deliver an economic
development function “off the side of their desks” in
addition to their core responsibilities.
Move to Blended Models
Many local governments are embracing a blended
option with elements of both an in-house and arms-
length delivery model. Finding the appropriate
delivery model can involve refining an approach over
time to reflect the changing circumstances, needs
and priorities of the local government.
Choosing a delivery model is highly dependent on a
number of external and internal factors and the
survey results highlight that there is likely an
approach suited to the circumstances of each local
government.
Chart 3: How many full-time
equivalencies (FTE's) does your local
government devote to economic
development? (n=124)
2%6%
7%
12%
18%
55%
< 1.0 FTE 1.0 FTE 1.0 - 2.0 FTEs
2.0 - 4.00 FTEs 5.00 FTEs or > Don't know
75%
20%
10%
0%
10%
20%
30%
40%
50%
60%
70%
80%
Full-time EDO Shared EDO Part-time EDO
Chart 4: If you utilize an EDO, please indicate if it is a full-time, part-time or
shared position (n=60)

16
Evolution to a Blended Model in Revelstoke
The City of Revelstoke (popn 5,000 – 20,000) has had in place a successful blended economic development
model for many years – but this model has evolved over time. Revelstoke and Area B of the Columbia
Shuswap Regional District fund an economic development commission, employ an economic development
manager, and contract out their business information service and tourism function to the local Chamber of
Commerce. The economic development manager and the Chamber of Commerce are co-located with the
local Community Futures Development Corporation (CFDC) at the Revelstoke Business Information Centre to
provide a “one stop shop” for local residents and potential investors.
The contract with the Chamber of Commerce began with a contract for business information services in the
mid-1980s and culminated with an additional contract for tourism (including funding for a tourism coordinator)
in 1997. When CFDC’s were being established in the province, the area B of the regional district and the city
funded half the salary of a contractor to cover the economic development function and CFDC covered the
remaining 50 percent of this expenditure.
Eventually the need for the city and area B of the regional district to hire its own economic development staff
became evident. While the local CFDC was no longer funding the position, the linkages between the city,
regional district and the CFDC had been developed and co-location was seen as mutually beneficial.
Co-location was also a priority for Revelstoke and the regional district when negotiating the contracts for
services with the Chamber of Commerce because of the many benefits it offers. Benefits include: ensuring
the coordination of work among the local service providers, eliminating the duplication of effort, and ensuring
no one organization works in a silo – separated and removed from that of its counterparts. This approach also
makes excellent use of limited financial and human resources. Today’s current structure has been in place
for over twenty years and provides clear lines of responsibility for stakeholders. The public, who has a
streamlined “one stop shop” service at their fingertips, however, gains the real benefit from this approach.
Source: Alan Mason, Director of Community Economic Development, City of Revelstoke.
Working toward downtown revitalization, preserving architectural heritage and developing a world-class ski
resort have been important community goals in Revelstoke.
17
Reliance on Voluntary Committees
Voluntary committees are a common delivery model, particularly among communities that lack large budgets.
Ideally, these committees contain members of the public and business community in addition to elected
officials and staff. Nearly all of these committees are advisory. Some have a fixed roster of appointments that
come from designated organizations or relevant sectors.
Committees can require potential board members to apply, however many
committees use their knowledge of community leaders to identify and
approach individuals. Any opportunity to recruit community champions
improves the potential for committee success, as having the right volunteers
often makes the difference with respect to vision setting and the
implementation of projects.
The participation of the business community can be less easily achieved with the in-house delivery models
where business leaders must work within a bureaucratic framework. For example, one BC local government
noted in the survey that they have struggled to maintain an advisory committee over the years as there is a
feeling that council has not been interested in allowing others to provide direction to the economic
development program.
Outlined below are issues and elements of success to consider when establishing voluntary committees.
Voluntary Committees - Issues
• Ensuring the commitment and backing of
council.
• Getting the business community to engage in
a local government model that can be
bureaucratic.
• Avoiding the “sectorization” of a board, where
sector representatives feel responsible for
representing their sector rather than acting in
the best interest of the economic development
organization.
• Ensuring the introduction of “fresh blood”
through the use of term limits.
• Avoiding the politicization of the board.
Voluntary Committees - Elements of Success
• Support of the local government, the business
community, and the public at large.
• A transparent and rigorous selection process.
• Involvement of key business stakeholders who
know the needs of the business community
and can aid in the development of strategies
that target the most important economic
development issues.
• Involvement, in some capacity, of all key
sectors of the local economy.
• The establishment of a clear mandate and
action plan early in the process to focus the
work of committee members.
The input of committee
members is best received at
the strategic level as
opposed to the operational
level.
Survey respondent
Popn 20,000 – 50,000

18
_________________________
“As a community grows there is an increasing diversity in its
economic strengths and the ‘old guard’ of long-established
business owners do not always recognize how new businesses
(home-based, service or knowledge businesses) can sustain the
economy.
Sometimes there is tension between the ‘vision’ that well-
established persons have for their community and how newer
residents (retirees, pre-retirees, young professionals, immigrant
professionals) view the economic opportunities in a community.”
____________________________________________________
Survey respondent
Popn 50,000 +

19
Examining the Effectiveness of Delivery Models
The survey sought to identify how effective – “highly effective, somewhat effective, not
too effective, not at all effective” – local governments felt their chosen delivery model to
be. There was differentiation by community size as well as by the type of delivery
model.
Only 26 local governments or 21 percent of respondents stated that they had a highly effective economic
development delivery model (n=121). While highly effective was the top answer for local governments in the
20,000 – 50,000 and 50,000 plus population categories, the majority of smaller communities (0-5,000 and
5,000 – 20,000 population) chose “somewhat effective”.
Those employing an EDO expressed the greatest satisfaction with their organizational structure, with 64
percent of local governments with an EDO stating they were highly effective. The economic development
department and the voluntary committee ranked second and third respectively.
In general, in-house models were considered more effective than arms-length models. However, very few of
those that utilized a non-profit organization or private corporation ranked the effectiveness of their delivery
model, making it difficult to determine how these models compare. The fact that most delivery models were
labeled “somewhat effective” by the majority of respondents suggests that there is room for improvement as
well as a more critical analysis of how different delivery models are meeting the goals set by local
governments.
Eight Criteria Influencing the Effectiveness of Delivery Models
• Amount of staff
• Quality of staff
• Financial commitment
• Contact with stakeholders
• Support of council
• Support of community
• Evidence of partnerships
• Presence of a regional approach
Eight key considerations were identified through the research as impacting on effectiveness: amount of staff;
quality of staff; financial commitment; contact with stakeholders; support of council; support of community;
evidence of partnerships; and the presence of a regional approach.
Those that noted their model to be ineffective often cited these criteria as lacking. Being able to dedicate staff,
even on a part-time or one day a week basis, allows time to advance initiatives and undertake research as well
as enable active engagement with the community and stakeholders. Having the right person - someone that is
both knowledgeable and able to communicate well - allows for effective networking and communications to
take place. Many respondents that noted having an effective delivery model were only funding a very small
function, suggesting that desirable outcomes can be achieved with modest funding commitments and that the
level of funding and staffing can be reflective of the size of the local government, with smaller commitments for
local governments with smaller operating budgets.

20
COMMUNITY SNAPSHOT: In-house Delivery Models
• ECONOMIC DEVELOPMENT OFFICER WITHIN A LOCAL GOVERNMENT: The District of Chetwynd
(popn 0 - 5,000) employs one full-time EDO and one full-time assistant and has an economic development
commission. The EDO has been in place for eight years and before that the district did not have an
economic development function for at least two years prior. The arrangement works because the EDO
has the full support of council and the economic development commission and there is one individual
dedicated to researching opportunities and providing consistent contact with the business community11.
• ECONOMIC DEVELOPMENT DEPARTMENT WITHIN A LOCAL GOVERNMENT: The City of Nanaimo
(popn 50,000 +) has been operating an in-house economic development department since the mid-1990s.
The department now has five full-time staff and an advisory Economic Development Group (EDG). Having
the function within the local government ensures responsiveness to issues impacting local business (e.g,
close connection to city’s planning department). Having the EDG comprised entirely of key stakeholders
from the community ensures that all decisions regarding economic development projects reflect a
commitment to the community as a whole12. The City of Terrace (popn 5,000 – 20,000) has a similar
arrangement.
• ED AGENCY THROUGH A REGIONAL DISTRICT: The Regional District of Central Okanagan (popn
185,000) funds the Central Okanagan Economic Development Commission (CO EDC), which is guided by
a 30-member advisory board from local government, collaborative organizations, and representatives from
the business community. The CO EDC employs three full-time staff and at any one time contracts out up
to five additional positions to offer specialist services in areas such as business enhancement, agriculture
support, and export development. Having one economic development function for the region has meant
being able to deliver relevant programs that have had a valley-wide impact13.
Photo credits (left to right, top to bottom): Chilliwack Economic Partners Corporation, Regional District of Central Okanagan, District of
Chetwynd, City of Merritt, City of Nanaimo (Newcastle Island).

21
COMMUNITY SNAPSHOT: Arms-length Delivery Models
• NON-PROFIT SOCIETY: The Town of Golden (popn 0 – 5,000) partners with the Columbia Shuswap
Regional District to fund an economic development society. Golden Areas Initiative is staffed with one full-
time EDO and one full-time and one part-time support staff. This model works for this local government
because it provides one voice for economic development in the greater Golden area and there is an
enthusiastic board of directors combining both local government elected officials and members at large
from the community14. Other local governments that utilize a non-profit society include: the City of
Courtney (popn 20,000 – 50,000) that partly funds the Comox Valley Economic Development Society and
the City of Salmon Arm (popn 5,000 – 20,000) that funds the Salmon Arm Economic Development
Society through business license revenues.
• CONTRACT WITH EXTERNAL AGENCY: The City of Merritt (popn 5,000 – 20,000) has a service
agreement with the Community Futures Development Corporation of Nicola Valley (CFDC of NV) for the
provision of an EDO, an arrangement that has been in place since 2001. The current budget is based on a
financial contribution from the city and an in-kind contribution by CFDC of NV. This model provides the
ability to leverage additional funds, and projects are often supported by Western Economic Diversification
Canada, Human Resources Development Canada and private entities. Through cost sharing the city can
afford a more substantial economic development function then it would on its own and is also able to
access the expertise of staff at CFDC of NV. The EDO is housed in the CFDC of NV office and reports to
the CEO and board of directors, yet can still easily liaise with city staff when economic development
proposals have a development or land use issue. Operating at arms-length also allows goal setting to be
done without the direct influence of council and it enables companies or individuals to get a sense for the
community and its demographics also without the influence of council15.
The Regional District of Kootenay Boundary (popn 20,000 – 50,000) has a contract in the Boundary
communities (Grand Forks, Greenwood, Midway, electoral areas C, D and E) with the Community Futures
of Grand Forks and Boundary Region. In the Kootenay communities (Rossland, Warfield, Trail, Montrose,
Fruitvale, and electoral areas A/B) they are finalizing an agreement with the Lower Columbia Community
Development Team16.
• ECONOMIC DEVELOPMENT CORPORATION: Chilliwack Economic Partners Corporation (CEPCO) is a
private company wholly owned by the City of Chilliwack (popn 50,000 +) and incorporated in 1998. A 16-
20 person board of directors reflects the partnership’s public-private make-up and community-wide
representation. As a city-owned company, CEPCO benefits from the input of city staff, elected officials
and the business community. The CEPCO office is home to subsidiaries that target specific sectors (e.g.,
the Chilliwack Agricultural Commission, the Chilliwack Film Commission and the Chilliwack Aviation and
Aeropsace Committee) and also houses other close partners such as the City of Chilliwack Business
Licensing Office. Core funding is provided by the city through a service agreement on a five-year basis.
Having a stable long-term funding source also enables CEPCO to leverage other funding sources.
CEPCO has a reputation for having one of the most business friendly approaches to assisting business
and places client services a number one priority17. Another example of a wholly owned municipal
corporation is the Quesnel Community and Economic Development Corporation, which represents the
City of Quesnel (popn 5,000 – 20,000).

22
1.2 Financing Economic Development
The 2009 survey did not ask local governments how much
they were spending on economic development, as what
constitutes economic development expenditures is open for
interpretation. Both the 2005 and 2009 survey, however,
asked local governments if they had a budget for economic
development (Chart 5) and if they expected future funding
to increase, decrease or remain the same (Chart 6).
According to the survey, 75 percent of local governments
have a budget for economic development and 97 percent
of local governments expect their future funding levels to
remain the same or increase. The fact that only three
percent expect a decrease in funding underscores the
importance of economic development on the local
government agenda.
Some additional observations can be made about funding
based on the research:
• The economic development budgets of local
governments are modest but growing and funding
varies by community size, with smaller municipalities
generally providing less funding than larger
communities.
• An increasing number of communities are leveraging
local government investment in economic development
by sharing overhead costs with other organizations or
by pooling funds with adjacent jurisdictions.
• Nearly all core funding for economic development is
derived from local government.
• Some municipalities have dedicated business license
revenues to funding economic development.
• Cost-sharing for economic development organizations covering multiple jurisdictions are usually based on
each area’s share of total property assessment, although a per capita funding formula can also be used.
• Arms-length organizations are able to access a wider range of core funding sources. These include
income from rent and land development, selling of professional services and corporate sponsorships.
• Project funding is available from various government agencies. Some programs are long-standing, with a
regular application and award cycle, while others require local governments to respond quickly as funding
opportunities become available18.
Chart 5: Does your local government have a
budget specifically for economic
development?
Yes
75%
Don't know
2%No
24%
Please note: Economic development budgets for the purposes of this survey include any core funding (i.e., stable year to year funding provided through general
revenues or other government source), project funding or tourism funding. Numbers do not add to
100 due to rounding.
(n=123)
Chart 6: Is there an expectation that your local government’s economic development
expenditures will increase, decrease, or remain the same in the next three to five
years? (n=119)
Increase
39%
Decrease
3%
Remain
the same
58%

23
Will a Regional Approach Work for You?
The Cities of Prince George and
Kamloops were formerly the central
communities for regional partnerships
for the very large Fraser-Fort George
and Thompson-Nicola Regional
Districts. Both municipalities now fund
municipal-only economic development
organizations.
A small community (popn 0-5,000) that
formerly had an in-house economic
development office with fewer than two
staff reported that they joined a
regional partnership with a
neighbouring electoral area and
through cost-sharing now have three
full-time staff at a lower cost.
1.3 Thinking Regionally
Many local governments are involved in regional economic development entities. Sharing of costs and the
leveraging of additional resources are the primary arguments in favour of a regional approach. The resources
of a combined regional entity are often more than any of the individual entities could fund on their own. This is
particularly true of small communities that can deliver a far more substantial economic development program
by partnering with other communities in their region.
Most of the provincial economy is regional in nature and innovation is
also best thought of at the regional level. There are about 515,000
people living in unincorporated areas in the province (11.5% of the
total provincial population)19, most of who live near incorporated
municipalities that act as retail and service centres and places of
employment. In more urbanized areas, adjacent municipalities often
function as part of a single regional economy. Businesses looking to
invest in an area are interested in the size of the market, regardless of
boundaries, so it often makes better sense for multiple jurisdictions to
have a unified economic development organization or approach.
Regions are also large enough to offer a critical mass of companies,
institutions, infrastructure and talent, while small enough to enable
close interactions among people, firms and organizations - factors
that contribute to regional innovation20.
Collaboration at the regional level allows local governments to work together to achieve common goals or
address common needs and potential partners include not just other local governments but First Nations,
community groups and private sector organizations. Taking a regional approach also offers the opportunity to
access additional sources of funding that would otherwise be unavailable.
The survey results indicate that a number of local governments are maximizing returns by working together at
a regional level. Regional partnerships can take many forms: a local government can choose a regional
delivery model for an economic development function or choose to deliver their economic development
function independently but come together with neighbouring communities on projects that will provide mutual
benefits, such as tourism planning and infrastructure investment.
There are some important considerations when developing a regional approach. Regional economic
development organizations face unique challenges, regardless of how they are structured. There can be
political difficulties in ensuring that each contributing entity (either a municipality or a regional district electoral
area) is satisfied that they are receiving value for their contribution. It is often the case that smaller entities
feel, either fairly or unfairly, that the central or largest community receives most of the attention and benefit of
the economic development program.

24
ddddddddddddddddddddddddddddddddddddddddddd
The physical size of a region is important when considering a regional function or partnership. Many economic
development professionals noted that a regional partnership would not work in their area due to the geography
of the region and the long travel times to get to outlying communities. Large distances can diminish the
argument that the entire region functions as a single economy and can make it more difficult for outlying areas
to feel connected to activities happening at the centre.
Electoral areas of a regional district can be very different in terms of economic drivers, population, industry
base, accessibility and tourism draw. Often, it may make sense for only one electoral area to enter into a
partnership with a neighbouring community for the delivery of an economic development function. For
example, the Thompson-Nicola Regional District (TNRD) (popn 50,000 +) uses a blend of options. In some
electoral areas it is the director who looks after economic development and in other electoral areas funding is
provided to local business associations. In other cases the TNRD and member municipalities jointly fund
economic development contract positions and projects. The TNRD has no overall dedicated economic
development position and some electoral areas still have very limited economic development activities.
Regional Collaboration Pays Off for Communities on Vancouver Island
Having an organized regional approach, with all stakeholders working together, has been noted as the key
to success in bringing a number of large-scale provincial investments to the mid-Vancouver Island region.
The City of Nanaimo, with the support of the port authority, airport authority, regional district and
neighbouring First Nations approached the Province collectively for funding for key “regional” infrastructure
investments.
The group, working together, was successful in securing a significant provincial contribution for its airport
expansion project, Port of Nanaimo Cruise Ship Terminal and the Port of Nanaimo Centre – a multi –
purpose civic and commercial centre in downtown Nanaimo that includes a new conference facility.
Together, these strategic infrastructure projects will facilitate economic opportunities for the entire region
and is a reflection of what a well-organized consortium can accomplish when working collectively.
Source: Island Coastal Economic Trust (www.islandcoastaltrust.ca)
Marilyn Hutchinson, Economic Development Officer, City of Nanaimo.

25
1.4 Choosing a Delivery Model – Factors for Consideration
As already mentioned there is no one “right” model for economic development and there are many variations
within an in-house and an arms-length model to choose from. There are a number of factors to consider when
determining which model may be suitable and it may take time to find the structure that best fits the
circumstances of a particular local government.
Six main factors for consideration are:
• operational costs and access to external funding;
• relationship with business community;
• relationship with local government;
• administration and regulation;
• co-location with other agencies (e.g. tourism, film); and
• “deal-making” and the provision of incentives.
The following table offers a comparison of the in-house and arms-length delivery model based on these
factors. Each local government also must take into consideration what they hope to accomplish and pay close
attention to the resources and programs of other organizations that are already operating in the area, such as
Community Futures Development Corporations, Chambers of Commerce, Business Improvement Areas,
rotary clubs, tourism agencies and economic development agencies at the regional level and in nearby
communities. The goal should be to identify gaps in service and construct an organization that fills those gaps
and does not duplicate services that are already in place.

26
IN – HOUSE DELIVERY MODELS
Operational costs / access to external funding
� Overhead costs absorbed in local government budgets.
� Access to government funding programs is the same regardless of the organization’s structure. The only exceptions are for projects that exceed the typical mandate of a local government (e.g., constructing commercial buildings).
Relationship with business community
� Enables coordinated service across all departments.
� Provides business community with direct access to decision-makers.
� Subject to Freedom of Information requests, so care required to maintain confidential business information
Relationship with local government
� Proximity to local government departments enhances information sharing and coordination of activities.
� Allows greater opportunity for political influence and control over economic development activities.
� Enables economic developers to exert greater influence on the direction of local government policy.
� EDO’s can act as champions for large projects within local government.
Administration and regulation
� Involving the EDO in meetings and issues with little relevance to the position can detract from the economic development function
� Having access to all areas of local government can ensure that economic development remains a top-of-mind issue and is considered in all other areas of government.
� Need for senior staff / council approvals can slow response time to business demands.
Co-location with other agencies
� Co-location is possible but may involve more “hoops” to jump. Maintaining an office outside of local government (even if economic developer is still employed by local government) can enhance the relationship with business community.
� Possible for some agencies to be brought into the local government but tourism promotion in particular is often more suited to a location outside of government offices.
“Deal-making” and provision of incentives
� Constrained by local government legislation that prohibits offering anything to a company that might confer an advantage relative to other companies.
� Lack of incentives (e.g., property tax reduction, free infrastructure upgrades, support for training) relative to American locations may be a disadvantage in the eyes of American companies that are accustomed to being offered inducements to locate in a particular area. However, this avoids the “race to the bottom” that happens when municipalities compete to offer the best incentives.
Chart 7: Comparison of in-house versus arms-length delivery models

27
ARMS – LENGTH DELIVERY MODELS
Operational costs / access to external funding
� Overhead costs can be shared with other jurisdictions if a regional entity is created. Some economic development offices own buildings and charge rent to other organizations, while others are tenants in facilities owned by other organizations.
� May have greater access to non-traditional sources of funding through partnerships, sponsorships, for-profit ventures, etc.
Relationship with business community
� Economic developer viewed more as an advocate for business, and less as part of the regulatory body.
� Greater assurances of privacy and confidentiality.
� Direct access to decision-makers is not likely with many arms-length models.
Relationship with local government
� Difficult to have effective communication with local government and input into relevant local government policies.
� Physical separation of economic development office can exacerbate communication problems.
� Less direct oversight by local government can lead to a sense of disconnect and consequent loss of political support for the economic development organization.
� Independence from local government control reduces influence of politics on decision-making.
Administration and regulation
� Independence from local government can lessen administrative burden and allow more rapid response to opportunities.
� Dealing with the “operation of an organization”, whether it be a non-profit or private corporation, takes up a certain amount of time
� Having non-union staff enhances flexibility; contract labour can be moved in and out as project demands change.
Co-location with other agencies
� Co-location allows for greater co-ordination of activities and a reduction in overhead costs. Possible partners include Chambers of Commerce, Community Futures Development Corporations, Business Improvement Areas and other business-related groups.
� There may be significant synergies between, for example, tourism promotion, investment attraction promotion, and new resident promotion that are less likely to be realized with separate organizations.
“Deal-making” and provision of incentives
� Freedom to be creative in dealing with potential investors, and possible to own land and sell it - not necessarily to the highest bidder, but to the bidder that will create the greatest economic value from the land.
� Ability to negotiate a comprehensive deal that may include other inducements to the company, such as assistance with financing or a lower land sale price.
� Increased freedom to structure deals, although not comparable to the incentives offered by American jurisdictions.

28
1.5 Conclusions
• One size does not fit all. There is no single best model for local economic development and there are a
number of different options available to local governments.
• Each local government must take into consideration their objectives for economic development, the range
of services that are already being provided by other agencies, the amount of available funding, and
potential partners.
• The “in-house” model of economic development remains the most common organizational structure for BC
local governments, but there is a trend toward more arms-length organizations, particularly in the 5-20,000
and 50,000 + population categories.
• An economic development advisory committee is a common tool for the delivery of an in-house economic
development model, but careful consideration needs to be given to ensuring a broad cross-section of
community representation, council and area-wide support, as well as a rigorous and transparent selection
process.
• Arrangements for economic development can vary within a regional district, with the approach in each
electoral area reflecting its distinct and unique geography, population, economic drivers and community
partners.
• The regional nature of the BC economy suggests that economic development is often more suited to a
regional approach than a single-community approach. Thinking regionally and engaging in partnerships
can be particularly important for small communities.

Section 2
Planning for Economic Development

30
The role of small businesses in the BC economy:
“The small business sector continues to play a key role in strengthening job
creation and economic growth in British Columbia. It is the province’s
primary provider of private sector jobs, reflecting an important and ongoing
trend toward economic diversification within the provincial economy. Small
business is also a vital source of innovation – nearly all high technology
businesses in British Columbia are small businesses.”
FACT:
Small businesses in BC account for 98 percent of all businesses in the province and BC ranks first in the country in terms of small businesses per capita, with 87.7 small businesses per 1,000 people.
British Columbia Small Business Profile 2009
A joint publication of Western Economic Diversification Canada and the
BC Ministry of Small Business, Technology and Economic Development
October 2009, www.gov.bc.ca/sted

31
2.1 Local Government Priorities – Overview of Survey Findings
There was little differentiation by population category with respect to economic development priorities (Chart
8). The survey results suggest that all local governments, regardless of size, generally share the same top
three priorities:
• Retaining and expanding local business (70%);
• Attracting external industry, businesses and resources (57%); and
• Investing in hard strategic infrastructure (40%).
Chart 8: What are the top three priorities that represent the
focus of your local government’s economic development efforts? (n=114)
70%
57%
40%
29%
27%
23%
18%
10%
0% 20% 40% 60% 80% 100%
Retaining and expanding local business
Attracting external industry, businesses and
resources
Investment in hard strategic infrastructure
Sector/business cluster development
Fostering new enterprises
Area targeting/regeneration strategies
Investment in soft infrastructure
Other (please specify)
Business Retention and Expansion
Business retention and expansion is consistently viewed as one of the cornerstones of a successful economic
development program. This approach focuses limited dollars on a sector of the local economy that already
has a vested interest in the community and the survey results indicate that local governments continue to see
this as a top priority, with 70 percent of respondents identifying it among their top three priorities.
Business Attraction
With 57 percent of local governments identifying business attraction as a top priority, it remains a common
economic development goal for many local governments in BC. Fostering new enterprise or encouraging the
growth of new companies from within the community remains a lower priority, with only 27 percent of
respondents identifying it among their top three priorities.
Infrastructure Investment
A traditional responsibility of local governments is the provision of infrastructure and in both the 2005 and 2009
survey it was identified as one of the top three priorities. Traditional infrastructure provision - roads, water,
sewer - have long been linked to economic development. Investment in amenity-based or place-based
infrastructure – e.g., civic and arts centres, vibrant public spaces, recreation facilities, and parks – is now
considered essential in the attraction of a skilled labour force and new companies and is therefore also top-of-
mind for many local governments21.

32
2.2 A Change in Focus: Looking Inward Not Outward
Should local governments be rethinking their priorities? Business
attraction and business retention and expansion (BR+E) have their
place in economic development but what weight should be given to
each, particularly with limited resources? Current research suggests a
realignment of priorities to reflect22:
• Thinking of business retention and expansion as business
development;
• A greater emphasis on entrepreneurship and innovation; and
• A strong community development foundation.
Business Development
Business development denotes a more strategic approach to traditional business retention and expansion than
currently exists, with a greater emphasis on the end product and a shift toward the collection of more strategic
business information. Traditional BR+E contact with businesses can rely too heavily on confirming easily
obtainable business information and information regarding community problems – information that is not
actionable – as opposed to more strategic company information such as growth potential, market trends and
opportunities, and product development. With comprehensive business development programs there is also
added emphasis on the economic development organization as the hub – “connecting companies and
business support programs to stimulate and/or accelerate the growth of companies in the community”23.
Entrepreneurship and Innovation
Entrepreneurial development and innovation are
increasingly viewed as an economic development
priority. An entrepreneur has the ability to grow and
expand the market and as such is vital to the local
economy because of their ability to create jobs and fuel
innovation.
The ability for local governments to foster entrepreneurial
development has often been questioned. While there are
clear roles for federal and provincial governments there
are also ways in which local governments can provide
support. This can be done by assuming roles in:
information dissemination; investment in hard, soft and
intellectual infrastructure; and fostering connections.
The art of cultivating innovation is “combining bottom-up
strategies, with top-down support” from different levels of
government”24. Facilitating a coordinated approach and
ensuring a favourable business environment promotes an
atmosphere for entrepreneurialism and innovation to
flourish.
Business
Attraction
Business
Development
Entrepreneurship
Community Development
Economic Gardening
Economic gardening refers to the ability to grow
local businesses and is an example of
entrepreneurial and business development.
Entrepreneurial by nature, the emphasis is on
providing the tools necessary to grow your local
businesses by developing small business
incubators, addressing zoning and permitting
processes, providing training to start-ups and
connecting entrepreneurs to start-up finance.
Spearheaded in Littleton Colorado, the economic
gardening movement has taken root in many
communities because of its ability to:
• create significant job growth;
• reduce reliance on a single employer;
• expand local companies with a greater
commitment to the community; and
• support growth without the use of outside
assistance or incentives.
Source: www.ruraldiversification.com (see endnote 22).
For more information see: www.littletongov.org.
33
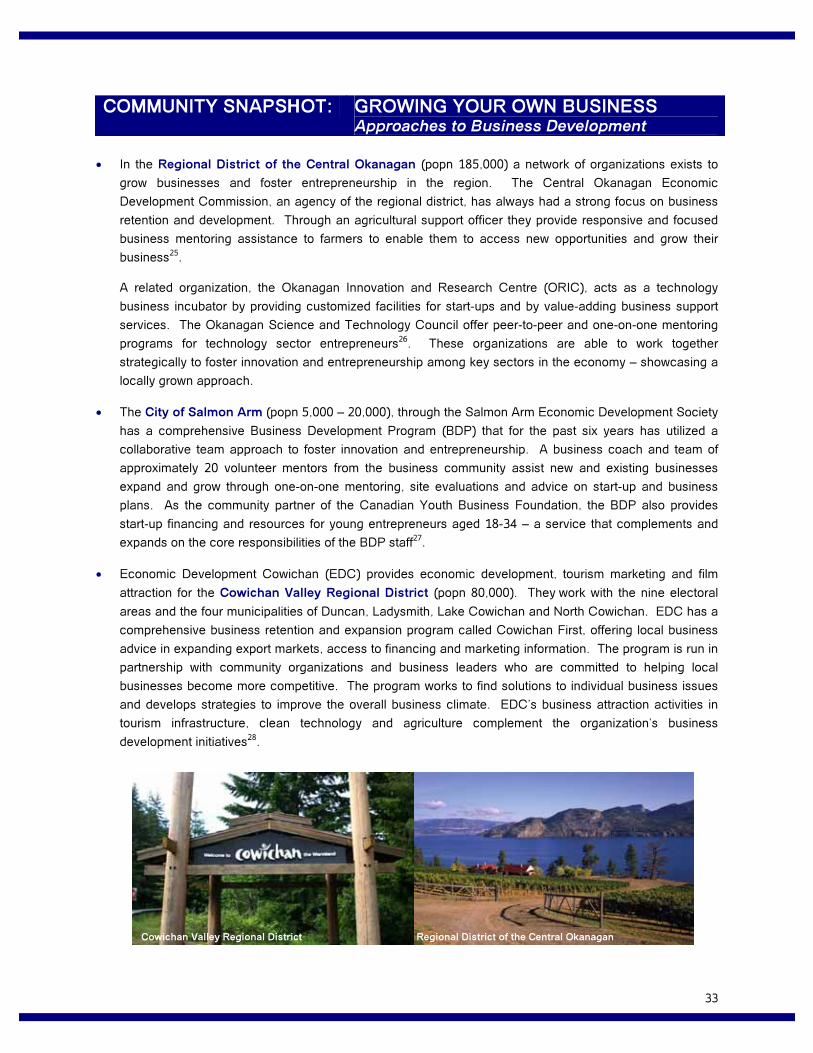
COMMUNITY SNAPSHOT: GROWING YOUR OWN BUSINESS Approaches to Business Development
• In the Regional District of the Central Okanagan (popn 185,000) a network of organizations exists to
grow businesses and foster entrepreneurship in the region. The Central Okanagan Economic
Development Commission, an agency of the regional district, has always had a strong focus on business
retention and development. Through an agricultural support officer they provide responsive and focused
business mentoring assistance to farmers to enable them to access new opportunities and grow their
business25.
A related organization, the Okanagan Innovation and Research Centre (ORIC), acts as a technology
business incubator by providing customized facilities for start-ups and by value-adding business support
services. The Okanagan Science and Technology Council offer peer-to-peer and one-on-one mentoring
programs for technology sector entrepreneurs26. These organizations are able to work together
strategically to foster innovation and entrepreneurship among key sectors in the economy – showcasing a
locally grown approach.
• The City of Salmon Arm (popn 5,000 – 20,000), through the Salmon Arm Economic Development Society
has a comprehensive Business Development Program (BDP) that for the past six years has utilized a
collaborative team approach to foster innovation and entrepreneurship. A business coach and team of
approximately 20 volunteer mentors from the business community assist new and existing businesses
expand and grow through one-on-one mentoring, site evaluations and advice on start-up and business
plans. As the community partner of the Canadian Youth Business Foundation, the BDP also provides
start-up financing and resources for young entrepreneurs aged 18-34 – a service that complements and
expands on the core responsibilities of the BDP staff27.
• Economic Development Cowichan (EDC) provides economic development, tourism marketing and film
attraction for the Cowichan Valley Regional District (popn 80,000). They work with the nine electoral
areas and the four municipalities of Duncan, Ladysmith, Lake Cowichan and North Cowichan. EDC has a
comprehensive business retention and expansion program called Cowichan First, offering local business
advice in expanding export markets, access to financing and marketing information. The program is run in
partnership with community organizations and business leaders who are committed to helping local
businesses become more competitive. The program works to find solutions to individual business issues
and develops strategies to improve the overall business climate. EDC’s business attraction activities in
tourism infrastructure, clean technology and agriculture complement the organization’s business
development initiatives28.
Regional District of the Central Okanagan Cowichan Valley Regional District

34
Penticton Economic Development Services
ramps up business development in
response to global economic downturn
In November 2009 Penticton Economic Development Services responded to the current global economic
downturn by engaging in over 30 in-depth interviews with key local businesses. The interviews with
senior management provided a comprehensive overview of the issues and opportunities facing the local
business community and identified areas where Penticton Economic Development Services could be of
assistance in the immediate short-term. Staff is now using this information to ramp up their business
retention and expansion program by providing a coordinated approach to export market and research
assistance in four key industries: manufacturing, value added wood products, agricultural products and
environmental technology.
To complement and build on their expanded business development program, Penticton has also
approved an economic incentives investment zone strategy. This strategy aims to: attract development of
a new hotel and investment in the existing accommodation inventory; stimulate investment in building
improvements in the downtown core; and stimulate investment in new construction and upgrades in the
industrial area of Penticton. For more information, go to: www.imaginepenticton.ca.
“Penticton’s Business Development Program will place a significant
emphasis on creating a business environment for stable, successful
companies in a global marketplace. The rationale for this approach is that
locally owned businesses have a long-term commitment to the community.
These businesses relate to the community’s lifestyle and they have a
vested interest in their community’s quality of life.”
David Arsenault
Economic Development Officer
Penticton Economic Development Services

35
Community Development
There are strong linkages between community development and economic development and many
researchers and practitioners assert that successful economic development must be based on strong
community development foundations29. By building a strong community development platform, a local
government is laying the foundations for seizing opportunities when they arise. The challenges facing BC
communities are no different than those facing other Canadian communities and the case study of
Gravelbourg, Saskatchewan illustrates how building on a community’s unique assets and investing in quality of
life and quality of place factors can foster economic development.
Gravelbourg, Saskatchewan (popn 0 - 5,000) is a
small community southwest of Moose Jaw,
Saskatchewan. Gravelbourg has been successful in
leveraging its multicultural heritage, which includes
strong francophone roots, to redefine itself30.
Concern arose in the mid-1990s about community
decline. Local elections in 1996 represented a turning
point for the community and resulted in the town’s first
EDO being hired in 1998. The EDO was instrumental in helping the community set a vision for itself based on
a sustainable community development model and numerous initiatives were spearheaded and supported by
town council. Community success in Gravelbourg has largely been attributed to the contribution of volunteers
and momentum was achieved in the initial stages through small, volunteer-led projects including a town
beautification initiative and a campaign to the save the local grain elevator.
Following a sustainable community development model based on the leveraging of place-based assets has
proved successful for Gravelbourg and with an emphasis on quality of place and quality of life Gravelbourg has
increased tourist attraction, resident retention and resident attraction. Today, people come to experience “A
Touch of Europe on the Prairies” and the town’s early successes have multiplied into more far-reaching
successes including the start-up of a mustard processing plant – Mustard Capital Inc (MCI). A concept
originally identified by the economic development office, MCI has utilized vacant office and retail space in
Gravelbourg and benefits to the community have included job
creation, further business development through spin-offs, and
enhanced community pride.
Lessons learned from Gravelbourg
• Devise and implement a broad range of development
initiatives.
• Tap into local, place-based assets.
• Take advantage of provincial and federal government
programs.
• Harness and nurture local stocks of social capital and be
inclusive.
• Focus on quality of life to generate numerous benefits.
• Successful community economic development can be
achieved with the most modest budgets.

36
Chart 9: Does your local government have an economic development plan
or strategy? (n=121)
Yes
53%
No
45%
Don't
know
2%
2.3 The Economic Development Plan
An economic development plan can be an important tool for focusing a local government’s economic
development effort. Even though the day-to-day work of the economic developer is often focused on the
opportunity of the moment, it remains essential that the overall direction of the organization be guided by a
well-conceived plan. Planning allows scarce resources to be most effectively deployed to the areas that are
believed to generate the greatest economic benefit.
Presence of a Plan
The majority of local governments (53%) have an economic
development plan (Chart 9). Communities that do not have
an explicit economic development budget often have
economic development policies set out in other planning
documents, such as the Official Community Plan or annual
work plans. These documents serve much the same
purpose in guiding the projects that will be completed over
the course of the year and providing a set of goals against
which progress can be evaluated.
Differentiation by Community Size
A relationship between the size of the community and the
presence of an economic development strategy was also
evident, with small communities (popn 0 - 5000) and mid-
sized communities (popn 20 - 50,000) slightly less likely to
have an economic development plan than those in the
5,000 – 20,000 and 50,000 plus population category. While
the reason for this trend in smaller communities is likely
related to capacity issues, it is possible that for mid-sized
communities within or adjacent to metropolitan areas the
need to manage growth takes priority over the need to plan
specifically for economic development.
Updating of Economic Development Plans
There is a range in terms of how often local governments
are updating their economic development plans (Chart 10).
The majority of local governments update their plans only
when the need arises (32%), with others updating them
annually (23%) or every two to four years (23%). The
survey results indicate that it is often harder for smaller
communities to update their plans on a regular basis.
Plans, as discussed in the next section, should be living
documents that are created with the goal of updating in
mind. In the case where a strategy is created by external
consultants, there is the opportunity for in-house staff to
update it through regular work or operating plans that relate
back to the original objectives and strategies.
Presence of a Plan by Community Size
0 –
5000
5,000 –
20,000
20,000 –
50,000
50,000
+
43 % 60% 44% 71%
Annually
23%
Every 2 - 4
years
23%
When need
arises
32%
Every 5 years
7%
Not meant to
be updated
4%
Don't know
12%
Percentages do not add to 100 due to rounding.
Chart 10: How often is your economic development plan updated? (n=75)
Chart 9: Does your local government have an economic development plan or
strategy? (n=121)
Yes
53%
No
45%
Don't
know
2%

37
Public Consultation
Follow-up research revealed relatively few
discrepancies in how communities have
developed their strategies. Most engage the
public and community groups to produce new
or updated strategies every few years, often
with the assistance of consultants.
Strategy updates in the intervening years are
usually done internally (sometimes by using a
smaller consultation process only with
relevant community organizations).
Listed under “other” in the survey results were
the following stakeholders: universities and
other educational institutions, health
authorities, neighbouring local governments,
local Community Futures Development
Corporations and community champions.
The level of consultation also varies by
community size (Chart 11). Some local
governments are selective while others enlist
the input of a broader selection of the local
community.
The City of Burnaby (popn 200,000+) for example,
underwent an extensive consultation process that
involved a diverse and knowledgeable 29 member
steering committee comprised of representatives from all
sectors of the economy including people with social and
environmental perspectives. The steering committee
guided the work of staff and consultants and also directed
the creation of sub-committees that completed detailed
work.
Over 100 people participated in nine sub-committees
formed to cover 23 sectors of the local economy in
support of updating the strategy. There were also
opportunities for consultation with the broader business
community and the general public. The size of the
consultation effort is reflective of the size of the strategy –
which is both extensive and far reaching with respect to
the sectors of the economy it covers31.
For a smaller community this level of consultation is likely
neither realistic nor appropriate. Identifying and selecting
the appropriate approach to consultation is an essential
first step in the development of a successful economic
development plan.
Chart 11: What stakeholder groups were involved in the process of
developing your economic development plan? (n=85)
10.6%
30.6%
32.9%
42.4%
50.6%
72.9%
61.2%
0.0% 20.0% 40.0% 60.0% 80.0%
None of the above
Neighbouring First Nations
Other
General members of the public
Community groups or non-profit societies
Local Chamber of Commerce
Key members of the business community
38
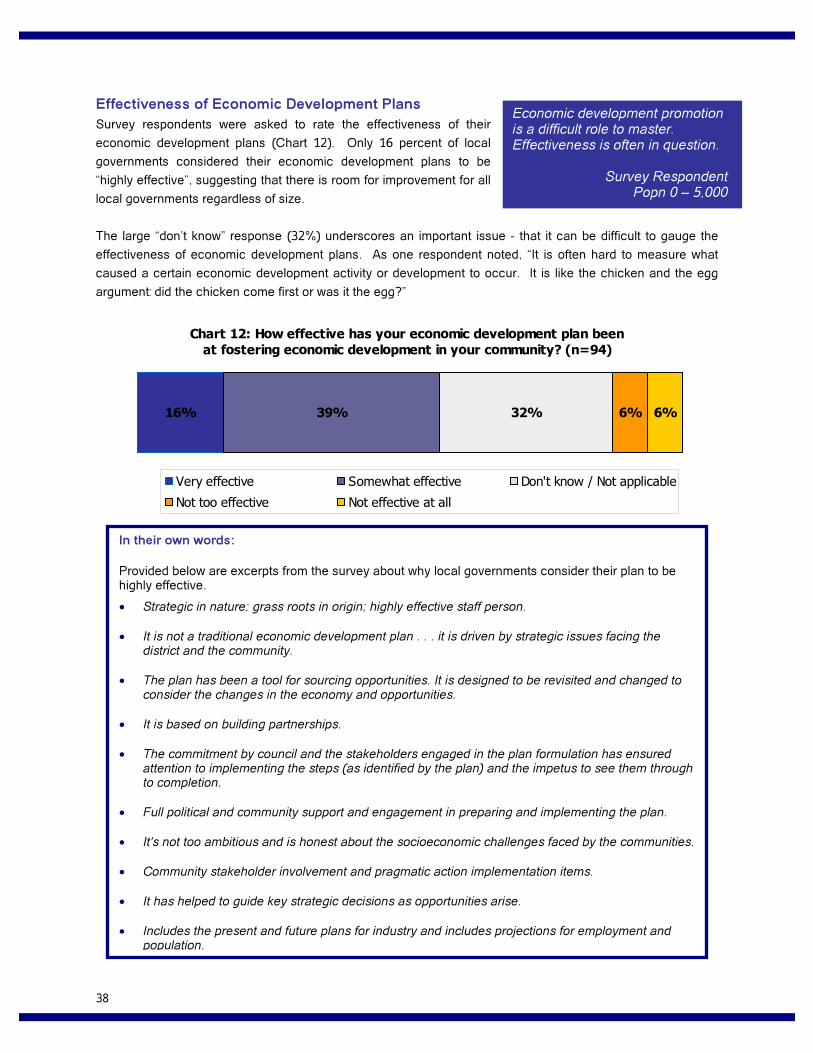
Effectiveness of Economic Development Plans
Survey respondents were asked to rate the effectiveness of their
economic development plans (Chart 12). Only 16 percent of local
governments considered their economic development plans to be
“highly effective”, suggesting that there is room for improvement for all
local governments regardless of size.
The large “don’t know” response (32%) underscores an important issue - that it can be difficult to gauge the
effectiveness of economic development plans. As one respondent noted, “It is often hard to measure what
caused a certain economic development activity or development to occur. It is like the chicken and the egg
argument: did the chicken come first or was it the egg?”
Chart 12: How effective has your economic development plan been
at fostering economic development in your community? (n=94)
16% 39% 32% 6% 6%
Very effective Somewhat effective Don't know / Not applicable
Not too effective Not effective at all
Economic development promotion is a difficult role to master. Effectiveness is often in question.
Survey Respondent Popn 0 – 5,000
In their own words:
Provided below are excerpts from the survey about why local governments consider their plan to be highly effective.
• Strategic in nature; grass roots in origin; highly effective staff person.
• It is not a traditional economic development plan . . . it is driven by strategic issues facing the district and the community.
• The plan has been a tool for sourcing opportunities. It is designed to be revisited and changed to consider the changes in the economy and opportunities.
• It is based on building partnerships.
• The commitment by council and the stakeholders engaged in the plan formulation has ensured attention to implementing the steps (as identified by the plan) and the impetus to see them through to completion.
• Full political and community support and engagement in preparing and implementing the plan.
• It's not too ambitious and is honest about the socioeconomic challenges faced by the communities.
• Community stakeholder involvement and pragmatic action implementation items.
• It has helped to guide key strategic decisions as opportunities arise.
• Includes the present and future plans for industry and includes projections for employment and population.

39
Creating an Effective Economic Development Strategy
Economic development plans are varied in size and content. An economic development plan does not have to
be long or complex – some of the best plans are brief but focused and strategic in nature. It also does not
have to be a stand-alone document. Setting out economic development policies in a community’s strategic
plan or Official Community Plan can be successful too. Many local governments are also now creating
sustainability plans, through programs such as the Smart Planning for Communities program, which often
consider economic development.
Pitfalls and Challenges
Many common challenges in plan-making were identified through the survey.
• Too ambitious, with unrealistic goals and expectations.
• Not updated as needed to reflect changing circumstances.
• Not strategic – no specific goals that can be implemented.
• Difficulty in engaging individuals and getting them to commit to the process.
• Staff resources to implement a plan are lacking.
• A champion or focus is lacking and plan not pursued on a priority basis.
• Lack of community and political support.
• Difficulty in mobilizing identified partner organizations for the delivery of projects.
• Focusing on opportunity identification over context and readiness, leading to a list of opportunities that may not reflect the realities of the community.
Elements to a Successful Strategy
A number of success elements were identified through the survey. The best plans
are realistic, strategic, focused, and involve a level of community engagement that
reflects the size of the local government and its economic development efforts.
Strategic: Being strategic means that there is a focus on anchoring the process in a realistic assessment of
needs and capacities and providing a plan of action with clear steps, responsibilities and time frames for
completion. A strategic plan links short-term actions with a long-term vision and implementation.
Focused: Economic development plans often fail because they are too ambitious or because all the resources
go into making the plan with no resources left to implement it. Economic development plans can lose
momentum and it is important, particularly in times of economic transition, to keep efforts focused and
manageable.
Integrated: An economic development plan should not be developed in isolation and should complement or
relate to planning documents outlining the community’s vision, such as the Official Community Plan.
Engagement: An economic development plan should involve a level of community involvement and
stakeholder participation that is reflective of the size of the economic development effort.
Flexible: An economic development plan needs to be flexible to allow for updating that reflects changing
economic times and emerging opportunities.
Smart Planning for Communities is a collaborative BC-wide initiative providing resources and tools to local and First Nations governments for planning socially, culturally, economically and environmentally sustainable communities.
Sustainability facilitators are available across BC to assist with process advice, strategic support and technical expertise for communities undertaking Integrated Community Sustainability Planning (ICSP).
For more information and community examples, go to: www.smartplanningbc.ca.

40
COMMUNITY SNAPSHOT: Economic Development Plans
While funding is often a limitation, the examples below illustrate that a local government, regardless of size, can implement an effective economic development plan.
The District of Clearwater (popn 0 - 5000) is currently guided by the
North Thompson Economic Development Strategic Plan (NTEDSP), which
was led by the Thompson Country Community Futures Development
Corporation in partnership with a number of local governments, Chambers
of Commerce and the provincial government. The NTEDSP identified and
evaluated economic opportunities with the goal of assisting diversification
efforts within a ten year timeframe and setting out regional strategies and
strategies for each of the three sub-regions of Barriere, Clearwater and
Blue River. A combined regional and sub-regional approach provides an
example of how to create a regional strategy while still respecting the
differences of sub-regions within an area. It also is an example of a
partnership approach where the lead organization is not a local
government or local government economic development organization – a
model that is particularly useful for smaller communities that don’t have the
resources in-house to develop a strategic plan.
Since the NTEDSP was created, the District of Clearwater has been
incorporated as a municipality. With the NTEDSP reaching the end of its
projected timeframes, the District of Clearwater passed a motion in
January 2010 to take steps to pursue their own community economic
development strategic plan in partnership with the regional district
electoral area adjacent to the municipality32.
The City of Terrace’s (popn 5,000 – 20,000) economic development
function is guided by the work of the Terrace Economic Development
Authority (TEDA) and the Strategic Initiatives Action Plan. Completed by
an outside consultant, the action plan is intended to be a living document
and contains ten strategic initiatives to be pursued in a three to five year
timeframe. It is intended to guide the work of the authority and provide a
mechanism for feedback and input, with stakeholders and indicators of
success outlined for each initiative. At fourteen pages long it is concise
but well used.
As the EDO emphasized, it is not intended to be shelved for three years.
Instead, it is brought out at each board meeting to ensure that it remains
top-of-mind for directors and staff in daily operations. TEDA spent a
significant amount of time revising the action plan until consensus was
reached but the result is a document that has been successful in guiding
the work of the authority. Key to TEDA’s success has also been ensuring
the economic development board meets on a monthly basis33.
Photo credit: Jana Sasaki
Photo credit: Matt Jennings
Photo credit: TEDA

41
COMMUNITY SNAPSHOT: Economic Development Plans
The District of Mission (popn 20,000 – 50,000) completed a
comprehensive economic development strategy in 2002
through an independent consultant. The strategy aimed at
putting in place an effective economic development function,
building capacity for community economic development and
facilitating priority initiatives. The strategy provided a thorough
community and key sector assessment, articulated goals and
objectives that were linked to strategies and actions, as well as
identified resources for implementation.
The goals and objectives, strategies and actions were all rooted
in the findings of a community visioning exercise and to-date
the objectives of the plan have been achieved. The strategy
continues to be updated internally as needed and its
effectiveness is attributed to an engaged staff and a
knowledgeable advisory committee34.
Initiatives Prince George (IPG) is a municipally-owned
corporation mandated by the City of Prince George (popn
50,000 +) to undertake programs and projects designed to grow
and diversify the local economy. The work of the corporation is
guided by the Initiatives Prince George Strategic Business Plan
(2008 – 2010) which addresses infrastructure needs of the
region aimed at building a knowledge-based resource economy
connected to the world.
This plan is strategic, focused and outcome oriented. The plan
is based on ten specific measurable goals that will enable
Prince George to be an integrated and sustainable
manufacturing, transportation, supply and service center, and
the inland gateway to Asia and North America. Working with
very specific and measurable goals allows staff to easily
monitor progress and report regularly to board members.
A large part of the plan’s success has been attributed to a focus
on communications and the fostering of strong connections with
political leaders. Progress Prince George, the benchmarking
framework for IPG, helps IPG deliver on its strategic plan and
the economic development goals contained within it35.
“Our model is rooted in
partnerships -- we
catalyze, coordinate and
communicate on all the
major issues that we face
as a city and region on the
economic development
front.”
City of Prince George Survey Response
Photo credit: District of Mission

42
New Provincial Approach to Community-Centred Development
The City of Port Alberni (popn 5,000 – 20,000) and the Province have
signed an agreement that will support the community’s future economic
development. The city is intent on diversifying its economy in the
wake of the global economic slowdown that has affected its largest
employers in the forest industry. The Communities First Agreement
commits the Province and the city to specific actions in support of
the city's economic development goals.
Twelve priority projects are set out in the agreement and it is expected that
this pilot project will lay the foundation for a new approach with other
communities. RuralBC Secretariat staff is expected to develop similar
agreements with up to 14 communities in every region of the province over
the next three years as part of this pilot initiative36.
For more information, see the RuralBC Secretariat website:
www.cd.gov.bc.ca/ruralbc_secretariat/.

43
2.4 Barriers and Challenges to Economic Development Planning
Barriers Identified in the Survey
There are many barriers to economic development planning at the local level. While BC’s communities vary
with respect to their economic and social fabric, survey responses regarding barriers highlight that they face
common challenges (Chart 13). The two most commonly identified internal barriers were financial resources
(67%) and lack of human resources (57%). The two most commonly identified external barriers were the
global financial crisis (60%) and the forest industry restructuring (49%).
To engage in economic development local governments need human and fiscal resources, and support from
provincial and federal governments. Often there is money in place to support an economic development
position or to pursue projects but not both. This was the message reflected in the survey responses and
reiterated by local elected officials and practitioners at the UBCM economic development conference in 2006.
Other noted internal barriers included:
• Lack of regional cooperation and coordination;
• Outmoded processes, regulations and structure;
• Lack of consensus or focus as to what the local government role is and what the appropriate investment should be;
• Lack of understanding of the value of the economic development service;
• Anti-business attitude – lack of knowledge as to why the business community matters;
• Lack of communication between local economic development organization and local government;
• Inadequate focus on entrepreneurship; and
• No commitment to multi-year funding.
Other noted external barriers included:
• Lack of adequate infrastructure – e.g., transportation - related, broadband, etc.;
• Geographical constraints in both rural and urban environments;
• Cost of development;
• Onerous provincial and federal funding requirements;
• Political factors limiting diversification and local value-added potential of sector specific opportunities; and
• Inadequate provincial and federal support for programs/projects.
Lack of financial
resources
Lack of human
resources
Lack of
leadership or
priority given to
ED
Lack of
information or
expertise
Lack of formal
economic
development
plans or mandate
Legislative
restrictions
Decline in senior
government
service provision
Other sector
downturn
Forest industry
restructuring
Global financial
crisis
EXTERNAL BARRIERS (N=116)
INTERNAL BARRIERS
(N=107)
80% 60% 40% 20% 20% 40% 60% 80%
Chart 13: What are the top two internal and external barriers to economic development in your community?

44
Economic Development Planning in Transition Times
In times of economic transition, when there are dramatic shifts in the
global financial climate, the ripple effect at the local level is
magnified. Obstacles that were already present become more acute
and local governments often find there is a need to reflect and
change their approach to better serve the needs of the community.
Has the current global financial crisis had an impact on your
community? When asked if the current global financial crisis had an
impact on their community, 29 percent of respondents noted it had a
“huge impact” and 58 percent noted it had “some impact” (Chart 14).
Perspectives on how to deal with the financial crisis were varied – 43
percent of respondents noted they have changed their approach to
economic development in light of the current financial crisis and 44
percent noted they have not changed their approach.
How have you had to change your approach to economic development in light of the global financial
crisis? For those local governments that have changed their approach, the majority noted the need to focus
on fewer priorities – priorities that are actionable and measurable – and the need to return to basics, such as
local business retention and expansion.
Does economic development planning become more or less important in
transition times? It depends on the circumstances of the local government.
Some local governments noted that they have scaled back their efforts in light
of budget shortfalls, in some cases even returning to the delivery of core
services only. Others, however, noted that they were ramping up their efforts
in response to the financial crisis with an expanded budget to undertake
activities such as the hiring of new staff or the delivery of a stimulus program.
Another common response was the need to maintain focus on long-term
objectives, as noted by the following local governments:
“If we imagine the city as a sailboat, the economic forces outside of our control
would be the wind. Although we cannot control the wind, we can set a course
and trim the sails to respond to the changing wind conditions.”
“The global financial crisis is a temporary event and a predictable trough in the
normal business cycle. It doesn’t change the inherent advantages or
disadvantages of the area for investment and wealth creation.”
“It is all the more important in the current financial crisis that we stay focused
on our medium-term economic diversification strategy – short-term problems
should not lead to short-term thinking!”
Building resiliency through effective community engagement processes, a long-term strategic vision,
collaborative partnerships, flexible planning processes, and a comprehensive and robust business
development program can help weather the economic storm while also working toward the long-term vision a
community sets for itself.
Chart 14: What impact has the
current global financial crisis
had on your community?
(n=118)
29%
58%
11% 2%
Huge impact Some impact
Little impact No impact at all
INVEST IN TRANSITION
READINESS
For those local governments in
rural areas that are facing an
economic crisis, such as the
loss of a major employer, or for
those that just want to take a
proactive and long-term
approach to building a more
resilient local economy, the
University of Northern BC has
developed a Transition Toolkit:
Working Framework for a More
Resilient Community.
For more information:
http://www.unbc.ca/cdi/toolkit.html

45
Strategies for Addressing Barriers
The survey results identified ways in which local governments are dealing with the significant barriers to
economic development in their community. Strategies generally fell within four categories: strategy
development and refinement; advocacy and relationship building; developing an organized effort; and fund
leveraging.
Strategy development and refinement Advocacy and relationship building The development of an economic development strategy and the refinement of an existing strategy were the most commonly identified tool for overcoming obstacles. Included in this category were efforts to diversify, the development or enhancement of local business retention and expansion efforts, and the reassessment of priorities to reflect current circumstances. Also mentioned was the need to, through an economic development plan, maintain a focus on long-term objectives.
Responses focused on developing strategic regional partnerships with other local governments, the local Chamber of Commerce, regional districts, Community Futures Development Corporations and First Nations. Lobbying senior levels of government regarding local issues and engaging council in discussions of economic development issues and strategies to move forward were identified. Pursuing stakeholder meetings and community leader involvement were also mentioned.
Organizing an effort Fund leveraging Many respondents noted that they were in the process, for the first time, of setting up some vehicle for focused discussions on economic development, such as an economic development commission, a committee of council and/or a separate economic development organization. This suggests that current circumstances are resulting in more local governments considering a formal economic development function where one did not exist before.
Placing additional emphasis on obtaining external sources of project funding was deemed an essential strategy for many. Repeatedly mentioned was the need to access funding for job and skills retraining to help displaced forestry workers, funding for tourism, infrastructure and community development projects, and accessing monies available through grant programs.
Some local governments are also implementing local stimulus programs to encourage business development
within specific geographical areas such as town centres. The District of Sooke Town Centre Stimulus program
demonstrates that stimulus programs can be a tool to stimulate the economy while at the same time advancing
“greener” economic development goals.
The District of Sooke (popn 5,000 – 20,000) has adopted the
Sooke Town Centre Stimulus Plan that aims to transform
the Sooke Town Centre through the provision of incentives for
environmentally sound development. Incentives include tax
exemptions for LEED certified development, a reduction in
building permit fees for LEED certified developments, higher
density developments and developments that incorporate
non-market affordable housing, as well as similar reductions
in development cost charges. The stimulus plan provides for
an innovative tax increment financing arrangement, whereby
every additional tax dollar generated by the new development
will be reinvested back into the town centre area by way of
beautification and infrastructure projects, resulting in a
positive cumulative impact on revitalization efforts37.
Sketch of Mariner’s Village – a major mixed - use development facilitated by the Sooke Town Centre Stimulus Plan www.sooke.ca

46
2.5 Conclusions
• While local governments remain focused on business retention and expansion, community development,
entrepreneurship and innovation, and amenity- and place-based infrastructure development are playing a
greater role in shaping local economic development efforts.
• Community-based, volunteer driven business development or retention and expansion programs continue
to be a proven strategy for economic development, but are also now often augmented by more
innovation-driven and entrepreneur-driven strategies.
• Setting out a plan or vision is an important tool for guiding the work of an economic development
organization and the most effective plans are strategic, focused and integrated with a community’s larger
community visioning or community planning processes.
• The lack of financial and human resources continues to be the primary obstacle facing local governments
in the delivery of an economic development function – a challenge that is more acute in times of transition
when there are additional pressures on service delivery and the local employment base.
• Local governments are using a number of innovative strategies to address economic development
barriers, including: organizing an effort where one did not exist before; engaging in advocacy and
relationship building with other levels of government and neighbouring local and First Nations
governments; developing economic development strategies or refining existing ones; and working more
diligently at fund leveraging.
• Many local governments continue to adopt a greater and more explicit role in economic development
planning by identifying priorities, engaging in the economic development plan-making process and
embarking on core economic development initiatives (e.g., business retention and expansion programs,
marketing etc.).

Section 3
Foundations for Success

48
“Economic development is a process . . . we
are becoming more effective as we build
partnerships, pursue opportunities and engage
the public in the process of what kind of town
we want to be and as we utilize the media to
get the message out about what is happening in
relation to community and economic
development.”
Survey respondent Popn 0 - 5,000

49
3.1 Key Elements of Success – Overview of Survey Findings
The 2006 UBCM conference identified a number of elements that practitioners and local elected officials felt
were essential to successful economic development. The 2009 survey tested to what extent these factors
were present within BC local governments. The results are generally positive as indicated in Chart 15.
Areas where local governments appear to be excelling include: having the political will to support their
economic development efforts; having an awareness of business interests and needs; ensuring community
buy-in and support for their economic development efforts; engaging in regional collaboration; having business
leader involvement; giving consideration to sustainability; fostering innovation and entrepreneurship; and
utilizing community champions to assist in achieving economic development outcomes.
Areas where local governments identified limitations included: having the staff expertise to deliver economic
development; having a formal economic development strategy in place; engaging in public-private
partnerships; and involving First Nations. In a rural area, First Nations and local governments are often sharing
the broader geographic region and there can be mutual benefits to joint planning at the regional level as well as
engaging in economic development initiatives such as infrastructure development and shared service delivery.
Given that this is an area where there is increasing opportunity, innovative partnerships with First Nations are
explored in greater detail in Section 3.3.
Chart 15: Please indicate your level of agreement – strongly agree, agree, don’t know, disagree, strongly disagree - with the following statements regarding the delivery of
economic development in your local government (n=116)
0% 20% 40% 60% 80% 100%
Public-private partnerships
Regional collaboration
Political w ill
Champions
A formal ED strategy exists
Community buy-in and engagement
Aw areness of business interests and needs
Business leader involvement
First Nations involvement
Staff expertise to deliver ED
Sustainability is a consideration
ED efforts foster innovation and entrepreunership
Strongly Agree Agree Don't know Disagree Strongly Disagree
0% 20% 40% 60% 80% 100%

50
Partnerships can be used to create change as they bring together new combinations of resources and ideas. Saskatchewan Economic Development Association
www.seda.sk.ca
3.2 The Imperatives – A Framework for Dialogue
Taking into account the results from the survey and the prevailing themes from the
literature, six precursors or imperatives for economic development success have been
identified. The goal of these imperatives is to help local governments frame their
discussions of and approach to economic development. They are intended to be a
starting point for dialogue and additional resources are provided in Section 5.
Following a discussion of the imperatives are community snapshots that embody one
or all these characteristics. Section 3.3 provides a closer look at partnerships. While
all of the imperatives outlined below are important, partnerships are examined in
greater detail because of the important role they can play in local government
economic development.
The Partnership Imperative
Are you making the best use of the resources available to you through the use of a partnership model? Partnerships have the potential to achieve economic development outcomes that would
otherwise be unattainable. Partnerships can be important for many reasons: to
leverage resources; to avoid duplication; to build credibility; to generate revenue; to
establish contacts; to create synergies; to “keep the pulse” of the community and
industry trends; and to enable and strengthen the work of an economic development
organization38. Partnerships are the vehicles of community-based innovation and local
governments have a lead role in organizing and convening partnership processes. It is
important to continually assess where mutually beneficial partnerships can be realized
for the delivery of successful economic development outcomes.
The Leadership Imperative
Do you have the leadership in place to set a course for your community’s future? The survey highlighted the importance of leadership and it is consistently identified as a success factor in
economic development39. If the leadership to set a long-term vision for a community or to see projects through
to fruition does not exist, economic development success will likely not be realized. In addition to having a
forward thinking and committed mayor and council, the ability for community champions to see potential
projects through to completion should not be discounted. Sometimes the momentum needed for economic
development does not come from staff or elected officials but from the thought and vision of community
volunteers. Every effort should be made to utilize community champions.
The Place Imperative
Are you focused in on what makes your community unique? Place matters. In a global age as space becomes less important place becomes more important40 and, as a
result, place-based development is central to the current discourse on economic vitality and renewal41. People
are seeking out places with defining and unique qualities that set them apart from other localities and
communities need to focus on being and doing what they want to attract42. Economic development
approaches need to focus on identifying and growing local assets and tapping into and taking advantage of the
unique aspects of a region.
imperative defn:
Some duty that is
essential and urgent

51
Capacity is needed for local governments to undertake multilateral strategic approaches to regional economic development. Government of BC, 2006
(see endnote 46)
The Innovation Imperative
Are you fostering innovation and entrepreneurship within your community?
While innovation is most often considered in the context of emerging sectors and metropolitan
areas it can exist in traditional manufacturing sectors and non-metropolitan areas and is, in fact,
key to the economic renewal of these sectors of the economy43. A supportive and conducive
local business environment and a rich network of civic, institutional and organizational programs
and policies provide the platform for entrepreneurship and innovation to flourish. While this is
an area where a coordinated, integrated and multi-level governance approach is required, local
governments are best positioned at the local level to engage the community, enable individuals,
and connect people and information that exist in the wider arena. Strong regions, livable
communities and collaborative “joined-up” governance facilitate regional innovation. Local
governments can contribute by ensuring that innovation remains at the centre of local discourse
on economic development, reassessing the region to ensure that current and potential sources
of innovation are identified, accelerating and expanding innovation networks, and ensuring that
regional innovation takes centre stage in the development of economic development plans44.
The Sustainability Imperative
Are you applying a sustainability lens to your economic development efforts?
Sustainability is increasingly viewed as being at the heart of economic recovery and it is no longer acceptable
to think of sustainable development and economic development as mutually exclusive45. For economic
development to be successful it needs to be sustainable. Careful consideration should be given to balancing
economic, social and environmental objectives to achieve improved quality of life and sustainable growth.
Sustainability cuts across and influences all aspects of local government, from sustainable procurement
policies to the utilization of green building technologies, land use and climate change policies. Local
governments that are able to nurture a culture of sustainability and create a vision for sustainable economic
development are defining themselves as the leaders of tomorrow. Sustainable communities are able to attract
people because they create a positive image of a place to live and conduct business and it is important for
local governments to recognize this connection and, where possible, incorporate sustainability into their
economic development approach.
The Capacity Imperative
Do you have the institutional capacity to realize your community’s economic development potential?
Local governments struggle with capacity constraints and should assess if the resources to
achieve the economic development outcomes that they set for themselves are in place. It is
recognized that it is not realistic or appropriate for many local governments to launch a large-
scale economic development effort. For some communities, having a part-time EDO or Mayor
and CAO working on economic development will be adequate to achieve their desired
economic development outcome. The important consideration is to ensure that the amount of
resources available match the scale of effort envisioned, otherwise it is likely that
implementation challenges will arise. Equally important is building expertise among staff and
council through training and information dissemination and embarking on a dialogue about the
delivery model needed to achieve the desired outcomes. 46
Without an innovative economy, other community outcomes are difficult to achieve. An innovative economy is at the heart of regional vitality and quality of life. Collaborative Economics, 2008 (see endnote 20)

52
COMMUNITY SNAPSHOT: Vancouver – Greenest City in the World Sustainability as an Economic Development Driver
Becoming the greenest city in the world will
be an economic stimulus both directly and
indirectly . . . Vancouver 2020 will create
green jobs and attract investment . . .
environmental quality is a major economic
asset and becoming the greenest city in the
world will enrich Vancouver’s existing
competitive advantage.
Vancouver 2020: A Bright Green Future (paraphrased)
The City of Vancouver (popn 600,000+) has set for itself the goal of being the greenest city in the world by
2020 – an approach that leverages its existing reputation as a sustainability hub. People are already choosing
Vancouver as a place to visit and locate because of its green reputation and the city’s new approach, which
cuts across many city departments, seeks to build on that. Vancouver 2020: Bright Green Future sets out to
grow 20,000 green jobs by 2020. It has three main areas of focus: green jobs and a green economy, greener
communities, and human health.
Some of the initiatives that are being spearheaded include:
• Vancouver Green Capital: Vancouver Green Capital is the city’s business branding for economic
development that is intended to send the message that Vancouver means business but not business as
usual.
• Low-carbon Economic Development Zone: The area currently known as False Creek Flats is being
considered as a low-carbon economic development zone that would act as a “magnet for low-carbon
businesses, technologies, products and services”.
• Green Entrepreneur “Kickstart” Program: An entrepreneur development program is envisioned that
would target green entrepreneurs and provide access to capital and expert guidance through a partnership
model that draws on existing resources and potential partner organizations.
One of the recommendations of the Greenest City Action Team, which includes politicians, academics,
business leaders, and staff, was to develop an economic development strategy that aligns with the city’s green
objectives. An economic development strategy – the city’s first in more than 20 years – has been in
development since 2006 in close consultation with the community, business leaders and academics. This
document is expected to be delivered to Vancouver city council in the coming months as a roadmap for the
city’s sustainable prosperity. With an economic development strategy on the way and a vision in place, the
City of Vancouver is well positioned to maximize their competitive advantage and become a mecca for green
entrepreneurs and businesses.
Source: Vancouver 2020: A Bright Green Future; Vancouver Economic Development Commission website,
www.vancouvereconomic.com.

53
COMMUNITY SNAPSHOT: Quesnel Taps into the Green Economy Sustainability as an Economic Development Driver
Many communities are tapping into the green economy – a fast growing
economic sector that includes green energy generation and clean
technology development. It emphasizes development that respects the
“triple bottom line” of economic, social and environmental considerations.
The City of Quesnel (popn 5,000 – 20,000), through the Quesnel
Community and Economic Development Corporation, underwent an
intensive planning and visioning exercise in response to the Mountain Pine
Beetle epidemic that had a devastating impact on their forestry dependent
economy. The goal was to identify and optimize their strengths, which led
the community to position themselves as a bio-economy hub for green
electrical and thermal energy, bio-fuels and bio-refining. The strategy builds
on their strengths – a productive land base, vast biomass resources,
numerous pulp mills, a fully developed infrastructure, and a well-trained
workforce.
Quesnel identified early that to make the community stand out they needed to build a competitive advantage
that emphasized their unique cultural and natural history and provided access to quality recreation and leisure.
The city embraced sustainability as an economic development strategy through the Quesnel 2020 process, a
visioning exercise undertaken in 2003 that involved a large cross-section of the community. From this process
the vision of a “Connected, Green and Active Quesnel” emerged, from which they have gone on to develop a
number of sustainability frameworks to facilitate projects. These include the “Our Quesnel” Sustainability
Initiative and Prosperity and Sustainability: Taking Action Now for Quesnel’s Future – a policy document that
sets out how the city will develop 3000 new jobs and a diverse economy with a stronger emphasis on quality of
life and sustainability.
Through strategic visioning, goal setting
and the development of a strategy based
on its unique strengths and assets, Quesnel
has emerged as a leader in sustainability
and a hub for the development of a green
economy sector.
Source: Jim Savage, unpublished presentation (Sept 21 2009), EDAC and EDABC Joint 2009 Economic Development Conference, Canada’s Connection to the World, September 18 – 22, 2009, Vancouver, BC. City of Quesnel website: www.cityofquesnel.bc.ca.
Growing at an annual
rate of 11 per cent,
B.C.’s clean technology
sector includes over 250
companies employing
about 3,700 people.
Province of BC (2009), www.gov.bc.ca/yourbc/
(see Workers, Green Economy)
City of Quesnel

54
CCoommmmuunniittyy--bbaasseedd iinnnnoovvaattiioonn aanndd
lleeaarrnniinngg ccoommmmuunniittiieess.. .. ..
______________
“Those cities, large and small, that demonstrate an institutional capacity to
engage diverse actors in collaborative planning processes are also the
most adaptive and innovative. Such places are today’s learning
communities, so named because they provide the right context –
institutional, organizational, attitudinal – for upgrading their economy and
improving the quality of life and living standards for their residents.”
______________________________________________
Neil Bradford (2003)
Cities and Communities That Work: Innovative Practice and Enabling Policies Canadian Policy Research Network (www.cprn.org)

55
COMMUNITY SNAPSHOT: Agri-food in the Comox Valley Asset-based Investment Attraction and Marketing
Situated on the south-eastern coast of Vancouver Island, the Comox Valley has an abundance of available
land for new and expanding food and beverage processing operations. Boasting a mild climate and excellent
soil quality the Comox Valley is considered one of the top eight agricultural destinations in Canada.
Recognizing that very little of their agricultural land was being optimized and that land was relatively cheap in
comparison to other growing regions in Canada led the Comox Valley Economic Development Society,
Comox Valley municipalities and regional district to identify agri-food as its number one sector for economic
growth.
A focus on agri-food was identified in 2000 through the Comox Valley Economic Development Society’s
planning process, but developing the sector did not come without its challenges. At a time when the
predominant trend was the depopulation of farms across Canada, it was difficult to convince people that agri-
food represented a viable and realistic vision. But the development of the Comox Valley Agricultural Plan, the
Comox Valley Five Year Economic Development Strategic Plan and the Comox Valley Inventory and Gap
Analysis laid the foundations for what is now often referred to as the “Provence” of Canada, in light of the
flourishing and diverse array of farming operations that have established in the region.
There are now nearly 450 operating farms in the Comox Valley contributing
over $30 million to the local economy. There is a focus on specialty niche
products including vineyards, cranberries, sprouts, organic fruits and
vegetables, in addition to an extensive aquaculture industry. Over 50
percent of BC’s shellfish is produced in the waters surrounding the Comox
Valley and the strengthening agriculture sector now supports a year round
farmer’s market and Canada’s only 100 percent local grocery store.
Growth of the sector has been facilitated by the Comox Valley Economic Development Society who work with
local producers to expand their businesses (both through local buy direct marketing and business retention and
expansion initiatives) and develop external media and market strategies to bring attention to the agricultural
opportunities. This process is supported by sound research into the strengths, gaps and opportunities both
within the sector and the community.
Most recently, the region has focused on expanding into culinary tourism with the launch of Taste Comox
Valley, an agriculture and culinary marketing program that hopes to increase the awareness of the Comox
Valley as one of the most innovative culinary and agricultural regions in Canada. Taste Comox Valley is
expected to increase the consumption and production of locally grown food by tapping into the consumer trend
for locally grown quality and niche foods – all of which are on offer in the Comox Valley. The creation of a
Comox Valley Growers Guide is intended to complement the Taste Comox Valley campaign by promoting how
to buy direct from over 70 local farms and providing three farm tour routes and detailed maps.
Through a continued emphasis on agricultural diversification and value-added
the Comox Valley is well on its way to becoming an agriculture and culinary hub
in Western Canada.
Source: John Watson, Executive Director, Comox Valley Economic Development Society Comox Valley Economic Development Society website, www.investcomoxvalley.com.

56
“Strong cultural engagement can substantially
improve the cohesiveness, confidence,
international image and attractiveness of
places.”
From Restless Communities to Resilient Places: Building a Stronger Future for All
Canadians, Final Report of the External Advisory Committee on Cities and Communities,
Government of Canada, June 2006

57
COMMUNITY SNAPSHOT: Festivals Promotion in Maple Ridge A small initiative with big impact
The District of Maple Ridge (popn 50,000+) has taken an innovative
partnership approach to festival promotion with the launch of Discover
Maple Ridge Weekends. Completed on a shoe-string budget of $30,000,
it illustrates that small projects can have big impacts.
Situated on the doorstep of Metro Vancouver, bounded by the Coast
Mountains and the Fraser River, the District of Maple Ridge wanted to
capitalize on its proximity to a major urban trading centre and its natural
beauty. The goal of Discover Maple Ridge Weekends was to make Maple
Ridge top-of-mind for weekend festivals and events and increase day trips
and repeat visits from those residing outside the community.
The campaign was not on the district’s radar or set out in its economic
development plan, but realized as a result of an opportunity. The
World Police and Fire Games were coming to Maple Ridge and the
district’s economic development department knew they had an
opportunity to leverage this event to raise the profile of what the
community had on offer. As in many other communities funding for
festivals and events has historically been a challenge. The majority of
festivals and events in Maple Ridge are grassroots efforts and,
managed by devoted volunteers, face funding, awareness and
marketing challenges. There was no single group or department with responsibility for festivals promotion and
there was no longer money available from the district to support individual festivals and events as had been
available in previous years. As a result, mayor and council supported a staff recommendation to redirect
$30,000 of provincial tourism grant money to develop a collaborative multimedia campaign that would benefit
all the festivals and events within the community.
The economic development department established a Festival Promotions Team comprised of city staff,
businesses and community organizations to develop the concept. The concept needed to be flexible to allow
for future expansion if additional funding became available (for example, Discover Maple Ridge Business,
Discover Maple Ridge Tourism) and it needed to deliver a framework that would meet the needs of the many
partners involved in the project.
Officially launched on June 25, 2009 with a comprehensive website (www.mapleridgeweekends.com) and
through traditional print and media, Discover Maple Ridge Weekends has surpassed expectations. A very
successful and comprehensive multimedia approach from conception to delivery, including the establishment
of performance measures, was delivered in a short time frame and with a small budget. Festivals and events
that ran through the summer of 2009 noted an increase in visitation as did vendors, and increased festival-
goers translated into additional business for downtown merchants. The initiative succeeded in raising the
profile of Maple Ridge as a great place to live, work, play and invest.
Source: Sandy Blue, Economic Development Manager, District of Maple Ridge
Unpublished submission for UBCM Excellence Awards, July 2009

58
The approach taken by the City of Port Moody to the
development of its inlet centre illustrates that effective land
use planning and the promotion of sustainable design can
secure economic development and job growth.
Suter Brook Development Port Moody 1250 residential units 95,000 s.f. commercial 45,000 s.f. office 138,000 s.f. hotel & convention 32,250 s.f. indoor amenity
310, 250 s.f. non-residential
Aerial view of Port Moody
in relation to Vancouver

59
COMMUNITY SNAPSHOT: Place-making in Port Moody Making the connection between land use
and economic development
Nestled at the head of Burrard Inlet, the City of Port Moody (popn
20,000 – 50,000) is an urban centre in Metro Vancouver. Through
progressive land use planning and an emphasis on smart growth
principles, the city has been successful in creating a vibrant and
sustainable town centre with job growth that has outpaced Metro
Vancouver.
Faced with increasing suburban development in the late 1990s, city
council made the decision to curb further sprawl and concentrate growth
in the development of a compact town centre – a move that required a
referendum to implement. That vision is now taking shape with two key
developments reaching completion – Newport Village and Suter Brook – and complementing the existing civic
functions already present at the town centre. The result is a pedestrian-oriented town centre with the city hall,
library, recreation complex, retail and commercial space all within walking distance of each other and the
residential units.
Newport Village was the first significant development and because it was recognized early on as a success it
provided a reference point for residents and facilitated the way for further mixed-use development. With Suter
Brook, the city was able to use what they learned with Newport Village and refine their approach to mixed-use
pedestrian-oriented development. The result is a development with many innovative features that sets it apart
form similar developments. A new form of development for suburbs and small towns referred to as the "Hidden
Box" retail concept was created in Suter Brook and is an example of a city influencing the design and
construction of a successful pedestrian-oriented retail complex. Innovative residential units that incorporate
green roofs are located on top of the commercial space and cars for the most part are directed underground.
With Suter Brook and Newport Village, as well as with other neighbouring properties, the city has insisted on
incorporating larger residential units in the Master Plan to ensure the development truly represents a complete
community that can accommodate families and individuals, including seniors.
When asked what has enabled Port Moody to achieve its vision Gaëtan Royer, City Manager, attributes
success in part to their approach with developers. For any application over a single family residential the city’s
Development Review Team, which includes a cross-section of staff, sits down with the developer. This team
approach ensures developers leave with one message about what the city envisions for a site and also
encourages innovative solutions to arise through round table discussions and negotiations. For large sites, the
city insists on Master Plans as opposed to piecemeal development and they use land use contracts to ensure
that developers are held to the principles set out in the Master Plan. Royer notes that it is easy for developers
to be guided by past experience and that local governments should not be afraid of pushing the envelope and
saying no to a proposal. Three applications for “standard” residential development were turned down on the
Suter Brook site before a proposal was presented that aligned with the city’s vision. By creating a town centre
with a diverse mix of uses, high quality public spaces, sympathetic architecture and an urban atmosphere the
City of Port Moody has been successful in attracting residents, visitors and businesses to the area.
Source: Gaëtan Royer, City Manager, City of Port Moody
City of Port Moody website, www.cityofportmoody.com.
The city’s focus on creating a complete community and insisting on office and commercial space to be included in developments have helped Port Moody’s job growth outpace the Metro Vancouver average by a wide margin. Gaëtan Royer City Manager, City of Port Moody

60
3.3 Exploring Partnerships
Over 70 percent of local governments surveyed stated that they were
involved in one or more partnerships related to economic development –
a statistic that emphasizes the significant role that partnerships play in
achieving economic development goals. Partnering can occur in many
ways – between local governments for the delivery of an economic
development function as was discussed in Section 1.3, between a local
government and private corporation or community organization, and
between local governments and First Nations. For example, local
governments and First Nations are increasingly looking to each other as
neighbours and as potential partners to facilitate mutually beneficial
projects at the local level in areas such as service delivery,
infrastructure development and economic development planning.
The partnerships identified below represent only a small fraction of those
that exist across the province for the purposes of economic
development but they illustrate what is possible when local governments
seek out partners to work toward common goals or to address mutual
needs.
Age-friendly partnership initiative supports economic development and quality of life in Port Hardy
Partnerships have been instrumental in the creation and delivery of an age-
friendly initiative spearheaded by the District of Port Hardy (popn 0-5,000).
While the district has a number of economic development partnership
initiatives underway at any given time, they take great pride in the success
they have had with this particular initiative that was made possible through
seed money provided by UBCM’s Seniors’ Housing and Support Initiative.
Working with the Vancouver Island Health Authority, the local rotary club, the Chamber of Commerce, Literacy
Now, Tourism Port Hardy, Tourism Vancouver Island, Port Hardy Parks and Recreation, community
champions and local First Nations, the district has advanced several age-friendly and accessibility projects.
Through an engaged and knowledgeable steering committee short and long-term goals for increasing
accessibility for seniors and persons with disabilities have been identified and a comprehensive services guide
has been developed.
The district was able to tap into the wealth of knowledge in the local seniors’ population and this initiative has
been developed by seniors for seniors. The district has also used the original UBCM seed money to leverage
more funding and to advance a number of additional projects, including the development of the region’s first
accessible trail map that was completed in partnership with regional tourism bodies. While accessibility may
not immediately come to mind when thinking of economic development, this initiative positively impacts on the
district’s quality of life and targets one of Port Hardy’s main demographics - the 55 plus age group47.
Local Government-First Nations Partnership Building
Resources The C2C Forum Program
provides funding for local governments and First Nations to meet and initiate dialogue.
C2C Connect provides success stories in the area of local government-First Nations relations. C2C material available at: www.civicnet.bc.ca
Developing Intergovernmental Relations (2008) by the BC Treaty Commission provides guidance for relationship building with First Nations. Available at www.bctreaty.net.

61
The District of Summerland partners with developers to revitalize its downtown core
The Wharton Street Redevelopment Project in Summerland arose out of a
desire by the District of Summerland (popn 5,000 – 20,000) to bring much
needed amenities to residents as well as to facilitate the enhancement and
revitalization of its downtown core. Since the district owned much of the
land in the Wharton Street area of Summerland where the redevelopment
was being considered they were in a unique position to work with a private
developer to realize community objectives.
By partnering with a private developer the district was able to secure the inclusion of a new library, museum,
cultural centre and senior’s drop-in centre. The sale of the district’s land in the Wharton Street area has
enabled them to provide these facilities without increasing taxes. The district has also been able to play a key
role in influencing the overall design of the development, which is envisioned to be a livable and vibrant
neighbourhood that embraces sustainability principles. The redevelopment process has taken many years and
required several planning amendments but is now underway with two phases to be completed by 201248.
The Kitselas First Nation and Regional District of Kitimat-Stikine deliver joint community infrastructure
Local governments and First Nations are recognizing that partnering for the
delivery of key community infrastructure can result in the leveraging of
increased funds and efficiencies of scale. The Kitselas First Nation and the
Regional District of Kitimat-Stikine (popn 20,000 – 50,000) recognized
this and partnered to build a new fire hall on reserve land that would be
managed by the regional district and serve the First Nations population as
well as the wider community in the Skeena Fire Protection Service Area.
Opened in June 2004, the Gitaus Fire Hall is run by a volunteer fire crew that also includes representatives
from the First Nation. This joint venture pushed the regional district and the First Nation beyond their comfort
zone but both communities are now reaping the benefit. This partnership has solved the problem of a
dwindling volunteer crew and each community now has a more substantial fire hall than either could have built
on their own49.
A cultural centre and community forest take partnership to new levels in the Sea-to-Sky Corridor
In 1997 the Resort Municipality of Whistler (RMOW) (popn 20,000 –
50,000) met with the Lil'wat Nation to consult about opportunities for the
Nation's participation and presence in Whistler BC. Out of these discussions
the idea of a world-class cultural centre was born and a relationship in the
spirit of goodwill and cooperation evolved. Today, the Squamish Lil’wat
Cultural Centre stands as a beacon of cooperation between the RMOW, the
Lil’wat Nation and the Squamish Nation on a landmark site in Whistler, BC.
The relationship between the RMOW and the Lil’wat and Squamish Nations
continues to develop and in April 2009, the three parties signed a 25-year
tenure license for a community forest with the Province, giving them equal
partnership in the management of a large tract of forested land50. Photo credit: Gary Fiegehen

62
Photo credit: Jana Sasaki

63
Section 4 Concluding Remarks
The 2009 survey of local governments revealed new insights and confirmed existing thoughts about the state
of economic development planning by local governments in British Columbia:
• local governments are trying, with limited resources, to play a meaningful economic development role in
shaping the future of their communities;
• the playing field for economic development remains extremely uneven;
• the ability for local governments to impact economic development is great and the ways in which local
governments choose to intervene is varied;
• economic development is impacted by all areas of local government service delivery; and
• economic development can in some cases be facilitated equally well through community and sustainability
planning approaches as it can be through explicit economic development functions.
Approaches need to be tailor-made to reflect the diversity of regions and communities.
Local governments should think critically about how they choose to approach economic development, whether
that is through a formal and explicit economic development function or through complementary and linked
community and sustainability planning processes. Each local government faces unique challenges, needs and
opportunities and responses need to be tailor-made. One of the goals of this document was to illustrate the
diverse approaches to economic development by local governments in BC with a view to inspiring locally
based action.
Approaches need to be community driven and outcome focused51
The survey results support what broader academic research suggests: local governments have the opportunity
to facilitate a coordinated effort to economic development and to create a favourable environment for
economic growth and community transition. Approaches that give consideration to innovation and
sustainability while recognizing and building on place-based assets, whether large or small in scope, have the
greatest potential to benefit local communities. A place-based approach allows communities to differentiate
themselves, while lending itself to resident retention and attraction as well as visitor attraction. Similarly, efforts
that are grounded in the assets of a community and that are driven by the community are likely to garner more
success than cookie-cutter strategies.
The research confirms that it is not about the size of the economic development effort but the quality and level
of focus that can be brought to the table – some of the most successful economic development initiatives are
small in scale and largely volunteer-led. Those processes that are inclusive of the community and leverage the
enthusiasm of community champions have been shown to have more credibility and staying power, leading to
a more sustained effort over the long-term.
The opportunity exists for local governments to play a greater role in economic development
Multiple roles, drawn from the survey and current literature, are suggested for local governments in facilitating
economic development: convening and organizing partnerships between different levels of government, civic,
community and business organizations; disseminating information among stakeholders and the business
community; building networks of people and information central to innovation; facilitating relationships and
leading visioning and research initiatives, and ensuring better coordination among existing delivery programs in
the wider arena. That said, it needs to be acknowledged that the ability of local governments to embark on any
of these roles is severely limited by the availability of resources.

64
The challenge of economic development delivery is largely one of resources
There remains a large discrepancy in the level and type of local government intervention in economic
development. The reasons for this appear to be mixed. For some local governments economic development
planning is simply not an area that is considered a necessary or desirable activity and for others more pressing
issues win out. For a large majority, however, it comes down to a lack of resources.
Lack of human and financial resources were the primary barriers identified in the survey and for the majority of
local governments there remains little room to move beyond traditional service delivery even though that is
often what is expected, particularly in the current economic climate. Capacity building (particularly for
innovation-based economic development) by local governments needs to include appropriate resourcing and
without this, it is unreasonable to expect local officials to lead or even participate in economic development
processes52. While the opportunity exists for local governments to play a leadership role in economic
development, this opportunity is often overshadowed by fiscal constraints. This is a debate and dialogue that
goes beyond the scope of this document, but for clarity bears mentioning here.
Local government economic development success stories continue to grow
Whether it occurs under the guise of economic development, community planning or sustainability planning
local governments across the province are demonstrating that they can play a meaningful role in influencing
and improving the economic future and quality of life for their residents. The community snapshots in this
report represent a fraction of the success stories that are unfolding in communities across BC, but they
demonstrate the community benefits that can be realized through the mobilization of resources and thoughtful
planning. These communities are leaders in bringing about improved outcomes for their residents and serve
as examples of what is possible.
Where do we go from here?
As the organization representing the interests of local governments in BC, UBCM is guided by the issues that
matter most to its members. Economic development has consistently been raised by members as a critical
issue in their communities and this report represents the culmination of dialogue and discussion by UBCM on
this important issue. Hopefully it will also serve as a starting point for future dialogue and action in
communities across the province.
UBCM will continue its work on economic development through the direction of the UBCM Community
Economic Development (CED) Committee and welcomes feedback from members on this publication or on
economic development in general. There are also other resources available to members in their search for
more information and Section 5 provides a list of key websites, organizations, and publications. Finally, the
UBCM CED Committee would like to extend a heartfelt thank you to all of the members and individuals that
contributed in some way to this publication.

65
Section 5 Economic Development Resources Books
• Blakely, E.J., and Leigh, N.J. Planning Local Economic Development: Theory and Practice (Fourth
Edition). Newbury Park, CA: Sage Publications, 2010.
• Bruce, D. et al (Editors). The Next Rural Economies: Constructing Rural Places in Global Economies,
Cambridge, MA: EWU Press, 2009.
Reports/Articles
• BC Research and Innovation Strategy, BC Ministry of Advanced Education and Ministry Responsible for
Research and Technology (no date), www.tted.gov.bc.ca/TRI/research
• Playing for Keeps: Boosting Western Canada’s Economic Competitiveness in a Post-Recession World,
Gibbins, R. for Canada West Foundation (2009), www.cwf.ca
• Business Retention and Expansion Program, By Lions Gate Consulting for the Economic Development
Association of BC (EDABC) (May 2006), www.edabc.com
• Structuring an Economic Development Organization, By R.J. Bell Consulting for the Economic
Development Association of BC (May 2006), www.edabc.com
• The Essentials of Economic Development Practices, Principles and Planning, Economic Development
Association of Canada (EDAC) (2009), www.edac.com
• Incorporating Economic Development into Local Government Planning, Queensland Government
(Department of State Development and Trade) (2006), www.regions.qld.gov.au
Economic and Community Development Websites
• BC Ministry of Small Business, Technology and Economic Development, www.gov.bc.ca/tted
• Business Improvement Areas of BC, www.bia.bc.ca
• Community Futures BC, www.communityfutures.ca
• Economic Development Association of BC, www.edabc.com
• Economic Development Association of Canada, www.edac.com
• International Economic Development Council, www.iedconline.org
• RuralBC Secretariat, www.ruralbc.gov.bc.ca
Sustainability and Community Planning Websites
• BC Climate Action Toolkit, www.toolkit.bc.ca
• Canadian CED Network, www.ccednet-rcdec.ca
• Fraser Basin Council, www.fraserbasin.bc.ca
• Green Communities Canada, www.gca.ca
• ICLEI-Local Governments for Sustainability, www.iclei.org
• Rocky Mountain Institute, www.rmi.org
Innovation Related Websites
• BC Research and Innovation Council, www.tted.gov.bc.ca/
• BC Innovation Council, www.bcic.ca/
• PrGRIS, www.utoronto.ca/progris/
• Centre for Sustainability and Social Innovation, UBC, www.sauder.ubc.ca
• BC Government List of Innovation Organizations,
www.tted.gov.bc.ca/TRI/research/innovationorganizations/

66

67
Appendix 1: List of Survey Respondents
Municipalities
• Alert Bay, Village of • Armstrong, City of • Ashcroft, Village of • Belcarra, Village of • Bowen Island Municipality • Burnaby, City of • Burns Lake, Village of • Cache Creek, Village of • Campbell River, City of • Canal Flats, Village of • Central Saanich, District of • Chetwynd, District of • Chilliwack, City of • Clearwater, District of • Clinton, Village of • Colwood, City of • Comox, Town of • Coquitlam, City of • Courtenay, City of • Cranbrook, City of • Delta, District of • Duncan, City of • Elkford, District of • Enderby, City of • Esquimalt, Township of • Fernie, City of • Fort St. James, District of • Fraser Lake, Village of • Gibsons, Town of • Golden, Town of • Gold River, Village of • Grand Forks, City of • Greenwood, City of • Harrison Hot Springs, Village of • Hope, District of • Houston, District of • Kaslo, Village of • Kelowna, City of • Kent, District of • Keremeos, Village of • Kimberley, City of • Kitimat, District of • Ladysmith, Town of • Lake Country, District of • Langford, City of • Langley, City of • Lillooet, District of • Lions Bay, Village of • Logan Lake, District of • Lumby, Village of • Maple Ridge, District of • McBride, Village of
• Merritt, City of • Metchosin, District of • Mission, District of • Montrose, Village of • Nanaimo, City of • New Denver, Village of • New Westminster, City of • Northern Rockies, Regional Municipality of • North Cowichan, District of • North Saanich, District of • North Vancouver, City of • North Vancouver, District of • Oak Bay, District of • Oliver, Town of • Osoyoos, Town of • Pemberton, Village of • Penticton, City of • Pitt Meadows, City of • Port Alberni, City of • Port Coquitlam, City of • Port Hardy, District of • Port Moody, City of • Pouce Coupe, Village of • Prince George, City of • Prince Rupert, City of • Princeton, Town of • Qualicum Beach, Town of • Radium Hot Springs, Village of • Revelstoke, City of • Richmond, City of • Saanich, District of • Salmon Arm, City of • Sayward, Village of • Sicamous, District of • Sidney, Town of • Slocan, Village of • Sooke, District of • Squamish, District of • Stewart, District of • Summerland, District of • Surrey, City of • Telkwa, Village of • Terrace, City of • Ucluelet, District of • Valemount, Village of • Vancouver, City of • Vanderhoof, District of • Vernon, City of • Victoria, City of • Whistler, Resort Municipality of • White Rock, City of • Williams Lake, City of

68
Regional Districts
• Alberni-Clayoquot • Bulkley-Nechako • Central Coast • Central Okanagan • Columbia Shuswap • Comox Valley • Cowichan Valley • East Kootenay • Fraser Valley • Fraser-Fort George • Kitimat-Stikine • Metro Vancouver • Mount Waddington • Okanagan-Similkameen • Peace River • Powell River • Skeena-Queen Charlotte • Strathcona • Sunshine Coast • Thompson-Nicola

69
END NOTES AND REFERENCES
1 Respondents were not required to answer all questions. As a result, the response rate for a particular question may be
lower than the overall survey response rate of 66 percent. Each graph provides the number (n) of respondents that answered that survey question.
2 Where requested by a local government or economic development organization, actual population estimates have been
used instead of population categories. This occurs primarily in the community snapshots.
3 In this survey some regional districts have been characterized as “Metropolitan” because their population is over 50,000. It
is acknowledged that for some regional districts this category may not adequately reflect the rural nature of their population base and geography.
4 World Bank Group. What is Local Economic Development? Washington, DC: International Bank for Reconstruction and
Development, The World Bank, 2010. Available at: www.go.worldbank.org/EA784ZB3F0.
5 Australian Local Government Association. National Agenda for Australian Local Government 2002, Deakin, ACT:
Australian Local Government Association, 2002. Available at: www.alga.asn.au/.
6 The 2005 survey revealed that communities with a population of less than 5000 are less inclined to have a formal
economic development function and mid-size to large communities are more likely to have a formal economic development function. Of those communities with a formal economic development function, 70 percent identified being involved in economic development planning for at least five years.
7 See Economic Development: the Civic Culture of Local Economic Development by Laura Reese and Raymond Rosenfeld
(Thousand Oaks, CA: Sage, 2002) for a better description of the role civic culture plays in the economic development decision-making process.
8 Luger, Michael. The Role of Local Government in Contemporary Economic Development, Lincoln Institute of Land Policy
Working Paper. Cambridge, MA: Lincoln Institute of Land Policy, 2007. Available at: www.lincolninst.edu/pubs.
9 Buholzer, William. The Community Charter: B.C. Local Government in Transition (2
nd Ed). Vancouver, BC: Continuing
Legal Education Society of BC, 2004. Available at: www.cle.bc.ca.
10 Ministry of Community Services, Government of British Columbia. Local Governance in British Columbia: Local
Government Excellence through Collaborative Partnerships (prepared for the World Urban Forum III June 19-23, 2006). Vancouver, BC: Government of British Columbia, 2006. Available at: www.cd.gov.bc.ca/lgd/intergov_relations.
11 Taken from 2009 survey data, but supplemented by information from Ellen Calliou, Economic Development Officer,
District of Chetwynd.
12 Taken from 2009 survey data, but supplemented by information from Marilyn Hutchinson, Economic Development Officer,
City of Nanaimo.
13 Taken from 2009 survey data, but supplemented by information from Corie Griffiths, Marketing and Research, Central
Okanagan Economic Development Commission.
14 Taken from 2009 survey data, but supplemented by information from Phil Taylor, Chief Administrative Officer, Town of
Golden.
15 Taken from 2009 survey data, but supplemented by information from Jennifer Bridarolli, Chief Administrative Officer (as of
October 2009), City of Merritt.
16 Taken from 2009 survey data, but supplemented by information from John Maclean, Chief Administrative Officer,
Regional District of Kootenay Boundary.
17 Taken from 2009 survey data, but supplemented by information from John Jansen, President, Chilliwack Economic
Partners Corporation.
18 A full list of project funding available to local governments is not provided in this document as there are organizations that
offer lists of funding sources. See, for example, the RuralBC Secretariat (www.ruralbc.gov.bc.ca) and Community Futures Development Corporation (www.communityfutures.ca).

70
19 BC Stats (Demographic Analysis Section), Ministry of Citizens’ Services, Government of British Columbia. British
Columbia Municipal Population Estimates – Sorted by Size (2009). Victoria, BC: Government of British Columbia, 2010. Available at: www.bcstats.gov.bc.ca/data/pop/pop/estspop.asp#totpop.
20 Collaborative Economics. The Innovation Driven Economic Development Model: A Practical Guide for the Regional
Innovation Broker. San Francisco, CA: Bay Area Council Economic Institute, 2008. Available at: www.bayeconfor.org.
21 Myrick, Philip. How Your Community Can Thrive-- Even in Tough Times. New York, NY: Project for Public Spaces, no
date (accessed September 2009). Available at: www.pps.org/info/newsletter/.
22 Diagram adapted from: Community Futures Alberta, Rural Diversification and Economic Gardening. Cochrane, Alberta:
Community Futures Alberta, no date (accessed October 2009). Available at: www.ruraldiversification.com (Rural Diversification 101/Rural Diversification and Economic Gardening).
23 Canada, Eric. Untapped Potential: Business Retention in Portfolio Management, Development Strategies 2002 Edition.
EcDevJournal.com, 2002. Available at: www.ecdevjournal.com (Development Strategies).
24 Bradford, Neil. Cities and Communities That Work: Innovative Practices, Enabling Policies, Discussion Paper F32.
Ottawa, ON: Canadian Policy Research Network, 2003. Available at www.cprn.org (Cities and Communities).
25 Taken from 2009 survey but supplemented by information from Corie Griffiths, Marketing and Research, Central
Okanagan Economic Development Commission and Central Okanagan Economic Development Commission website (www.investkelowna.com/).
26 Okanagan Innovation and Research Centre, www.oric.ca; Okanagan Science and Technology Council, www.ostec.ca.
27 Taken from 2009 survey but supplemented by information from Vern Schmuland, Economic Development Officer, Salmon
Arm Economic Development Society and Salmon Arm Economic Development Society Business Development Program website (www.salmonarmbdp.com/).
28 Taken from 2009 survey but supplemented by information from Geoff Millar, Economic Development Manager, Economic
Development Cowichan and Economic Development Cowichan website (www.cvrd.bc.ca).
29 Halseth, Greg. Unpublished presentation to UBCM Conference (Sept 29, 2009), A Province of Champions, September
28 – October 2, 2009. Vancouver, BC.
30 All information on Gravelbourg was provided by Chris Fullerton from an unpublished presentation (Sept 21, 2009). EDAC
and EDABC Joint 2009 Economic Development Conference, Canada’s Connection to the World, September 18 – 22, 2009. Vancouver, BC.
31 Taken from 2009 survey but supplemented by information from David Clutton, Long Range Planner, City of Burnaby.
32 Taken from 2009 survey but supplemented by information from Leslie Groulx, Economic Development Officer/Corporate
Administrator, District of Clearwater.
33 Taken from 2009 survey but supplemented by information from Sam Harling, Economic Development Officer, Terrace
Economic Development Authority.
34 Taken from 2009 survey but supplemented by information from Stacey Crawford, Economic Development Officer, District
of Mission.
35 Taken from 2009 survey but supplemented by information from Tim McEwan, President, Initiatives Prince George.
36 Ministry of Community and Rural Development, Government of British Columbia. Government of BC and City of Port
Alberni, BC, Port Alberni Partner on Economic Development, Victoria, BC: Government of British Columbia, December 1 2009. Available at: www.gov.bc.ca.
37 District of Sooke. Town Centre Stimulus Program, Sooke, BC: District of Sooke, 2009. Available at: www.sooke.ca,
38 Saskatchewan Economic Development Association, Partnerships. Saskatoon, SK: Saskatchewan Economic
Development Association, no date. Available at www.seda.sk.ca/res_community_partnerships.html
39 Ministry of Community Services, Government of British Columbia. Building Stronger Communities: Better Services,
Economic Growth, Solutions that Work, Report of the Task Force on Community Opportunities. Victoria, BC: Government of British Columbia, 2006. Available at: www.cd.gov.bc.ca/lgd/policy_research.

71
40 Halseth, Greg. Unpublished presentation to UBCM Conference (Sept 29, 2009), A Province of Champions, September 28
– October 2, 2009. Vancouver, BC.
41 Government of Canada. From Restless Communities to Resilient Places: Building a Stronger Future for All Canadians,
Final Report of the External Advisory Committee on Cities and Communities. Ottawa, ON: Government of Canada, June 2006. Available at: www.civicgovernance.ca.
42 Pollock, Anna. Beyond Recovery – Transformation! (unpublished presentation Sept 21 2009). EDAC and EDABC Joint
2009 Economic Development Conference, Canada’s Connection to the World, September 18 – 22, 2009. Vancouver, BC. www.annapollock.net.
43 Holbrook, J. and Wolfe, D. Knowledge, Clusters and Regional Innovation: Economic Development in Canada, Introduction
to Knowledge, Clusters and Learning Regions (editors, J. Holbrook and D. Wolfe) Kingston, ON; School of Policy Studies, Queen’s University, 2002. Queens Policy Studies Series #23. Available at: www.utoronto.ca/progris/ (publications).
44 Collaborative Economics. The Innovation Driven Economic Development Model: A Practical Guide for the Regional
Innovation Broker. San Francisco, CA: Bay Area Council Economic Institute, 2008. Available at: www.bayeconfor.org.
45 Pollock, Anna. Beyond Recovery – Transformation! (unpublished presentation Sept 21 2009). EDAC and EDABC Joint
2009 Economic Development Conference, Canada’s Connection to the World, September 18 – 22, 2009. Vancouver, BC. www.annapollock.net.
46 Government of British Columbia. Building Stronger Communities: Better Services, Economic Growth, Solutions That
Work, Report on the Task Force on Community Opportunities. Victoria, BC: Government of BC. Available at: www.cd.gov.bc.ca/lgd/policy_research.
47 Taken from 2009 survey but supplemented by information from Patti Smedley, Economic and Community Development
Coordinator, District of Port Hardy.
48 District of Summerland, District of Summerland Newsletters, Wharton Street Project. Summerland, BC: District of
Summerland, 2008 (February and March).
49 Union of BC Municipalities. Community to Community Connect, Richmond, BC: Union of BC Municipalities. Available at
www.civicinfo.bc.ca.
50 Resort Municipality of Whistler. First Nations Cultural Centre and Squamish-Lil’wat-Whistler Celebrate Community Forest,
Whistler, BC: Resort Municipality of Whistler, no date. Available at www.whistler.ca.
51 Department of State Development and Trade, Queensland Government. Incorporating Economic Development into Local
Government Planning. Brisbane, Australia: Queensland Government, 2006. Available at www.regions.qld.gov.au
52 Bradford, Neil. Cities and Communities That Work: Innovative Practices, Enabling Policies, Discussion Paper F32.
Ottawa, ON: Canadian Policy Research Network Inc, 2003. Available at www.cprn.org.