of contents 1 table of contents safety instructions...
TRANSCRIPT

Spectrum Analyzer
GSP-9300
USER MANUAL GW INSTEK PART NO. 82SP-930A0EB1
ISO-9001 CERTIFIED MANUFACTURER

This manual contains proprietary information, which is protected by copyright. All rights are reserved. No part of this manual may be photocopied, reproduced or translated to another language without prior written consent of Good Will company.
The information in this manual was correct at the time of printing. However, Good Will continues to improve products and reserves the rights to change specification, equipment, and maintenance procedures at any time without notice.
Good Will Instrument Co., Ltd. No. 7-1, Jhongsing Rd., Tucheng Dist., New Taipei City 236, Taiwan.

Table of Contents
1
Table of Contents SAFETY INSTRUCTIONS ................................................... 3
GETTING STARTED ........................................................... 8
GSP-9300 Introduction .......................... 9 Accessories .......................................... 12 Appearance .......................................... 14 First Use Instructions .......................... 26
BASIC OPERATION ......................................................... 38
Frequency Settings ............................... 41 Span Settings ....................................... 45 Amplitude Settings .............................. 48 Autoset ................................................ 64 Bandwidth/Average Settings ................ 66 Sweep .................................................. 73 Trace .................................................... 81 Trigger ................................................. 89 Marker ................................................. 94 Display............................................... 108 System Settings ................................. 117 Preset ................................................ 121
ADVANCED OPERATION ................................................ 123
Measurement ..................................... 125 EMC Pre-Compliance Testing ............. 202 Limit Line Testing .............................. 220 Sequence ........................................... 227 Tracking Generator ............................ 232 Power Meter ...................................... 237 Demo Kit ........................................... 243

GSP-9300 User Manual
2
FILE ............................................................................... 248
File Overview ..................................... 248
REMOTE CONTROL ....................................................... 265
Interface Configuration ...................... 266
FAQ ............................................................................... 281
APPENDIX ..................................................................... 282
Replace the Clock Battery ................... 282 Glossary of Acronyms ........................ 283 GSP-9300 Default Settings ................. 285 Menu Tree .......................................... 287 GSP-9300 Specifications .................... 326 GSP-9300 Dimensions ....................... 335 Declaration of Conformity .................. 336
INDEX ............................................................................ 337

SAFETY INSTRUCTIONS
3
SAFETY INSTRUCTIONS This chapter contains important safety instructions that you must follow during operation and storage. Read the following before any operation to ensure your safety and to keep the instrument in the best possible condition.
Safety Symbols
These safety symbols may appear in this manual or on the instrument.
WARNING Warning: Identifies conditions or practices that could result in injury or loss of life.
CAUTION Caution: Identifies conditions or practices that could result in damage to the instrument or to other properties.
DANGER High Voltage
Attention Refer to the Manual
Earth (ground) Terminal
Frame or Chassis Terminal
Do not dispose electronic equipment as unsorted municipal waste. Please use a separate collection facility or contact the supplier from which this instrument was purchased.

GSP-9300 User Manual
4
Safety Guidelines
General Guideline
CAUTION
Do not place any heavy object on the instrument.
Avoid severe impact or rough handling that leads to damaging the instrument.
Do not discharge static electricity to the instrument.
Use only mating connectors, not bare wires, for the terminals.
Ensure signals to the RF input do not exceed +30dBm.
Ensure reverse power to the TG output terminal does not exceed +30dBm.
Do not supply any input signals to the TG output.
Do not block the cooling fan opening.
Do not disassemble the instrument unless you are qualified.
(Measurement categories) EN 61010-1:2010 specifies the measurement categories and their requirements as follows. The instrument falls under category II.
Measurement category IV is for measurement performed at the source of low-voltage installation.
Measurement category III is for measurement performed in the building installation.
Measurement category II is for measurement performed on the circuits directly connected to the low voltage installation.
Measurement category I is for measurements performed on circuits not directly connected to Mains.
Power Supply
WARNING
AC Input voltage range: 100V~240V
Frequency: 50/60Hz
To avoid electrical shock connect the protective grounding conductor of the AC power cord to an earth ground.

SAFETY INSTRUCTIONS
5
Battery
CAUTION
Rating: 10.8V, 6 cell Li-ion battery
Turn off the power and remove the power cord before installing or removing the battery.
Cleaning Disconnect the power cord before cleaning.
Use a soft cloth dampened in a solution of mild detergent and water. Do not spray any liquid.
Do not use chemicals containing harsh material such as benzene, toluene, xylene, and acetone.
Operation Environment
Location: Indoor, no direct sunlight, dust free, almost non-conductive pollution (Note below)
Temperature: 5°C to 45°C
Humidity: <90%
(Pollution Degree) EN 61010-1:2010 specifies the pollution degrees and their requirements as follows. The instrument falls under degree 2.
Pollution refers to “addition of foreign matter, solid, liquid, or gaseous (ionized gases), that may produce a reduction of dielectric strength or surface resistivity”.
Pollution degree 1: No pollution or only dry, non-conductive pollution occurs. The pollution has no influence.
Pollution degree 2: Normally only non-conductive pollution occurs. Occasionally, however, a temporary conductivity caused by condensation must be expected.
Pollution degree 3: Conductive pollution occurs, or dry, non-conductive pollution occurs which becomes conductive due to condensation which is expected. In such conditions, equipment is normally protected against exposure to direct sunlight, precipitation, and full wind pressure, but neither temperature nor humidity is controlled.
Storage environment
Location: Indoor
Temperature: -20°C to 70°C
Humidity: <90%

GSP-9300 User Manual
6
Disposal
Do not dispose this instrument as unsorted municipal waste. Please use a separate collection facility or contact the supplier from which this instrument was purchased. Please make sure discarded electrical waste is properly recycled to reduce environmental impact.

SAFETY INSTRUCTIONS
7
Power cord for the United Kingdom
When using the instrument in the United Kingdom, make sure the power cord meets the following safety instructions.
NOTE: This lead/appliance must only be wired by competent persons
WARNING: THIS APPLIANCE MUST BE EARTHED IMPORTANT: The wires in this lead are coloured in accordance with the following code: Green/ Yellow: Earth
Blue: Neutral Brown: Live (Phase)
As the colours of the wires in main leads may not correspond with the coloured marking identified in your plug/appliance, proceed as follows:
The wire which is coloured Green & Yellow must be connected to the Earth terminal marked with either the letter E, the earth symbol
or coloured Green/Green & Yellow.
The wire which is coloured Blue must be connected to the terminal which is marked with the letter N or coloured Blue or Black.
The wire which is coloured Brown must be connected to the terminal marked with the letter L or P or coloured Brown or Red.
If in doubt, consult the instructions provided with the equipment or contact the supplier.
This cable/appliance should be protected by a suitably rated and approved HBC mains fuse: refer to the rating information on the equipment and/or user instructions for details. As a guide, a cable of 0.75mm2 should be protected by a 3A or 5A fuse. Larger conductors would normally require 13A types, depending on the connection method used.
Any exposed wiring from a cable, plug or connection that is engaged in a live socket is extremely hazardous. If a cable or plug is deemed hazardous, turn off the mains power and remove the cable, any fuses and fuse assemblies. All hazardous wiring must be immediately destroyed and replaced in accordance to the above standard.

GSP-9300 User Manual
8
GETTING STARTED This chapter provides a brief overview of the GSP-9300, the package contents, instructions for first time use and an introduction to the front panel, rear panel and GUI.
GSP-9300 Introduction ...................................................... 9 Main Features ............................................................................................................. 9
Accessories ..................................................................... 12

GETTING STARTED
9
GSP-9300 Introduction The GSP-9300 builds on the strong feature set of the GSP-930 and significantly increases performance in almost every aspect; making this the most comprehensive and feature-rich spectrum analyzer GW Instek has released.
Like the GSP-930, the GSP-9300 features a split window display to view data in spectrum, topographic or spectrographic views. There are also a number of additional test functions such as 2FSK, 1PdB and new dedicated EMC pretest functions for EMI and EMS testing. Lastly, the GSP-9300 significantly reduces the sweep time and RBW filter step resolution and complexity.
Main Features
Performance 9kHz~3GHz bandwidth
1Hz resolution
Nominal RBW accuracy of ±5% <1MHz, ±8% =1MHz
Video bandwidth 1Hz~1MHz (1-3-10 steps)
Amplitude measurement range: DANL~30dBm (frequency dependent)
Input attenuation: 0 ~ 50dB, 1dB steps
Phase noise: < -88dBc/Hz@1GHz, 10kHz, typical
Features 1-3-10 step increments for RBW bandwidth
Three display modes: Spectrum, Topographic and Spectrographic
Split window display
Built-in EMI filter
Auto Wake-up
Built-in preamplifier
GSP-9300 User Manual
10
Gate sweep
Marker Frequency counter
Two operating modes: Spectrum and Power Meter mode
EMI Pretest functions
SEM measurement
ACPR measurement
OCBW measurement
2FSK measurement
Phase jitter measurement
Harmonics measurement
P1dB measurement
Channel power measurement
Demodulation analyzer
Diverse marker functions and features with Peak Table
Sequence function to automatically perform pre-programmed sequential operations
Optional battery operation

GETTING STARTED
11
Interface 8.4 color LCD (800600)
On-screen menu icons
DVI-I video output
RS-232 with RTS/CTS hardware flow control
USB 2.0 with support for USB TMC
LAN TCP/IP with LXI support
Optional GPIB/IEEE488 interface
Optional 3G USB adapter for WLAN
Optional power meter adapter
IF output @ 886MHz
Headphone output
REF (reference clock) input/output BNC ports
Alarm/Open collector output BNC port
Trigger/Gate input BNC ports
RF N-type input port
Tracking generator output
DC +7V/500mA output SMB port

GSP-9300 User Manual
12
Accessories
Standard Accessories
Part number Description
Region dependant Power cord
N/A User manual CD: Includes: User manual, Programming manual, SpectrumShot quick start guide, SpectrumShot software, IVI driver
N/A Quick start guide
N/A Certificate of calibration
Options Option number Description
Opt1. Tracking generator
Opt2. Battery (11.1V/5200mAH Li-ion battery)
Opt3. GPIB interface (IEEE 488 bus)
Optional Accessories
Part number Description
ADB-002 DC BLOCK BNC 50R 10MHz-2.2GHz
ADB-006 DC BLOCK N TYPE 50R 10MHz-6GHz
ADB-008 DC BLOCK SMA 50R 0.1MHz-8GHz
GSC-009 Soft Carrying Case
PWS-06 USB Average Power Sensor (up to 6200 MHz; -32 to 20 dBm)
GRA-415 6U Rack mount kit

GETTING STARTED
13
Software Downloads
PC Software for Windows System (SpectrumShot quick start guide, SpectrumShot software)
IVI Driver Supports LabView & LabWindows/CVI Programming
Android System (“GSP-9300 Remote Control”, available on Google play.)

GSP-9300 User Manual
14
Appearance
GSP-9300 Front Panel
LOCAL
CONTROL
FILE AUXILIARY
Frequency
Autoset
Amplitude
Span
BW / AVG
Display
Trace
Sweep
Measure
Trigger
File
Recall
Save
Peak
Marker
Marker
System
Preset
Search
QuickSave
EMCPretest
7
4
1
0
8
5
2
9
6
3
/ Enter
BK SP
SweepMode
LimitLine
Sequence
OptionControl
Fast/Normal
F 4
F 3
F 2
F 1
F 6
F 5
F 7
RF INPUT 50
REV PWR +30 dBm
TG OUTPUT 50 W W500 mA MAX .
DC 7V
OUTPUT +30 dBm MAX .
MAX.DC ± 50 V MAX.DC ±50 V
9 kHz 3 GHz
Spectrum AnalyzerGSP -9 3 0 0
LCD display
Main keys
Function keys
Control keys Power key
File keys
Auxiliary keys
Scroll wheel
Arrow keys
RF input terminal
DC power supply
Tracking generator output
Numeric, Enter and BK SP keys
USB A, Micro SD port
Marker keys
Preset/Local and Quick Save keys
MARKER
LCD display 800600 color LCD display. The display shows the soft keys for the current function, frequency, amplitude and marker information.
Function keys F 1
~ F 7
The F1 to F7 function keys directly correspond to the soft keys on the right-hand side of display.
Main keys Frequency
Sets the center frequency, start frequency, stop frequency, center frequency step and frequency offset values.

GETTING STARTED
15
Span
Sets the span, with options for full span, zero span and last span.
Amplitude
Sets the amplitude reference level, attenuation, pre-amplifier controls, scale and other options for attenuation and scale.
Autoset
Automatically searches the peak signal with maximum amplitude and displays it with appropriate horizontal and vertical scales.
Control keys BW/Avg
Sets the resolution bandwidth, video bandwidth, average type and turns the EMI filter on/off.
Sweep
Sets the sweep time and gate time.
SweepMode
Toggles the Sweep Control between Fast and Normal mode.
Measure
Accesses measurement options such as ACPR, OCBW, demodulation measurements, SEM, TOI, 2FSK, phase jitter and other advanced measurements.
EMCPretest
Dedicated EMI testing and setup menu.
Trace
Sets traces and trace related functions.
LimitLine
Sets and tests Pass/Fail limit lines.
GSP-9300 User Manual
16
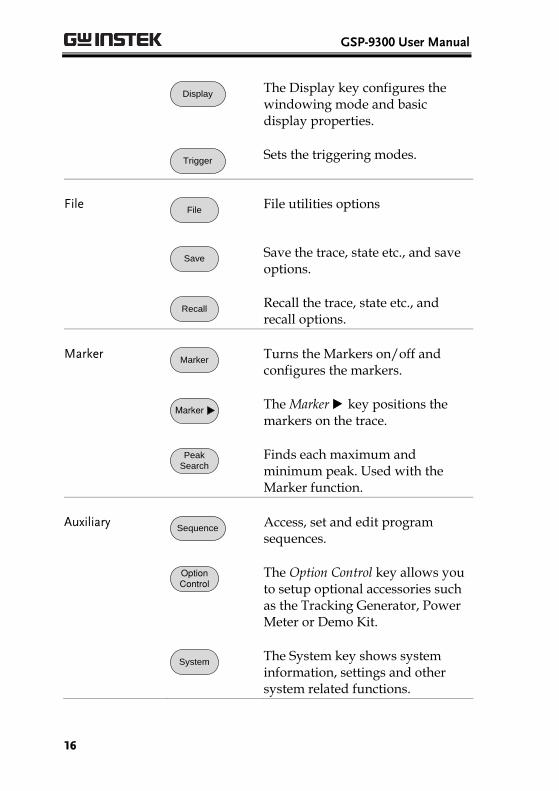
Display
The Display key configures the windowing mode and basic display properties.
Trigger
Sets the triggering modes.
File File
File utilities options
Save
Save the trace, state etc., and save options.
Recall
Recall the trace, state etc., and recall options.
Marker Marker
Turns the Markers on/off and configures the markers.
Marker
The Marker key positions the markers on the trace.
PeakSearch
Finds each maximum and minimum peak. Used with the Marker function.
Auxiliary Sequence
Access, set and edit program sequences.
OptionControl
The Option Control key allows you to setup optional accessories such as the Tracking Generator, Power Meter or Demo Kit.
System
The System key shows system information, settings and other system related functions.
GETTING STARTED
17
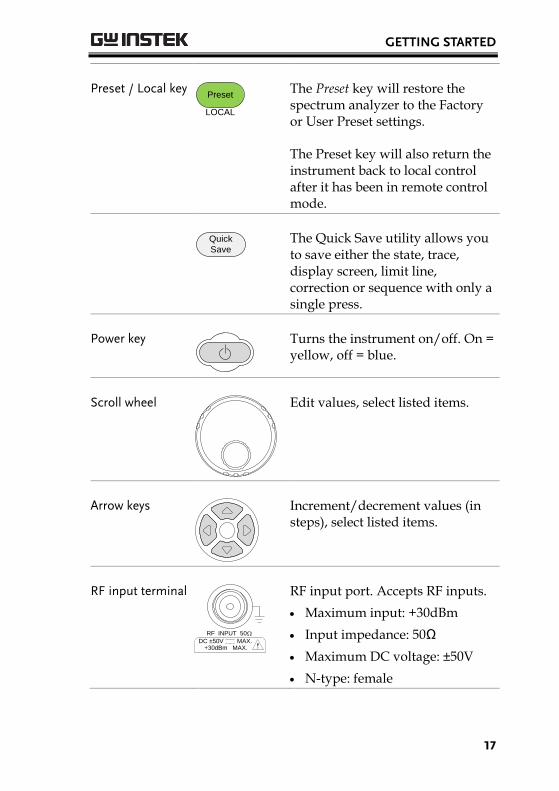
Preset / Local key Preset
LOCAL
The Preset key will restore the spectrum analyzer to the Factory or User Preset settings.
The Preset key will also return the instrument back to local control after it has been in remote control mode.
QuickSave
The Quick Save utility allows you to save either the state, trace, display screen, limit line, correction or sequence with only a single press.
Power key
Turns the instrument on/off. On = yellow, off = blue.
Scroll wheel
Edit values, select listed items.
Arrow keys
Increment/decrement values (in steps), select listed items.
RF input terminal
RF INPUT 50W
+30dBm MAX.MAX.DC ±50V
RF input port. Accepts RF inputs.
Maximum input: +30dBm
Input impedance: 50Ω
Maximum DC voltage: ±50V
N-type: female

GSP-9300 User Manual
18
DC power supply
500mA MAX.DC 7V
OUTPUT
SMB port supplies power for optional accessories.
DC +7V
500mA Max.
Numeric keypad 7
4
1
0
8
5
2
9
6
3
/ Enter
BK SP
The numeric keypad is used to enter values and parameters. It is often used in conjunction with the arrow keys and scroll wheel.
TG output port
REV PWR +30dBm
TG OUTPUT 50WMAX.DC ±50V
The Tracking Generator (TG) output source.
N-type: female
Input impedance: 50Ω
Output power: -50dBm to 0dBm
Maximum reversed power: +30dBm
USB A, Micro SD
USB A port, Micro SD port for saving/recalling settings/files.

GETTING STARTED
19
Rear Panel
AC 100 240V50 60 Hz 82W MAX.
AC 100 240V50 60 Hz 82W MAX.
USB-B, LAN port
FanDVI-I port
IF OUT
TRIG IN/GATE IN port
ALARM OUT/OPEN
COLLECTOR
REF OUT Battery cover/Optional battery pack
REF IN
RS232 port
GPIB port (optional)
Power socket
RS232
RS232 9 pin DSUB port.
IF OUT
SMA IF Out port.
DVI-I
DVI video out port. Supports SVGA (800X600) @ 60Hz.
Fan
Power Socket
Power Socket: 100~240V, 50/60Hz.

GSP-9300 User Manual
20
Battery pack
Voltage: 10.8V Capacity: 5200mAH
REF IN
BNC female reference input.
REF OUT
BNC female reference output: 10MHz, 50Ω impedance
Security Lock
ALARM OUT
BNC female open collector Alarm output.
TRIG IN/GATE IN
BNC female 3.3V CMOS trigger input/gated sweep input.
Phone
3.5mm stereo headphone jack (wired for mono operation)
USB B
USB B Device port. USB 1.1/2.0
LAN
RJ-45 10Base-T/100Base-Tx
GETTING STARTED
21
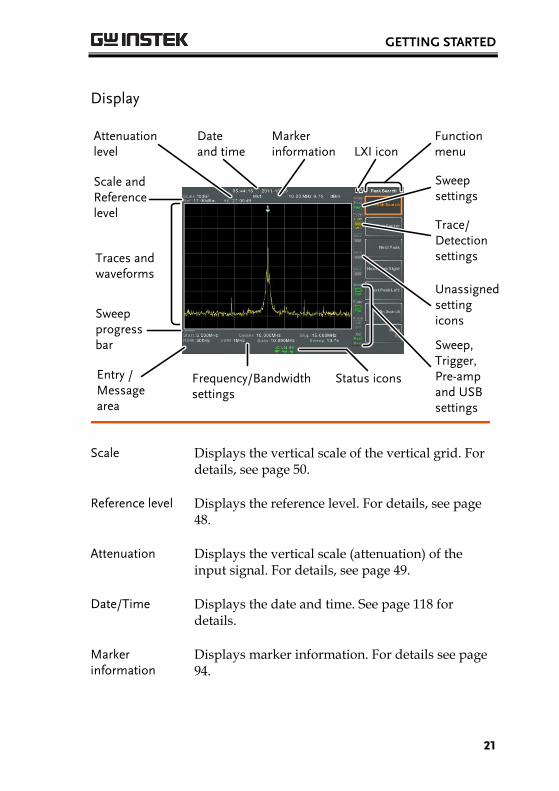
Display
Scale and Reference level
Attenuation level
Date and time
Function menu
Marker information
Trace/Detection settings
Unassigned setting icons
Sweep, Trigger, Pre-amp and USB settings
Frequency/Bandwidth settings
Status icons
Sweep settings
Traces and waveforms
LXI icon
Entry / Message area
Sweep progress bar
Scale Displays the vertical scale of the vertical grid. For details, see page 50.
Reference level Displays the reference level. For details, see page 48.
Attenuation Displays the vertical scale (attenuation) of the input signal. For details, see page 49.
Date/Time Displays the date and time. See page 118 for details.
Marker information
Displays marker information. For details see page 94.
GSP-9300 User Manual
22
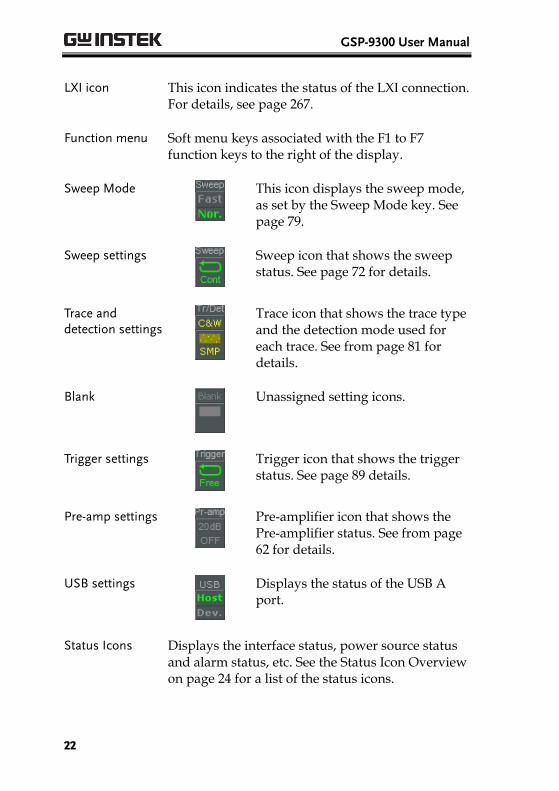
LXI icon This icon indicates the status of the LXI connection. For details, see page 267.
Function menu Soft menu keys associated with the F1 to F7 function keys to the right of the display.
Sweep Mode
This icon displays the sweep mode, as set by the Sweep Mode key. See page 79.
Sweep settings
Sweep icon that shows the sweep status. See page 72 for details.
Trace and detection settings
Trace icon that shows the trace type and the detection mode used for each trace. See from page 81 for details.
Blank
Unassigned setting icons.
Trigger settings
Trigger icon that shows the trigger status. See page 89 details.
Pre-amp settings
Pre-amplifier icon that shows the Pre-amplifier status. See from page 62 for details.
USB settings
Displays the status of the USB A port.
Status Icons Displays the interface status, power source status and alarm status, etc. See the Status Icon Overview on page 24 for a list of the status icons.

GETTING STARTED
23
Frequency/ Bandwidth settings
Displays the Start, Center and Stop frequencies, RBW, VBW, Span and Sweep settings.
Entry/Message area
This area is used to show system messages, errors and input values/parameters.
Trace and waveforms
Main display showing the input signals, traces (page 81), limit lines (220) and marker positions (94).
Sweep progress bar
The sweep progress bar shows the progress of slow sweeps (greater than 2 seconds).

GSP-9300 User Manual
24
Status Icon Overview
3G Adapter
Indicates that the 3G adapter is installed and turned on.
Demo Kit
Indicates that the demo kit is installed and turned on.
PreAmp
Indicates that the pre amplifier is on.
AC
Shown when running on AC power.
AC Charge
Shown when the AC power is charging the battery.
Alarm Off
Alarm buzzer output is currently off.
Alarm On
Alarm buzzer output is currently on.
Amplitude Offset
Indicates that the amplitude-shift is active. This icon appears when amplitude-related functions are used: Reference level offset Amplitude Correction Input Z = 75Ω and Input Z cal >0
Battery indicator ~
Indicates the battery charge.
Bandwidth Indicator
Indicates that the RBW or VBW settings are in manual mode.

GETTING STARTED
25
Average
Indicates that the Average function is active.
External Lock
Indicates that the system is now locked and refers to the external reference input signal
External Trigger
External trigger signal is being used.
Math
Trace math is being used.
Sequence Indicator
Shown when a sequence is running.
Sweep Indicator
Indicates that the sweep time is manually set.
Tracking generator
Indicates that the tracking generator is turned on.
TG Normalization
Indicates that the tracking generator has been normalized.
Wake-up clock
Indicates that the wake-up clock is turned on.
USB
Indicates that a USB flash drive is inserted into the front panel and is recognized.
Micro SD
Indicates that a micro SD card is inserted into the front panel and is recognized.

GSP-9300 User Manual
26
First Use Instructions Use the procedures below when first using the GSP-9300 to tilt the stand, insert the battery pack, power up the instrument, set the internal clock, set the wake-up clock, update the firmware and to restore the default settings. Lastly, the Conventions sections will introduce you to the basic operating conventions used throughout the user manual.
Tilting the Stand
Description
The GSP-9300 has two adjustable rubber feet that can used to position the instrument into two preset orientations.
Upright Position Tuck the feet under the bottom of the instrument to stand the instrument upright.
Leaning Position Pull the feet back to have the instrument leaning back.

GETTING STARTED
27
Inserting the Battery Pack
Description The GSP-9300 has an optional battery pack. The battery should be inserted before power is connected to the AC power socket and before the unit is turned on.
Steps 1. Ensure the power is off and the AC power is disconnected.
2. Remove the battery cover.
3. Insert the battery as shown in the diagram below.
4. Replace the battery cover.
Display Icon
The battery icon is displayed when GSP-9300 is running on battery power.
Insertion Diagram

GSP-9300 User Manual
28
Power UP
Steps 1. Insert the AC power cord into the power socket.
2. The power button exterior will be lit blue to indicate that the GSP-9300 is in standby mode.
3. Press the power button for a few seconds to turn the GSP-9300 on.
4. The power button will turn orange and the GSP-9300 will start to boot up.
Note It takes a little less than 1 minute for the GSP-9300 to fully startup.

GETTING STARTED
29
Power Down
Description The GSP-9300 has two methods to power down: Normal and Forced Power Down.
The normal power down method will save the system state and end any running processes. The state is saved for the next time the instrument is turned back on.
The forced power down method only does a minimum state save.
Normal Power Down
Press the power button. The system will automatically handle the power down procedure in the following order:
The system state is saved.
Outstanding processes are closed in sequence.
The LCD backlight is turned off.
The system enters standby mode (the power key changes from orange to blue).
Note The process takes ~10 seconds.
Forced Power Down
Press and hold the power button for ~4 seconds until the system turns off and the power button turns blue.
Note The forced power down mode might cause the GSP-9300 to perform a longer system check the next time it is powered up.

GSP-9300 User Manual
30
Setting the Date, Time and Wake-Up Clock
Description The GSP-9300 can be setup to power-up automatically using the Wakeup Clock function. This feature is useful to wake-up the instrument early and eliminate settling time.
System Date Example: Set the System Date to July 1, 2014
1. Press System >Date/Time[F4]>Set Date[F1]>Year[F1].
2. Press 2014>Enter[F1].
3. Press Month[F2]>7>Enter[F1].
4. Press Day[F3]>1>Enter[F1].
5. Press Return[F7].
Note The System Date will be shown at the top of the display.
System Time Example: Set the System Time to 9.00 AM
1. Press System >Date/Time[F4]>Set Time[F2]>Hour[F1].
2. Press 9>Enter[F1].
3. Press Minute[F2]>0>Enter[F1].
4. Press Second[F3]>0>Enter[F1].
5. Press Return[F7].

GETTING STARTED
31
Note The System Time will be shown at the top of the display.
System Wake-Up Clock
Example: Set the GSP-9300 to wake up at 9.00 AM
1. Press System >Date/Time[F4]>Wake-Up Clock[F3]>Select Clock[F1].
2. Press Clock 1[F1] ~ Clock 7[F7] to choose a clock (1 ~ 7).
3. Press State[F2] to turn the wake up clock on/off.
4. Press Hour[F3]>9>Enter[F1].
5. Press Minute[F4]>0>Enter[F1].
6. Press [F5] and choose Rept. (Repeat) or Single.
7. Press Select Date[F6] and select a day.
8. Press Return[F7] to save the Wake-Up Clock settings.
Note The system time is kept with the CR2032 clock battery. If the system time/ wake up clock can no longer be set, please replace the clock battery. See page 282.

GSP-9300 User Manual
32
Firmware Update
Description The GSP-9300 allows the firmware to be updated by end-users. Before using the GSP-9300, please check the GW Instek website or ask your local distributor for the latest firmware.
System version Before updating the firmware, please check the firmware version.
1. Press System >System Information[F1].
2. The firmware will be listed on the display.
Firmware: T. 2. 0.1.2
3. Press any other main/control/file/marker /auxiliary key to exit out of the System Information screen.
4. To upgrade the firmware, insert the new firmware onto a USB flash drive or Micro SD card and put the drive/card into the appropriate front panel port. The firmware files should be located in a directory named “gsp931”.
GETTING STARTED
33
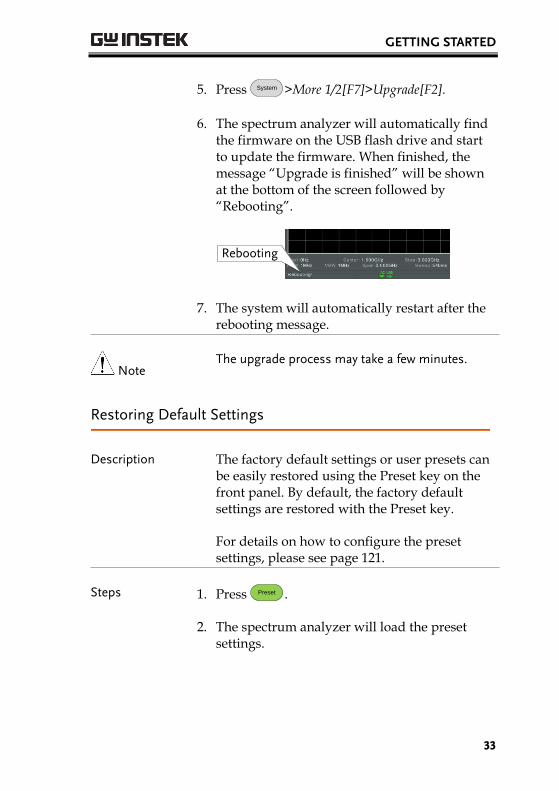
5. Press System >More 1/2[F7]>Upgrade[F2].
6. The spectrum analyzer will automatically find the firmware on the USB flash drive and start to update the firmware. When finished, the message “Upgrade is finished” will be shown at the bottom of the screen followed by “Rebooting”.
Rebooting
7. The system will automatically restart after the rebooting message.
Note The upgrade process may take a few minutes.
Restoring Default Settings
Description The factory default settings or user presets can be easily restored using the Preset key on the front panel. By default, the factory default settings are restored with the Preset key.
For details on how to configure the preset settings, please see page 121.
Steps 1. Press Preset .
2. The spectrum analyzer will load the preset settings.

GSP-9300 User Manual
34
Conventions
The following conventions are used throughout the user manual. Read the conventions below for a basic grasp of how to operate the GSP-9300 menu system and front panel keys.
Soft Menu keys The F1 to F7 function keys on the right side of the display correspond directly to the soft-menu keys on their left.
Soft-menu keys
F1 ~ F7 function keys
LOCAL
CONTROL
FILE MARKER AUXILIARY
Frequency
Autoset
Amplitude
Span
BW/AVG
Display
Trace
Sweep
Measure
Trigger
File
Recall
Save
Peak
Marker
Marker
System
Preset
Search
QuickSave
EMCPretest
7
4
1
0
8
5
2
9
6
3
/ Enter
BK SP
SweepMode
LimitLine
Sequence
OptionControl
Fast/Normal
F 4
F 3
F 2
F 1
F 6
F 5
F 7
RF INPUT 50
REV PWR +30dBm
TG OUTPUT 50 W W500mA MAX.
DC 7VOUTPUT +30dBm MAX.
MAX.DC ±50V MAX.DC ±50V
9 kHz 3 GHz
Spectrum AnalyzerGSP -9 3 0 0
Input Parameter Values
Selecting this type of menu key will allow you to enter a new value with the numeric keypad or increment/decrement the value using the scroll wheel.
Toggle State
Pressing this menu key will toggle the state.

GETTING STARTED
35
Toggle State & Input Parameter
Pressing this menu key will allow you to toggle the state of the function between Auto and Man(ual) state. When in the Man state, the parameter value can be manually edited. Use the numeric keypad to enter the new value or use the scroll wheel to increment/decrement the current value.
Sub Menu
Pressing this menu key will enter a submenu.
Sub Menu to select parameter
Pressing this menu key will enter a submenu to select a parameter.
Active Function
Pressing this type of menu key will activate that function. The menu key will be highlighted to show it is the active function.

GSP-9300 User Manual
36
Parameter input
LOCAL
Preset
QuickSave
7
4
1
0
8
5
2
9
6
3
/ Enter
BK SP
Numerical keypadScroll wheel
Directional arrow keys
Backspace, Enter keys
Parameter values can be entered using the numeric keypad, the scroll wheel and occasionally with the arrow keys.
Using the numeric keypad
When prompted to enter a parameter, use the number keys (0~9), the decimal key (.) and the sign key (+/-) to enter a value. After a value has been entered, the soft-menu keys can be used to select the units. The value of the parameter is shown at the bottom of the screen as it is edited. Values can include decimal points for non-integer values or for entering dot-decimal notation for IP addresses.
Edited parameter
Span: 10
Back Space Use the backspace key to delete the last character or number entered.

GETTING STARTED
37
Using the scroll wheel
Use the scroll wheel to alter the current value. Clockwise increases the value, anti-clockwise decreases the value.
Directional arrows Use the directional arrows to select discrete parameters or to alter values by a coarser resolution than the scroll wheel. Left decreases the value, right increases the value.
GSP-9300 User Manual
38
BASIC OPERATION
Frequency Settings .......................................................... 41 Center Frequency ..................................................................................................... 41 Start and Stop Frequency ........................................................................................ 42 Center Frequency Step ............................................................................................ 43 Frequency Offset ..................................................................................................... 44
Span Settings .................................................................. 45 Span ........................................................................................................................... 45 Full Span ................................................................................................................... 46 Zero Span ................................................................................................................. 46 Last Span ................................................................................................................... 47
Amplitude Settings .......................................................... 48 Reference Level ........................................................................................................ 48 Attenuation ............................................................................................................... 49 Scale/Div .................................................................................................................. 50 Auto Scale ................................................................................................................. 50 Scale Type ................................................................................................................. 51 View Scale ................................................................................................................. 51 Vertical Scale Units .................................................................................................. 53 Reference Level Offset ........................................................................................... 53 Amplitude Correction ............................................................................................. 54
Create a Correction Set .............................................................................. 55 Amplitude Correction On/Off ................................................................ 57 Delete Correction Set ................................................................................ 58 Save Correction Set to Memory ............................................................... 58 Recall Correction Set From Memory ....................................................... 60
Input Impedance ...................................................................................................... 61 Input Impedance Calibration ................................................................................. 61 Using the Built-in Pre-Amplifier ............................................................................ 62
Autoset ........................................................................... 64 Using Autoset ........................................................................................................... 64

BASIC OPERATION
39
Limiting the Autoset Vertical Search Range ........................................................ 65 Limiting the Autoset Horizontal Search Range ................................................... 65
Bandwidth/Average Settings ............................................ 66 Resolution Bandwidth Setting (RBW) .................................................................. 66 Video Bandwidth Settings (VBW) ......................................................................... 68 VBW/RBW Ratio .................................................................................................... 68 Average Trace ........................................................................................................... 69 Average Type ............................................................................................................ 71 EMI Filter ................................................................................................................. 72
Sweep ............................................................................. 73 Sweep Time .............................................................................................................. 73 Single Sweep ............................................................................................................. 74 Continuous Sweep ................................................................................................... 75 Gated Sweep Overview ........................................................................................... 75 Using the Gated Sweep Mode ................................................................................ 77 Sweep Control / Sweep Mode ............................................................................... 79
Trace ............................................................................... 81 Selecting a Trace ...................................................................................................... 81 Trace Math ................................................................................................................ 83 Trace Detection Mode ............................................................................................ 85
Trigger ............................................................................ 89 Selecting a Trigger Type .......................................................................................... 89
Free Run Mode ........................................................................................... 89 Activate Video Trigger .............................................................................. 89 Activate External Trigger .......................................................................... 91
Selecting the Trigger Mode ..................................................................................... 92 Set the Trigger Delay Time ..................................................................................... 93
Marker ............................................................................ 94 Activating a Marker ................................................................................................. 95
Activate a Normal Marker ......................................................................... 95 Move Marker Manually .............................................................................. 96 Move Marker to Preset Locations ............................................................ 96 Activate Delta Marker ................................................................................ 97 Move Delta Marker(s)Manually ................................................................ 98
Marker Functions ..................................................................................................... 99 Marker Noise .............................................................................................. 99 Frequency Counter ................................................................................... 100
Move Marker to Trace .......................................................................................... 101
GSP-9300 User Manual
40
Show Markers in Table ......................................................................................... 102 Peak Search ............................................................................................................. 103
Move Marker to Peak .............................................................................. 103 Move Marker and Peak to Center .......................................................... 103 Search for Peaks ....................................................................................... 104 Peak Configuration .................................................................................. 105
Peak Table ............................................................................................................... 106
Display ........................................................................... 108 Adjusting the LCD Brightness ............................................................................. 108 Turning the LCD Backlight Off .......................................................................... 108 Setting a Display Line (Reference Level Line) ................................................... 109 Using the Video Out Port .................................................................................... 109 Setting the Display Mode ...................................................................................... 110 Spectrogram and Topographic Markers ............................................................. 113 Split Spectrum View .............................................................................................. 115
System Settings ............................................................. 117 System Information ............................................................................................... 117 Error Messages ....................................................................................................... 117 Set the System Language ....................................................................................... 118 Set the Date and Time .......................................................................................... 118 Display the Date and Time on the Screen .......................................................... 119 Using the Wake-Up Clock .................................................................................... 119 Alarm Output ......................................................................................................... 120
Preset ............................................................................ 121 Using the Preset Key ............................................................................................. 121 Save the User Preset Settings ............................................................................... 121 Preset Type Settings .............................................................................................. 122 Power on Preset Settings ...................................................................................... 122

BASIC OPERATION
41
Frequency Settings
Center Frequency
Description The center frequency function sets the center frequency and centers the display to the center frequency.
Operation 1. Press Frequency >Center[F1] and enter the frequency and unit.
Range: Resolution: Default
0kHz~3GHz 1Hz 1.5GHz
Display Center frequency
Set Center Frequency

GSP-9300 User Manual
42
Start and Stop Frequency
Description The start/stop frequency function will set the start and stop frequency of the span.
Operation 1. To set the start frequency, press Frequency > Start
Freq[F2] and enter the frequency and unit.
2. To set the stop frequency, press Frequency > Stop
Freq[F3] and enter the frequency and unit.
Range: Resolution: Default Start frequency: Default Stop frequency:
0kHz~3GHz 1Hz 0Hz 3GHz
Display Start Frequency
Start Frequency Stop Frequency
Stop Frequency
Note The start and stop frequency can change when the span settings are used. The stop frequency must be set higher than the
start frequency (for spans 0), otherwise the span will be automatically set to 100Hz.

BASIC OPERATION
43
Center Frequency Step
Description The CF Step function sets the step size of the center frequency when using the arrow keys or scroll wheel. When the scroll wheel or arrow keys or are used to alter the center frequency, each turn/press will move the center frequency by the step size specified by the CF Step function. In auto mode, the center frequency step size is equal to 10% (1 division) of the span.
Operation 1. Press Frequency > CF Step[F4] and set the CF Step to Auto or Man.
2. If Man was selected, set the frequency and unit of the center frequency step size.
Manual Range: Auto range:
0Hz~3GHz 1/10 of span frequency
Display
CF Step size
GSP-9300 User Manual
44
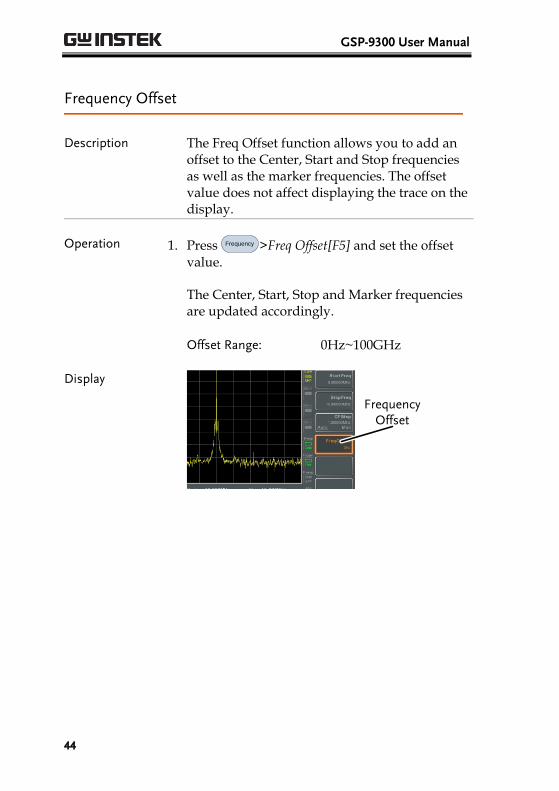
Frequency Offset
Description The Freq Offset function allows you to add an offset to the Center, Start and Stop frequencies as well as the marker frequencies. The offset value does not affect displaying the trace on the display.
Operation 1. Press Frequency >Freq Offset[F5] and set the offset value.
The Center, Start, Stop and Marker frequencies are updated accordingly.
Offset Range: 0Hz~100GHz
Display
FrequencyOffset

BASIC OPERATION
45
Span Settings
Span
Description The Span function will set the frequency range of the sweep. The sweep will be centered around the center frequency. Setting the span will alter the start and stop frequencies.
Operation 1. Press Span > Span[F1] and enter the span frequency range and unit.
Range: Resolution: Default Span:
0kHz~3GHz 1Hz 3GHz
Display Span
Set Span

GSP-9300 User Manual
46
Full Span
Description The Full Span function will set the span to the full frequency range. This function will set the start and stop frequencies to 0Hz and 3GHz respectively.
Operation 1. Press Span > Full Span[F2].
Zero Span
Description The Zero Span function will set the frequency range of the sweep to 0Hz and fixes the start and stop frequencies to the center frequency. The Zero Span function measures the time domain characteristics of the input signal at the center frequency. The horizontal axis is displayed in the time domain.
Operation 1. Press Span > Zero Span[F3].
The span changes accordingly.

BASIC OPERATION
47
Display Time domain
0Hz Span
Example: Amplitude modulation
Note The measurement functions such as TOI, SEM, CNR, CTB, CSO, ACPR, OCBW, phase, Jitter, Harmonics, NdB, P1dB and other measurement functions are not available with the zero span setting:
Last Span
Description The last span function returns the spectrum analyzer to the previous span settings.
Operation 1. Press Span > Last Span[F4].
GSP-9300 User Manual
48
Amplitude Settings The vertical display scale is defined by the reference level amplitude, attenuation, scale and external gain/loss.
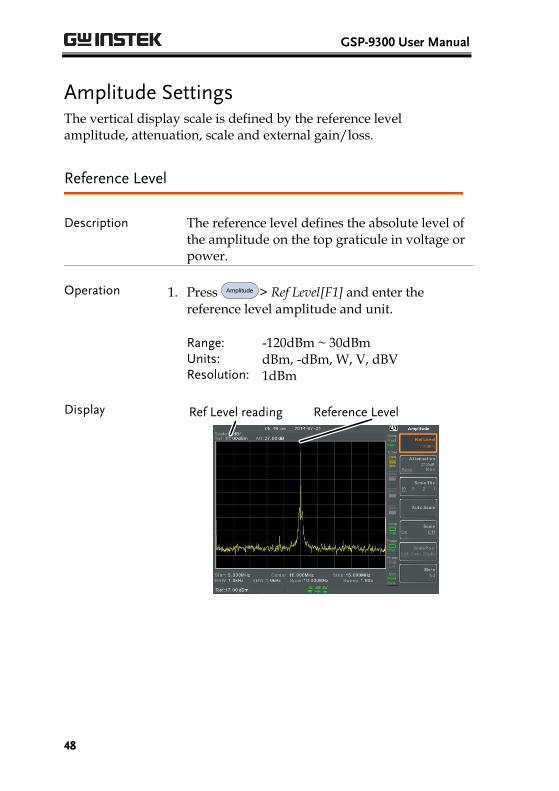
Reference Level
Description The reference level defines the absolute level of the amplitude on the top graticule in voltage or power.
Operation 1. Press Amplitude > Ref Level[F1] and enter the reference level amplitude and unit.
Range: Units: Resolution:
-120dBm ~ 30dBm dBm, -dBm, W, V, dBV 1dBm
Display Reference LevelRef Level reading
BASIC OPERATION
49
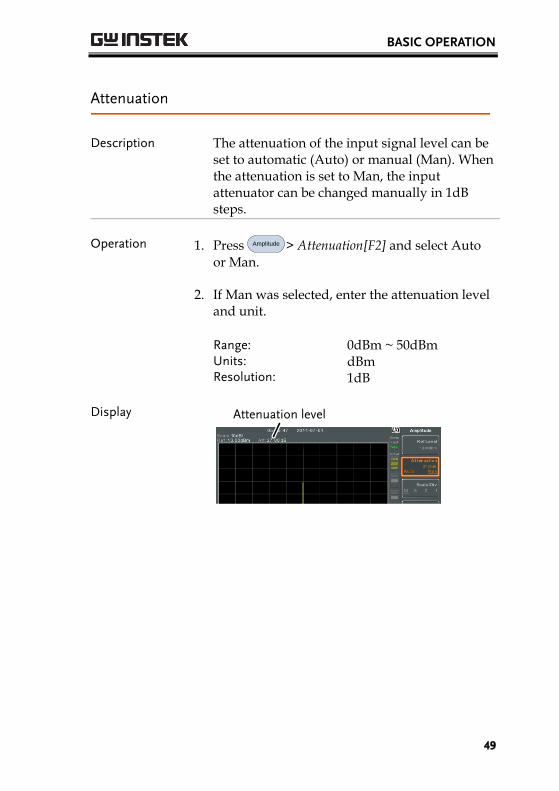
Attenuation
Description The attenuation of the input signal level can be set to automatic (Auto) or manual (Man). When the attenuation is set to Man, the input attenuator can be changed manually in 1dB steps.
Operation 1. Press Amplitude > Attenuation[F2] and select Auto or Man.
2. If Man was selected, enter the attenuation level and unit.
Range: Units: Resolution:
0dBm ~ 50dBm dBm 1dB
Display Attenuation level

GSP-9300 User Manual
50
Scale/Div
Description Sets the logarithmic units for the vertical divisions when the scale is set to Log.
Operation 1. Press Amplitude > Scale/Div[F3] repeatedly to select the vertical division units.
Unit Range: 10, 5, 2, 1
Display Scale
Note The Scale/Div function is only selectable when the scale is set to Log (logarithmic).
Auto Scale
Description The Auto Scale function will automatically set the Scale/Div, Reference level and Attenuation (if set to Auto) to best display the spectrum.
Operation 1. Press Amplitude > Auto Scale[F4] to turn the Auto Scale function on.
Note This function is applicable to both the linear and logarithmic scales.

BASIC OPERATION
51
Scale Type
Description Sets the vertical scale in linear or logarithmic units. By default the linear scale is set to volts and the logarithmic scale is set to dBm.
Operation 1. Press Amplitude > More[F7] > Scale Type[F2] and set the vertical scale to Log or Lin.
Note If the unit scale is changed (i.e. dBm → volts), the displayed vertical scale type will remain in the set linear or logarithmic setting.
View Scale
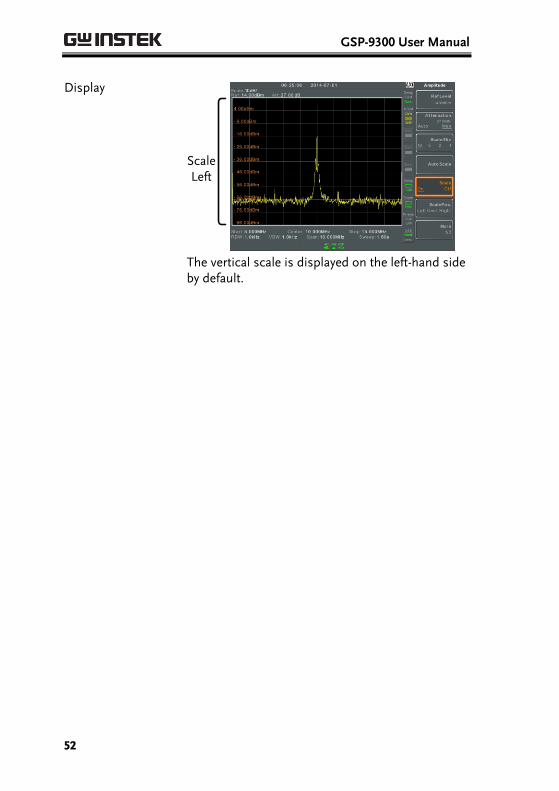
Description The Scale function turns the vertical scale on/off. The value of each graticule division is displayed with the same units that are used for the Ref Level settings.
Operation 1. Press Amplitude > Scale[F5] to toggle the Scale on or off.
2. Press Scale Pos.[F6] to toggle the position of the scale when on.
Scale position: Left, Center, Right
GSP-9300 User Manual
52
Display
Scale Left
The vertical scale is displayed on the left-hand side by default.
BASIC OPERATION
53
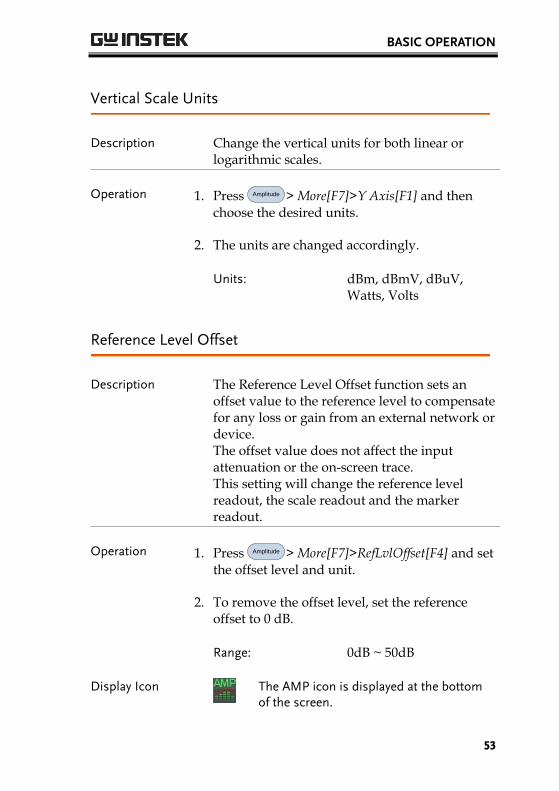
Vertical Scale Units
Description Change the vertical units for both linear or logarithmic scales.
Operation 1. Press Amplitude > More[F7]>Y Axis[F1] and then choose the desired units.
2. The units are changed accordingly.
Units: dBm, dBmV, dBuV, Watts, Volts
Reference Level Offset
Description The Reference Level Offset function sets an offset value to the reference level to compensate for any loss or gain from an external network or device. The offset value does not affect the input attenuation or the on-screen trace. This setting will change the reference level readout, the scale readout and the marker readout.
Operation 1. Press Amplitude > More[F7]>RefLvlOffset[F4] and set the offset level and unit.
2. To remove the offset level, set the reference offset to 0 dB.
Range: 0dB ~ 50dB
Display Icon
The AMP icon is displayed at the bottom of the screen.

GSP-9300 User Manual
54
Example:
Ref: 0dBm
Before reference level offset(offset: 0dB)
Ref: 10dBmReference level
offset: 10dB
After reference level offset (offset: 10dB)
Amplitude Correction
Description Amplitude correction adjusts the frequency response of the spectrum analyzer by altering the amplitudes at specified frequencies. This allows the spectrum analyzer to compensate for loss or gain from an external network or device at certain frequencies.
Range Correction Sets: 5 sets of 30 points
Amplitude: -40dB to +40dB Amplitude Resolution: 0.1dB Frequency: 9kHz to 3GHz Frequency Resolution: 1Hz

BASIC OPERATION
55
Display Correction points
Original waveform
Corrected output
Example: The diagram above shows how amplitude correction is used to compensate for any losses or gains at specific frequencies.
Create a Correction Set
Description The GSP-9300 can create and edit up to 5 sets of correction points. The correction points and associated values are all tabulated for ease of use.
Operation 1. Press Amplitude > More[F7]>Correction[F3]> Select
Correction[F1] and choose a correction set to edit/create.
Correction set: 1~5

GSP-9300 User Manual
56
2. Press Edit[F3].
The GSP-9300 will split into two screens. The top screen will show the waveform and the bottom screen will provide an overview of the correction points.
Spectrum display
Correction points
Frequency of selected point
3. Press Point Num[F1] and choose a point number to edit. Point numbers can only be created in order. For example Point Num 2 can only be selected after Point Num 1 is created, and point Num 3 can only be selected after Point Num 2 is created and so on.
Point Num: 1~20
4. Press Frequency[F2] and choose the frequency of the selected point.
5. Press Gain Offset[F3] and choose the amplitude of the selected point. The units will be the same as those used for the vertical scale.

BASIC OPERATION
57
The frequency of the point values are displayed in the correction table on the bottom display.
Correction Table
6. Repeat steps 3 to 5 for any other correction points.
7. To delete the selected point, press Delete Point[F6].
8. Press Return[F7]>Save Correction[F5] to save the correction set.
Note Note that the correction points are automatically sorted by frequency (low → high). The correction set must be saved before it can be turned on. The frequency values displayed in the correction table are rounded down for display purposes only. The actual frequency for each point can be seen in the Frequency soft-key.
Amplitude Correction On/Off
Description Any one of the 5 correction sets can be turned on.
Activate Correction
1. Press Amplitude > More[F7]>Correction[F3]>
Correction Set[F1] and choose a correction set.
Correction Set: 1~5
GSP-9300 User Manual
58
2. Press Correction[F2] and toggle correction on.
Deactivate Correction
1. Press Amplitude > More[F7]>Correction[F3]>
Correction[F2] to turn correction back off.
Delete Correction Set
Operation 1. Press Amplitude > More[F7]>Correction[F3]>
Correction Set[F1] and choose the correction set to delete.
Correction Set: 1~5
2. Press Delete Correction[F6]. The selected correction set will be deleted.
Save Correction Set to Memory
Operation 1. Press Save > Save To[F1] and choose the save location.
Location: Register, Local, USB, SD
2. Press Type[F2]> Correction[F5].
3. Press Data Source[F3] and choose a correction.
Correction Set: Correction 1~5
4. To name the file, press Name[F5]. Name the selected file using the F1~F7 keys, as shown below or use the numeric keypad to enter numbers.
7 8 9
654
1 2 3
/0

BASIC OPERATION
59
Limitations:
No spaces
Only 1~9, A~Z, a~z characters allowed
ABCDE
FGHIJ
KLMNO
PQRST
UVWXY
Z
A
C
D
E
B
Lowercase
Return
a
c
d
e
b
Return
Name>
Return
5. The filename appears on the bottom of the screen as it is created.
Filename
Press Enter to confirm the filename.
Note If the file name is not user-defined, a file name will be automatically created in the following format:
File name: type_data source_file number.file extension Example: Correction1_0.cor
The file number parameter is incremented each time the same file type is created.

GSP-9300 User Manual
60
6. Press Save Now[F7].
7. The correction set will be saved to the selected location. For more information on Save and Recall, please see page 258.
Recall Correction Set From Memory
Operation 1. Press Recall > Recall[F1] and choose the recall location:
Location: Register, Local, USB, SD
2. Press Type[F2]> Correction[F5].
3. Use the scroll wheel to select a previously saved correction set from the file directory.
4. Press Destination[F3] and choose a correction set.
Correction Set: Correction 1~5
5. Press Recall Now[F4].
6. The current correction set will be recalled from the selected location. For more information on Save and Recall, please see page 258.

BASIC OPERATION
61
Input Impedance
Description Sets the input impedance to 75Ω or 50Ω.
Operation 1. Press Amplitude > More[F7]> More[F7] > Input Z[F1] to toggle the input impedance.
Range: 75Ω, 50Ω
Input Impedance Calibration
Description When an external impedance converter module (optional accessory ADP-101) is used to convert the impedance of a device from 50Ω to 75Ω, some external loss can be induced. The Input Z Cal function can be used to compensate for these losses with an offset value.
Note The Input Z Cal function is only functional when the input impedance is set to 75Ω.
Operation 1. Press Amplitude > More[F7]>More[F7]>Input Z
Cal[F2] and set the impedance offset.
Range: Resolution:
0dB to +10dB 1dB
Display Icon
The AMP icon is displayed at the bottom
of the screen when Input Z Cal0dB and Input Z is = 75Ω.

GSP-9300 User Manual
62
Using the Built-in Pre-Amplifier
Description The built-in pre-amplifier boosts weak input signals, such as EMI testing signals, to levels that are easy to handle, over the entire frequency range. The built-in pre-amplifier on the GSP-9300 has a nominal gain of 20dB. In the Auto setting, the pre-amplifier will be automatically turned on when the reference level is less than -30dBm. When the reference level is greater than -30dBm, the pre-amplifier is turned off. The bypass setting turns the pre-amplifier off.
Operation 1. Press Amplitude > More[F7]>Preamp[F5] to toggle the Preamp state.
Range: Auto, Bypass
Display Icon
The Pr-amp icon indicates that the pre amplifier is on.
Example:
Pr-amp icon

BASIC OPERATION
63
Note When the pre-amplifier is on, the attenuator becomes fixed at 0dB (i.e. Attenuation = 0dB).

GSP-9300 User Manual
64
Autoset The Autoset function searches the peak signals in two stages (full span & 0Hz - 100MHz limited span), picks the signal peak with the maximum amplitude, and then shows it in the display.
Using Autoset
Operation 1. Press Autoset > Autoset[F1].
Autoset Range Amplitude: Span:
-80dBm ~ +20dBm 0Hz ~ 3GHz
Example:
Before Autoset, preset state
After Autoset

BASIC OPERATION
65
Note RBW, VBW and sweep settings are reset to Auto when the Autoset function is used.
Limiting the Autoset Vertical Search Range
Description You can set the amplitude floor so that the signals lower than the setting will be ignored by the Autoset search.
Operation 1. Press Autoset > Amp.Floor[F2] and switch the range from Auto to Man.
2. Enter the amplitude limit and unit for the Autoset search.
Range: −60 to +20dBm
Note See page 50 for setting the amplitude units.
Limiting the Autoset Horizontal Search Range
Description You can change the frequency span limit in the display to get a better view of the Autoset result. By default, the frequency span after Autoset is set at 3MHz.
Operation 1. Press Autoset > Span[F3] and switch the range from Auto to Man.
2. Enter the span frequency for the Autoset search.
Manual Range: 100Hz to 3GHz

GSP-9300 User Manual
66
Bandwidth/Average Settings BW/AVG key sets the resolution bandwidth (RBW), video bandwidth (VBW) and averaging functions. The resolution, sweep time, and averaging are in a trade-off relationship, so configuration should be done with care.
Resolution Bandwidth Setting (RBW)
Description RBW (Resolution Bandwidth) defines the width of the IF (intermediate frequency) filter that is used to separate signal peaks from one another. The narrower the RBW, the greater the capability to separate signals at close frequencies. But it also makes the sweep time longer under specific frequency spans (the display is updated less frequently).
SPAN-RBW Auto relationship
When the RBW is set to Auto, the RBW is determined by the frequency span. This is shown in the table below.
SPAN-RBW relationship in Auto mode.
Span (Hz) ≤ RBW (Hz) Span (Hz) ≤ RBW (Hz)
200 1 650k 3000
650 3 2M 10000
2k 10 6.5M 30000
6.5k 30 20M 100000
20k 100 65M 300000
200k 1000 200M 1000000

BASIC OPERATION
67
Operation 1. Press BW/Avg > RBW[F1] and set the RBW to Auto or Man.
2. Set the resolution bandwidth and unit for Man mode.
Mode: Frequency Range(3dB): Frequency Range(6dB):
Auto, Man 1Hz~1MHz (1-3-10 step) 200Hz, 9kHz, 120kHz, 1MHz
Note If the setting is in Auto mode, using the scroll wheel or arrow keys will automatically set the RBW to manual mode.
Display Icon
The BW icon is displayed at the bottom of the screen when the RBW is in Man mode.
Note If the RBW settings have an asterisk (*), it indicates that the -6dB filters are used.

GSP-9300 User Manual
68
Video Bandwidth Settings (VBW)
Description VBW (Video Bandwidth) defines the smoothness of the trace on the display. Combined with RBW, VBW defines the ability to sort out the target signal from surrounding noise or adjacent peaks.
Operation 1. Press BW/Avg > VBW[F2] and set the VBW to Auto or Man.
2. Set the video bandwidth and unit for Man mode.
Mode: Frequency Range(3dB):
Auto, Man 1Hz~1MHz (1-3-10 step)
Display Icon
The BW icon is displayed at the bottom of the screen when the VBW is in Man mode.
VBW/RBW Ratio
Description The VBW/RBW function is used to view the ratio between the video bandwidth and the resolution bandwidth. The VBW/RBW ratio is altered by setting the RBW and or VBW settings, see page 66 & 68 respectively.
View VBW/RBW ratio
1. Press BW/Avg .
2. The ratio is displayed on the VBW/RBW[F3] soft key.

BASIC OPERATION
69
Display
VBW/RBWRatio
Tip Signals that are masked by the noise floor level should have a ratio of less than 1 to smooth the noise out. Signals with strong frequency components should use a ratio equal to or greater than 1.
Average Trace
Description The Average function averages the trace for a user-defined number of times before it is displayed. This feature smoothes the noise level, but has the drawback of slowing down the display update rate.
Operation 1. Press BW/Avg > Average[F4] and toggle Average on or off.
2. Set the number of averages.
Range: Default:
4 ~ 200 20
Display Icon
The AVG icon is displayed at the bottom of the screen when the Average function is on.

GSP-9300 User Manual
70
Example:
Average:Off
Number of traces that have been averaged
Average: On (20)

BASIC OPERATION
71
Average Type
Description The Average Type function determines how the GSP-9300 determines the average value.
LOG Average: Averages the trace points on a logarithmic scale.
Volt Average: Averages the amplitudes of the trace points on a linear voltage scale.
Power Average: Averages the trace points on a logarithmic scale in watts.
Operation 1. Press BW/Avg > Average Type[F5] and choose the average type.
Range: Default:
LOG Power, Volt Average, Power Average LOG Power

GSP-9300 User Manual
72
EMI Filter
Description The built-in EMI filter is used for specific measurement situations such as EMI average detection, where a higher level of sensitivity is required compared to the standard configuration. When turned on, the RBW is set to -6dB, indicated by an asterisk (*).
When any measurement functions are turned on (see page 123 for details), the EMI filter is automatically disabled. Conversely if the EMI filter is turned on, any measurement functions are turned off.
Operation 1. Press BW/Avg > EMI Filter[F6] and toggle EMI filter on or off.
Note See the specifications for details on the EMI filter, page 326.

BASIC OPERATION
73
Sweep The GSP-9300 has a number of sweep options including setting the sweep time, the sweep run mode(continuous, single) and sweep mode (fast, slow). The GSP-9300 also has gated sweep modes.
Sweep Time
Description Sweep time defines the length of time the system takes to "sweep” the current frequency span. Note, however, that sweep time and RBW/VBW are in a trade-off. Faster sweep times update the display more frequently but make RBW and VBW wider, reducing the capability to separate signals at close frequencies.
Operation 1. Press Sweep > Sweep Time[F1] and toggle the Sweep time to Auto or Man.
2. Set the sweep time for the Man mode.
Mode: Range: Resolution:
Auto, Man 1.14ms ~ 1000s (span=100Hz, RBW=3kHz) 46.6us ~ 1000s (span=0Hz, RBW= 1MHz)
Display Icon
The SWT icon will be displayed at the bottom of the screen when the sweep is in manual mode.

GSP-9300 User Manual
74
Single Sweep
Description The single sweep function is used to perform a single sweep. When Sweep Single is pressed the GSP-9300 will perform a single sweep and then stop.
Operation 1. Press Sweep > Sweep Single[F2] to put the spectrum analyzer into single sweep mode.
2. Press Sweep Single[F2] again to perform a single sweep.
When a single sweep has been performed, you can still perform frequency, span, amplitude and other functions on the “frozen” trace.
Display Icon
The Sweep Single icon is displayed on the right-hand side of the screen when the sweep is in single mode.
Note You must wait for the single sweep to finish before pressing the Single Sweep key again. If a setting is changed whilst the spectrum analyzer is still sweeping, the single sweep will immediately start over.

BASIC OPERATION
75
Continuous Sweep
Description The GSP-9300 has two main sweeping run modes: single and continuous. Use the continuous mode to have the sweep constantly updated.
Operation 1. Press Sweep > Sweep Cont[F3] to put the
spectrum analyzer into continuous sweep mode.
Display Icon
The Sweep Cont icon is displayed on the right-hand side of the screen when the sweep is in continuous mode.
Note The GSP-9300 will now continuously sweep unless the mode is changed to single sweep mode or if the system is waiting for a trigger condition.
Gated Sweep Overview
Description The Gated Sweep mode allows a trigger signal to dictate when the spectrum analyzer can sweep. This mode is useful for characterizing signals that are pulsed on and off, such as RF burst transmissions or for measuring spurious noise levels between transmission bursts.
Overview 1. The trigger signal must be synchronized to the period of the input signal (shown as RF burst below).
2. The start of the gate time is produced from the positive or negative edge of the trigger signal + the delay time.

GSP-9300 User Manual
76
3. The end of the gate time is determined by the set gate length.
4. The gated sweep should not be positioned at either end of the transmission.
Delay Length
Gate
Trigger
RF Burst
period
Example: The diagram above demonstrates the relationship between the input trigger, the input signal and the position of the gated sweep relative to the input signal.
Note Please take into consideration RBW settling time. Setting the delay time too short may not leave enough time for the RBW filter to resolve.

BASIC OPERATION
77
Using the Gated Sweep Mode
Connection 1. Connect a trigger signal (3.3v CMOS) to the GATE IN port on the rear panel.
Trigger
Note RBW must be equal to or greater than 10kHz for the gated sweep mode function to be available.
Operation 1. Press Sweep > GateDelay[F5] and set the gate delay time.
2. Press Sweep > Gated Length[F6] and set the gate time length.
3. Press Sweep > Gated Sweep[F4] and turn the mode on.
Gate Delay: Gate Length:
0s ~ 1000s 58us ~ 1000s
Display Icon
The Sweep Gated icon is displayed when Gated Sweep is turned on.

GSP-9300 User Manual
78
Example:
The example below shows the spectrum of an FSK modulated signal when gated sweep mode is off.
The example below shows the same signal with the gated sweep timed to sweep when only the desired frequency is output.
Gated sweep icon
Note Gate Delay and Gate Length must first be set before Gated Sweep is turned on.

BASIC OPERATION
79
Sweep Control / Sweep Mode
Description The Sweep Control function and the Sweep
Mode key SweepMode toggles the Sweep Mode from
Normal to Fast.
The Fast setting speeds up the signal processing and the display update rate to increase the overall sweep time. This mode is especially useful when the span is greater than 1MHz.
When set to Normal, signal processing and update rate is set to normal levels.
Operation 1. Press Sweep > Sweep Control [F7] to toggle the Sweep Mode between Norm. and Fast.
OR
2. Press SweepMode and toggle the Sweep Mode
between Norm. and Fast.
Display Icon
The Sweep icon is displayed on the right-hand side of the screen when the sweep is in either Fast or Normal mode.
Sweep Times Center Frequency = 1.5GHz Sweep Mode
Span(Hz) RBW (Hz) AUTO Norm. Fast 3G 1M 348ms 175ms 2G 1M 323ms 116ms 1G 1M 116ms 58.4ms 500M 1M 58ms 29.2ms 200M 1M 23.2ms 11.6ms 100M 1M 11.6ms 10ms 50M 300k 18.8ms 727us 20M 100k 35.9ms 593us 10M 100k 17.9ms 307us

GSP-9300 User Manual
80
5M 30k 42.2ms 655us 2M 10k 127ms 1.96ms 1M 10k 63.8ms 1.31ms 500k 3k 6.88ms 6.88ms 200k 1k 22.9ms 22.9ms 100k 1k 9.83ms 9.83ms 50k 300 76.4ms 76.4ms 20k 100 219ms 219ms 10k 100 109ms 109ms 5k 30 710ms 710ms 2k 10 1.98s 1.98s 1k 10 1.32s 1.32s 500 3 2.65s 2.65s 200 1 5.3s 5.3s 100 1 2.65s 2.65s

BASIC OPERATION
81
Trace The GSP-9300 is able to set the parameters of up to 4 different traces on the display at once. Each trace is represented by a different color and is updated with each sweep.
Selecting a Trace
Description Each trace (1, 2, 3, 4) is represented by a different color. When activated, an icon for each trace color and function is shown to the left of the display. When a trace is selected, parameters can be set/edited from the trace menu.
Trace Color: 1: Yellow 2: Pink 3: Blue 4: Orange
Trace Type The type of trace used determines how the trace data is stored or manipulated before being displayed. The analyzer updates each trace according to the type of trace used.
Clear and Write
The GSP-9300 continuously updates the display with each sweep.

GSP-9300 User Manual
82
Hold Max/ Hold Min
The maximum or minimum points are maintained for the selected trace. The trace points are updated each sweep if new maximum or minimum points are found. The Hold Max setting also has a threshold setting. This setting will ensure only those values above the threshold are kept.
View View will hold the selected trace and stop updating the trace data for the selected trace. Pressing View[F5] will display the trace data that was cleared using the Blank[F6] key.
Blank Clears the selected trace from the display and stores trace data. The trace can be restored by pressing View[F5].
Display Icon Example View
Hold Max
View
Blank
Trace 1
Trace 2
Trace 3
Trace 4
Operation 1. Press Trace > Trace[F1] and choose the trace number.
Trace: 1, 2, 3, 4

BASIC OPERATION
83
2. Select the trace type:
Clear & Write[F2] Max Hold[F3] Min Hold[F4] View[F5] Blank[F6]
3. If Max Hold[F3] was selected, set the threshold level.
Note Traces, 2, 3 and 4 are set to Blank by default.
Trace Math
Description Performs trace math from two traces (TR1, TR2) and stores the result in the currently selected trace. It also performs trace shift.
Math functions Power Diff Subtracts the TR1 amplitude data from the TR2 amplitude data. The TR1 data TR2 data are converted to watts. The result is converted back to dBm.
Log Diff Subtracts the TR1 amplitude data from the TR2 amplitude data and then adds a logarithmic reference. Both the TR1 and TR2 data is in dBm. The resultant trace of the subtraction is in dB. When the result is added to a logarithmic reference the resulting data is in dBm.

GSP-9300 User Manual
84
LOG Offset Adds a reference to the TR1 trace
Operation 1. Press Trace > More[F1]>Trace Math[F1].
2. Press TR1[F1] and select the first trace source:
TR1: Trace 1,2, 3, 4*
3. Press TR2[F2] and select the second trace source:
TR2: Trace 1, 2, 3, 4*
Note *You cannot select the current trace as the TR1 or TR2 trace sources. The current trace is designated
by pressing Trace > Select Trace>[F1].
4. Select the trace math function:
PowerDiff[F3] LogDiff[F4] LogOffset[F5]
5. If LogDiff was selected, set the reference level and unit.
LogDiff ref range: LogDiff ref units:
-120dBm ~ 30dBm dBm, W
6. If LogOffset was selected, set the offset level and unit.
LogOffset range: -50dB~+50dB
7. To turn trace math off, press the OFF[F6].

BASIC OPERATION
85
Display Icon
The Math icon is displayed when trace math is turned on.
Trace Detection Mode
Description Each time the spectrum analyzer samples data for each point on the trace, a number of samples are usually taken for each point, known as a sample bucket. The actual value of each point is determined by the detector from the samples in each bucket.
Each selected trace, (1, 2, 3, 4), can use a different detection mode.
Detection modes Auto Automatically chooses an appropriate mode based on the values of all the samples.
Normal While the signal level is constantly increasing or decreasing, the positive peaks are detected. Otherwise, the detection mode switches between positive peak and negative peaks. Useful for picking up burst phenomenon while avoiding excessive noise.
Peak+ Detects positive peak signals by selecting the maximum peak value for each point from each bucket. This mode is useful for sinusoidal signals.

GSP-9300 User Manual
86
Peak- Detects negative peak signals by selecting the lowest peak value for each point from each bucket. This mode is not recommended for amplitude measurement.
Sample Randomly selects a value from the bucket sample. Useful for noise signals.
Average Calculates the average of all the samples in the sample bucket.
BASIC OPERATION
87
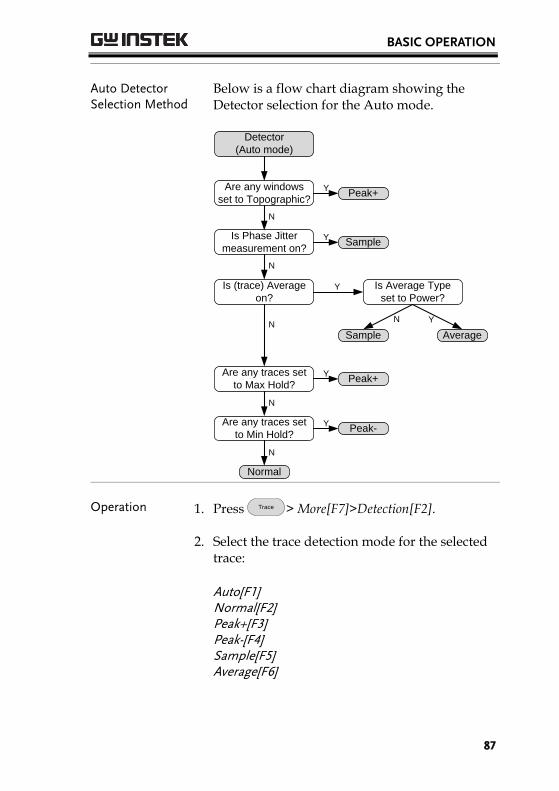
Auto Detector Selection Method
Below is a flow chart diagram showing the Detector selection for the Auto mode.
Is (trace) Average on?
Are any traces set to Max Hold?
Are any traces set to Min Hold?
Is Average Type set to Power?
AverageSample
Peak+
Peak-
Normal
Y
N
Y
N
Y
N
N Y
Is Phase Jitter measurement on? SampleY
N
Are any windows set to Topographic? Peak+Y
N
Detector (Auto mode)
Operation 1. Press Trace > More[F7]>Detection[F2].
2. Select the trace detection mode for the selected trace:
Auto[F1] Normal[F2] Peak+[F3] Peak-[F4] Sample[F5] Average[F6]

GSP-9300 User Manual
88
3. The display will return to the Trace menu.
Display Icon
Normal
Average icon
Peak+ icon
Peak - icon
Sample icon

BASIC OPERATION
89
Trigger The Trigger function sets the signal conditions upon which the spectrum analyzer triggers captured waveforms, including frequency, amplitude, and delay. An external trigger signal, instead of the default internal signal, may be used as required for special conditions. The sections below can be used to skip to the relevant section:
Free Run Mode → from page 89
Activate Video Trigger → from page 89
Activate External Trigger → from page 91
Selecting Trigger Mode → from page 92
Set the Trigger Delay Time → page 93
Selecting a Trigger Type
Free Run Mode
Description In free run mode all signals are captured and the trigger conditions are not used.
Free Run Mode 1. Press Trigger > Free Run[F1] to run in free mode.
Activate Video Trigger
Description Sets the video trigger level for video signals. When the video signal voltage level exceeds* the video trigger level, a trigger signal will be generated. *for positive video edge

GSP-9300 User Manual
90
Parameters Video Edge: Determines the polarity of the video trigger. Positive: The signal voltage exceeds the video level at the trigger frequency. Negative: The signal voltage is lower than the video level at the trigger frequency.
Video Level: The trigger voltage level.
Trigger Frequency:
Sets the frequency to start triggering
Operation 1. Press Trigger >Trigger Condition[F2]>Video[F1]
2. Press Video Edge[F1] and choose the edge.
Range: Positive, Negative
3. Press Video Level[F2] and set the video voltage trigger level.
Trigger level: (-120dBm to +30dBm) +Ref Level Offset
4. Press Trigger Freq[F3] and choose the frequency at which the spectrum analyzer will check the triggering conditions.
Frequency: 0-3GHz+frequency offset
Display Icon
The Video Level trigger icon is displayed when the Video trigger is activated.

BASIC OPERATION
91
Note Set the trigger back to Free Run to disable the video trigger.
Activate External Trigger
Description The external trigger is used when an external trigger signal is input into the rear panel TRIG IN port. The external trigger signal can be configured as positive or negative edge.
Trigger: 3.3V, CMOS
Operation 1. Press Trigger >Trigger Condition[F2]>Ext.Edge[F2] and select the trigger edge:
Pos: Neg:
Positive edge Negative edge
2. Connect the external trigger signal to the rear panel TRIG IN port.
Trigger
3. Press Action Now[F5] to activate the external trigger.
4. The system will now wait for the trigger conditions to be matched before starting a sweep.
Display Icon
The EXT Trigger icon is displayed when the external trigger is activated.

GSP-9300 User Manual
92
Note The trigger will revert back to the Free Run mode if any parameter settings are changed, such as the span or amplitude settings.
Selecting the Trigger Mode
Description In free run mode all signals are captured and the trigger conditions are not used.
Modes Normal: The spectrum analyzer captures every signal that meets the trigger conditions.
Single: The spectrum analyzer captures the first signal that meets the trigger conditions.
Continuous: The spectrum analyzer captures the first signal that meets the trigger conditions then switches to free run mode thereafter.
Operation 1. Press Trigger > Trigger Mode[F3] to toggle the trigger mode:
Nor.: Sgl.: Cont.:
Normal Single Continuous
2. Press Action Now[F5] to manually start triggering.
Display Icons Normal: Single: Continuous

BASIC OPERATION
93
Set the Trigger Delay Time
Description Sets the delay time between when the analyzer triggers and when the analyzer begins to capture the signal.
Delay time range: 1ns to 1ks
Operation 1. Press Trigger >Trigger Delay[F4] and set the trigger delay time.
Delay range: 0~1000s
GSP-9300 User Manual
94
Marker A Marker shows the frequency and amplitude of a waveform point. The GSP-9300 can activate up to 6 markers or marker pairs simultaneously as well as up to 10 peak markers in the marker table.
The marker table helps editing and viewing multiple markers in a single display.
A delta marker shows the frequency and amplitude difference from a reference marker.
The GSP-9300 can automatically move a marker to various locations including the peak signal, center frequency, and start/stop frequency. Other marker operations regarding signal peaks are available in the Peak Search function.
Activating a Marker → from page 95
Move Marker Manually → from page 96
Move Marker to Preset Locations → from page 96
Activate Delta Marker → from page 97
Move Delta Marker(s)Manually → from page 98
Marker Functions → from page 99
Move Marker to Trace → from page 101
Show Markers in Table → from page 102
Peak Search → from page 103
Peak Configuration → from page 105
Peak Table → from page 106
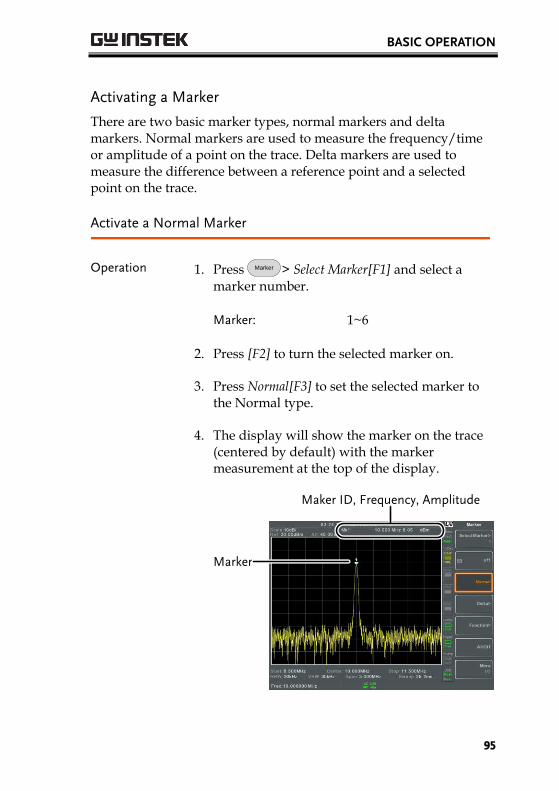
BASIC OPERATION
95
Activating a Marker
There are two basic marker types, normal markers and delta markers. Normal markers are used to measure the frequency/time or amplitude of a point on the trace. Delta markers are used to measure the difference between a reference point and a selected point on the trace.
Activate a Normal Marker
Operation 1. Press Marker > Select Marker[F1] and select a marker number.
Marker: 1~6
2. Press [F2] to turn the selected marker on.
3. Press Normal[F3] to set the selected marker to the Normal type.
4. The display will show the marker on the trace (centered by default) with the marker measurement at the top of the display.
Marker
Maker ID, Frequency, Amplitude
GSP-9300 User Manual
96
Move Marker Manually
Operation 1. Press Marker > Select Marker[F1] and select a marker number.
2. Use the left/right arrow keys to move the marker one grid division.
3. Use the scroll wheel to move the marker in fine increments.
4. Alternatively, the numeric keypad in combination with the F1~ F7 keys can be used to directly enter the frequency of the marker position.
7 8 9
654
1 2 3
/0
Move Marker to Preset Locations
Description The Marker key is used to move the selected marker to a number of preset positions.
Functions Mkr>Center: Mkr>Start: Mkr>Stop: Mkr>CF Step: Mkr>Ref Lvl:
Move to center frequency. Move to start frequency. Move to stop frequency. Move to step frequency. Move to reference level amplitude.
Note When the Marker key is used, the span and other settings may be automatically changed.
BASIC OPERATION
97
Operation 1. Press Marker > Select Marker[F1] and select a marker number.
2. Press Marker and select a marker position:
Mkr>Center[F1] Mkr>Start [F2] Mkr>Stop[F3] Mkr>CF Step[F4] Mkr>Ref Lvl[F5]
Activate Delta Marker
Description Delta markers are marker pairs that measure the difference in frequency/time and amplitude between a reference marker and a delta marker.
When delta markers are activated, the reference and delta marker appear at the position of the selected marker, or in the center of the display if the selected marker has not yet be activated.
The marker measurement is located at the top of the display, under the “normal marker” measurement.
Delta Markers Ref: Reference marker, designated as 1 .
Delta: Delta marker, designated as Δ1.
Operation 1. Press Marker > Select Marker[F1] and select a marker number.
2. Press [F2] to turn the selected marker on.
3. Press Delta[F4]>Delta[F1] to set the selected marker to the Delta type.

GSP-9300 User Manual
98
Move Delta Marker(s)Manually
Move Delta or Reference Marker
1. Press Marker > Delta[F4]> MoveRef[F2] to move the reference marker.
2. Press Marker > Delta[F4]> MoveDelta[F3] to move the Delta marker.
3. Move the selected marker in the same fashion as a normal marker, see page 96
Move Both reference and delta marker
1. Press either Move Pair Span[F4] or Move Pair Center[F5] to move both markers at the same time.
Move Pair Span: Sets the frequency span between both markers. The span can be positive or negative:
1+span
Δ1
Δ1
-span1
Move Pair Center: Moves both markers at the same time, keeping the span between both markers even throughout.
2. Move both markers in the same fashion as a normal marker, see page 96
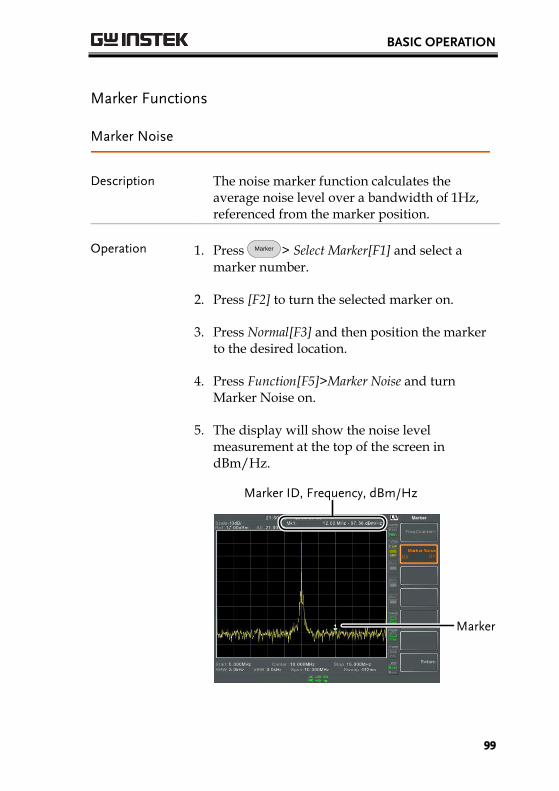
BASIC OPERATION
99
Marker Functions
Marker Noise
Description The noise marker function calculates the average noise level over a bandwidth of 1Hz, referenced from the marker position.
Operation 1. Press Marker > Select Marker[F1] and select a marker number.
2. Press [F2] to turn the selected marker on.
3. Press Normal[F3] and then position the marker to the desired location.
4. Press Function[F5]>Marker Noise and turn Marker Noise on.
5. The display will show the noise level measurement at the top of the screen in dBm/Hz.
Marker ID, Frequency, dBm/Hz
Marker

GSP-9300 User Manual
100
Frequency Counter
Description The frequency counter function is used to make accurate frequency measurements.
Operation 1. Press Marker > Select Marker[F1] and select a marker number.
2. Press [F2] to turn the selected marker on.
3. Press Normal[F3] and then position the marker to the desired location.
4. Press Function[F5]>Frequency Counter[F1] and turn the counter function on.
5. Press Resolution[F2] and set the resolution:
Auto: Automatically chooses the best resolution.
Man: Allows the resolution to be manually set.
Man Range: 1Hz, 10Hz, 100Hz, 1kHz
6. The display will show the frequency measurement at the top of the screen at the selected resolution.
Frequency
Marker

BASIC OPERATION
101
Move Marker to Trace
Description The Marker Trace function moves the selected marker to any of the currently active traces.
Operation 1. Press Marker > Select Marker[F1] and select a marker number.
2. Press [F2] to turn the selected marker on.
3. Press More[F7]>Marker Trace[F1] and choose a trace to move the current marker to. Only active traces can be selected.
Auto[F1] Trace1[F2] Trace2[F3] Trace3[F4] Trace4[F5]
4. In the example below, marker 1 is set to Trace1 and marker 2 is set to Trace2.
Marker 1, Trace 1
Marker 2, Trace 2

GSP-9300 User Manual
102
Show Markers in Table
Description The GSP-9300 has a Marker Table function to show all the active markers and measurements at once.
Operation 1. Press Marker > More[F7]>Marker Table[F2] and turn the marker table on.
2. The display will split into two screens. The bottom half will show the Marker Table with the marker ID(normal, reference or delta), trace, x-axis position (frequency/time) and the amplitude of the marker.
Marker Table
BASIC OPERATION
103
Peak Search
Move Marker to Peak
Description The Peak
Search key is used to find trace peaks.
Operation 1. Press Marker > Select Marker[F1] and select a marker number.
2. Press Peak
Search >Peak Search[F1]. The marker will move to the highest signal peak.
3. To continually search for the peak on each
sweep, press, Peak
Search >More [F7]>Peak Track[F1] and set Peak Track to on.
Move Marker and Peak to Center
Description The Center function moves the marker to the highest signal peak and moves the center frequency to that peak. This function can be used with the Next Peak, Next Peak Right, Next Peak Left and Min Search peak functions, see the Search for Peaks section on page 104 for details.
Operation 1. Press Marker > Select Marker[F1] and select a marker number.
2. Press Peak
Search >Mkr>Center[F2].
Note The span will not be changed.

GSP-9300 User Manual
104
Search for Peaks
Description The Peak
Search key can be used to search for a number of different peaks.
Peak Search Next Peak: Searches for next highest peak visible on the display.
Next Peak Right: Searches for the next peak to the right of the marker.
Next Peak Left: Searches for the next peak to the left of the marker.
Min Search: Searches for the lowest peak.
Operation 1. Press Marker > Select Marker[F1] and select a marker number.
2. Press Peak
Search and select the type of peak you wish to find.
Example: Next Peak
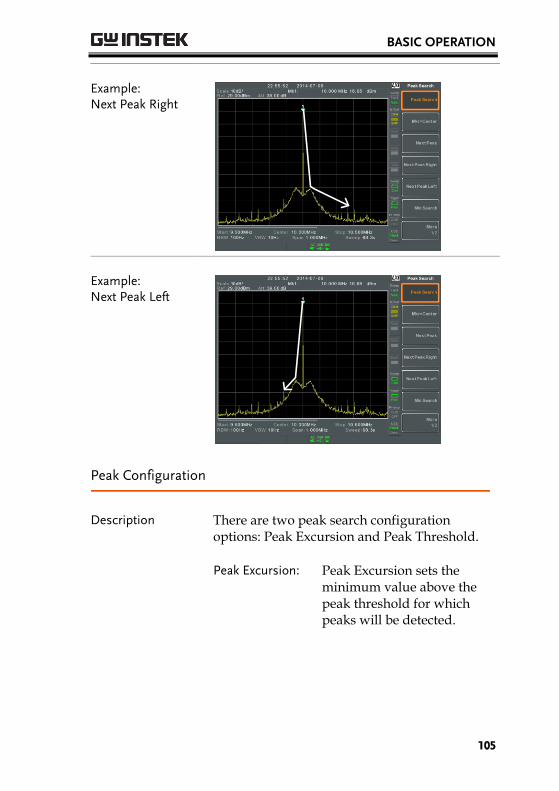
BASIC OPERATION
105
Example: Next Peak Right
Example: Next Peak Left
Peak Configuration
Description There are two peak search configuration options: Peak Excursion and Peak Threshold.
Peak Excursion: Peak Excursion sets the minimum value above the peak threshold for which peaks will be detected.

GSP-9300 User Manual
106
Peak Threshold: Peak threshold sets the minimum threshold level for the analyzer to detect peaks. Any value above the Peak Threshold + Peak Excursion will be detected as a peak.
Peak ThresholdPeak Excursion
1 Peak detection area
Operation 1. Press Peak
Search >More [F7].
2. Press Peak Excursion[F2] to set the excursion level.
3. Press Peak Threshold[F3] to set the peak threshold.
Peak Excursion: 0~100dB
Peak Threshold: -120dB~+30dB
Peak Table
Description The Peak Table function will display all peaks (up to 10) that meet the peak configuration settings. The amplitude and frequency for each peak is listed.
Operation 1. Press Peak
Search >More[F7]>Peak Table[F5].
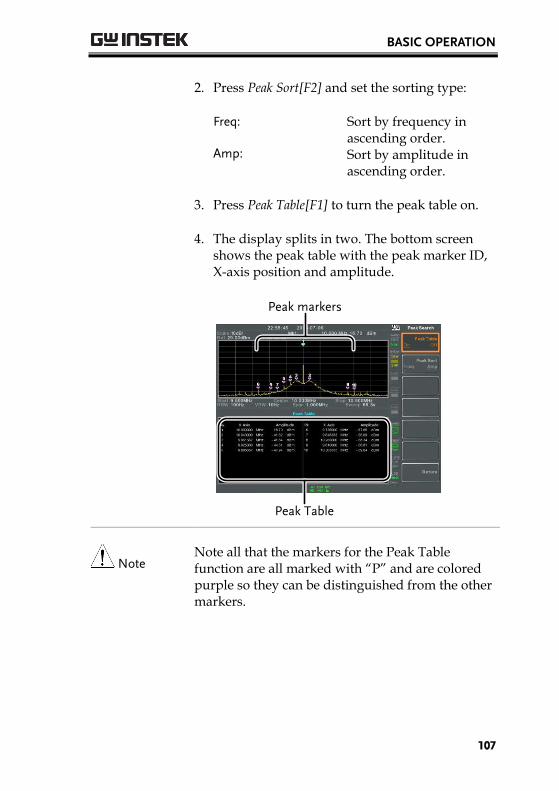
BASIC OPERATION
107
2. Press Peak Sort[F2] and set the sorting type:
Freq: Amp:
Sort by frequency in ascending order. Sort by amplitude in ascending order.
3. Press Peak Table[F1] to turn the peak table on.
4. The display splits in two. The bottom screen shows the peak table with the peak marker ID, X-axis position and amplitude.
Peak Table
Peak markers
Note Note all that the markers for the Peak Table function are all marked with “P” and are colored purple so they can be distinguished from the other markers.

GSP-9300 User Manual
108
Display The Display key configures the basic display settings as well as setting up the display mode (spectrum, spectrographic, topographic) and the split screen modes.
Adjusting the LCD Brightness
Description The LCD brightness levels can be adjusted to three pre-set levels.
Operation 1. Press Display > LCD Brightness[F2] to toggle the display brightness:
Hi: Mid: Lo:
High brightness Medium brightness Low brightness
Turning the LCD Backlight Off
Description The LCD backlight can be turned off to preserve power or to prolong the lifetime of the LCD display when not in use.
Operation 1. Press Display > LCD Backlight[F3] and turn the LCD backlight off.
2. When the backlight is off, press any function key to turn the LCD backlight back on.

BASIC OPERATION
109
Setting a Display Line (Reference Level Line)
Description The Display Line function is used to super-impose a reference level line over the traces.
Operation 1. Press Display > Display Line[F4] to turn the display line on.
2. Set the display line level and unit.
Example:
Display line
Display line set at -50dBm
Using the Video Out Port
Description The GSP-9300 has a dedicated DVI terminal to output the display to an external monitor. The video output is always on.
Output resolution 800 x 600 (fixed)
Operation 1. Connect an external monitor to the rear panel DVI terminal.

GSP-9300 User Manual
110
Setting the Display Mode
Description The GSP-9300 has three different display modes for viewing: spectrum, spectrograph and topographic. It is also possible to view the spectrum with the spectrographic or topographic views using a split screen.
Spectrum Default display mode.
Spectrogram Useful for viewing frequency or power in the time domain.
Topographic Useful for observing the frequency of events with a trace.
Operation 1. Press Display >Window Setup[F1] and select the display mode:
Spectrum[F1]: Spectrogram[F3]: Topographic[F4]: Spectrogram+Spectrum[F5]: Topographic+Spectrum[F6]:
Note The same trace is used on the top and bottom for the Spectrogram+Spectrum and Topographic+Spectrum modes.

BASIC OPERATION
111
Example: Spectrogram
The Spectrogram view shows signals in both the frequency and time domain. The X-axis represents frequency, the Y-axis represents time and the color of each point represents the amplitude at a particular frequency & time (Red = high dark blue = low). Each new trace is shown at the bottom of the display and older traces are pushed up toward the top of the display until they are removed.

GSP-9300 User Manual
112
Topographic
The topographic view shows the frequency of events. The topographic view is useful for observing smaller signals that have been overpowered by stronger signals or to easily observe intermittent events. Color is used to represent the frequency of an event. Red represents a high frequency of occurrence, while blue represents events that occur rarely.
Spectrogram +Spectrum
Displays both spectrographic and spectrum views of the signal.

BASIC OPERATION
113
Topographic +Spectrum
Displays both topographic and spectrum views of the signal.
Spectrogram and Topographic Markers
Description The Spectrogram and Topographic display view can also use markers and delta markers to mark the frequency and amplitude of points of interest. This function is particularly useful as it allows you to make delta measurements both in the frequency and time domain.

GSP-9300 User Manual
114
Operation 1. When in the Topographic view (single or split screen), press Topographic Marker and turn on.
2. When in the Spectrographic view (single or split screen), press Spectrogram Marker and turn on.
3. To set the reference marker, press Ref.[F2]>X Axis[F1] and set x-axis position (frequency).
4. Press Y Axis[F2] and the set the y-axis position (amplitude).
The frequency and amplitude information will be displayed on the remaining function keys:
Frequency[F3] Marker frequency
Amplitude[F4] Marker Amplitude.
Time[F4] Time relative to the start of the sweep.
5. To set the delta marker, press Return[F7] >Delta[F3]>X Axis[F1] and set the x-axis position of the delta marker (frequency).
6. Press Y Axis[F2] to set the y-axis position of the delta marker (amplitude).
The frequency and amplitude delta will be displayed on the remaining function keys:
ΔFrequency[F3] Position of the delta marker.
ΔAmplitude[F4] Amplitude of the delta marker.
ΔTime[F4] Time delta
1/ΔTime[F5] Frequency delta

BASIC OPERATION
115
Example Reference Marker
Ref. marker and Delta marker positions/measurements
Delta marker
Spectrogram view is shown as an example.
Split Spectrum View
Description The split spectrum view is able to view two different sweep ranges on the display at the same time using a split screen view. The top and bottom view can have independent sweep ranges, amplitudes, spans and other settings. However only one split screen (top or bottom) can be swept each time.

GSP-9300 User Manual
116
Operation 7. Press Display >Window Setup[F1]>Split
Spectrum[F2]>Active Win[F1] to activate the upper split screen.
8. Pressing Active Win.[F1] will toggle the sweep between the upper and lower screen.
9. Press Alternate Sweep[F2] for the analyzer to alternate the sweep between the upper and lower screen at the end of each sweep.
Note No operations can be performed in alternate sweep mode.
After exiting the split spectrum view, the analyzer will use the settings from the active window. The settings for the inactive screen will be retained for the next time that split spectrum view is used.
Example:

BASIC OPERATION
117
System Settings
System Information
Description The System Information displays the following:
Serial Number
Installed Options
Version: Calibration Date: Software LOI Firmware RF File sys TG RF DNS Hostname TG MAC Address DSP LXI Password Wordlist Core
Operation 1. Press System >System Information[F1] to bring up a list of the system information.
Error Messages
Description You can view error messages that are in the error queue by message number, description and time. All errors from the system error queue are logged when operating the analyzer. For a list of the error messages, please see the programming manual.
Operation 1. Press System >Error message[F2] to bring up the error message table.
2. Press Prev Page[F2] and Next Page[F3] to navigate through each page of the error list.

GSP-9300 User Manual
118
3. Press Clear Error Queue[F6] to clear the error messages from the list.
Set the System Language
Description The GSP-9300 supports a number of languages. The system language sets the soft menu keys to the selected language.
Operation 1. Press System >Language[F3] and choose the system language.
Set the Date and Time
Operation 1. Press System >Date/Time[F4].
2. Press Set Date[F1] to set the date:
Year[F1] Sets the year.
Month[F2] Sets the month.
Day[F3] Sets the day.
3. Press Set Time[F2] to set the system time:
Hour[F1] Sets the hour (24hr).
Minute[F2] Sets the minute.
Second[F3] Sets the second.
4. The system time and date will be shown at the top of the display.
Time, Date

BASIC OPERATION
119
Display the Date and Time on the Screen
Description Enables or disables the date and time on the screen.
Operation 1. Press System >Date/Time[F4]>Clock[F4] and turn the clock display on or off.
Using the Wake-Up Clock
Description The GSP-9300 has a wake-up clock to allow the spectrum analyzer to automatically turn on at a set time.
Operation 1. Press System >Date/Time[F4]>Wake-Up Clock[F3] and set the following parameters:
Select Clock[F1] Choose a wake-up clock (1~7).
State[F2] Turns the selected clock on/off.
Hour[F3] Set the wake-up hour
Minute [F4] Set the wake-up minute.
Repeat Single[F5] Set the wake-up clock to repeat or single.
Note Only single days can be configured for the wake-up clock.

GSP-9300 User Manual
120
Alarm Output
Description Allows the pass/fail output to be output via the ALARM OUT port.
Output: Open collector
Vo
RAlarm Out
BNC
+V
Operation 1. Press System >Alarm Output[F6] and toggle the ALARM OUT port on or off.

BASIC OPERATION
121
Preset The Preset function loads either factory default states or the user-defined states – depending on the Preset configuration settings.
Using the Preset Key → from page 121
Save the User Preset Settings→ from page 121
Preset Type Settings→ from page 122
Power on Preset Settings → from page 122
Using the Preset Key
Description The Preset key loads the factory default state or
user-defined preset settings. See the Preset Type Settings on page 121 to set the type of preset settings that are loaded.
Factory Preset The factory default settings are listed on page 285
Operation Press Preset to load the preset settings.
Save the User Preset Settings
Description The user-defined preset settings can be created by saving the current state as the user-defined preset settings.
Operation Press System >Pwr On/Preset[F5]>Save User
Preset[F3] to save the current state as the User Preset settings.

GSP-9300 User Manual
122
Preset Type Settings
Description Each time the Preset key is pressed, a set of
preset configuration settings are loaded. The preset configuration settings can be either the factory default settings or the user-defined settings.
Operation 1. Press System >Pwr On/Preset[F5]>Preset Type[2] and choose the preset type:
User Preset[F1]
Factory Preset[F2]
Power on Preset Settings
Description When the spectrum analyzer is turned on, either the preset configuration settings are loaded (default) or the configuration settings that were used before the instrument was turned off.
Operation 1. Press System >Pwr On/Preset[F5]>Power On[F1] and choose the power on settings:
Power On: Last, Preset
Note See Preset Type Settings on page 285 for details on the preset conditions.
The last preset conditions cannot be loaded if the instrument was not powered down correctly the last time it was used. Please see page 29 for details.

ADVANCED OPERATION
123
ADVANCED OPERATION
Measurement ................................................................. 125 Channel Analysis Overview .................................................................................. 125
ACPR ......................................................................................................... 127 OCBW ....................................................................................................... 130
AM/FM Analysis ................................................................................................... 132 AM Analysis .............................................................................................. 132 AM Pass Fail Testing ............................................................................... 136 FM Analysis ............................................................................................... 138 FM Pass Fail Testing ................................................................................ 141 AM/FM Demodulation .......................................................................... 143
2FSK Measurement ............................................................................................... 144 2FSK Pass Fail Testing ............................................................................ 158
Phase Jitter Measurement ..................................................................................... 160 Spectrum Emission Mask Overview ................................................................... 162 Spectrum Emission Mask Testing ....................................................................... 175 Third Order Intermodulation Distortion (TOI) ................................................ 182 CNR/CSO/CTB Measurement .......................................................................... 184
Carrier to Noise Ratio (CNR) ................................................................. 184 Composite Second Order (CSO) ........................................................... 188 Composite Triple Beat (CTB) ................................................................. 189
Harmonic Measurements ...................................................................................... 192 N dB Bandwidth .................................................................................................... 194 P1dB Measurement ............................................................................................... 196 P1dB Normalization .............................................................................................. 199
EMC Pre-Compliance Testing .......................................... 202 EMI Test ................................................................................................................. 203 Near Field Testing ~ EMI M Probe ................................................................... 209 Near Field Testing ~ EMI E Probe .................................................................... 212 Voltage Probe ......................................................................................................... 215 EMS Test ................................................................................................................ 218
Limit Line Testing ........................................................... 220

GSP-9300 User Manual
124
Creating a Limit (Point by Point) ........................................................................ 220 Creating a Limit (from Trace Data) ..................................................................... 222 Creating a Limit (from marker data) ................................................................... 223
Delete Limit Line ..................................................................................... 224 Pass Fail Testing ....................................................................................... 225
Sequence ....................................................................... 227 Editing a Sequence ................................................................................... 227 Running a Sequence ................................................................................. 231
ADVANCED OPERATION
125
Measurement This section describes how to use the automatic measurement modes. The GSP-9300 includes the following measurements:
ACPR → from page 127
OCBW → from page 130
AM Analysis→ from page 132
FM Analysis → from page 138
AM/FM Demodulation → from page 143
ASK Measurement → from page 144
FSK Measurement → from page 150
2FSK Measurement → from page 156
Phase Jitter→ page 160
SEM measurement → from page 162
TOI measurement → from page 182
CNR/CSO/CTB measurement → from page 184
Harmonic Measurement → from page 192
N dB measurement → from page 194
P1dB Measurement → from page 196
Channel Analysis Overview
Description Channel analysis measurement includes ACPR (adjacent channel power) and OCBW (occupied bandwidth) measurements.

GSP-9300 User Manual
126
Parameters Channel bandwidth The frequency bandwidth the target channel occupies. Range: Between 0Hz~3GHz (0Hz excepted)
Channel Space The frequency distance between each main channel. Range: Between 0Hz~3GHz
Adjacent channel bandwidth 1 & 2
The frequency bandwidth the adjacent channels occupy.
Range: Between 0Hz~3GHz (0Hz excepted)
Adjacent channel offset 1 ~ 3
The frequency distance between the adjacent channels and main channel. Range: 1 Between 0Hz~3GHz (0Hz excepted)
OCBW% The ratio of occupied bandwidth to the amount of power consumed. Range: 0% to 100%, 0.1% resolution.

ADVANCED OPERATION
127
ACPR
Description Adjacent channel power refers to the amount of power leaked to the adjacent channel from the main channel. This measurement is a ratio of the main channel power to power in the adjacent channel.
Example
Main CHBW
ADJCH1
ADJCH2
ADJCH3
ADJCH1
ADJCH2
ADJCH3
Offset 1Offset 2Offset 3
Channel spacingTo next main
channel
Operation: Setting up the main channel
1. Press Measure > Channel Analysis[F1]>ACPR[F2] and turn ACPR on.
Any other measurement mode will automatically be disabled.
2. The display splits into two screens. The top screen shows the main channel, adjacent channels and their corresponding limits. The bottom screen shows the ACPR measurement results in real time.

GSP-9300 User Manual
128
ADJCH2
Channel power results
ADJCH3
ADJCH1Main CH
3. Press Measure > Channel Analysis[F1]>ACPR Setup[F1]> and set the following:
Main CHBW[F1] Set the bandwidth of the main channel.
Main CH H Limit[F2] Set the low limit for the main channel.
Main CH Limit[F3] Set the high limit for the main channel
CH SPC[F4] Specify the channel spacing
Operation: Setting up the adjacent channel(s)
1. Press ADJCH Setup[F5] to setup the adjacent channels:
Select AdjCh[F1] Choose an adjacent channel number: 1, 2, 3
[F2] Toggle the selected channel on/off.
ADJCHBW[F3] Choose the bandwidth of the selected channel.
ADVANCED OPERATION
129
ADJCH Offset[F4] Set the adjacent channel offset.
ADJCH HLimit[F5] Set the adjacent channel high limit.
ADJCH LLimit[F5] Set the adjacent channel low limit.
2. Repeat the above steps for the other adjacent channels, if needed.
Move Channels Up/Down
1. Press Measure > Channel Analysis[F1] and press the following to move to another channel:
Channel Move Up[F5] Next main channel.
Channel Move Down[F6]
Previous main channel.
Note The channel space (CH SPC) parameter determines where the next main channel is located.
Remove Definitions Help
1. Press Measure > Channel Analysis[F1]>ACPR
Setup[F1]>Def. Help to toggle the Definitions Help on or off.

GSP-9300 User Manual
130
OCBW
Description Occupied bandwidth measurements are used to measure the power of the occupied channel as a percentage to the power of the channel.
Example
CH BW
OCBW
Operation: Setting up the main channel
1. Press Measure > Channel Analysis[F1]>OCBW[F4] and turn OCBW on.
Any other measurement mode will automatically be disabled.
2. The display splits into two screens. The top shows the channel bandwidth. The bottom screen shows the OCBW measurement results in real time.

ADVANCED OPERATION
131
Channel power and total power results
CH BW
3. Press OCBW Setup[F3] to enter the OCBW setup:
CHBW[F1] Set the channel bandwidth.
CH SPC[F2] Set the channel space between main channels.
OCBW%[F3] Set the % of the OCBW to CHBW.
Move Channels Up/Down
1. Press Measure > Channel Analysis[F1] and select:
Channel Move Up[F5] Next main channel.
Channel Move Down[F6]
Previous main channel.
Note The channel space (CH SPC) parameter determines where the next main channel is located.
The CH SPC parameters from the ACPR and OCBW setups are independent.

GSP-9300 User Manual
132
AM/FM Analysis
AM Analysis
Description When amplitude modulation is turned on, the input signal is centered on the center frequency and the span is automatically set to zero-span.
Measurement items
AM Depth: Current, Min, Max
Mod. Rate: Current, Min, Max
Carrier Pwr: Current, Min, Max
Carrier Freq Offset: Current, Min, Max
SINAD: Current, Min, Max
Operation: configuration
1. Set the center frequency to the carrier frequency (page 41).
2. Press Measure > Demod[F2]>AM Analysis[F1]>AM
Analysis[F1] and turn AM analysis on.
Any other measurement mode will automatically be disabled.
3. The display splits into two screens. The top shows the AM waveform in the time domain. The bottom screen shows the AM measurement.

ADVANCED OPERATION
133
AM modulationmeasurements
AM waveform
4. Press Setup[F2]>IF Bandwidth[F1] and set the Intermediate frequency bandwidth.
Set with adequate bandwidth to accommodate spectrum contained in the carrier.
5. Press LPF[F2] to set the low pass filter frequency, alternatively the frequency can be set to bypass:
AM Signal Frequency (Hz)
Selectable bandwidth of LPF (Hz) ≥78,125 156,250 78,125 52,083 39,063 31,250 ≥39,063 78,125 39,063 26,042 19,531 15,625 ≥19,531 39,063 19,531 13,021 9,766 7,813 ≥7,813 15,625 7,813 5,208 3,906 3,125 ≥3,906 7,813 3,906 2,604 1,953 1,563 ≥1,953 3,906 1,953 1,302 977 781 ≥781 1,563 781 521 391 313 ≥391 781 391 260 195 156 ≥195 391 195 130 98 78 ≥78 156 78 52 39 31 ≥39 78 39 26 20 16 ≥20 39 20 13 10 8 ≥8 16 8 5 4 3
GSP-9300 User Manual
134
6. Press Time Axis [F3] to set horizontal axis parameters:
Ref. Value[F1] Sets the starting time on the time axis.
Ref. Pos[F2] Shifts the waveform X number of grid subdivisions.
Scale/Div[F3] Sets the grid division scale when Auto Scale is Off.
Auto Scale[F4] Toggles auto-scaling on/off.
7. Press Depth Axis[F4] to set depth (vertical) parameters:
Ref.Value[F1] Offsets the reference position as a percentage of the vertical scale/div.
Ref.Pos[F2] Sets the reference position of the waveform on a vertical grid subdivision (1:10).
Scale/Div[F3] Sets the vertical grid division scale when Auto Scale is Off.
Auto Scale[F4] Toggles auto-scaling on/off.
8. Press Squelch[F6] to set carrier squelch level. The squelch setting will suppress unwanted noise of a certain level.

ADVANCED OPERATION
135
Operation: trigger configuration
9. Press AF Trigger[F5]>Trigger Setup[F1] to set the triggering conditions:
Edge Slope[F1] Sets the trigger to rising or falling edge.
Trigger Mode[F2] Sets the triggering mode:
Nor.: Normal trigger Sgl.: Single trigger Cont.: Continuously trigger
Trigger Level[F3] Sets the trigger level as a percentage of the depth. (The displayed level will only remain for a few moments)
Trigger Delay[F4] Sets the trigger delay time: 0 to 1ks
10. Press Return[F6] to return to the AF Trigger menu and to set the remaining trigger options:
FreeRun[F2] Disables the trigger, this
is the default setting.
Start Time[F3] Sets the start time for the x-axis for the AM waveform in the top-half of the screen.
Stop Time[F4] Sets the stop time for the x-axis for the AM waveform in the top-half of the screen.
Action Now[F6] Turns FreeRun mode off and uses the user-defined trigger settings.

GSP-9300 User Manual
136
Note The MAX and MIN measurements are held until higher or lower values are found. To reset the MAX
and MIN measurements, press Measure > Demod[F2]>AM Analysis[F1]>Min/Max Reset[F3].
AM Pass Fail Testing
Description The Limit Edit function puts a pass limit on the AM depth, carrier offset and carrier power.
Measurement Range
AM Depth: 1Hz ~ 400kHz
Carr. Offset: 1Hz ~ 400kHz
Carrier Power: -120dBm ~ 30dBm
Operation: configuration
1. Press Measure > Demod[F2]>AM Analysis[F1]>
Limit Edit[F5] and set the limits.
AM Depth[F1] If the measured depth is above this limit, it will be judged as Fail.
Carr. Offset[F2] If the measured carrier offset is above this limit, it will be judged as Fail.
Carr. Power[F3] If the measured carrier power is above this limit, it will be judged as Fail.
2. Press Pass/Fail and turn Pass/Fail on.

ADVANCED OPERATION
137
3. The AM Measurement area in the bottom half of the screen will now include Pass/Fail indicators for the AM depth, carrier offset and carrier power.
Pass: Fail:
Example
Pass/Fail judgments

GSP-9300 User Manual
138
FM Analysis
Description When frequency modulation is turned on, the input signal is centered on the carrier frequency and the span is automatically set to zero-span.
Measurement items
Freq. Deviation: Current, Min, Max
Mod. Rate: Current, Min, Max
Carrier Pwr: Current, Min, Max
Carrier Freq Offset: Current, Min, Max
SINAD: Current, Min, Max
Operation: configuration
1. Set the center frequency to the carrier frequency (page 41).
2. Press Measure > Demod[F2]>FM Analysis[F2]>FM
Analysis[F1] and turn FM analysis on.
Any other measurement mode will automatically be disabled.
3. The display splits into two screens. The top shows the FM waveform in the time domain. The bottom screen shows the FM measurement.
FM modulationmeasurements
FM waveform

ADVANCED OPERATION
139
4. Press Setup[F2]>IF Bandwidth[F1] and set the Intermediate frequency bandwidth. (10kHz, 30kHz, 100kHz, 300kHz, 1MHz, )
Set with adequate bandwidth to accommodate spectrum contained in the carrier.
5. Press LPF[F2] to set the low pass filter frequency, alternatively the frequency can be set to bypass:
FM Signal Frequency (Hz)
Selectable bandwidth of LPF (Hz) ≥78,125 156,250 78,125 52,083 39,063 31,250 ≥39,063 78,125 39,063 26,042 19,531 15,625 ≥19,531 39,063 19,531 13,021 9,766 7,813 ≥7,813 15,625 7,813 5,208 3,906 3,125 ≥3,906 7,813 3,906 2,604 1,953 1,563 ≥1,953 3,906 1,953 1,302 977 781 ≥781 1,563 781 521 391 313 ≥391 781 391 260 195 156 ≥195 391 195 130 98 78 ≥78 156 78 52 39 31 ≥39 78 39 26 20 16 ≥20 39 20 13 10 8 ≥8 16 8 5 4 3
6. Press Time Axis[F3] to set horizontal axis parameters:
Ref. Value[F1] Sets the starting time on the time axis.
Ref. Pos[F2] Shifts the waveform X number of grid subdivisions.
Scale/Div[F3] Sets the grid division scale when Auto Scale is Off.

GSP-9300 User Manual
140
Auto Scale[F4] Toggles auto-scaling on/off.
7. Press Deviation Axis[F4] to set deviation (vertical) parameters:
Ref.Value[F1] Offsets the reference position (in frequency).
Ref.Pos[F2] Sets the reference position of the waveform on a vertical grid subdivision (1:10).
Scale/Div[F3] Sets the vertical grid division scale.
Auto Scale[F4] Toggles auto-scaling on/off.
Operation: trigger configuration
8. Press AF Trigger[F5]>Trigger Setup[F1] to set the triggering conditions:
Edge Slope[F1] Sets the trigger to rising or falling edge.
Trigger Mode[F2] Sets the triggering mode:
Norm.: Normal trigger Sgl.: Single trigger Cont.: Continuously trigger
Trigger Level[F3] Sets the trigger level as a frequency. (The displayed level will only remain for a few moments)
Trigger Delay[F4] Sets the trigger delay time: 0 to 1ks
9. Press Return[F6] to return to the AF Trigger menu and set the remaining triggering options:

ADVANCED OPERATION
141
FreeRun[F1] Disables the trigger, this
is the default setting.
Start Time[F3] Sets the start time for the x-axis for the FM waveform in the top-half of the screen.
Stop Time[F4] Sets the stop time for the x-axis for the FM waveform in the top-half of the screen.
Action Now[F6] Turns FreeRun mode off and uses the user-defined trigger settings.
Note The MAX and MIN measurements are held until higher or lower values are found. To reset the MAX
and MIN measurements, press Measure > Demod[F2]>FM Analysis[F1]>Min/Max Reset[F3].
FM Pass Fail Testing
Description The Limit Edit function puts a pass limit on the FM deviation, carrier offset and carrier power.
Measurement Range
AM Deviation: 1Hz ~ 400kHz
Carr. Offset: 1Hz ~ 400kHz
Carrier Power: -120dBm ~ 30dBm
Operation: configuration
1. Press Measure > Demod[F2]>FM Analysis[F2]>Limit Edit[F5] and set the limits.
FM Deviation[F1] If the measured deviation is above this limit, it will be judged as Fail.

GSP-9300 User Manual
142
Carr. Offset[F2] If the measured carrier offset is above this limit, it will be judged as Fail.
Carr. Power[F3] If the measured carrier power is above this limit, it will be judged as Fail.
2. Press Pass/Fail[F6] and turn Pass/Fail on.
3. The FM Measurement area in the bottom half of the screen will now include Pass/Fail indicators for the FM deviaton, carrier offset and carrier power.
Pass: Fail:
Example
Pass/Fail judgments

ADVANCED OPERATION
143
AM/FM Demodulation
Description The GSP-9300 has a convenient AM/FM demodulation function to tune into AM or FM broadcast signals and listen to the demodulated baseband signals using the ear phone out socket.
Operation: Setup
1. Set the center frequency to the desired FM/AM carrier frequency. See page 41 for details.
2. Set the span to zero. See page 46 for details.
3. Set the Preamp to Auto. See page 62.
4. Connect an antenna to the RF input.
Connection Connect headphones or a speaker to the phone output port.
Operation 1. Press Measure > Demod[F2]>Sound[F3]>Ear Phone
Out[F1] and turn the ear phone out on.
2. Press Volume[F2] to set the volume output:
Volume: 0~15, default 7
3. Press Digital Gain Control[F3] to change the gain:
Gain: 0~18dB, 6dB step
4. Press Demod Type[F4] to choose AM or FM demodulation.

GSP-9300 User Manual
144
ASK Measurement
Description The ASK function can be used to analyze ASK signals. It can either display the demodulated waveform or the symbols encoded in the signal. Manchester or Miller line codes can also be decoded.
Measurement items
AM Depth: Current, Min, Max
Mod. Rate: Current, Min, Max
Carrier Pwr: Current, Min, Max
Carrier Freq Offset: Current, Min, Max
SINAD: Current, Min, Max
Operation: configuration
1. Set the center frequency to the carrier frequency (page 41).
2. Press Measure > Demod[F2]>ASK[F4]>ASK Analysis[F1] and turn ASK Analysis on.
Any other measurement mode will automatically be disabled.
3. The display splits into two screens. The top shows the ASK waveform in the wave view (time domain waveform) or the symbol view. The bottom screen shows the ASK measurements.

ADVANCED OPERATION
145
ASK measurements
Wave view
Symbol view
4. Press Symbol Rate[F2] and set the Symbol rate.
The symbol rate determines the number of symbols for a unit of time.
Display View 5. To toggle the top half of the screen between the Symbol view or Wave view, press View[F4]>Symbol[F1] or View[F4]>Wave[F2].
6. If the View is set to Wave, press Time Axis [F5] to set horizontal axis parameters:
Ref. Value[F1] Sets the starting time on the time axis.
Ref. Pos[F2] Shifts the waveform X number of grid subdivisions.
Scale/Div[F3] Sets the grid division scale when Auto Scale is Off.
Auto Scale[F4] Toggles auto-scaling on/off.

GSP-9300 User Manual
146
7. Press Depth Axis[F6] to set depth (vertical) parameters:
Ref.Value[F1] Offsets the reference position as a percentage of the vertical scale/div.
Ref.Pos[F2] Sets the reference position of the waveform on a vertical grid subdivision (1:10).
Scale/Div[F3] Sets the vertical grid division scale when Auto Scale is Off.
Auto Scale[F4] Toggles auto-scaling on/off.
Operation: trigger configuration
8. Press More[F7]>Ext.Trigger[F1] to set the triggering conditions:
Free Run[F1] Disables the trigger, this is the default setting.
Edge Slope[F2] Sets the trigger to rising or falling edge.
Trigger Mode[F3] Sets the triggering mode:
Norm.: Normal trigger Sgl.: Single trigger Cont.: Continuously trigger
Trigger Delay[F5] Sets the trigger delay time: 0 to 1ks
Action Now[F6] Turns FreeRun mode off and uses the user-defined trigger settings. See the trigger section on page 89.

ADVANCED OPERATION
147
9. Press Return[F7] to return to the previous menu and to set the sweep options:
Sweep[F5] Sets the sweep to Single
or Cont. When set to Single the Sweep Single[F6] soft-key must be pressed to initiate a sweep.
Sweep Single[F6] Initiates a single sweep when Sweep[F5] is set to Single.
Decoding: supported line codes
10. Press Decoding[F3] to set the line decoding method. The decoded data can be seen when in the Symbol or Waveform View:
None[F1] No line decoding of data.
Miller[F2] Miller decoding (aka. Delayed Encoding).
Manchester Encoding[F3]
Manchester encoding (aka. Phase Encoding).

GSP-9300 User Manual
148
Note Miller Encoding Definition: Miller encoding will encode a “1” as a phase transition in the middle of a data period. A “0” is encoded the same as the previous bit. This means that only a “1” causes the data to transition from high or low.
1
0
H
L
Data periodExample:
Original data
Miller encoded data
Manchester Encoding Definition: Manchester encoding encodes a “1” or “0” on each transition in a data period. The Manchester definition used for the GSP-9300 uses a low to high transition to indicate “0”, and a high to low transition to indicate “1”.
1
0
H
L
Data periodExample:
Original data
Manchester encoded data
ASK Pass Fail Testing
Description The Limit function puts a pass limit on the AM depth, carrier offset and carrier power.
Measurement Range
AM Depth: 1Hz ~ 400kHz
Carr. Offset: 1Hz ~ 400kHz
Carrier Power: -120dBm ~ 30dBm

ADVANCED OPERATION
149
Operation: configuration
1. Press Measure > Demod[F2]>ASK[F4]> More[F7]>Limit[F45] and set the limits.
AM Depth[F2] If the measured depth is above this limit, it will be judged as Fail.
Carr. Offset[F3] If the measured carrier offset is above this limit, it will be judged as Fail.
Carr. Power[F4] If the measured carrier power is above this limit, it will be judged as Fail.
2. Press Limit and turn the limit on or off on.
3. The ASK Measurement area in the bottom half of the screen will now include Pass/Fail indicators for the AM depth, carrier offset and carrier power.
Pass: Fail:
Example
Pass/Fail judgments

GSP-9300 User Manual
150
FSK Measurement
Description The FSK function can be used to analyze FSK signals. It can either display the demodulated waveform or the symbols encoded in the signal. Manchester or Miller line codes can also be decoded.
Measurement items
Freq Deviation: Current, Min, Max
Mod. Rate: Current, Min, Max
Carrier Pwr: Current, Min, Max
Carrier Freq Offset: Current, Min, Max
SINAD: Current, Min, Max
Operation: configuration
1. Set the center frequency to the carrier frequency (page 41).
2. Press Measure > Demod[F2]>FSK[F5]>FSK Analysis[F1] and turn FSK analysis on.
Any other measurement mode will automatically be disabled.
3. The display splits into two screens. The top shows the demodulated FSK waveform in the wave view (time domain waveform) or the symbol view. The bottom screen shows the FSK-specific measurements and pass/fail results.

ADVANCED OPERATION
151
FSK demodulation measurements
Wave view
Symbol view
4. Press Symbol Rate[F2] and set the Symbol rate.
The symbol rate determines the number of symbols for a unit of time.
Frequency Deviation
5. Press Freq.Deviation[F3] to set the frequency deviation band for the FSK signal:
Freq.Deviation[F1] 10kHz, 30kHz, 100kHz, 300kHz, 1MHz.
Display View 6. To toggle the top half of the screen between the Symbol view or Wave view, press View[F4]>Symbol[F1] or View[F4]>Wave[F2].
7. If the View is set to Wave, press Time Axis [F5] to set horizontal axis parameters:
Ref. Value[F1] Sets the starting time on the time axis.

GSP-9300 User Manual
152
Ref. Pos[F2] Shifts the waveform X number of grid subdivisions.
Scale/Div[F3] Sets the grid division scale when Auto Scale is Off.
Auto Scale[F4] Toggles auto-scaling on/off.
8. Press Deviation Axis[F6] to set deviation (vertical) parameters:
Ref.Value[F1] Offsets the reference position (in frequency).
Ref.Pos[F2] Sets the reference position of the waveform on a vertical grid subdivision (1:10).
Scale/Div[F3] Sets the vertical grid division scale when Auto Scale is Off.
Auto Scale[F4] Toggles auto-scaling on/off.
Operation: trigger configuration
9. Press More[F7]>Ext.Trigger [F1] to set the triggering conditions:
Free Run[F1] Disables the trigger, this is the default setting.
Edge Slope[F2] Sets the trigger to rising or falling edge.
Trigger Mode[F3] Sets the triggering mode:
Norm.: Normal trigger Sgl.: Single trigger Cont.: Continuously trigger

ADVANCED OPERATION
153
Trigger Delay[F5] Sets the trigger delay time: 0 to 1ks
Action Now[F6] Turns FreeRun mode off and uses the user-defined trigger settings.
See the trigger section on page 89.
10. Press Return[F7] to return to the previous menu and to set the sweep options:
Sweep[F5] Sets the sweep to Single
or Cont. When set to Single the Sweep Single[F6] soft-key must be pressed.
Sweep Single[F6] Performs a single sweep when Sweep[F5] is set to Single.
Decoding: supported line codes
11. Press Decoding[F3] to set the line decoding method. The decoded data can be seen when in the Symbol or Waveform View:
None[F1] No line decoding of data.
Miller[F2] Miller decoding (aka. Delayed Encoding).
Manchester Encoding[F3]
Manchester encoding (aka. Phase Encoding).

GSP-9300 User Manual
154
Note Miller Encoding Definition: Miller encoding will encode a “1” as a phase transition in the middle of a data period. A “0” is encoded the same as the previous bit. This means that only a “1” causes the data to transition from high or low.
1
0
H
L
Data periodExample:
Original data
Miller encoded data
Manchester Encoding Definition: Manchester encoding encodes a “1” or “0” on each transition in a data period. The Manchester definition used for the GSP-9300 uses a low to high transition to indicate “0”, and a high to low transition to indicate “1”.
1
0
H
L
Data periodExample:
Original data
Manchester encoded data
FSK Pass Fail Testing
Description The Limit Edit function puts a pass limit on the FSK frequency deviation, carrier offset and carrier power.
Measurement Range
Freq. Deviation: 1Hz ~ 400kHz
Carr. Offset: 1Hz ~ 400kHz
Carrier Power: -120dBm ~ 30dBm
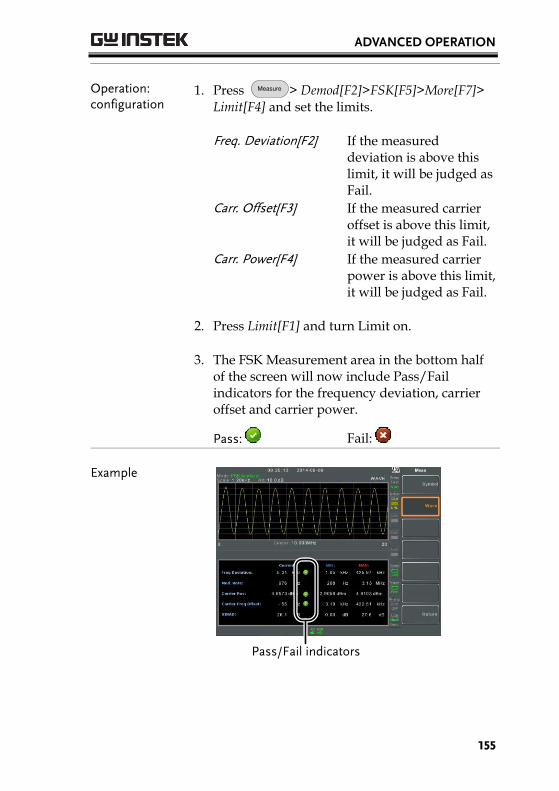
ADVANCED OPERATION
155
Operation: configuration
1. Press Measure > Demod[F2]>FSK[F5]>More[F7]> Limit[F4] and set the limits.
Freq. Deviation[F2] If the measured deviation is above this limit, it will be judged as Fail.
Carr. Offset[F3] If the measured carrier offset is above this limit, it will be judged as Fail.
Carr. Power[F4] If the measured carrier power is above this limit, it will be judged as Fail.
2. Press Limit[F1] and turn Limit on.
3. The FSK Measurement area in the bottom half of the screen will now include Pass/Fail indicators for the frequency deviation, carrier offset and carrier power.
Pass: Fail:
Example
Pass/Fail indicators

GSP-9300 User Manual
156
2FSK Measurement
Description 2FSK is a binary FSK (frequency shift keying) form of modulation. 2FSK is commonly used to transmit data where an FSK modulated signal is composed of two different frequencies, one frequency represents the “1” data and the other frequency represents the “0” data.
For 2FSK measurement 2 traces will be created, one trace will show the 2FSK spectrum (trace 1, yellow) and the other trace (trace 2, purple) will show a MAX HOLD trace type with peak markers at the FSK carrier and hop frequencies.
Measurement items
Peak 1, Peak 2: frequency, amplitude
Frequency Deviation: hertz
Carrier Offset: frequency
Carrier Freq Offset: frequency
Peak Threshold: dBm
Max Hold: dBm
Example
Freq. 1 Freq. 2
Peak threshold limit
Max Hold limit
2FSK traceMax Hold trace
Operation 1. Set the frequency span to cover the 2FSK carrier and hop frequency. See page 41 for details.
2. Press Measure > 2FSK[F3]>2FSK[F1] and turn 2FSK on.
Any other measurement mode will automatically be disabled.

ADVANCED OPERATION
157
3. The display splits into two screens. The top shows the trace with peak markers for the first and second FSK frequencies (carrier and hop frequency). The bottom screen shows the 2FSK measurement results in real time.
2FSK measurement
Peak 1, Peak 2
4. To set the peak threshold line, press Peak Threshold:
Threshold range: -120dBm ~ 30.0 dBm
5. To set max hold limit, press Max Hold:
Max Hold range: -130dBm ~ 30.0 dBm
Note For more information about Peak Threshold and Max Hold parameters, please see the Trace chapter on page 81.
GSP-9300 User Manual
158
2FSK Pass Fail Testing
Description The Limit Edit function puts a pass limit on the frequency deviation and carrier power and a high/low limit on the amplitude of each peak.
Measurement Range
Freq. Deviation: 1Hz ~ 400kHz
Carr. Offset: 1Hz ~ 400kHz High Limit: -120dBm ~ 30dBm Low Limit: -120dBm ~ 30dBm
Operation: configuration
1. Press Measure > 2FSK[F3]>Limit Edit[F5] and set the limits.
Freq. Deviation[F1] If the measured deviation is above this limit, it will be judged as Fail.
Carr. Offset[F2] If the measured carrier offset is above this limit, it will be judged as Fail.
High Limit[F3] If the amplitude for one of the peaks is above the high limit, it will be judged as Fail.
Low Limit[F4] If the amplitude for one of the peaks is below the low limit, it will be judged as Fail.
2. Press Pass/Fail[F6] and turn Pass/Fail on.

ADVANCED OPERATION
159
3. The 2FSK area in the bottom half of the screen will now include Pass/Fail indicators for the frequency depth, carrier offset, high limit and low limit.
Pass: Fail:
Example
Pass/Fail judgments

GSP-9300 User Manual
160
Phase Jitter Measurement
Description Phase Jitter refers to the amount of phase fluctuation and can be used to evaluate stability of a signal in the time domain.
Parameters Start Offset:
The start frequency with respect to the center frequency.
Stop Offset: The stop frequency with respect to the center frequency.
Measurement items
Carrier Power: dBm
Jitter in phase: rad
Jitter in time: ns
Example
Stop OffsetStart Offset
Operation: Setting up the main channel
1. Press Measure > Phase Jitter[F4]>Phase Jitter[F1] and turn Phase Jitter on.
Any other measurement mode will automatically be disabled.
2. The display splits into two screens. The top shows the trace with the start and stop offsets. The bottom screen shows the phase jitter measurements.

ADVANCED OPERATION
161
Phase jitter measurements
Start offset
Stop offset
3. Press Start Offset[F2] to set the start offset:
Offset: (0Hz ~ ½ span freq)
4. Press Stop Offset[F3] to set the stop offset:
Offset: (0Hz ~ ½ span freq)
Note The phase jitter measurements are strongly tied to the RBW and VBW.

GSP-9300 User Manual
162
Spectrum Emission Mask Overview
Description SEM measurements are used to measure the out-of-channel emissions relative to the in-channel power. SEM measurements are usually calculated for specified power bands at a number of different offsets to the carrier frequency. SEM measurements are often carried out for a number of different wireless standards.
For 3GPP, the GSP-9300 supports BS (base station) and UE (user equipment) testing standards for both FDD (frequency-division duplexing) and TDD (time-division duplexing) modes.
The GSP-9300 also supports SEM testing for 802.11b, 802.11g, 802.11n and 802.16 as well as user defined emission mask testing
Example
Channel integrated BWOffset 1Offset 2Offset 3
Chan span
Absolute mask
Relative mask
Parameters ChanIntegBW:
Channel Integration Bandwidth. The ChanIntegBW is used to measure the in-channel

ADVANCED OPERATION
163
power.
Chan Span:
Used to define the span of the main channel when measuring the channel power.
RBW:
Sets the resolution bandwidth for the main channel when measuring the in-channel power.
Total Pwr Ref:
The total power of the carrier that is used as the reference for calculating the offset power.
PSD Ref:
The mean power spectral density of the carrier that is used as the reference for calculating the offset power.
Select Offset: Selects the offset pairs (1 ~ 5) used for configuration.
Start Freq:
Sets the start frequency offset for the selected offset number.
Stop Freq:
Sets the stop frequency offset for the selected offset number.
RBW:
Sets the resolution bandwidth of the selected offset number.
Abs Start:
Sets the absolute level limit at the Start Freq for selected offset number.
Abs Stop:
Sets the absolute level limit at the Stop Freq for the selected offset number. The Abs Stop level limit can be set to Couple or Man. Man allows Abs Stop to be user-defined, while Couple will

GSP-9300 User Manual
164
lock Abs Stop to the Abs Start level limit.
Rel Start:
Sets the relative level limit at the Start Freq for the selected offset number.
Rel Stop:
Sets the relative level limit at the Stop Freq for the selected offset number. Rel Stop can be set to Couple or Man. Man allows Rel Stop to be user-defined, while Couple will lock Rel Stop to the Rel Start level limit.
Fail Mask:
Sets the fail conditions for measurement with regards to the level limits: Absolute, Relative, Absolute & Relative, Absolute or Relative.
Measurement items
Main Channel Bandwidth:
Unit: Hz
Total Power: Unit: dBm
PSD (Power Spectral Density):
Unit: dBm/Hz
Offset 1~5: Lower dBm, Upper dBm
3GPP Operating Bands*
Operating Band
UL Frequencies
UE transmit, Node B receive
DL Frequencies
UE receive, Node B transmit
I 1920~1980MHz 2110~2170MHz
II 1850~1910MHz 1930~1990 MHz
II 1710~1785MHz 1805~1880MHz
IV 1710~1755MHz 2110~2155MHz
V 824~849MHz 869~894MHz
VI 830~840MHz 875~885MHz

ADVANCED OPERATION
165
VII 2500~2570MHz 2620~2690MHz
VIII 880~915MHz 925~960MHz
IX 1749.9~1784.9MHz 1844.9~1879.9MHz
X 1710~1770MHz 2110~2170MHz
XI 1427.9~1452.9MHz 1475.9~1500.9MHz
XII 698~716MHz 728~746MHz
XIII 777~787MHz 746~756MHz
XIV 788~796MHz 758~768MHz
XV Reserved Reserved
XVI Reserved Reserved
XVII Reserved Reserved
XVIII Reserved Reserved
XIX 830~845MHz 875~890MHz
XX 832~862MHz 791~821MHz
XXI 1447.9~1462.9MHz 1495.9~1510.9MHz
XXV 1850~1915MHz 1930~1995MHz
*for FDD, referenced from ETSI:
3GPP TS 25.101 version 10.2.0 Release 10
3GPP TS 25.104 version 10.2.0 Release 10

GSP-9300 User Manual
166
3GPP-FDD BS For the FDD configuration, different limits can by chosen based on the total channel power, P.
The default value for Δfmax is 12.5MHz. Δfmax can be
user-defined.
The channel span is set to 5MHz.
Note: A, B, C, D, E denote offsets 1 to 5, respectively.
P≥43 Unit: MHz Abs[1] RBW
2.5 ≤A<2.7 -14dBm 30kHz
2.7≤B<3.5 -14 ~ -26dBm 30kHz
3.5≤C<Δfmax -13dBm 1MHz
39≤P<43 Unit: MHz Abs[1] RBW
2.5 ≤A<2.7 -15dBm 30kHz
2.7≤B<3.5 -14 ~ -26dBm 30kHz
3.5≤C<7.5 -13dBm 1MHz
7.5≤D<Δfmax P-56dB 1MHz
31≤P<39 Unit: MHz Abs[1] RBW
2.5 ≤A<2.7 P-53dB 30kHz
2.7≤B<3.5 P-53dB~ P-56dB
30kHz
3.5≤C<7.5 P-52dB 1MHz
7.5≤D<Δfmax P-56dB 1MHz
P<31 Unit: MHz Abs[1] RBW
2.5 ≤A<2.7 -22dBm 30kHz
2.7≤B<3.5 -22 ~ -34dBm 30kHz
3.5≤C<7.5 -21dBM 1MHz
7.5≤D<Δfmax -25dBm 1MHz

ADVANCED OPERATION
167

GSP-9300 User Manual
168
For P<31, two additional power limits (shown below) can be selected via the Additional Max Out. Pwr option for Home BS applications:
(The default value for Δfmax is 14.5 MHz. Δfmax can
be user-defined)
6≤P≤20 Unit: MHz Abs[1] RBW
12.5 ≤E< Δfmax P- 56dB 1MHz
P<6 Unit: MHz Abs[1] RBW
12.5 ≤E< Δfmax -50dBm 1MHz
3GPP-FDD BS Additional Requirements
For operation in bands II, IV, V, X, XII, XIII, XIV and XXV, additional requirements (listed below) apply in addition to the minimum requirements listed above.
Bands: II, IV, X
Unit: MHz Additional[3] RBW
2.5 ≤A<3.5 -15dBm 30kHz
3.5≤B< Δfmax -13dBm 1MHz
Bands: V Unit: MHz Additional[3] RBW
2.5 ≤A<3.5 -15dBm 30kHz
3.5≤B< Δfmax -13dBm 100kHz
Bands: XII, XIII, XIV
Unit: MHz Additional[3] RBW
2.5 ≤A<3.5 -13dBm 30kHz
3.5≤B< Δfmax -13dBm 100kHz
3GPP-FDD UE The channel span is set to 5MHz.
Note: A, B, C, D, E denote offsets 1 to 5, respectively.
Unit: MHz Rel Abs[1] RBW
2.5 ≤A<3.5 -35~-50dBc -71.1dBm 30kHz

ADVANCED OPERATION
169
3.5 ≤B<7.5 -35~-39dBc -55.8dBm 1MHz
7.5 ≤C<8.5 -39~-49dBc -55.8dBm 1MHz
8.5 ≤D<12.5 -49~-49dBc -55.8dBm 1MHz
3GPP-FDD UE Additional Requirements
Additional requirements for 3GPP-FDD UE.
Bands II, IV, X
Unit: MHz Additional[3] RBW
2.5 ≤A<3.5 -15dBm 30kHz
3.5≤B<12.5 -15dBm 1MHz
Band V Unit: MHz Additional[3] RBW
2.5 ≤A<3.5 -15dBm 30kHz
3.5≤B<12.5 -13dBm 100kHz
Bands XII, XIII, XIV
Unit: MHz Additional[3] RBW
2.5 ≤A<3.5 -13dBm 30kHz
3.5≤B<12.5 -13dBm 100kHz
3GPP-TDD BS 3.84Mcps*
For the TDD configuration, different limits can by chosen based on the total channel power,
The channel span: 3.84Mcps: 5MHz.
Note: A, B, C, D, E denote offsets 1 to 5, respectively.
P≥43 Unit: MHz Abs[1] RBW
2.5 ≤A<2.7 -14dBm 30kHz
2.7≤B<3.5 -14 ~ -26dBm 30kHz
3.5≤C<12 -13dBm 1MHz
39≤P<43 Unit: MHz Abs[1] RBW
2.5 ≤A<2.7 -14dBm 30kHz
2.7≤B<3.5 -14 ~ -26dBm 30kHz
3.5≤C<7.5 -13dBm 1MHz
7.5≤D<12 P-56dB 1MHz

GSP-9300 User Manual
170
31≤P<39 Unit: MHz Abs[1] RBW
2.5 ≤A<2.7 P-53dBm 30kHz
2.7≤B<3.5 P-53~P-65dBm 30kHz
3.5≤C<7.5 P-52dBm 1MHz
7.5≤C<12 P-56dBm 1MHz
P≤31 Unit: MHz Abs[1] RBW
2.5 ≤A<2.7 -22dBm 30kHz
2.7≤B<3.5 -22 ~ -34dBm 30kHz
3.5≤C<7.5 -21dBm 1MHz
7.5≤D<12 -25dBm 1MHz
*referenced from ETSI: 3GPP TS 25.102 version 10.2.0 Release 10 3GPP TS 25.105 version 10.3.0 Release 10
3GPP-TDD BS 1.28Mcps
The channel span: 1.28Mcps: 1.6MHz.
P≥34 Unit: MHz Abs[1] RBW
0.8 ≤A<1 -20dBm 30kHz
1≤B<1.8 -20 ~ -28dBm 30kHz
1.8≤C<3.5 -13dBm 1MHz
26≤P<34 Unit: MHz Abs[1] RBW
0.8 ≤A<1 P-54dB 30kHz
1≤B<1.8 P-54~P-62dB 30kHz
1.8≤C<3.5 P-47dB 1MHz
P<26 Unit: MHz Abs[1] RBW
0.8 ≤A<1 -28dBm 30kHz
1≤B<1.8 -28~-36dBm 30kHz
1.8≤C<3.5 -21dBm 1MHz

ADVANCED OPERATION
171
3GPP-TDD BS 7.68 Mcps
The channel span: 7.68Mcps: 10MHz.
P≥43 Unit: MHz Abs[1] RBW
5 ≤A<5.2 -17dBm 30kHz
5.2≤B<6 -17 ~ -29dBm 30kHz
6≤C<24.5 -16dBm 1MHz
39≤P<43 Unit: MHz Abs[1] RBW
5≤A<5.2 -17dBm 30kHz
5.2≤B<6 -17 ~ -29dBm 30kHz
6≤C<15 -16dBm 1MHz
15≤D≤24.5 P-59dB 1MHz
31≤P<39 Unit: MHz Abs[1] RBW
5≤A<5.2 P-56dB 30kHz
5.2≤B<6 P-56~P-68dB 30kHz
6≤C<15 P-55dB 1MHz
15≤D≤24.5 P-59dB 1MHz
P<31 Unit: MHz Abs[1] RBW
5≤A<5.2 -25dBm 30kHz
5.2≤B<6 -25~-37dBm 30kHz
6≤C<15 -24dBm 1MHz
15≤D≤24.5 -28dBm 1MHz

GSP-9300 User Manual
172
3GPP-TDD UE The channel span: 3.84Mcps: 5MHz. 1.28Mcps: 1.6MHz. 7.68Mcps: 10MHz.
Note: A, B, C, D, E denote offsets 1 to 5, respectively.
3.84Mcps Unit: MHz Rel[2] RBW
2.5 ≤A<3.5 -35~-50dBc 30kHz
3.5≤B<7.5 -35 ~ -39dBc 1MHz
7.5≤C<8.5 -39~-49dBc 1MHz
8.5≤D<12.5 -49dBc 1MHz
1.28Mcps Unit: MHz Rel[2] RBW
0.8 ≤A<1.8 -35~-49dBc 30kHz
1.8≤B<2.4 -49~-59.2dBc 30kHz
2.4≤C<4 -44dBc 1MHz
7.68Mcps Unit: MHz Rel[2] RBW
5 ≤A<5.75 -38~-46dBc 30kHz
5.75≤B<7 -46 ~ -53dBc 30kHz
7≤C<15 -38~-42dBc 1MHz
15≤D<17 -42~-52dBc 1MHz
17≤E<25 -53dBc 1MHz
802.11b* The channel span: 22MHz
Note: A, B denotes offsets 1 and offset 2. Here the default value of “f” is 24MHz. This can be user-defined.
Unit: MHz Rel[2] RBW
11≤A<22 -30dBc 100kHz
22≤B<f -50dBc 100kHz
*reference: IEEE Std 802.11b-1999

ADVANCED OPERATION
173
802.11g The channel span: ERP-OFDM/DSSS-OFDM : 18MHz ERP-DSSS/ERP-PBCC/ERP-CCK: 22MHz
Note: A, B, C, D denote offsets 1 to 4, respectively. Here the default value of “f” is 40MHz (ERP-OFDM/ DSSS-OFDM) or 25MHz (ERP-DSSS/ ERP-PBCC/ ERP-CCK). This can be user-defined.
ERP-OFDM/ DSSS-OFDM
Unit: MHz Rel[2] RBW
9 ≤A<11 -0~-20dBc 100kHz
11≤B<20 -20~-28dBc 100kHz
20≤C<30 -28~-40dBc 100kHz
30≤D<f -40dBc 100kHz
ERP-DSSS/ ERP-PBCC/ ERP-CCK
Unit: MHz Rel[2] RBW
11 ≤A<22 -30dBc 100kHz
22≤B<f -50dBc 100kHz
*reference: IEEE Std 802.11a-1999
802.11n The channel span: CH BW 20MHz: 18MHz CH BW 40MHz: 38MHz
Note: A, B, C, D denote offsets 1 to 4, respectively. Here the default value of “f” is 40MHz(CHBW 20MHz) or 70MHz(CHBW 40MHz). This can be user-defined.
CH BW 20MHz
Unit: MHz Rel[2] RBW
9 ≤A<11 -0~-20dBc 100kHz
11≤B<20 -20~-28dBc 100kHz
20≤C<30 -28~-45dBc 100kHz
30≤D<f -45dBc 100kHz

GSP-9300 User Manual
174
CH BW 40MHz
Unit: MHz Rel[2] RBW
19 ≤A<21 0~-20dBc 100kHz
21≤B<40 -20~-28dBc 100kHz
40≤C<60 -28~-45dBc 100kHz
60≤D<f -45dBc 100kHz
*reference: IEEE Std 802.1n-2009
802.16* The channel span: CH BW 20MHz: 19MHz CH BW 10MHz: 9.5MHz
Note: A, B, C, D denote offsets 1 to 4, respectively. Here the default value of “f” is 16.75MHz(CHBW 20MHz) or 31.5MHz(CHBW 10MHz). This can be user-defined.
CH BW 20MHz
Unit: MHz Rel[2] RBW
9.5 ≤A<10.9 0~-25dBc 100kHz
10.9≤B<19.5 -25~-32dBc 100kHz
19.5≤C<29.5 -32~-50dBc 100kHz
29.5≤D<f -50dBc 100kHz
CH BW 10MHz
Unit: MHz Rel[2] RBW
4.75 ≤A<5.45 0~-25dBc 100kHz
5.45≤B<9.75 -25~-32dBc 100kHz
9.75≤C<14.75 -32~-50dBc 100kHz
14.75≤D<f -50dBc 100kHz
*reference: IEEE Std 802.16-2009
Note [1] Abs: Absolute limit [2] Rel: Relative limit(to the total power or the power spectral density, depending on the compliance of the main channel) [3] Additional: Additional absolute limit Pass Fail Criteria:
Case 1: When both Abs and Rel are used, the

ADVANCED OPERATION
175
highest value (Abs or Rel) is used as the Pass/Fail judgment. The trace points under the limit indicate a pass.
Case2: If the additional limit is used, the higher value from case1 is compared to the additional limit. The lowest one is used as the pass/fail judgment.
Spectrum Emission Mask Testing
Description For spectrum emission mask testing, the GSP-9300 has pre-defined testing parameters for 3GPP, 802.11x and 802.16. The GSP-9300 also allows you to perform user-defined SEM testing.
Operation: 1. Press Measure > SEM[F5]>SEM[F2] and turn SEM on.
Any other measurement mode will automatically be disabled.
2. The display splits into two screens. The top shows the trace with the absolute and or relative masks. The bottom screen shows the SEM measurement results.

GSP-9300 User Manual
176
SEM measurements
Absolute limit line
User Defined Parameters
1. Press Setup[F1]>User Define[F6]to set SEM measurement to user defined parameters.
2. Press Meas Type[F1] choose between TotalPwrRef[F1] or PSDRef[F2].
3. Press Ref. Channel[F2] and set the following:
ChanIntegBW[F1] Sets the channel integration bandwidth.
Chan Span[F2] Sets the channel span
RBW[F3] Sets the resolution bandwidth.
TotalPwrRef[F4]/ PSDRef[F4]
Sets the total power/PSD reference level.
4. Press Return[F7] to return to the previous menu.

ADVANCED OPERATION
177
5. Press Offset/Limit[F3] to set the offset parameters:
SelectOffset[F1] Select which offset to edit.
[F2] Toggles the selected offset on/off.
StartFreq[F3] Sets the start frequency of the selected offset.
StopFreq[F4] Sets the Stop Frequency of the selected offset.
RBW[F5] Sets the RBW of the selected offset.
6. Press More 1/2[F6] to set absolute and relative level limits and conditions:
Abs Start[F2] Sets the absolute start
level limit for the selected offset.
Abs Stop[F3] Sets the absolute stop level limit for the selected offset. Man: Allows a user-defined Abs Stop level
Couple: Sets the Abs Stop level to the Abs Start level.
Rel Start[F4]
Sets the relative start level limit for the selected offset.

GSP-9300 User Manual
178
Rel Stop[F5]
Sets the relative stop level for the selected offset.
Man: Allows a user-defined Abs Stop level.
Couple: Sets the Rel Stop level to the Rel Start level.
7. Press Fail Mask[F6] to set the Fail Mask conditions:
Absolute[F1] Sets the fail condition to the Absolute level limit.
Relative[F2] Sets the fail condition to the relative level limit.
Abs AND Rel[F3] Sets the fail condition as both the absolute and relative level limits.
Abs OR Rel[F4] Sets the fail condition to either the absolute or relative level limits.
8. Press Select Offset[F1] and repeat the above steps for any other offsets.
Offset: 1~5
Pre-Set Test Parameters: 3GPP
For details on 3GPP SEM test parameters, please see the SEM overview on page 162.
1. Press Setup[F1]>3GPP[F1] to choose 3GPP measurement.
ADVANCED OPERATION
179
2. Press Ref. Channel[F2] and set the following:
RBW[F3] Sets the resolution
bandwidth.
3. All other reference channel settings are pre-defined.
4. Press Return[F7] to return the previous menu.
5. Press Offset/Limit[F3]>Duplexing Mode[F1] and choose FDD or TDD duplexing:
6. For FDD, press FDD Setup[F2] set the FDD parameters, for TDD, press TDD Setup[F3]:
Transmission[F1] Toggles between BS and UE testing
Chip Rate[F2] Selects the bandwidth of the RRC filter that is used to measure the in-channel power for TDD duplexing: 3.84MHz, 1.28MHz, 7.68MHz
Max Out Pwr[F2/F3] Sets the maximum output power for BS tests: P>=43
39<=P<=43
31<=P<=39
P<31

GSP-9300 User Manual
180
Add.limits[F4] Selects the operating bands for FDD duplexing: None
BandII
BandIV
BandV
BandX
BandX11
BandXIII
BandXIV
MinOffset/ Limit Value[F5]
Allows you to view the parameters of each of the offsets, including start/stop frequency, RBW, Abs Start/Stop and Rel Start/Stop.
Pre-Set Test Parameters: 802.XX
For details on 802.11x and 802.16 SEM test parameters, please see the SEM overview on page 162
1. Press Setup[F1]>and choose a 802.XX test:
802.11b[F2]
802.11g[F3] 802.11n[F4]
802.16[F5]
2. Press Ref. Channel[F2] to view the predefined settings for channel integrated bandwidth, channel span, RBW and PSD ref.

ADVANCED OPERATION
181
3. Press Offset/Limit[F3] to view the parameter values of each of the offsets, including Start and Stop Frequency, RBW, Rel Start and Stop

GSP-9300 User Manual
182
Third Order Intermodulation Distortion (TOI)
Description Third order intermodulation distortion measurement is used to calculate the TOI products caused by two signals that are close together in frequency in a non-linear system. Both the upper and lower third order intercept points (IP3) are calculated. Markers are placed at the frequencies of the TOI products and their respective base signals.
Limits can be placed on the upper and lower TOI products for limit testing.
Parameters Reference Lower Sets the reference level to lowest base signal
Reference Upper Set the reference level to the highest base signal
Limit Sets the limit in dBm for
pass/fail testing
Pass/Fail Test Enables/disables pass/fail
testing.
Measurement items
Base Upper Frequency, dBm, dBc
Base Lower Frequency, dBm, dBc
3rd Order Lower Frequency, dBm, dBc, limit,
Intercept point
3rd Order Upper Frequency, dBm, dBc, limit,
Intercept point
Δ f Frequency

ADVANCED OPERATION
183
Example
3rd Order UpperBase Lower
3rd Order Lower
Limit
Base Upper
Δf
Operation: 1. Press Measure > TOI[F6]>TOI[F1] and turn TOI on.
Any other measurement mode will automatically be disabled.
2. The display splits into two screens. The top shows the trace with markers in the upper and lower base frequencies and the upper and lower 3rd order intermodulation products. The bottom screen shows the TOI measurements and pass/fail results.
TOI measurement and results
3rd Order lower
marker
Lower and upper base
3rd Order upper marker

GSP-9300 User Manual
184
3. Press Reference[F2] to set the reference to the upper or lower base frequencies.
The icon will be displayed next to the selected upper or lower reference.
4. Press Limit[F3] and set the limit for the upper and lower 3rd order intermodulation product amplitude.
5. Press Pass/Fail Test[F4] to toggle pass/fail testing on/off.
The pass or fail icon will be displayed depending on the limit set above.
CNR/CSO/CTB Measurement
Carrier to Noise Ratio (CNR)
Description Carrier to noise ratio calculates the difference in amplitude between the carrier signal and the noise level present in the transmission. CNR measurements are used for both analog and digital CATV.
Parameters Noise Marking Sets the position of the delta
marker (Δ1) using two
options: MIN: The delta marker will search for the minimum between the carrier frequency and the carrier frequency + 4MHz.

ADVANCED OPERATION
185
ΔMarker:
User defined delta marker position.
Measurement items
Visual Carrier frequency, amplitude
CNR amplitude difference
Δ f frequency difference between
visual carrier and noise marker.
Example
CN
R dB
1
Δ1
Δf
Visual carrier marker
Noise marker
Color subcarrier, aural carrier
Channel spacing
To next main channel
Operation: 1. Press Measure >More[F7]>CNR/CSO/CTB[F1]>
Setup[F1]> CNR[F1] to choose CNR measurement.
2. Press Noise Marking[F1] and toggle the noise
marker type between Min and ΔMarker.
3. If Min was selected, press Return[F7] to return to the previous menu.
4. If ΔMarker was selected, press Marker >
Delta[F4]>Delta[F1] and set the delta marker position.
See page 96 for details on moving markers.
Press Measure > CNR/CSO/CTB[F7] to return to
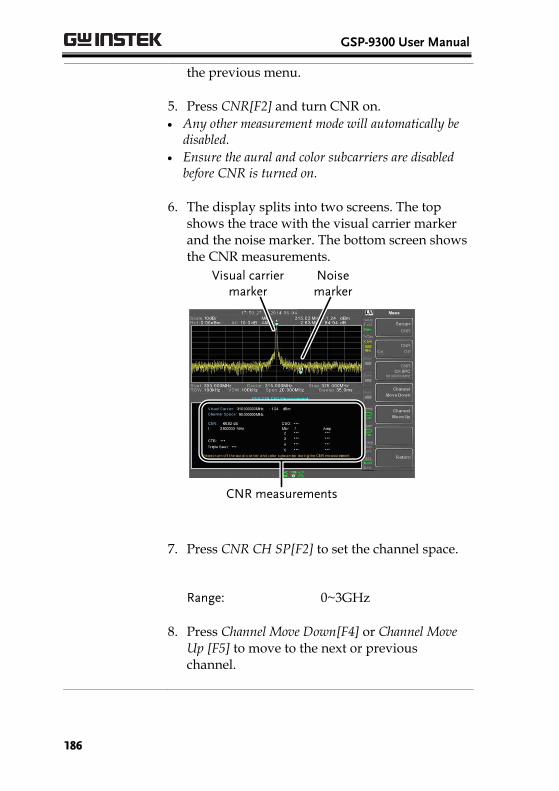
GSP-9300 User Manual
186
the previous menu.
5. Press CNR[F2] and turn CNR on.
Any other measurement mode will automatically be disabled.
Ensure the aural and color subcarriers are disabled before CNR is turned on.
6. The display splits into two screens. The top shows the trace with the visual carrier marker and the noise marker. The bottom screen shows the CNR measurements.
CNR measurements
Visual carrier marker
Noise marker
7. Press CNR CH SP[F2] to set the channel space.
Range: 0~3GHz
8. Press Channel Move Down[F4] or Channel Move Up [F5] to move to the next or previous channel.

ADVANCED OPERATION
187
Note Ensure the aural and color subcarriers are turned off when making CNR measurements.

GSP-9300 User Manual
188
Composite Second Order (CSO)
Description Composite Second Order measurement calculates the difference in amplitude between the carrier signal and the composite second order beat.
Parameters CSO CH SP: The channel space.
Measurement items
Visual Carrier: frequency, amplitude Channel Space: frequency CSO: amplitude difference
Example 1
Δf
Visual carrier marker
Color subcarrier, aural carrier
2CSO Beat marker
CS
O
dB
Channel spacing
To next main channel
Operation: 1. Press Measure > More[F7]>CNR/CSO/CTB[F1]>
Setup[F1]> CSO[F2] and choose CSO.
2. Press CSO[F2] and toggle CSO on.
Any other measurement mode will automatically be disabled.
3. The display splits into two screens. The top shows the trace with the visual carrier marker and the CSO beat marker. The bottom screen shows the CSO measurements.

ADVANCED OPERATION
189
CSO measurements
Visual carrier marker
CSO beat marker
4. Press CSO CH SPC[F3] to set the channel space.
Range: 0~3GHz
5. Press Channel Move Down[F4] or Channel Move Up [F5] to move to next or previous channel.
Composite Triple Beat (CTB)
Description Composite triple beat measurement calculates the difference in amplitude between the visual carrier and the composite triple beat amplitude.
Measurement items
Visual Carrier: frequency, amplitude CTB: amplitude difference from the visual carrier and the triple beat Triple Beat: amplitude

GSP-9300 User Manual
190
Example
2
CTB
dB
1Visual carrier marker
CTB Beat marker
Channel spacing
To next main channel
Operation: 1. Press Measure > More[F7]>CNR/CSO/CTB[F1]>
Setup[F1]> CTB[F3]>Return[F7] to choose CTB measurement and return to the previous menu.
2. Press CTB[F2] and turn CTB on.
Any other measurement mode will automatically be disabled.
3. The display splits into two screens. The top shows the trace with the visual carrier marker. The bottom screen shows the CTB measurements.
This will place a marker (1) on the visual carrier and record the amplitude.
CTB measurements
Visual carrier marker
CTB beat marker

ADVANCED OPERATION
191
4. Turn off the visual carrier signal from the input
and press the Enter key on the front panel.
5. A second trace will appear to mark the CTB amplitude.
This will place a marker (2 ) on the second trace and
calculate the difference (1-2).
6. Press CTB CH SP[F2] to set the channel space.
Range: 0~3GHz
7. Press Channel Move Down[F4] or Channel Move Up [F5] to move to next or previous channel.
Note To perform the CTB measurement again, press Setup[F1]>CTB[F3]> Restart[F1].

GSP-9300 User Manual
192
Harmonic Measurements
Description The Harmonic function can be used to easily measure the amplitude of the fundamental frequency and its harmonic frequencies up to the 10th harmonic. The function can also measure the amplitude relative to the fundamental (dBc) and the total harmonic distortion (THD).
Measurement items
Amplitude Amplitude of each harmonic (dBm).
dBc Amplitude of each harmonic relative to the fundamental.
THD The square root of the sum of the amplitude of each harmonic frequency squared, divided by the amplitude of the fundamental frequency.
THD= V22 + V3
2….+ V32
V1
Example Fundamental frequency
1st, 2nd, 3rd, 4th, …......10th
Harmonic
dBc
Operation 1. Press Measure >
More[F7]>Harmonic[F2]>Harmonic[F1] and turn Harmonic on.

ADVANCED OPERATION
193
Any other measurement mode will automatically be disabled.
2. The display splits into two screens. The top shows a bar graph with fundamental measurement (1) and the each of the harmonic frequencies (2~ 10). The bottom screen shows the amplitude, dBc and THD results.
Harmonic measurement
Fundamental frequency
Nth order harmonics
3. Press Fundamental Freq.[F2] to set the fundamental frequency.
4. Press Number of Order to set the number of harmonic frequencies to measure.
The number of harmonic frequencies set will affect the THD measurement.

GSP-9300 User Manual
194
N dB Bandwidth
Description N dB bandwidth measurements are used to measure the frequency bandwidth that covers a specified amplitude (N dB) from the top of the peak.
Example
N dB BW
N dB
Operation 1. Press Measure > More[F7]>NdB Bandwidth[F3]>
NdB BW[F1] and turn N dB BW on.
Any other measurement mode will automatically be disabled.
2. The display splits into two screens. The top shows the trace with markers for NdB and NdB BW. The bottom screen shows the N dB measurement results in real time.

ADVANCED OPERATION
195
N dB BW Measurement
NdB BW
3. Press NdB[F2] to set the NdB amplitude:
Amplitude: 0.1dB ~ 80.0 dB
Note The NdB bandwidth measurements are strongly tied to the RBW and VBW.

GSP-9300 User Manual
196
P1dB Measurement
Description The P1dB compression point describes the point at which the gain of an active DUT is 1dB less than the ideal linear gain (or small signal gain) relative to the input.
Example
1dB
Ou
tpu
t p
ow
er (
dB
m)
Input power (dBm)
P1d
BDUT
response
Ideal re
sponse
small s
ignal
gain
P1dB Connection Setup
Connect the DUT to the RF input. Connect the tracking generator output to the DUT input. The DC output can be used to power the DUT if necessary.
RF IN
GSP
DUT
TG OUTPUT
DC OUT
Operation 1. Press Measure > More[F7]>P1dB[F4]>P1dB[F1] and turn P1dB on.
Any other measurement mode will automatically be disabled.
It is not necessary to turn the tracking generator on.

ADVANCED OPERATION
197
2. The display splits into two screens. After setup has been completed (see step 3), the top shows the trace (yellow) with the ideal response in red. The P1dB measurement is shown in green. The bottom screen shows the P1dB measurement results in real time.
P1dB measurements
1dB
The measurement results display a total of 31 points, incremented in 1dB steps from -30dBm to 0 dBm. In each column the left side shows the input power and the right side shows the gain. Gain marked in white is effective gain, while gain marked in purple is ineffective gain. The results also list the average gain, the output power at the P1dB point (Pout, 1dB) and the input power at the P1dB point.
3. Press P1dB Setup[F2] to set the P1dB settings.
4. Press Center Freq[F2] to set the center frequency:
Frequency: 0 ~ 3GHz
5. Press Gain Offset[F3] to set the gain offset of the ideal linear response.

GSP-9300 User Manual
198
Gain: -99.00dB ~ 99.00 dB
6. To help smooth the actual frequency response and measure the P1dB compression point more accurately, press Average[F4] to set the average number. This is especially useful if Start is set around -50dB.
Average number: 1 ~ 200
7. Press Start[F5] to set the “starting” output power for the P1dB measurement.
Start: -50dB ~ -5dB
8. Press Reset[F6] to restart the P1dB measurement function.
Warning If the equivalent gain exceeds 30dBm the gridicule area will be bordered in red to indicate that the input exceeds specified levels.
Note The maximum power the DC output can provide is 7volts/500mA.

ADVANCED OPERATION
199
P1dB Normalization
Description The normalize function is used to compensate for any loss from a long cable that may cause inaccurate measurements.
This function relies on the DUT being directly connected to either the TG or the RF input. The position of the long cable in relation to the DUT (input or output) will affect the P1dB measurement.
If the cable is at the DUT input, then the line loss of the cable will reduce the output of the TG before it is input to the DUT. This configuration (Location = Prev) can affect the position of the P1dB point if not normalized.
Likewise if the cable is connected to the output of the DUT, then the gain of the DUT will be reduced at the RF input by the line loss of the cable. In this configuration (Location = Post) the P1dB point will not be affected.
Note If a DUT cannot be directly connected to the TG output or the RG input, try to use the shortest cable possible to reduce the effect of cable loss. The line loss from short cables cannot be measured when using the Normalize function.

GSP-9300 User Manual
200
Example 1 Location = Prev
1dB
Ou
tpu
t p
ow
er (
dB
m)
Input power (dBm)N
orm
aliz
ed
P1d
B
Normalized DUT responseIdeal
DUT response with line loss before
DUT input
Ideal
1dB
P1d
B w
ith
ou
t n
orm
aliz
atio
n
Example 2 Location = Post
1dB
Ou
tpu
t p
ow
er (
dB
m)
Input power (dBm)
P1d
B
Normalized DUT response
Ideal
DUT response with line loss after DUT output
Ideal
1dB
Note This function can only be used when the P1dB is turned on.
Operation 1. Connect the cable that is to be connected to the DUT between the TG and the other cable to the RF input.
GSPTG OUTPUT RF IN

ADVANCED OPERATION
201
2. Press Measure > More[F7]>P1dB[F4] >Normalize[F3].
3. Press Execute Norm[F3]. This will normalize the cable loss. The cable loss will be shown in the Execute Norm icon.
4. Next connect the DUT either directly to the TG or directly to the RF input. The location of the DUT will determine whether the cable loss is normalized before or after the DUT.
Connect the RF cable from the DUT to the either the TG or RF input, depending on where the DUT was connected.
Location = Prev
GSP
DUT
TG OUTPUT RF IN
Cable to be compensated
Location = Post
GSP
DUT
TG OUTPUT RF IN
Cable to be compensated
5. Set Location[F2] to either PREV or POST, depending on the location of the DUT, as shown above.
6. Turn Norm.[F3] on.
7. The cable loss will now be normalized, based on where the DUT is located.

GSP-9300 User Manual
202
EMC Pre-Compliance Testing The GSP-9300 EMC Pretest function is a comprehensive suite for performing, debugging or estimating radiated or conducted emissions as well as the ability to troubleshoot immunity tests.
The EMC Prestest function is divided into 5 main functions: EMI Test, EMI-M Probe, EMI-E Probe, Voltage Probe and EMS Test.
The EMI Test function is used to perform radiated or conducted emissions tests. These tests include inbuilt support for a number of EN and FCC standards to test against.
The EMI-M Probe functions allow you to simulate the radiated emissions at 3 meters and 10 meters for a number of different EN and FCC standards.
The EMI-E Probe function is used to debug sources of electromagnetic emissions using the GW Instek EMI-E probes. This function also allows you test against EN or FCC radiated emission standards.
The Voltage Probe function allows you to estimate the conducted the emissions from the power lines without having to perform conducted radiation tests with the increased cost of a LISN device. It can also be used to debug sources of conducted emissions on your DUT.
The EMS Test function allows you to debug radiated immunity(susceptibility) weakness in the DUT by outputting a source signal from the TG Output with user-defined characteristics.
EMI Testing for Radiated Emissions → from page 203.
Near Field Testing: EMI M Probe → from page 209.
Near Field Testing: EMI E Probe → from page 212.
Conducted Emissions Estimation: Voltage Probe → from page215.
Susceptibility Debugging (EMS Test) → from page 217.

ADVANCED OPERATION
203
EMI Test
Description The EMI Test function is used to greatly simplify the process of EMI pretesting for radiated or conductive emissions testing. You only need to specify the testing frequency, standard used and any corrective factors.
In addition, the peak table function can be used and the results can be shown logarithmically.
Note Note the following instructions assume that you are familiar with how to conduct a radiated or conducted emissions test and are familiar with the various emissions standards.
EMI Testing Overview
Generally speaking, EMI testing is split into 4 different tests: radiated emissions, radiated immunity, conducted emissions and conducted immunity tests. The EMI test function is primarily concerned with radiated emissions and to a lesser extent, conducted emissions.

GSP-9300 User Manual
204
Radiated Emissions Tests
The following is a basic overview of radiated tests. There are a number of different standards, each that have specific test configurations and methods. Most radiated tests are performed in an anechoic chamber or in an open area, where the size of the testing area and the position of the test apparatus may differ from each standard.
An example of a possible setup is shown below.
Place the DUT and antenna on a grounding plane. Arrange the DUT on a raised non-conducting platform and position the antenna 3 or 10 meters from the DUT. Set the antenna height as specified in the applicable standard. Arrange the antenna once in the horizontal position and once in the vertical position. Rotate the DUT 45º after each test.
DUT
3m or 10m
antenna
GSP
Ground plane

ADVANCED OPERATION
205
Conducted Emissions
For conducted emissions testing, a LISN (line impedance stabilization network) is required. A LISN is used for two main reasons. Firstly, it is used to filter any noise from the mains power that is fed to the DUT. Secondly, it filters RF noise from the DUT that would normally be coupled to the mains power and passes it to the spectrum analyzer.
A limiter is also usually used to attenuate the signal input to the spectrum analyzer to safe levels.
GSP DUTLISN
Mains power
Limiter
Operation 1. Press EMC
Pretest > EMI Test[F1] and choose a frequency band to test at. The test frequency that is chosen determines whether the test is a radiated or conducted test, based on what standard you wish to use.
EMI Test Frequency:
Conducted Tests: 9k-150kHz, 150k-30MHz
Radiated tests: 30M-300MHz, 300M-1GHz, 30M-1GHz.
Ambient Noise Rejection
2. Press Amb.Noise Reject[F1] to turn on ambient noise rejection. This function will essentially set the RBW to 9kHz and lower the noise floor for bandwidths between 30MHz and 3GHz. This will allow an open environment to emulate an anechoic chamber.

GSP-9300 User Manual
206
Antenna factor or LISN correction factor settings
3. Press Correction[F2] to apply corrective factors based on the antenna used, the LISN or the position of the antenna. The options available depend on the EMI test frequency selected previously.
None[F1] No correction is used. Turn the Correction function off.
Horizontal[F2] For radiated emissions tests. It is a correction set for when the antenna is in the horizontal position. This correction set is configured for use with GW Instek antennas only.
Vertical[F3] For radiated emissions tests. It is a correction set for when the antenna is in the vertical position. As with the Horizontal correction set, this correction set is configured for use with GW Instek antennas only.
Other factor[F4] Load or create a custom correction set to use with a third party antenna.
Cor.factor[F2] Load or create a custom correction set for use with a LISN device.
4. If Other factor[F4] or Cor.factor[F2] was chosen above, select a correction set or edit an existing correction set and then set Correction[F2] to On.
Press Return[F7] to return to the previous menu.
See page 54 for details on creating or editing correction sets.

ADVANCED OPERATION
207
Recall Limit 5. Press Recall Limit[F3] to add EN55022A/B or FCC A/B limit lines to the display. The limit line that is produced is matched to the selected test frequency range.
None No limit line
EN5502A Euro commercial standard
EN5502B Euro residential standard
FCC A American non-residential standard
FCC B American residential standard
6. Select Average[F1] or Quasi-peak[F2] for the detector for the chosen standard. The availability of these settings depends on the EMI test frequency selected previously.
Detector: Average, Quasi-peak
7. When Recall Limit is turned on, pass/fail testing will be performed on each sweep based on the standard selected.
Pass: , with green grid border.
Fail: , with red grid border.
Display Icon
The alarm icon is shown at the bottom of the display whenever Recall Limit is turned on.

GSP-9300 User Manual
208
Example Limit line
Pass/Fail and alarm indicator
TraceStandard
8. Press Peak Table[F4] to turn on the peak table function.
The peak table function will split the display and add peak markers to the top ten peaks and list them at the bottom.
Spectrum display
Peak Table

ADVANCED OPERATION
209
9. Press Scale Type[F5] to set the frequency scale to logarithmic or linear. Logarithmic frequency scaling is often used for compliance testing.
10. If any test fails, use the EMI M, EMI E or Voltage Probes functions to find the cause(s) of the test failure. Rectify the causes and then re-test.
Near Field Testing ~ EMI M Probe
Description The EMI M Probe function can be used to narrow down sources of strong magnetic fields before making a radiated compliance test as this function allows you to simulate the radiated emissions from 3 or 10 meters when using any of the GW Instek EMI-M probes.
Magnetic field sources are characterized by high current, low voltage sources, such as PCB traces with high current.
Note The 3m and 10m simulated results are based on the probe factors of the GW Instek EMI M probe antennas, and as such can only be used with a GW Instek M probe.

GSP-9300 User Manual
210
Example Setup With the DUT turned on, scan the DUT with the EMI-E probe parallel to the DUT. The response of the probe from the DUT may fluctuate based on a number of different factors:
The position of the probe
The position of the DUT
The operating state of the DUT
The size of the probe used
The testing frequency/bandwidth of the applied standard
DUTProbe
GSPRF In
Operation 1. Press EMC
Pretest > EMI M Probe[F2]> and choose a frequency band to test at.
EMI M Test Frequency: 30M-300MHz, 300M-1GHz, 30M-1GHz
Correction Set 2. Press Correction[F1] and choose whether to view the near-field test results as is or the simulated radiated results based on the near-field test.
None[F1] No correction is used.
3m[F2] Simulated 3m radiated emission based on the near field emissions.
10m[F3] Simulated 10m radiated emissions.

ADVANCED OPERATION
211
Other factor[F4]
Create, edit or select a correction set to use. This option is useful if a third party M-field antenna is used. See page 54 for details on creating a correction set. This option will not allow you to simulate the 3m or 10m radiated emissions.
Limit Standard 3. Press one of the limit standards to show the limit line for a standard and to start pass/fail testing. These limit lines should only be used for when the 3m or 10m correction sets are used.
EN5502A Euro commercial standard (10m)
EN5502B Euro residential standard (3m)
FCC A American non-residential standard (10m)
FCC B American residential standard (3m)
Pass/fail testing will also be performed on the simulated emissions after each sweep, based on the standard selected.
Pass: , with green grid border.
Fail: , with red grid border.
Display Icon
The alarm icon is shown at the bottom of the display when a standard is selected.

GSP-9300 User Manual
212
Example Limit line
Pass/Fail and alarm indicator
Trace
Standard
Near Field Testing ~ EMI E Probe
Description The EMI E Probe function allows you to perform near field testing of electric fields (E-fields) so that you can narrow down sources of strong electric fields before compliance testing.
These types of fields are usually found on traces connected to high impedance components or on un-terminated cables or tri-state outputs from logic circuits.

ADVANCED OPERATION
213
Example Setup With the DUT turned on, touch the EMI-E probe anywhere on one of the PCB traces, PCB pins, I/O cable pins or one of the other exposed conductors.
Probe
DC Block
RF In
GSP
DUT
Warning When using an EMI-E probe, please make use of a DC block or other limiter to protect the RF input of the spectrum analyzer.
Operation 1. Press EMC
Pretest > EMI E Probe[F3]> and choose a frequency band to test at.
EMI E Test Frequency: 30M-300MHz, 300M-1GHz
2. Next select the type of e-field source that will be used with the E-field probe.
PCBtracePin[F3] For use on PCB traces/pins
I/OCablePin[F4] For use on I/O cabling/pins.
Correction Set 3. Press Correction[F1] and choose the length of the PCB trace/I/O cable. This will help the software to estimate the radiated emissions that would emanate from those points.
For PCBtracePIN None[F1] No correction is used.
20cm trace[F2] For traces of approx. 20cm
15cm trace[F3] For traces of approx. 15cm
10cm trace[F4] For traces of approx. 10cm

GSP-9300 User Manual
214
6cm trace[F5] For traces of approx. 6cm
4cm trace[F6] For traces of approx. 4cm
For I/OCablePIN None[F1] No correction is used.
2m cable[F2] For cables of approx. 2m
1.5m cable[F3] For traces of approx. 1.5m
1m cable[F4] For traces of approx. 1m
0.5m cable[F5] For traces of approx. 0.5m
Limit Standard 4. Press one of the limit standards to show the limit line for a standard and to start pass/fail testing.
EN5502B Euro residential standard (3m)
FCC B American residential standard (3m)
Pass/fail testing will also be performed on the simulated emissions after each sweep, based on the standard selected.
Pass: , with green grid border.
Fail: , with red grid border.
Display Icon
The alarm icon is shown at the bottom of the display when a standard is selected.
Example
Limit line

ADVANCED OPERATION
215
Voltage Probe
Description The voltage probe function is used to perform conducted emissions pretesting of a DUT. The unique advantage of this function is that the conducted emissions pretest can be performed without the need of a LISN.
This function is only to be used with the GW Instek EMI Voltage Probe (GW Instek part number PR-01).
Testing Example To perform this test, touch the voltage probe to the Line, Neutral or Ground lines of the DUT’s input power. The power must be on when this test is performed. For safety purposes a power plug adapter with a pass-through should be used.
Transient LimiterMains power DUT
GSPL
Warning When testing the voltage probe on a line input, a power plug adapter with a pass-through to the Line, Neutral or Ground lines should be used. This adapter will allow you to safely test the input power line. This is not supplied by
Pass through
.

GSP-9300 User Manual
216
GW Instek and should be user-sourced.
Warning The voltage probe should only be used with general electric devices connected to mains power (AC100~240V). When testing, care must be taken to avoid conditions are not prone to lightning, flooding or other dangerous conditions.
Warning Make sure a transient limiter or pulse limiter is used between the probe and the RF input to protect the RF input of the spectrum analyzer.
Operation 1. Press EMC
Pretest > Voltage Probe[F5]> and choose Pretest or Debug.
Pretest The pretest option is used on a live AC line. This will estimate the conducted emissions testing without the use of a LISN device. This function is only supported with the GW Instek voltage probe.
Debug Spot test potential conducted emissions on the AC power components of the DUT. This is useful to analyze the potential sources of conducted RF.
2. Press Scale Type[F3] and select the horizontal scale.
Scale Log, Lin

ADVANCED OPERATION
217
Example
Trace

GSP-9300 User Manual
218
EMS Test
Description The EMS Test function allows you to debug immunity (susceptibility) of a DUT using the GW Instek EMI-M probes. The test function is designed to output a frequency sweep of a user-defined range with a user-defined signal strength.
Example Setup The test setup is simple. Power up the DUT and scan the DUT with the probe. Observe the DUT for any abnormal response from the signal output by the probe.
DUTprobe
GSPTG out
Operation 1. Press EMC
Pretest > EMS Test[F6].
2. Press SRC FreqStart[F2] and set the start frequency of the sweep.
Start Freq. 0Hz - 3GHz
3. Press SRC FreqStop[F3] and set the stop frequency of the sweep. The stop frequency must be 100Hz greater than the start frequency.
Start Freq. 100Hz - 3GHz

ADVANCED OPERATION
219
4. Press Source Strength and set the source output power.
Power: -50dBm ~ 0dBm
Units: dBm, W
5. Press EMS Source[F1] and turn the source on to start testing.
6. Check to see that the DUT is operating correctly when the signal is output from the probe.
Example

GSP-9300 User Manual
220
Limit Line Testing The limit line is used to set the upper or lower amplitude limits over the entire frequency range. The limit lines can be used to detect whether the input signal is above, below or within the limit lines.
The limit lines can be manually or automatically created. The limit lines can be manually edited by frequency or from the trace data or marker points.
Creating a Limit (Point by Point) → from page 220.
Creating a Limit (from Trace Data) → from page 222.
Creating a Limit (from marker data) → from page 223.
Creating a Limit (from marker data) → from page 223
Delete Limit Line → from page 224
Pass Fail Testing → from page 225
Creating a Limit (Point by Point)
Description Create a limit manually, point by point. A maximum of ten points can be used.
Operation 1. Press LimitLine > Edit Select Limit[F1]>Limit Line
[F1] and choose a limit line.
Limit line: 1~5
2. Press Point by Point[F2].
The GSP-9300 is split into two screens. The top screen shows the trace and limit lines and the bottom screen shows the limit line table.

ADVANCED OPERATION
221
Spectrum display
Limit Line Table
3. Press Point Num[F1] and choose a point number to edit with the number pad (must start at #1).
4. Press Frequency[F2] and set the frequency of the point.
5. Press Limit[F3] and set the amplitude level of the point.
All the points will be displayed in a limit line table at the bottom of the display.
6. Repeat steps 3-5 for the remaining points (maximum of 10points. Points can only be created in numerical order).
7. To delete the selected point, press Delete Point[F6].
8. Press Return[F7]>Save Limit Line[F5] to save the currently selected limit line.
Note Note that the limit lines are automatically sorted by frequency (low → high).

GSP-9300 User Manual
222
Creating a Limit (from Trace Data)
Description Trace data can be used to create limit lines. A 10 point limit line is created from the trace data at each grid division as well as the start and stop frequencies.
Operation 1. Press LimitLine > Edit Select Limit[F1]>Limit Line
[F1] and choose a limit line.
Limit line: 1~5
2. Press Trace Data to Limit Line[F3].
The GSP-9300 is split into two screens. The top screen shows the trace and limit lines and the bottom screen shows the limit line table.
Spectrum display
Limit Line Table
3. Press Limit Offset[F2] and set an offset level.
4. Press Create Limit Line Now[F1].
A limit line will automatically be created based on the trace and offset level.
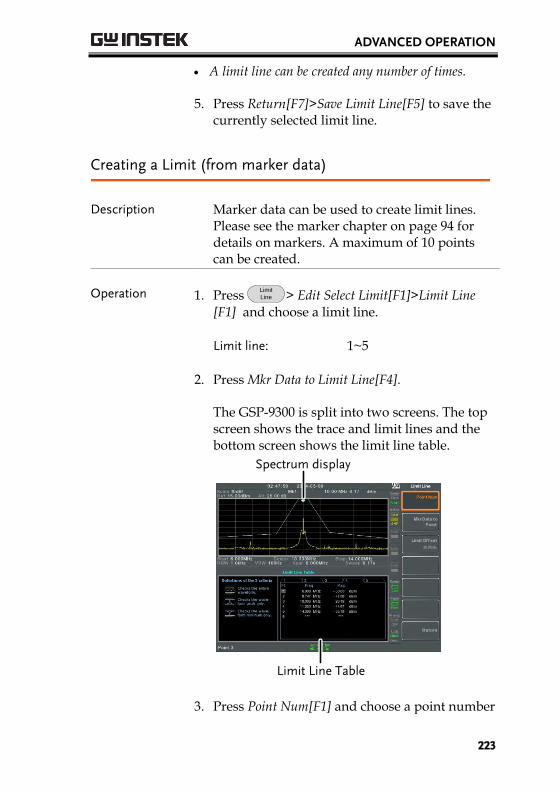
ADVANCED OPERATION
223
A limit line can be created any number of times.
5. Press Return[F7]>Save Limit Line[F5] to save the currently selected limit line.
Creating a Limit (from marker data)
Description Marker data can be used to create limit lines. Please see the marker chapter on page 94 for details on markers. A maximum of 10 points can be created.
Operation 1. Press LimitLine > Edit Select Limit[F1]>Limit Line
[F1] and choose a limit line.
Limit line: 1~5
2. Press Mkr Data to Limit Line[F4].
The GSP-9300 is split into two screens. The top screen shows the trace and limit lines and the bottom screen shows the limit line table.
Spectrum display
Limit Line Table
3. Press Point Num[F1] and choose a point number

GSP-9300 User Manual
224
to edit (must start at #1).
4. Press Limit Offset[F3] and set the offset level for the point.
This will only create an offset for the currently selected point, not all the points.
5. Press Mkr Data to Point[F2].This adds the currently active marker’s position to the selected point.
6. The marker position can be moved at this point using the scroll wheel. Press the Enter key to set the position.
7. Repeat steps 3-6 for any other points (max 10).
8. Press Return[F7]>Save Limit Line[F5] to save the currently selected limit line.
Note Using this function will also change the position of marker 1 outside of the limit function.
Delete Limit Line
Description Any one of the 5 limit lines can be deleted.
Activate Correction
1. Press Limit Line > Edit Select Limit[F1]>Limit
Line[F1] and choose a limit line (limit line 1~5) to delete.
2. Press Delete Limit Line[F6]. The data from the chosen limit line will be deleted.

ADVANCED OPERATION
225
Pass Fail Testing
Description Before pass/fail testing can begin, limit lines for the upper and lower limits must first be saved. See page 220, 222 & 223 to save limit lines.
Operation 1. Press Limit Line >Pass/Fail Test.
2. To set a high limit, press High Limit[F1] and choose one of the limit lines as the upper (high) limit.
3. To set the low limit, press Low Limit[F2] and select one of the limit lines as the lower limit.
4. Press Pass Criterion[F3] and select the pass criteria.
Criteria: All-In, Max-In, Min-In
5. Press Pass/Fail Mode[F5] to select what the GSP-9300 will do on a fail judgment. Single will stop testing after a single fail. Continue will continue testing after each fail judgment.
Pass/Fail Mode: Single, Continue
6. Press Pass/Fail Test[F4] and turn the testing on.
7. The test result appears in the bottom of the display, and the high and low limit lines (if enabled) appear on the display.
Pass: , with green grid border.
Fail: , with red grid border.
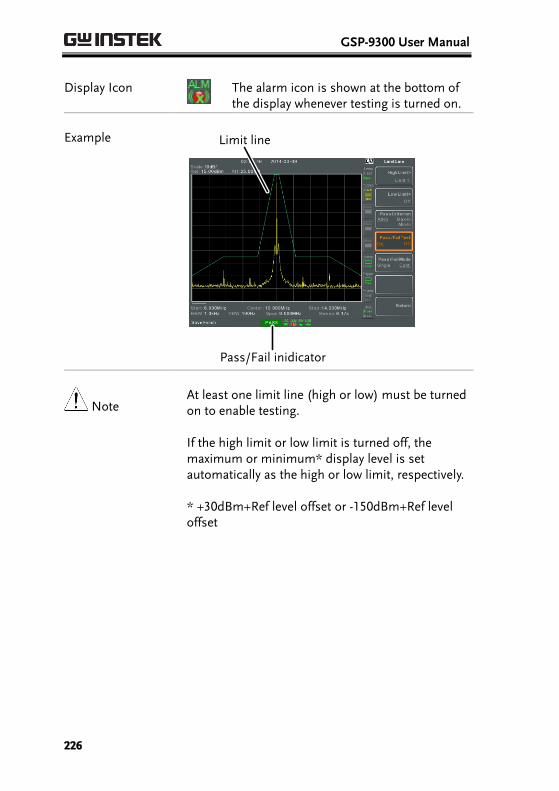
GSP-9300 User Manual
226
Display Icon
The alarm icon is shown at the bottom of the display whenever testing is turned on.
Example Limit line
Pass/Fail inidicator
Note At least one limit line (high or low) must be turned on to enable testing.
If the high limit or low limit is turned off, the maximum or minimum* display level is set automatically as the high or low limit, respectively. * +30dBm+Ref level offset or -150dBm+Ref level offset

ADVANCED OPERATION
227
Sequence The Sequence function records and plays back user-defined macros. There are up to 5 sequences available in repeat or single running mode, with up to 20 steps each. Delays and pauses can also be introduced into a sequence to view measurement results during a sequence. Sequences can also call other sequences to create longer sequences. The sections below can be used to skip to the relevant section:
Edit Sequence → from page 227
Run Sequence → from page 231
Editing a Sequence
Edit a Sequence 1. Press Sequence > Sequence[F1] and choose a sequence to edit/create.
Sequence: 1~5
2. Press Edit[F2]>Start Edit[F1] to start editing the selected sequence.
3. The display splits into two screens. The top screen shows the main screen. The bottom screen shows the Sequence Editor with the sequence steps.
The icon appears in the sequence editor window.

GSP-9300 User Manual
228
Sequence Editor window
Main displayStart Edit/
Stop Edit iconSequence function
menu
Add a Step Up to 20 steps can be added to each sequence. Each panel operation is recorded as a step. After each panel operation is performed, press
the Enter key to record the step (in some cases this is not necessary – check if the operation appears in the sequence editor window). In the following example the center frequency and span are added as steps to a sequence:
1. Press Frequency >Center Freq[F1]>20MHz> Enter .
2. Press Span >Zero Span[F3]> Enter .
3. The two operations are added to the Sequence Editor.
4. Press the Sequence key again to return to the sequence function menu.

ADVANCED OPERATION
229
Note The arrow keys can be used to move the cursor to the desired step when in the Sequence menu.
Add Delay to Sequence
The delay function adds a delay between steps.
1. Press Delay Time[F2]> and enter the delay time.
Range: 100ms ~ 10s
2. Press Enter to add the delay time to the sequence editor.
The delay time will be inserted as a step.
Note The arrow keys can be used to move the cursor to the desired step.
Pause Sequence The Wait to Go function is used to pause a sequence until Continue[F1] is pressed. This is useful for observing measurements before moving onto the next step.
1. Press Wait to Go[F3]> Enter .
Wait to Go will be inserted as a step.
2. When a sequence is running, Press Continue[F1] to resume running the sequence.

GSP-9300 User Manual
230
Insert Sequence Inserts another sequence into the current sequence.
1. Press Do Sequence[F4]> and select a sequence to insert into the current sequence.
The selected sequence will be inserted as a step.
Note The current sequence cannot be inserted into itself.
Delete Step Any step in the Sequence Editor can be deleted.
1. Use the arrow keys on the front panel to highlight the step you wish to delete.
2. Press Delete Step[F5] > to delete the step.
The selected step will be removed from the Sequence editor.
Stop Editing 1. Press Stop Edit[F6].
2. The icon turns off.

ADVANCED OPERATION
231
Save Current Sequence
After a sequence has been edited (and stopped) it can be saved.
1. Press Sequence >Save Sequence[F4] > to save the sequence.
2. The selected sequence will be saved.
Delete Current Sequence
1. Press Sequence >Delete Sequence [F5] > to delete the current sequence.
Running a Sequence
Run Mode 1. Press Sequence > Sequence[F1] and choose a sequence.
2. Press Run Mode[F6] and toggle the run mode:
Single Runs the sequence once only.
Cont. Runs the sequence continually until Stop Running Sequence[F7] is pressed (Note: the Stop Running Sequence[F7] option only appears when the sequence is running)
Run Sequence 3. Press Run Now[F7] to start running the selected sequence.
4. Press Stop Running Sequence[F7] to stop the sequence.
In single mode the sequence will stop running when all steps have finished.

GSP-9300 User Manual
232
Tracking Generator The tracking generator is a factory installed option that generates a sweep signal with its sweep time and frequency range matching the GSP-9300. The amplitude is maintained at a constant value over the entire frequency range. This is useful for testing the frequency response of a DUT.
Activate the Tracking Generator → from page 232
Normalize the Tracking Generator → from page 233
Activate Tracking Generator
Operation 1. Press Option Control >Tracking Generator[F1]>TG[F1] and
toggle the tracking generator on.
The TG OUTPUT will be activated.
2. Press TG Level[F2] to set the output level of the tracking generator.
Range: -50 to 0dBm
3. Press TG Lvl Offset[F3] to set the offset level of the tracking generator to compensate for system gain/loss.
Range: 0dB to 50dB
4. Press TG Lvl Step[F4] to set the step resolution of the TG level.
Range: Auto, Man; 0.5 to 50dB, 0.5dB step
5. Press Power Sweep[F5] to vary the output power of the TG to the rate of the sweep. At the beginning of the sweep, the output power is at

ADVANCED OPERATION
233
the set TG Level and increases/decreases linearly to the set Power Sweep level at the end of the sweep.
Range: -5dB to +5dB
Normalize the Tracking Generator
Background The normalize function subtracts the trace after each sweep with a reference trace. The resultant trace is added to a normalized reference level.
Connection When normalizing the TG output, connect the TG output directly to the RF input.
After normalization, connect the DUT to the tracking generator and connect the output of the DUT to the RF input.
GSP
DUT
TG OUTPUT
RF INPUT
Normalization
Operation 1. Press Option Control >Tracking Generator[F1]>TG[F1] and
toggle the tracking generator on.
2. Press Normalize[F6] to enter the Normalization menu.
3. Press Norm. Ref. Level[F2] to set the vertical level of the normalized reference.
Range: -100dB~100dB

GSP-9300 User Manual
234
4. Press Norm. Ref. Position[F3] offsets the normalized trace on the screen.
Range: 10~0 grid divisions. (top to bottom)
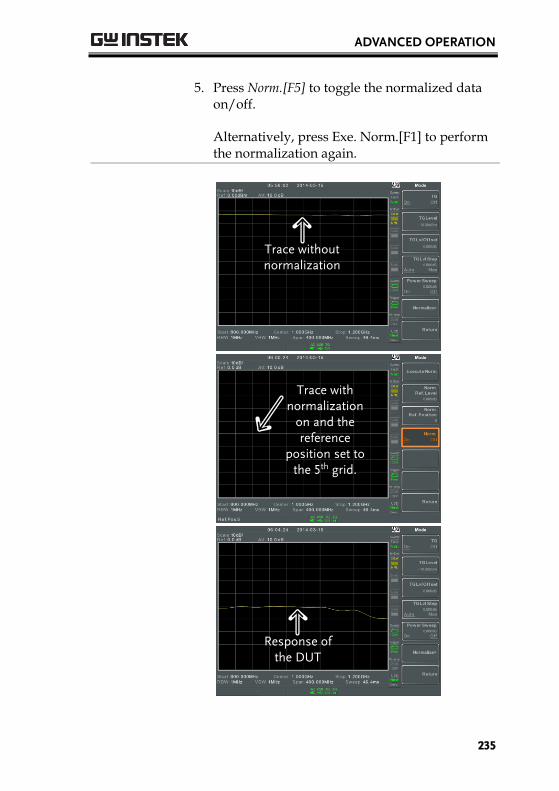
ADVANCED OPERATION
235
5. Press Norm.[F5] to toggle the normalized data on/off.
Alternatively, press Exe. Norm.[F1] to perform the normalization again.
Trace without normalization
Trace with normalization
on and the reference
position set to the 5th grid.
Response of the DUT

GSP-9300 User Manual
236
Note The normalized data will be turned off automatically if any X-axis related parameters are changed or if the TG output level is changed.
The warning message, “Execute Normalization again!” will appear under these circumstances.

ADVANCED OPERATION
237
Power Meter When using the optional power meter, the GSP can measure and log the average signal power level of a DUT from -32dBm ~ +20dBm over an operating frequency range of 1Mhz to 6.2GHz.
Activating Power Meter Mode → from page 237
Data Logging Power Meter Measurements → from page 239
Activating Power Meter Mode
Connection Connect the power meter (PWS-06) to the front panel USB A port on the GSP-9300.
Connect the RF source to the power meter.
GSP
PWS-06
USB A PORT
RF SOURCE
Operation 1. Press Option Control > Power Meter[F2]>Power Meter[F1]
and toggle the power meter on.
Note The power meter option will not be available if the power meter is not connected properly.
2. The display splits into two screens. The top screen shows the power measurement in dBm or W. The bottom screen shows a graph of the measurements.

GSP-9300 User Manual
238
Data log of power measurements
Power meter measurement
Power meter bar
3. Press Power Unit[F2] and choose the unit:
Unit dBm, W
4. Press Frequency[F3] choose measurement frequency (use the number pad):
Frequency 1MHz~6200MHz
Resolution: 1MHz
5. Press Sensor Mode[F4] to choose measurement speed (and thus accuracy) of the power meter:
Low Noise: 100ms/sample, typical
Fast: 30ms/sample, typical
6. To create pass fail tests, press Pass/Fail Test[F5] and set the following parameters:
High Limit[F1]: -30dBm~20dBm
Low Limit[F2]: -30dBm~20dBm
Pass/Fail Test[F3]: On, Off
Pass Icon:

ADVANCED OPERATION
239
Fail Icon:
7. Press More[F6]>Trigger[F1] to toggle between a free run (internal) trigger and an external trigger.
Trigger: Free, Ext
Ext trigger input: 3.3V CMOS
8. Press More[F6]> MAX/MIN HOLD[F2] to toggle the MAX/MIN hold measurements on/off in the power meter bar.
The MIN/MAX measurements will be displayed in the power bar meter in the center of the screen.
MIN HOLD measurement
MIN HOLD measurement
Note The return to the normal Spectrum Mode, turn the
power meter off by pressing Option Control > Power
Meter[F2]>Power Meter[F1] and toggle the power meter off.
Data Logging Power Meter Measurements
Description When in Power Meter mode, the spectrum analyzer is able to log the power meter measurements over a user-defined time period at user-defined intervals.
Operation 1. Press Save to enter the save menu.
2. Press Type[F2] and select Power Meter[F7].

GSP-9300 User Manual
240
3. Data Source[F3] will automatically be set to Power State.
4. Press PMET Record Option[F4] and set the recording options:
Record Stop[F1]: Sets the recording time for automatic data logging: 00 :00 :00 (continuous) or 00 :00 :01 ~ 23 : 59: 59
Record Step[F2]: 20msec ~ 999sec
5. Press Save To[F1] and select a destination source:
Local: Internal memory
SD Card: External micro SD card
Note The micro SD card option will only be available when a micro SD card is inserted into the front panel port.
6. After a destination has been selected, recording options appear.
7. To name the log file, press Name[F1]. Name the selected file using the F1~F7 keys, as shown below or use the numeric keypad to enter numbers.
7 8 9
654
1 2 3
/0
Limitations:
No spaces
Only 1~9, A~Z, a~z characters allowed

ADVANCED OPERATION
241
ABCDE
FGHIJ
KLMNO
PQRST
UVWXY
Z
A
C
D
E
B
Lowercase
Return
a
c
d
e
b
Return
Name>
Return
8. The filename appears on the bottom of the screen as it is created.
Filename
Press Enter to confirm setting the filename.
Note If the file name is not user-defined, a file name will be automatically created in the following format:
File name: type_data source_file number.file extension
The file number parameter is incremented each time the same file type is created.
9. To start recording power meter measurements, press Record Now[F3].
A message “SaveFinish‼” will be displayed at the bottom of the screen when the recording has finished.

GSP-9300 User Manual
242
Stop Recording To manually stop the recording, press Record Stop[F2].

ADVANCED OPERATION
243
Demo Kit The demo kit is an ASK and FSK generator. The demo kit has three pre-set frequencies, a number of baud rates and the ability to output in normal mode, gated mode or in one of 5 selectable data sequences.
Amplitude shift keying → from page 243.
Frequency shift keying → from page 245.
Amplitude Shift Keying
Connection Connect the demo kit to the front panel USB A port on the GSP-9300.
Connect the demo kit output to the RF input on the GSP-9300.
GSP
DEMO KIT
USB A PORT
RF INPUT
Setup 1. Press Option Control > Demo Kit[F4]>Demo Kit[F1] and
toggle the demo kit on.
Note The demo kit option will not be available if the demo kit is not connected properly.
2. Press Modulation[F2] and select ASK[F1].
3. Press Frequency[F3] and select the frequency:
Frequency 315MHz, 433MHz, 868MHz

GSP-9300 User Manual
244
4. Press Baudrate[F5] and select the baud:
Baud 4800, 9600, 20000
5. Press Output Mode[F6] and select gated, normal mode or fixed data. The gated and normal modes will output random data while the fixed data option will output one of 5 pre-defined data sequences.
Output mode Norm., Gated (100ms period, 16ms on, 84ms off), Fixed data.
6. If fixed data was chosen for the output mode, select the data sequence.
Data sequence for Fixed Data
Seq1(00110101), Seq2(10100101), Seq3(00010010), Seq4(11011100), Seq5(10101010).
Note The data sequence above can be decoded in the ASK/FSK demodulation function. Go to Measure>Demod>ASK/FSK>View>Symbol to see the output sequence.
Operation The following will demonstrate how to observe the ASK signal that was generated above.
This will assume the following settings were set:
ASK modulation, frequency=315MHz, Baudrate=4800, Output Mode=Normal
1. Press Frequency >Center[F1] and set the center

ADVANCED OPERATION
245
frequency to 315MHz.
2. Press Span >Span[F1] and set the span to 200kHz.
3. Press Measure >Demod[F2]>ASK[F4] and toggle
ASK on.
See page 144 for setting details.
Frequency Shift Keying
Connection Connect the demo kit to the front panel USB A port on the GSP-9300.
Connect the demo kit output to the RF input on the GSP-9300.
GSP
DEMO KIT
USB A PORT
RF INPUT
Setup 1. Press Option Control > Demo Kit[F4]>Demo Kit[F1] and
toggle the demo kit on.
Note The demo kit option will not be available if the demo kit is not connected properly.
2. Press Modulation[F2] and select FSK[F2].
3. Press Frequency[F3] and select the frequency:
Frequency 315MHz, 433MHz, 868MHz

GSP-9300 User Manual
246
4. Press Deviation[F4] and select the frequency deviation:
Deviation 25MHz, 50MHz
5. Press Baudrate[F5] and select the baud:
Baud 4800, 9600, 20000
6. Press Output Mode[F6] and select gated, normal mode or fixed data. The gated and normal modes will output random data while the fixed data option will output one of 5 pre-defined data sequences.
Output mode Norm., Gated (100ms period, 16ms on, 84ms off), Fixed data.
7. If fixed data was chosen for the output mode, select the data sequence.
Data sequence for Fixed Data
Seq1(00110101), Seq2(10100101), Seq3(00010010), Seq4(11011100), Seq5(10101010).
Note The data sequences above can be decoded in the ASK/FSK demodulation function. Go to Measure>Demod>ASK/FSK>View>Symbol.
Operation The following will demonstrate how to observe the FSK signal that was generated above.
This will assume the following settings were set:
ADVANCED OPERATION
247
FSK modulation, frequency=315MHz, Deviation=25MHz, Baudrate=4800, Output Mode=Norm.
1. Press Frequency >Center[F1] and set the center frequency to 315MHz.
2. Press Span >Span[F1] and set the span to 200kHz.
3. Press Measure >Demod[F2]>FSK[F5] and toggle
FSK on.
See page 150 for setting details.
GSP-9300 User Manual
248
FILE
File Overview The File function is used for basic file related operations including navigation, sorting copying and deleting. The GSP-9300 has a number of different file formats for trace data, limit lines, amplitude correction, sequences and other panel operations. File source and destination locations (local, USB or micro SD) can also be chosen with the file function.
File Type Overview → from page 249
File Types → from page 250
Using the File Explorer → from page 251
Copy Files → from page 254
Move Files → from page 254
Delete Files → from page 255
Rename Files→ from page 256
Save Files → from page 258
Recall Files → from page 261
Quick Save → from page 263

FILE
249
File Type Overview
Local The GSP-9300 has 16MB of local memory to save data to.
USB The GSP-9300 can save to an external USB flash memory drive.
USB Type: 1.1/2.0 (FAT32 and NTFS formatted)
Micro SD The GSP-9300 can save to a micro SD card.
Format: SDSC, SDHC (FAT32 formatted)

GSP-9300 User Manual
250
File Types
Overview The file types are listed in order as shown in the File menu.
State State data contains the state of the each of the panel operations:
Frequency
Span
Amplitude
BW/AVG
Sweep
Trace
Display
Measure
Limit Line
Sequence
Trigger
Marker
Marker
Peak Search
Preset
System
Trace Trace data contains the trace data in comma separated values.
Center frequency
Span
Resolution Bandwidth
Video Bandwidth
Reference Level
Sweep Time
Point number (trace data points)
Screen Contains the JPEG file of the display (800X600)
Limit Line The limit line data contains the following in comma separated values:
Point number
Frequency value of point
Magnitude of point
Magnitude unit

FILE
251
Correction Correction data contains the following correction (line) data:
Point number
Frequency value of point
Gain offset of point
Unit
Sequence The sequence files contain the sequence number and step operations for that sequence. This data is not designed to be user editable.
Tracking Generator
The TG data contains:
TG level
TG level offset
TG level step
Power sweep state and value
Normalized reference level
Normalized reference position
Normalized state
Power Meter The power meter data contains:
Date
Time
Power in dBm
Start time/end time
Step time
Using the File Explorer
Connect External Memory
To view files on a USB flash drive or micro SD card, insert the appropriate device into the front panel port.
Selecting files 1. Press File >File Explorer.
2. Select memory location:

GSP-9300 User Manual
252
Local[F1]: Internal memory
USB[F2]: Front panel USB memory.
SD Card[F3]: Micro SD card.
3. The up/down arrow keys or the scroll wheel can be used to move up/down the file list.
4. The left/right arrow keys can be used to move to the next/previous page of files in the file list.
Note The USB and micro SD card options will only be available when a flash drive/SD card is inserted into the front panel ports.
View Files by Type The file explorer can be configured to only view files of a certain type. For details on file types, please see page 249.
1. Press Type[F2] and select a file type to view:
All All file types can be viewed
State View state files only
Trace View trace files only
Screen View screen shots only
Limit Line View limit lines only
Correction View correction data only
Sequence View sequence files only
Power Meter View power meter files only
After selecting a file type, only those types of files will be listed by the file explorer.

FILE
253
Sort Files Files can be sorted in ascending order by either name or by date. By default, files are sorted by name.
1. Press Sort By[F3] and choose the sorting type:
Name: Sort by alphabetical order
Date Sort by file creation date
Preview Image Files
Image files can be previewed on the screen by enabling the preview function.
1. Press More[F7]>Preview[F2] and toggle preview on or off.
Example
Note W hen Preview is turned on, other file types will not be viewable.

GSP-9300 User Manual
254
Copy Files
Description Files from local memory can be copied to external memory such as a USB flash drive or micro SD card and vice versa.
Connect External Memory
Insert either a USB flash drive or micro SD card into the front panel ports.
Selecting files 1. Press File >File Explorer.
2. Select a file from local or external memory.
3. Press Copy to[F4].
4. Press Media [F1] and select the destination to copy to (local, USB, SD card).
5. Press Copy Now [F2].
6. The file is copied to the destination directory.
Note The USB and micro SD card options will only be available when a flash drive/SD card is inserted into the front panel ports.
Move Files
Description Files from local memory can be moved to external memory such as USB or micro SD card and vice versa.
Connect External Memory
Insert either a USB flash drive or micro SD card into the front panel connectors.

FILE
255
Selecting files 1. Press File >File Explorer.
2. Select a file from local or external memory.
3. Press Move to[F7].
4. Press Media [F1] and select the destination to move to (local, USB, SD card).
5. Press Move Now [F2].
6. The file is moved to the destination.
Note The USB and micro SD card options will only be available when a flash drive/SD card is inserted into the front panel ports.
Delete Files
Description Any files in local memory or external memory such as USB or micro SD card can be deleted.
Connect External Memory
To delete files on a USB flash drive or micro SD card, insert the appropriate device into the front panel port.
Delete File 1. Press File >File Explorer.
2. Select a file from local or external memory.
3. Press Delete[F5].
4. Press Delete Now[F1].
5. By default you will be asked to confirm any files marked for deletion. Choose No[F1] to cancel or Yes[F2] to confirm the deletion.

GSP-9300 User Manual
256
Delete Warning 1. To disable the prompt to confirm the deletion of a file, press Delete Warning[F2] and select an option:
Don’t Ask The user won’t be prompted to confirm when a file is deleted.
Ask Will prompt for the user to confirm whether to delete the file or not.
Note The USB and micro SD card options will only be available when a flash drive/SD card is inserted into the front panel ports.
Rename Files
Description Any files in local memory or external memory such as USB or micro SD card can be renamed.
Connect External Memory
To rename files on a USB flash drive or micro SD card, insert the appropriate device into the front panel ports.
Rename File 1. Press File >File Explorer.
2. Select a file from local or external memory.
3. Press Rename[F6].
4. Rename the selected file using the F1~F7 keys, as shown below or use the numeric keypad to enter numbers:
7 8 9
654
1 2 3
/0

FILE
257
Limitations:
No spaces
Only 1~9, A~Z, a~z characters allowed
ABCDE
FGHIJ
KLMNO
PQRST
UVWXY
Z
A
C
D
E
B
Lowercase
Return
a
c
d
e
b
Return
Rename>
Return
Cancel renaming the file
5. The filename appears in the list as it is renamed.
Filename
6. Press Enter to confirm the renaming of the file.
Note The USB and micro SD card options will only be available when a flash drive/SD card is inserted into the front panel ports.

GSP-9300 User Manual
258
Save Files
Description Any function settings or configurations that have been applied to the spectrum analyzer can
be saved using the Save key.
Connect External Memory
To save files on a USB flash drive or micro SD card, insert the appropriate device into the front panel ports.
Note To save power meter data (data logging) please see page 239. Saving power meter data will not be described in this chapter.
Save File 1. Press Save to enter the Save menu.
2. Press Type[F2] and select a file type to save. See page 249 for details on file types:
State: State data
Trace: Trace data
Screen: Screen shots
Limit Line: Limit line data
Correction: Correction data
Sequence: Sequence files
Power meter Power meter data* *see page 239 for details.
3. Press Data Source[F3] to select a data source for the file type if possible:
For state data: Local state data (fixed, not selectable)
For trace data: Trace1~4

FILE
259
For screen shots: Normal: Screen shot is saved as is Save Toner: inverts the image file color to reduce ink when printing.
For limit line: Limit line 1~5
For correction: Correction data 1~5
For sequence: Sequence 1~5
For power meter: Power state* *see page 239 for details.
4. For trace data, press Format[F4] to select the format type to save:
Trace: Save trace data only
Trace+State: Save trace and state data
5. Press Save To[F1] and select a destination source:
Register 1~6: Internal memory registers, these internal registers are not part of local memory
Local: Internal memory
USB: External memory
SD Card: External micro SD card
6. After a destination has been selected, the file can be named or saved immediately.
7. To name the selected file, press Name[F5]. Name the selected file using the F1~F7 keys, as shown below or use the numeric keypad to enter numbers.:
7 8 9
654
1 2 3
/0
Limitations:
No spaces
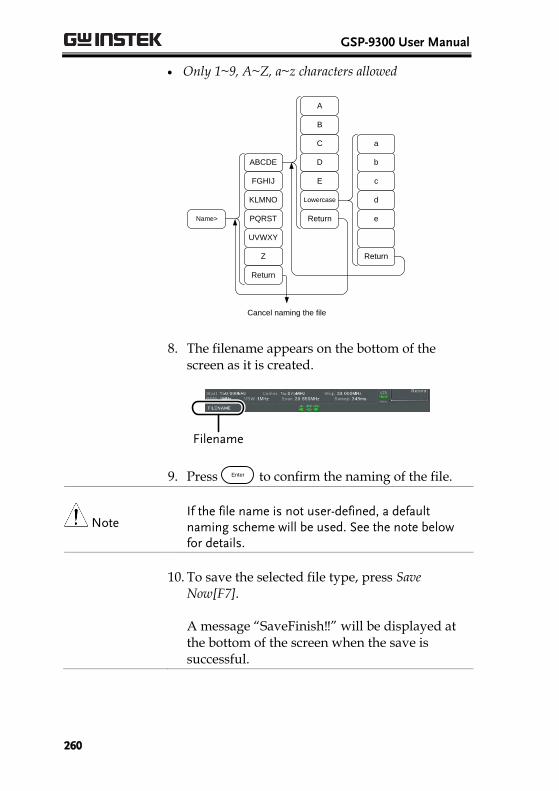
GSP-9300 User Manual
260
Only 1~9, A~Z, a~z characters allowed
ABCDE
FGHIJ
KLMNO
PQRST
UVWXY
Z
A
C
D
E
B
Lowercase
Return
a
c
d
e
b
Return
Name>
Return
Cancel naming the file
8. The filename appears on the bottom of the screen as it is created.
Filename
9. Press Enter to confirm the naming of the file.
Note If the file name is not user-defined, a default naming scheme will be used. See the note below for details.
10. To save the selected file type, press Save Now[F7].
A message “SaveFinish‼” will be displayed at the bottom of the screen when the save is successful.

FILE
261
Note If the file name is not user-defined, a file name will be automatically created in the following format for data files:
File name: Type_data source_XX.file extension
The image file names will be automatically created in the following format:
File name: QuickJpgX.jpg
The X parameter is incremented each time the same file type is created.
Note The USB and micro SD card options will only be available when a flash drive/SD card is inserted into the front panel ports.
*The power meter option will only be available if the power meter option is plugged in. See the Power Meter section on page 237 for power meter details.
Recall Files
Description Most files that have previously saved a setting
or state can be recalled using the Recall key.
The exception to this are the data logging settings, see page 237.
Connect External Memory
To recall files from a USB flash drive or micro SD card, insert the appropriate device into the front panel ports.
1. Press Recall to enter the Recall menu.
2. Press Type[F2] and select a file type to recall.
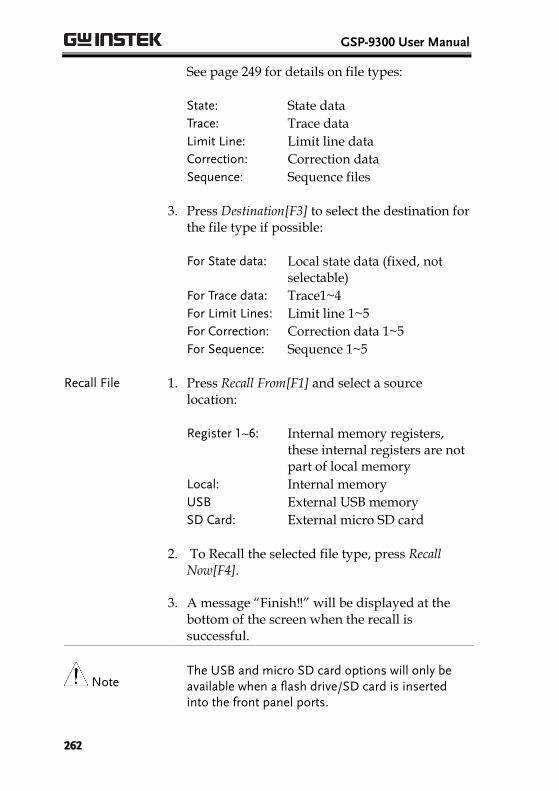
GSP-9300 User Manual
262
See page 249 for details on file types:
State: State data
Trace: Trace data
Limit Line: Limit line data
Correction: Correction data
Sequence: Sequence files
3. Press Destination[F3] to select the destination for the file type if possible:
For State data: Local state data (fixed, not selectable)
For Trace data: Trace1~4
For Limit Lines: Limit line 1~5
For Correction: Correction data 1~5
For Sequence: Sequence 1~5
Recall File 1. Press Recall From[F1] and select a source location:
Register 1~6: Internal memory registers, these internal registers are not part of local memory
Local: Internal memory
USB External USB memory
SD Card: External micro SD card
2. To Recall the selected file type, press Recall Now[F4].
3. A message “Finish‼” will be displayed at the bottom of the screen when the recall is successful.
Note The USB and micro SD card options will only be available when a flash drive/SD card is inserted into the front panel ports.

FILE
263
Quick Save
Description The QuickSave key is a hot key to save files with a
single press.
The type of file that is saved is pre-configured
with the Save key.
By default, the QuickSave the key will save screen
shots to the local memory or to an external flash drive (if inserted).
Supported File Types
Screen, trace, state, limit line, correction, sequence, power meter*.
*power meter accessory must first be installed before it can be saved.
Connect External Memory
To save files to a USB flash drive or micro SD card, insert the appropriate device into the front panel ports.
Quick Save Setup 1. Press the Save key and configure the file Type,
Data Source and Format. See page 258 for details.
Using the Quick Save key
1. Press QuickSave at any time to save the selected file
type using the settings above.
2. A “Save Finish‼” message will be shown at the bottom of the screen when the save has been completed.

GSP-9300 User Manual
264
Note The file name will be automatically created in the following format for data files:
File name: Type_data source_XX.file extension
The image file names will be automatically created in the following format:
File name: QuickJpg_XX.jpg
The XX parameter is incremented each time the same file type is created.
Note The USB and micro SD card options will only be available when a flash drive/SD card is inserted into the front panel ports.
REMOTE CONTROL
265
REMOTE CONTROL This chapter describes basic configuration of IEEE488.2 based remote control. For a command list, refer to the programming manual, downloadable from the GW Instek website, www.gwinstek.com
Interface Configuration .................................................. 266 Configure to USB Remote Interface ................................................................... 266 Configure GPIB Interface .................................................................................... 266 Configure the LAN and LXI Interface ............................................................... 267 Configure the WLAN Interface ........................................................................... 270 Configure RS232C ................................................................................................. 275 RS232C Remote Control Function Check ......................................................... 275 LXI Browser Interface and Function Check ..................................................... 277 GPIB/LAN/USB Control Function Check ...................................................... 280

GSP-9300 User Manual
266
Interface Configuration
Configure to USB Remote Interface
USB configuration
PC side connector
Type A, host
GSP side connector
Rear panel Type B, slave
Speed 1.1/2.0 (full speed/high speed)
USB Class USB TMC (USB T&M class)
Panel operation 1. Connect the USB cable to the rear panel USB B port.
2. Press System >More[F7]>RmtInterface
Config[F1]>USB Mode and toggle the USB mode to Device.
Note It may take a few moments to switch USB modes.
Configure GPIB Interface
To use GPIB, the optional GPIB port must be installed.
Configure GPIB 1. Ensure the spectrum anlayzer is off before proceeding.
2. Connect a GPIB cable from a GPIB controller to the GPIB port on the spectrum analyzer.
3. Turn the spectrum analyzer on.
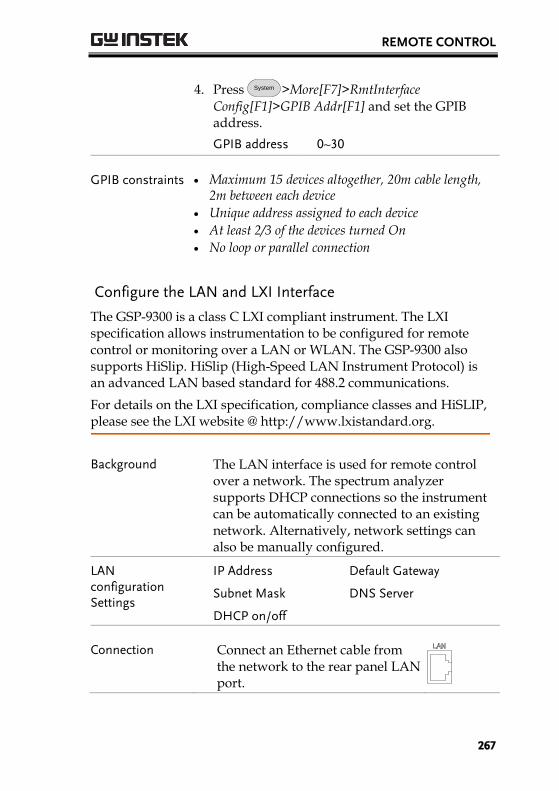
REMOTE CONTROL
267
4. Press System >More[F7]>RmtInterface
Config[F1]>GPIB Addr[F1] and set the GPIB address.
GPIB address 0~30
GPIB constraints Maximum 15 devices altogether, 20m cable length, 2m between each device
Unique address assigned to each device
At least 2/3 of the devices turned On
No loop or parallel connection
Configure the LAN and LXI Interface
The GSP-9300 is a class C LXI compliant instrument. The LXI specification allows instrumentation to be configured for remote control or monitoring over a LAN or WLAN. The GSP-9300 also supports HiSlip. HiSlip (High-Speed LAN Instrument Protocol) is an advanced LAN based standard for 488.2 communications.
For details on the LXI specification, compliance classes and HiSLIP, please see the LXI website @ http://www.lxistandard.org.
Background The LAN interface is used for remote control over a network. The spectrum analyzer supports DHCP connections so the instrument can be automatically connected to an existing network. Alternatively, network settings can also be manually configured.
LAN configuration Settings
IP Address Default Gateway
Subnet Mask DNS Server
DHCP on/off
Connection Connect an Ethernet cable from the network to the rear panel LAN port.

GSP-9300 User Manual
268
Settings 1. Press System >More[F7]>RmtInterface[F1]>
LAN[F2]>LAN Config[F1] to set the LAN settings:
IP Address[F1] Sets the IP address.
Subnet Mask[F2] Sets the subnet mask.
Default Gateway[F3]
Sets the default gateway.
DNS Server[F4] Sets the DNS server address
LAN Config[F5] Toggles the LAN configuration between DHCP and manual settings.
Hint: Use dotted decimal notation when entering IP addresses, ie., 172.16.20.8
2. Press Apply[F6] to confirm the LAN configuration settings.
Display Icon
The LXI icon turns green when connected to a LAN and will flash if the “Identification” setting is on, see page 277.
Set Password The password on the LXI webpage can be set from the spectrum analyzer. The password is shown in the system information.
By default the password is set to: lxiWNpwd
1. Press System >More[F7]>RmtInterface
Config[F1]>LAN[F2]>LXIPassword[F3] to set the password.
2. Enter the password using the F1~F7 keys, as shown below, or use the numeric keypad to enter numbers:
7 8 9
654
1 2 3
/0

REMOTE CONTROL
269
Limitations:
No spaces
Only 1~9, A~Z, a~z characters allowed
ABCDE
FGHIJ
KLMNO
PQRST
UVWXY
Z
A
C
D
E
B
Lowercase
Return
a
c
d
e
b
Return
Rename>
Return
Cancel password
Menu tree to enter the password
3. The password appears on the bottom of the screen as it is created.
Password
4. Press Enter to confirm setting the password.
Hi SLIP Port 1. Press System >More[F7]>RmtInterface Config[F1]>LAN[F2] >HiSLIPPort to see the Hi Slip Port number.
HiSlip port 4880
GSP-9300 User Manual
270
Reset LAN It may be necessary to reset the LAN configuration settings before the LAN can be used.
1. Press System >More[F7]>RmtInterface Config[F1]>LAN Reset[F3] to reset the LAN.
2. The GSP-9300 will now automatically reboot.
Note Each time the LAN is reset, the default password is restored.
Default password: lxiWNpwd
Configure the WLAN Interface
The WLAN settings operate using any standard 3G USB modem. For remote locations, using a 3G modem allows you to access the GSP-9300 web server or to control the GSP-9300 via remote control commands.
Background To use the GSP-9300 as a server using a 3G modem, you must first obtain a fixed IP address from a network provider. Each provider will assign different fixed IP addresses.
WLAN configuration Settings
IP Address Default Gateway
Subnet Mask DNS Server

REMOTE CONTROL
271
Connection Connect the 3G USB modem to the front panel USB A port.
The 3G status icon will appear when the 3G USB adapter is connected. When it is first connected it will be grayed-out to indicate that it is connected but not activated.
GSP
3G USB Adapter
USB A PORT
Settings 1. Insert the 3G USB modem into the front panel
USB A port and wait for the 3G USB icon to appear.
2. Press System >More[F7]>RmtInterface[F1]>
LAN[F2]>WLAN Config[F2]>Apply[F6] and wait for the 3G USB modem to establish the WLAN settings.
“Finish‼”, is shown when the configuration is complete.
3. The network settings will be displayed in the System menu icons.

GSP-9300 User Manual
272
WLAN settings
Display Icon
The 3G USB icon turns green when a successful connection has been made.
Set Password The password on the LXI webpage can be set from the spectrum analyzer. The password is shown in the system information.
By default the password is set to: lxiWNpwd
4. Press System >More[F7]>RmtInterface
Config[F1]>LAN[F2]>LXIPassword[F3] to set the password.
5. Enter the password using the F1~F7 keys, as shown below, or use the numeric keypad to enter numbers:
7 8 9
654
1 2 3
/0
Limitations:
No spaces
Only 1~9, A~Z, a~z characters allowed

REMOTE CONTROL
273
ABCDE
FGHIJ
KLMNO
PQRST
UVWXY
Z
A
C
D
E
B
Lowercase
Return
a
c
d
e
b
Return
Rename>
Return
Cancel password
Menu tree to enter the password
6. The password appears on the bottom of the screen as it is created.
Password
7. Press Enter to confirm setting the password.
Hi SLIP Port 8. Press System >More[F7]>RmtInterface Config[F1]>LAN[F2] >HiSLIPPort to see the Hi Slip Port number.
HiSlip port 4880
Reset LAN It may be necessary to reset the LAN configuration settings before the LAN can be used.
9. Press System >More[F7]>RmtInterface Config[F1]>LAN Reset[F3] to reset the LAN.
10. The GSP-9300 will now automatically reboot.

GSP-9300 User Manual
274
Note Each time the LAN is reset, the default password is restored.
Default password: lxiWNpwd

REMOTE CONTROL
275
Configure RS232C
Background The RS232C interface is used for remote control with a PC.
RS232C Configuration settings
Baud Rate Stop bit: 1 (fixed)
Parity: none (fixed) Data bit: 8 (fixed)
Connection Connect an RS232C cable from the PC to the rear panel RS232 port.
1. Press System >More[F7]>RmtInterface
Config[F1]>RS232 BaudRate[F4] to set the baud rate.
300 600 1200 2400 4800 9600 19200 38400 57600 115200
RS232C Remote Control Function Check
Functionality check
Invoke a terminal application such as Realterm.
To check the COM port No, see the Device Manager in the PC. For WinXP; Control panel → System → Hardware tab.
Run this query command via the terminal after the instrument has been configured for RS232 remote control (page 275).
*idn?
This should return the Manufacturer, Model

GSP-9300 User Manual
276
number, Serial number, and Firmware version in the following format.
GWINSTEK,GSP9300,XXXXXXXX,T.X.X.X.X
Manufacturer: GWINSTEK
Model number : GSP9300
Serial number : XXXXXXXX
Firmware version : T.X.X.X.X
Note For further details, please see the programming manual, available on the GW Instek web site @ www.gwinstek.com.

REMOTE CONTROL
277
LXI Browser Interface and Function Check
Functionality check
Enter the IP address of the spectrum analyzer in a web browser after the instrument has been configured and connected to the LAN (page 267) or WLAN (page 270).
http:// XXX.XXX.XXX.XXX
The web browser interface appears:
Welcome Page The Welcome Page lists all the LXI and LAN/WLAN configuration settings as well as the instrument identification. The instrument identification can be disabled from this page.
Note The LXI icon on the GSP-9300 display will flash when the Identification setting is turned on.

GSP-9300 User Manual
278
View & Modify Configuration
The View & Modify Configuration allows you to modify the LAN settings from the browser.
Press the Modify Configuration button to modify any of the configuration files.
A password must be entered to alter the settings.
Default password: lxiWNpwd [Note: password is case sensitive.]
Note If the “Factory Defaults” option is chosen, the password will be reset back to the default password
It will also be necessary to manually reset the spectrum analyzer when a message prompts you to do so on the web browser.

REMOTE CONTROL
279
SCPI Command The SCPI Command page allows you to enter SCPI commands directly from the browser for full remote control. Please see the programming manual for details. A password must be entered before remote commands can be used. Default password: lxiWNpwd [Note: password is case sensitive.]
Get Image The Get Image page allows the browser to remotely capture a screenshot of the GSP-9300 display.
Note For further details, please see the programming manual, available on the GW Instek web site @ www.gwinstek.com.
GSP-9300 User Manual
280
GPIB/LAN/USB Control Function Check
Functionality check
Please use the National Instruments Measurement & Automation Controller software to confirm GPIB/LAN functionality. See the National Instrument website, http://www.ni.com for details.
Note For further details, please see the programming manual, available on the GW Instek web site @ www.gwinstek.com.

FAQ
281
FAQ
• I connected the signal but it does not appear on screen.
• I want to see which optional items are installed.
• The performance does not match the specification
I connected the signal but it does not appear on screen.
Run Autoset and let the GSP-9300 find the best display scale for your target signal. Press the Autoset key, then press Autoset[F1]. For details, see page 64.
I want to see which optional items are installed.
Check the optional items in the system information window. Press
the System key → System Information[F1]. For details, see page 117.
The performance does not match the specification.
Make sure the device is powered On for at least 30 minutes, within +20°C~+30°C. This is necessary to stabilize the unit to match the specification.
For more information, contact your local dealer or GWInstek at www.gwinstek.com / [email protected].
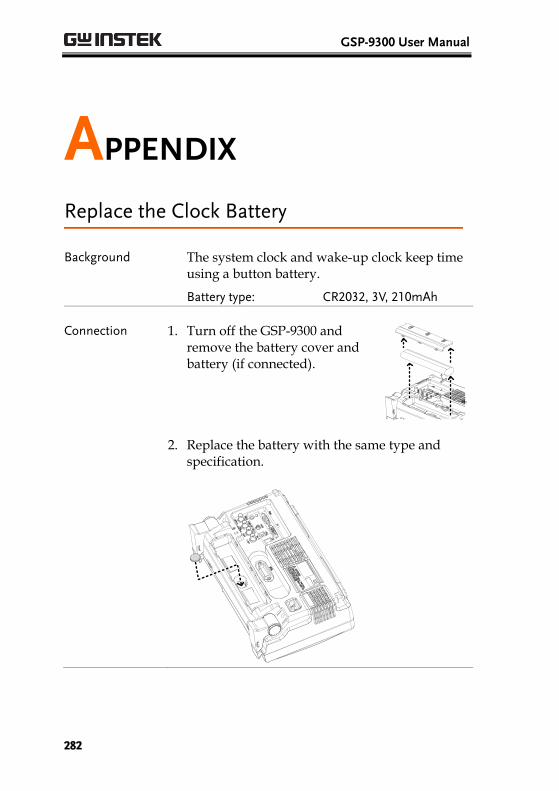
GSP-9300 User Manual
282
APPENDIX
Replace the Clock Battery
Background The system clock and wake-up clock keep time using a button battery.
Battery type: CR2032, 3V, 210mAh
Connection 1. Turn off the GSP-9300 and remove the battery cover and battery (if connected).
2. Replace the battery with the same type and specification.
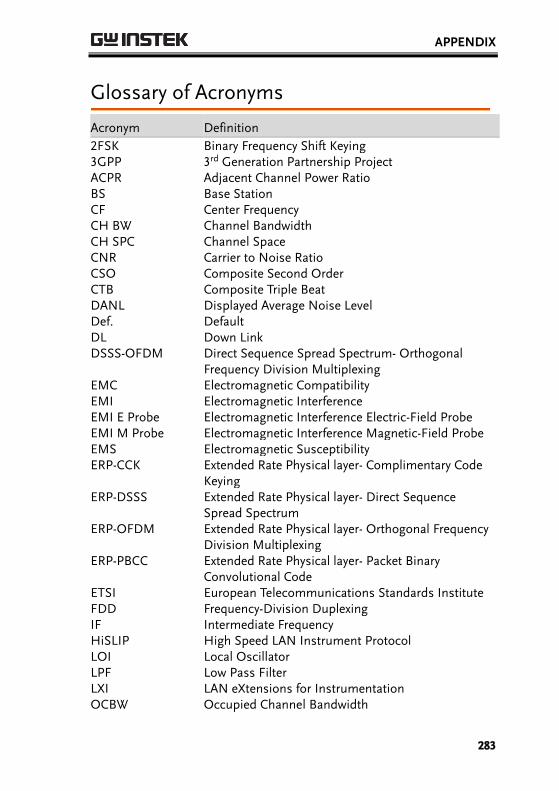
APPENDIX
283
Glossary of Acronyms
Acronym Definition
2FSK Binary Frequency Shift Keying 3GPP 3rd Generation Partnership Project ACPR Adjacent Channel Power Ratio BS Base Station CF Center Frequency CH BW Channel Bandwidth CH SPC Channel Space CNR Carrier to Noise Ratio CSO Composite Second Order CTB Composite Triple Beat DANL Displayed Average Noise Level Def. Default DL Down Link DSSS-OFDM Direct Sequence Spread Spectrum- Orthogonal
Frequency Division Multiplexing EMC Electromagnetic Compatibility EMI Electromagnetic Interference EMI E Probe Electromagnetic Interference Electric-Field Probe EMI M Probe Electromagnetic Interference Magnetic-Field Probe EMS Electromagnetic Susceptibility ERP-CCK Extended Rate Physical layer- Complimentary Code
Keying ERP-DSSS Extended Rate Physical layer- Direct Sequence
Spread Spectrum ERP-OFDM Extended Rate Physical layer- Orthogonal Frequency
Division Multiplexing ERP-PBCC Extended Rate Physical layer- Packet Binary
Convolutional Code ETSI European Telecommunications Standards Institute FDD Frequency-Division Duplexing IF Intermediate Frequency HiSLIP High Speed LAN Instrument Protocol LOI Local Oscillator LPF Low Pass Filter LXI LAN eXtensions for Instrumentation OCBW Occupied Channel Bandwidth

GSP-9300 User Manual
284
PSD Power Spectral Density P1dB One-dB compression point RBW Resolution Bandwidth REF Reference SEM Spectrum Emission Mask SINAD Signal to Noise and Distortion Ratio TDD Time-Division Duplexing TG Tracking Generator TOI Third Order Intercept UE User Equipment UP Up Link VBW Video Bandwidth

APPENDIX
285
GSP-9300 Default Settings The following default settings are the factory configuration settings for the spectrum analyzer (Function settings/Test settings).
Frequency
Center Frequency: 1.5GHz Start Frequency: 0Hz Stop Frequency: 3GHz CF Step: Auto Frequency Offset: 0Hz
Span Span: 3GHz Amplitude
Reference level: 0.00dBm Attenuation: Auto Scale Div: 10 Scale: Off Y Axis: dBm Scale Type: Log
Reference level offset: 0.00dBm
Correction: Off
Input Z: 50Ω Input Z calibration: 6.000dB Preamp: Bypass
Autoset Amp.Floor: Auto Span: Auto BW/AVG
RBW: Auto VBW: Auto
VBW/RBW: N/A Average: Off
Average Power: Log Power EMI Filter: Off
Sweep
Sweep Time: Auto Sweep: Continuous
Gated Sweep Mode: Off Gate Delay: 50ms
Gate Length: 540ms Sweep Control: Norm
Trace
Activated traces: trace 1 Trace Type: Clear and Write
Trace Math: Off Detection: Auto, Normal
Display
Window Setup: Spectrum LCD Brightness: Hi
LCD Backlight: On Display Line, -50.0dBm, Off

GSP-9300 User Manual
286
Meas All measurement functions: Off EMC Pretest
All EMC test functions: Off Limit Line Limit lines: Off Pass/Fail Test: Off
Trigger Free Run Trigger Condition: Video Trigger Mode: Norm. Trigger Delay: 50ms File
Type: All Sort by: Name Quick Save Type: Screen Data Source:Normal
Save Type: Screen Data Source:Normal Recall
Type: State Destination: Local State Marker Marker: Off Data Source:Normal
Marker N/A Peak Search
Peak Track: Off Peak Excursion: 3dB Peak Threshold: -50dBm Peak Table: Off Mode Mode: Spectrum
Sequence Sequence Off Option Control
Tracking Generator: Off Power Meter: Off System Language: region dependent Power On: Preset Preset Type: Factory Preset Alarm Output: Off
Remote Interface Config GPIB Address: 3 LAN: DHCP LXI Password: lxiWNpwd HiSPIP Port:4880 RS232 BaudRate: 115200 USB Mode: Host

APPENDIX
287
Menu Tree
Amplitude
Ref Level-30 dB
Amplitude
Attenuation10dB
Auto Man
Scale/Div10 5 2 1
Auto Scale
ScaleOn Off
Scale Pos.Left Cent. Right
More1/3
Y Axis>dBm
Scale TypeLog Lin
Correction>
RefLvlOffset0.000dB
PreampAuto Bypass
Return2/3
More2/3
dBm
dBmV
dBuV
Watts
Volts
SelectCorrection>
1
CorrectionOn Off
Edit>
SaveCorrection
Delete Correction
Return
Correction 1
Correction 2
Correction 3
Correction 4
Correction 5
Point Num15
Frequency1.2345 GHz
Gain Offset10.00 dB
Delete Point
Return
Input Z50 75
Input Z Cal0.000dB
Return3/3

GSP-9300 User Manual
288
dBm
dBmV
dBuV
Watts
Volts
dBm
W
mW
nW
pW
dBmV
V
mV
uV
dBm
dBuV
V
mV
uV
dBm
W
mW
uW
nW
pW
dBm
V
mV
uV
dBmV
dBuV
dBm
Y Axis>dBm
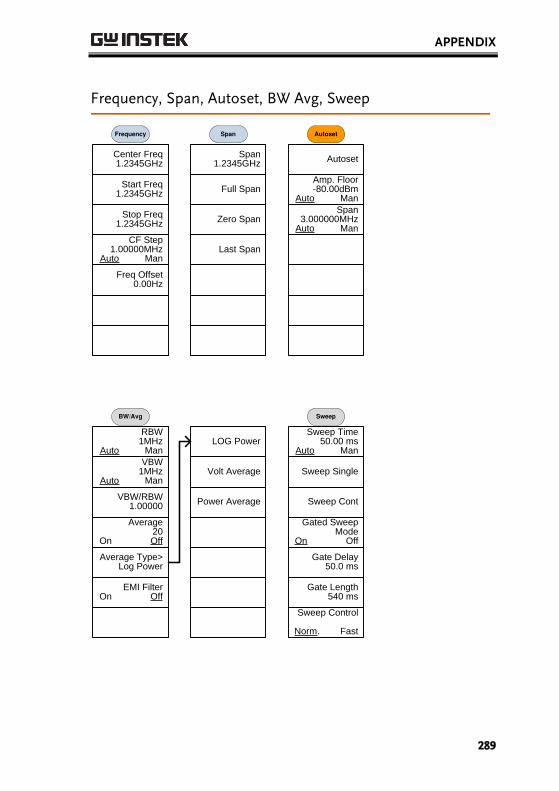
APPENDIX
289
Frequency, Span, Autoset, BW Avg, Sweep
Center Freq1.2345GHz
Frequency
Start Freq1.2345GHz
Stop Freq1.2345GHz
CF Step1.00000MHz
Auto Man
Freq Offset0.00Hz
Span1.2345GHz
Full Span
Zero Span
Last Span
Autoset
Amp. Floor-80.00dBm
Auto ManSpan
3.000000MHzAuto Man
RBW1MHz
Auto ManVBW
1MHzAuto Man
VBW/RBW1.00000
Average20
On Off
Average Type>Log Power
EMI FilterOn Off
LOG Power
Volt Average
Power Average
Sweep Time50.00 ms
Auto Man
Sweep Single
Sweep Cont
Gated SweepMode
On Off
Gate Delay50.0 ms
Gate Length540 ms
Sweep Control
Norm. Fast
Span Autoset
BW/Avg Sweep

GSP-9300 User Manual
290
Limit Line
EditSelect Limit>
Pass/FailTest>
Limit Line>1
Point by Point>
Trace Data toLimit Line>
Mkr Data toLimit Line>
Save Limit Line
Delete LimitLine
Return
Point Num1
Frequency0Hz
Limit 0.00dBm
Delete Point
Return
High Limit>Off
Low Limit>Off
Pass CriterionAll-In Max-In
Min-In
Pass/Fail TestOn Off
Pass/Fail ModeSingle Cont.
Return
Limit 1
Limit 2
Limit 3
Limit 4
Limit 5
OFF
Point Num1
Mkr Data toPoint
Limit Offset
Return
LimitLine
Limit 1
Limit 2
Limit 3
Limit 4
Limit 5
Create Limit LineNow
Limit Offset0.000dB
Return
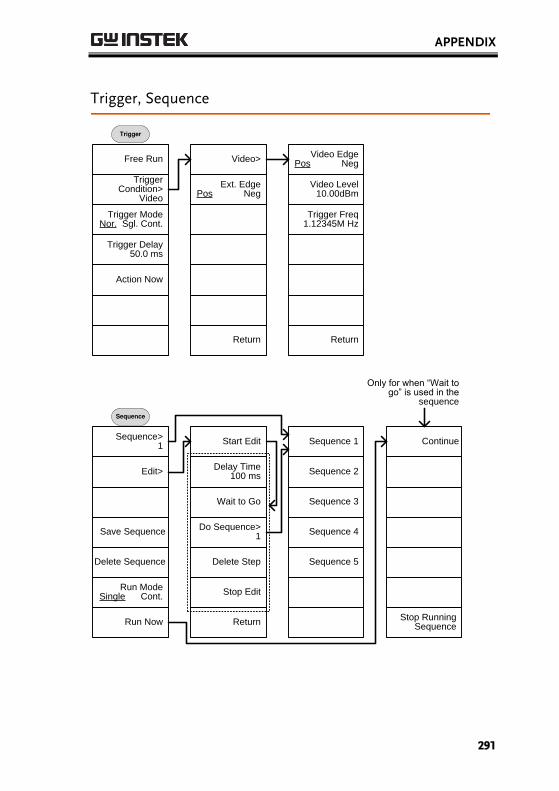
APPENDIX
291
Trigger, Sequence
Free Run
Trigger Condition>
Video
Trigger ModeNor. Sgl. Cont.
Trigger Delay50.0 ms
Action Now
Video>
Ext. EdgePos Neg
Return
Video EdgePos Neg
Video Level10.00dBm
Trigger Freq1.12345M Hz
Return
Sequence>1
Edit>
Save Sequence
Run ModeSingle Cont.
Run Now
Start Edit
Delay Time100 ms
Wait to Go
Do Sequence>1
Delete Step
Stop Edit
Return
Sequence 1
Sequence 2
Sequence 3
Sequence 4
Sequence 5
Trigger
Continue
Stop Running Sequence
Sequence
Delete Sequence
Only for when “Wait to go” is used in the
sequence

GSP-9300 User Manual
292
Trace
Select Trace>1
Clear & Write
Max Hold-130.0dBm
Min Hold
View
Blank
More1/2
Trace Math>
Detection>Normal
Auto Man
Return
TR1>Trace 2
TR2>Trace 2
Power DiffTR1-TR2
Log Diff-50.00dBm
TR1-TR2+RefLog Offset
0.00dBTR1 + Offset
OFF
Return
Trace
Trace 1
Trace 2
Trace 3
Trace 4
Trace 4
Auto
Normal
Peak +
Peak -
Sample
Average
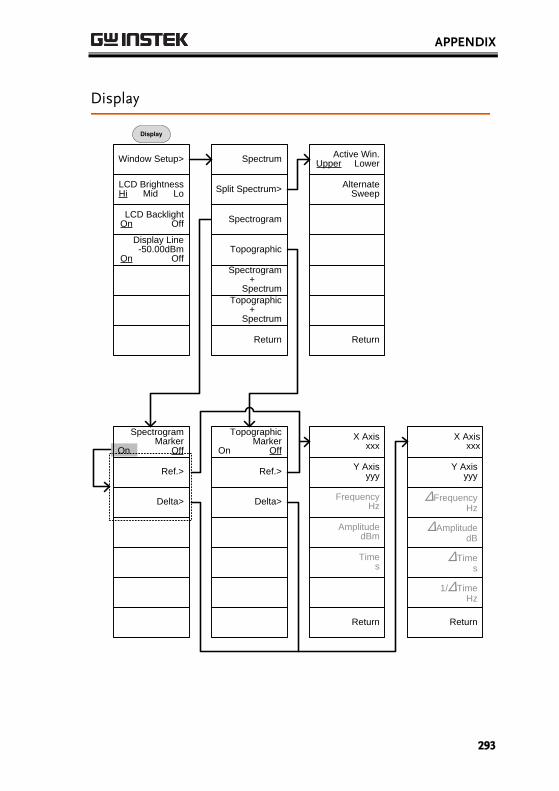
APPENDIX
293
Display
Spectrogram Marker
On Off
Ref.>
Delta>
Topographic Marker
On Off
Ref.>
Delta>
X Axisxxx
Y Axisyyy
FrequencyHz
AmplitudedBm
Times
Return
X Axisxxx
Y Axisyyy
ΔFrequencyHz
ΔAmplitudedB
ΔTimes
1/ΔTimeHz
Return
Window Setup>
LCD BrightnessHi Mid Lo
LCD BacklightOn Off
Display Line-50.00dBm
On Off
Spectrum
Split Spectrum>
Spectrogram
Topographic
Spectrogram +
SpectrumTopographic +
Spectrum
Return
Active Win.Upper Lower
AlternateSweep
Return
Display
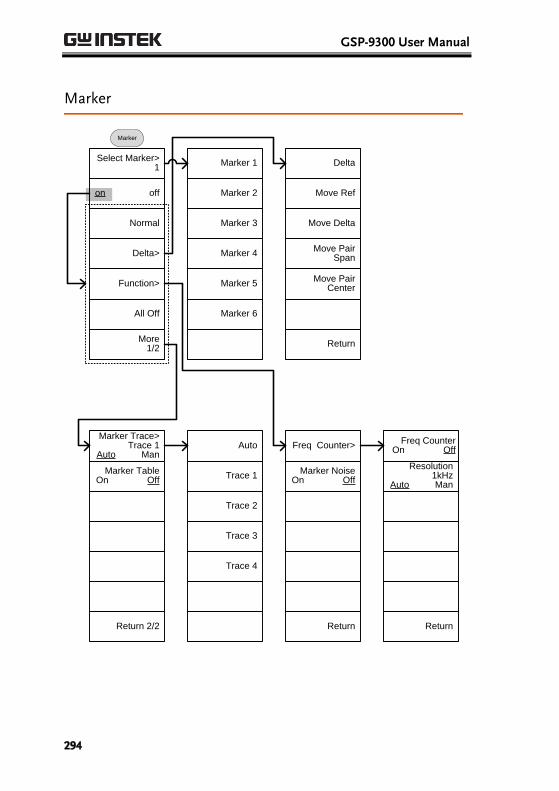
GSP-9300 User Manual
294
Marker
Select Marker>1
on off
Normal
Delta>
Function>
All Off
More 1/2
Marker 1
Marker 2
Marker 3
Marker 4
Marker 5
Marker 6
Delta
Move Ref
Move Delta
Move Pair Span
Move Pair Center
Return
Marker Trace>Trace 1
Auto Man
Marker TableOn Off
Return 2/2
Auto
Trace 1
Trace 2
Trace 3
Trace 4
Freq Counter>
Marker NoiseOn Off
Return
Freq CounterOn Off
Resolution1kHz
Auto Man
Return
Marker

APPENDIX
295
Peak Search, Marker
Marker
Peak Search
Mkr>Center
Next Peak
Next Peak Right
Next Peak Left
Min Search
More 1/2
Peak TrackOn Off
Peak Excursion10.00dB
Peak Threshold-50.00dBm
On Off
Peak Table>
Return2/2
Peak TableOn Off
Peak SortFreq Amp
Return
Mkr>Center
Mkr>Start
Mkr>Stop
Mkr>CF Step
Mkr>RefLvl
Peak Search

GSP-9300 User Manual
296
System
System Information
Error message>
Language>English
Date/Time>
Pwr On/preset>
Alarm OutputOn Off
More1/2
Show Errormessage
Prev Page
Next Page
Clear Errorqueue
Return
Power OnLast Preset
Preset Type>
Save User Preset
Return
Rmt InterfaceConfig>
Upgrade
Service>
Return2/2
Set Date>
Set Time>
Wake-Up ClockEdit>
ClockOn Off
Return
Year2011
Month10
Day5
Return
User Preset
Factory Preset
Hour5
Minute11
Second52
Return
System

APPENDIX
297
Select Clock>1
StateOn Off
Hour13
Minute08
Rept. Single
Select Date>Monday
Return
Clock 1
Clock 2
Clock 3
Clock 4
Clock 5
Clock 6
Clock 7
Monday
Tuesday
Wednesday
Thursday
Friday
Saturday
Sunday
From: System>Date/Time>Wake-Up Clock Edit>
English
簡体中文
繁體中文
Pусский
日本語
Return
From: System> Language
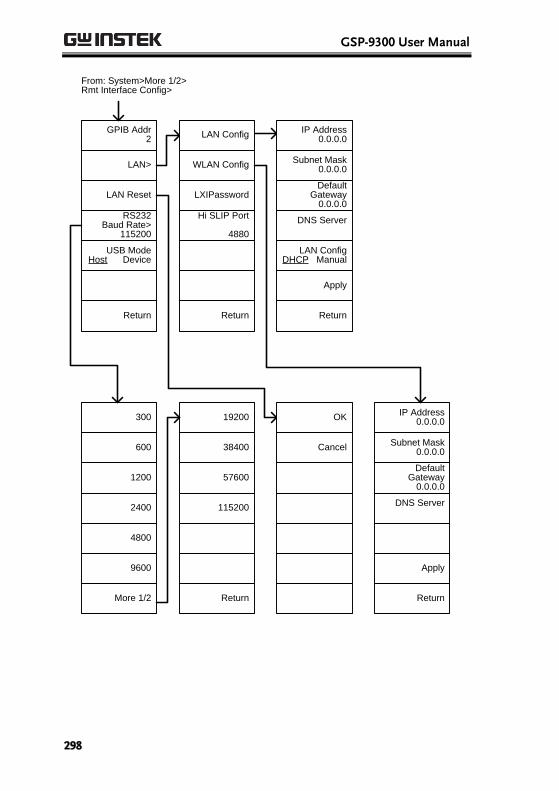
GSP-9300 User Manual
298
300
600
1200
2400
4800
9600
More 1/2
19200
38400
57600
115200
Return
GPIB Addr2
LAN>
LAN Reset
RS232Baud Rate>
115200
USB ModeHost Device
Return
From: System>More 1/2> Rmt Interface Config>
IP Address0.0.0.0
Subnet Mask0.0.0.0
Default Gateway
0.0.0.0
DNS Server
LAN ConfigDHCP Manual
Apply
Return
LAN Config
WLAN Config
LXIPassword
Hi SLIP Port
4880
Return
OK
Cancel
IP Address0.0.0.0
Subnet Mask0.0.0.0
Default Gateway
0.0.0.0
DNS Server
Apply
Return

APPENDIX
299
ABCDE
FGHIJ
KLMNO
PQRST
UVWXY
Z
Return
A
B
C
D
E
Lowercase
Return
a
b
c
d
e
Return
From: System>More 1/2> Rmt Interface Config>LAN>LXIPassword

GSP-9300 User Manual
300
Option Control
Tracking Generator>
Power Meter>
Demo Kit>
Power MeterOn Off
Power UnitdBm mV
Frequency3 MHz
Sensor ModeLowNoise Fast
Pass/FailTest>
More1/2
Return
High Limit-10 dBm
Low Limit-10 dBm
Pass Fail TestOn Off
Return
Option Control
TGOn Off
TG Level0.00dBm
TG Lvl Offset0.000dB
TG Lvl Step0.000dB
Auto ManPower Sweep
0.000dBOn Off
Normalize>
Return
Exe. Norm.
Norm. Ref. Level
0.000dBNorm.
Ref. Position10
NormOn Off
Return

APPENDIX
301
Mod
ulat
ion
= FS
K o
nly
Demo KitOn Off
Modulation>ASK
Frequency>315MHz
Deviation>25kHz
Baudrate>4800
Output ModeGated
Return
From: Option Control>Demo Kit
Normal
Gated
Seq100110101
Seq210100101
Seq300010010
Seq411011100
Seq510101010
4800
9600
20000
25kHz
50kHz
ASK
FSK
315MHz
433MHz
868MHz

GSP-9300 User Manual
302
File
File Explorer>Local
Type>All
Sort byName Date
Copy to>
Delete>
Rename>
Move to>
Media>Local
Copy Now
Return
Media>Local
Move Now
Return
Local
USB
SD Card
File

APPENDIX
303
All
State
Trace
Screen
Limit Line
Correction
More 1/2
Sequence
Power Meter
Return 2/2
Delete Now
Delete WarningDon’t Ask Ask
Return
ABCDE
FGHIJ
KLMNO
PQRST
UVWXY
Z
Return
A
B
C
D
E
Lowercase
Return
a
b
c
d
e
Return
From: File>Type From: File>Delete
From: File>Rename
.sta
.tra
.jpg
.cor
.seq
.pmet

GSP-9300 User Manual
304
Save
(Mode = Power Meter)
See: File>Rename
According to type:
Save To>Local
Type>State
Data Source>Local State
PMETRecord Option>
Name>
Record Stop
Record Now
State
Screen
Power Meter
Record Stop00: 00: 00
Record Step1 s
Return
Power MeterState
Local State
Normal
Save Toner
Hour06
Minute07
Second08
Return
See: Save>Save To
Save

APPENDIX
305
Register 1
Register 2
Register 3
Register 4
Register 5
Register 6
Return
Register>
Local
USB
SD Card
Return
From: Save>Save To
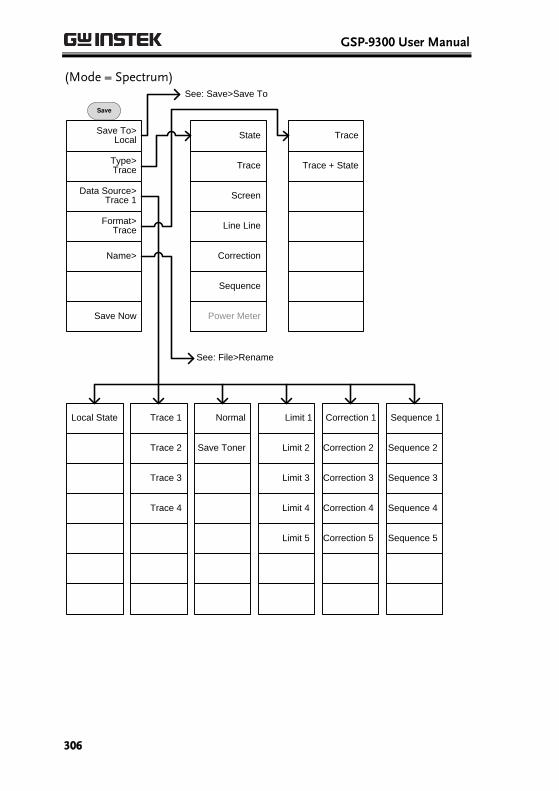
GSP-9300 User Manual
306
(Mode = Spectrum)
Save To>Local
Type>Trace
Data Source>Trace 1
Format>Trace
Name>
Save Now
State
Trace
Screen
Line Line
Correction
Sequence
Power Meter
Trace
Trace + State
Local State
Trace 1
Trace 2
Trace 3
Trace 4
Normal
Save Toner
Limit 1
Limit 2
Limit 3
Limit 4
Limit 5
Save
Correction 1
Correction 2
Correction 3
Correction 4
Correction 5
Sequence 1
Sequence 2
Sequence 3
Sequence 4
Sequence 5
See: Save>Save To
See: File>Rename

APPENDIX
307
Recall
(Mode = Power Meter)
According to type:
Recall From>Local
Type>State
Destination>Local State
Recall Now
State
Local State
Recall
.sta
Register 1
Register 2
Register 3
Register 4
Register 5
Register 6
Return
Register>
Local
USB
SD Card
Return

GSP-9300 User Manual
308
(Mode = Spectrum)
Recall From>Local
Type>Trace
Destination>Trace 1
Recall Now
State
Trace
Line Line
Correction
Sequence
Power Meter
Local State
Trace 1
Trace 2
Trace 3
Trace 4
Limit 1
Limit 2
Limit 3
Limit 4
Limit 5
Recall
Correction 1
Correction 2
Correction 3
Correction 4
Correction 5
Sequence 1
Sequence 2
Sequence 3
Sequence 4
Sequence 5
.sta
.tra
.cor
.lmt
.seq
Register 1
Register 2
Register 3
Register 4
Register 5
Register 6
Return
Register>
Local
USB
SD Card
Return

APPENDIX
309
Measure
Channel Analysis>
Demod>
2FSK
Phase Jitter>
SEM>
TOI>
More1/2
ACPR Setup>
ACPROn Off
OCBW Setup>
OCBWOn Off
ChannelMove Up
ChannelMove Down
Return
Main CHBW2.000000MHz
Main CH HLimit
0.00dBmMain CH
LLimit0.00dBm
CH SPC2.000000MHz
ADJCHSetup>
Def. HelpOn Off
Return
Measure
See: Meas>Demod
Phase JitterOn Off
Start Offset0Hz
Stop Offset0Hz
Return
2FSKOn Off
Peak Threshold-50.00dBm
On Off
Max Hold-130.0dBm
Restart
Limit Edit
Pass/FailOn Off
Return
CHBW2.000000MHz
CH SPC2.000000MHz
OCBW %90.0%
Return
Select Adj Ch>1
on off
ADJ CHBW2.000000MHz
ADJ CH Offset2.000000MHz
ADJ CHH Limit
0.00dBm
ADJ CHL Limit
0.00dBm
Return
AdjCh1
AdjCh2
AdjCh3
CNR/CSO/CTB>
Harmonic>
NdBBandwidth>
P1dB>
Return2/2

GSP-9300 User Manual
310
AM Analysis>
FM Analysis>
Sound>
ASK>
FSK>
Return
Setup>CNR
CNROn Off
CNRCH SPC
6.000 MHz
Channel Move Down
Channel Move Up
Return
CNR>
CSO
CTB>
Return
Noise MarkingMin ΔMarker
Return
Restart
Return
From: Measure>Demod
From: Measure>More>CNR/CSO/CTB
NdB BWOn Off
N dB0.000dB
Return
TOIOn Off
Reference Lower Upper
Limit -30.00dBm
Pass/Fail TestOn Off
Return
From: Measure>TOI
Earphone OutOn Off
Volume10
Digital Gain Control
0.000dB
Demod TypeAM FM
Return
From: Measure>More> NdB Bandwidth

APPENDIX
311
IF Bandwidth300kHz
LPF>Bypass
Time Axis>
Depth Axis>
AF Trigger>
Squelch Level-130.0dBm
Return
Bypass
1.6MHz
781kHz
521kHz
391kHz
313kHz
Ref. Value0.0ns
Ref. Pos5
Scale/Div10.00ms
Auto ScaleOn Off
Return
Ref. Value0.0 %
Ref. Pos5
Scale/Div10 %
Auto Scale
Return
Trigger Setup>
Free Run
Start Time0.00 ns
Stop Time20.0 ms
Action Now
Return
From: Measure>Demod>AM Analysis
Decimation frequency*
AM AnalysisOn Off
Setup>
Min/Max Reset
Limit Edit>
Pass/FailOn Off
Return
Edge SlopeRising Falling
Trigger ModeNor. Sgl. Cont.
Trigger Level10 %
Trigger Delay50 ms
Return
* see page 133 for the selectable LPF filter bandwidths.

GSP-9300 User Manual
312
IF Bandwidth300kHz
LPF>Bypass
Time Axis>
Deviation Axis>
AF Trigger>
Return
Bypass
16kHz
7.8kHz
5.2kHz
3.9kHz
3.1kHz
Ref. Value0.0ns
Ref. Pos5
Scale/Div10.00ms
Auto ScaleOn Off
Return
Ref. Value30Hz
Ref. Pos5
Scale/Div10 Hz
Auto Scale
Return
Trigger Setup>
Free Run
Start Time0.00 ns
Stop Time20.0 ns
Action Now
Return
From: Measure>Demod>FM Analysis
Decimation frequency*
FM AnalysisOn Off
Setup>
Min/Max Reset
Limit Edit>
Pass/FailOn Off
Return
Edge SlopeRising Falling
Trigger ModeNor. Sgl. Cont.
Trigger Level10 Hz
Trigger Delay50 ms
Return
* see page 139 for the selectable LPF filter bandwidths.

APPENDIX
313
ASK AnalysisOn Off
Symbol RateX.XX ks
View>
Time Axis>
Depth Axis>
More1/2
Ext.Trigger>
Decoding>None
Limit
SweepSingle Cont
Sweep Single
Return
Free Run
Edge SlopeRising Falling
Trigger Mode
Trigger Level0Hz
Trigger Delay
Action Now
Return
None
Miller
Manchester
From: Measure>Demod>ASK
Ref. Value0Hz
Ref.Pos5
Scale/Div10Hz
Auto Scale
Return
Ref.ValueX.XX ns
Ref.Pos0
Scale/Div2
Auto ScaleOn Off
Return
Symbol
Wave
Return
Norm. Sgl. Cont.
LimitOn Off
Freq. Deviation100Hz
Carr.Offset500Hz
Carr.Power0.00dBm
Return
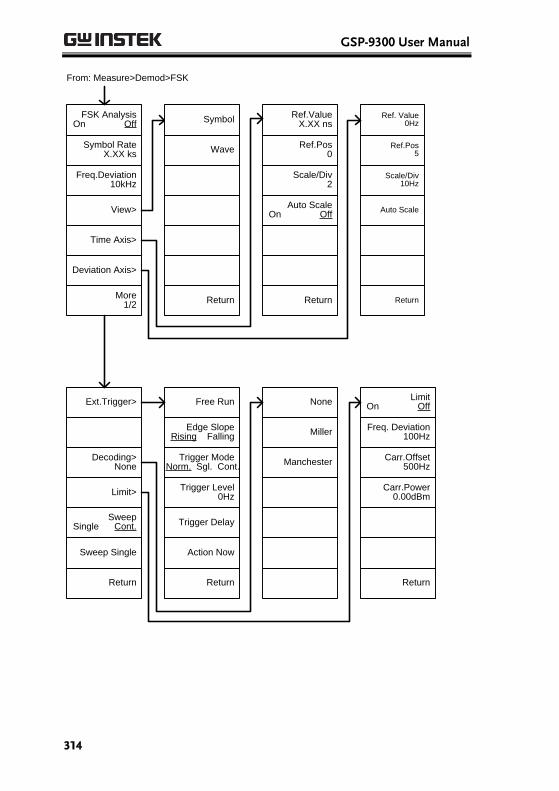
GSP-9300 User Manual
314
FSK AnalysisOn Off
Symbol RateX.XX ks
Freq.Deviation10kHz
View>
Time Axis>
Deviation Axis>
More1/2
Ext.Trigger>
Decoding>None
Limit>
SweepSingle Cont.
Sweep Single
Return
Free Run
Edge SlopeRising Falling
Trigger Mode
Trigger Level0Hz
Trigger Delay
Action Now
Return
None
Miller
Manchester
From: Measure>Demod>FSK
Ref. Value0Hz
Ref.Pos5
Scale/Div10Hz
Auto Scale
Return
Ref.ValueX.XX ns
Ref.Pos0
Scale/Div2
Auto ScaleOn Off
Return
Symbol
Wave
Return
Norm. Sgl. Cont.
LimitOn Off
Freq. Deviation100Hz
Carr.Offset500Hz
Carr.Power0.00dBm
Return

APPENDIX
315
From: Measure>2FSK>Limit Edit
Freq. Deviation200.000kHz
Carr.Offset200.000kHz
Return
From: Measure>Demod>FM Analysis>Limit Edit
Freq. Deviation200.000kHz
Carr.Offset200.000kHz
Carr.Power0.00dBm
Return
From: Measure>Demod>AM Analysis>Limit Edit
Freq. Deviation200.000kHz
Carr.Offset200.000kHz
Carr.Power0.00dBm
Return

GSP-9300 User Manual
316
SEM Setup>3GPP
SEMOn Off
Def. HelpOn Off
Return
3GPP>
802.11b>
802.11g>
802.11n>
802.16>
User Define>
Return
Meas Type>Total pwr Ref
Ref. Channel>
Offset/Limit>
Return
Chan Integ BW3.84 MHz
Chan Span3.96 MHz
RBW10kHz
Auto ManTotal Pwr Ref
-74.3dBmAuto Man
Return
DuplexingTable
FDD TDD
FDD Setup>
TDD Setup>
Return
Meas Type>PSD Ref
Ref. Channel>
Offset/Limit>
Return
From: Measure>SEM
From: Measure>SEM>3GPP> REF. Channel
From: Measure>SEM>3GPP> Offset/Limit

APPENDIX
317
TransmissionBS UE
Max Out Pwr>P>=43
Additional Max Out Pwr>
None
Add. LimitsNone
Min Offset/LimitValue>
Return
P>=43
39<=P<43
31<=P<39
P<31
None
6<=P<=20
P<6
Offset1 2 3 4 5
On Off
Start Freq27 MHz
Stop Freq27MHz
RBW
More 1/2
Return
Offset1 2 3 4 5
Abs Start-22 dBm
Abs Stop-22dBm
Return 2/2
None
Band II
Band IV
Band V
Band X
Band XII
More 1/2
Band XIII
Band XIV
From: Measure>SEM>3GPP> Offset/Limit>FDD Setup
BS Mode

GSP-9300 User Manual
318
None
Band II
Band IV
Band V
Band X
Band XII
More 1/2
Band XIII
Band XIV
TransmissionBS UE
Add. LimitsNone
Min Offset/LimitValue>
Return
Offset1 2 3 4 5
Start Freq27 MHz
Stop Freq27MHz
RBW
More 1/2
Return
Offset1 2 3 4 5
Abs Start-22 dBm
Abs Stop-22dBm
Rel Start-35dBc
Rel Stop-50dBc
Return
From: Measure>SEM>3GPP> Offset/Limit>FDD Setup
UE Mode

APPENDIX
319
TransmissionBS UE
Chip Rate3.84M 1.28M
7.68M
Min Offset/LimitValue>
Return
Offset1 2 3 4 5
On Off
Start Freq2.7MHz
Stop Freq2.7MHz
RBW3MHz
More 1/2
Return
Offset1 2 3 4 5
Rel Start-22dBm
Rel Stop-22dBm
Return
P>=34
26<=P<34
P<26
P>=43
39<=P<43
31<=P<39
P<31
From: Measure>SEM>3GPP> Offset/Limit>TDD Setup Chip Rate = 3.84/7.68M
Chip Rate = 1.28M
TransmissionBS UE
Chip Rate3.84M 1.28M
7.68M
Max Out Pwr>P>=43
Min Offset/LimitValue>
Return
Offset1 2 3 4 5
On Off
Start Freq2.7MHz
Stop Freq2.7MHz
RBW3MHz
More 1/2
Return
Offset1 2 3 4 5
Abs Start-22dBm
Abs Stop-22dBm
Return
From: Measure>SEM>3GPP> Offset/Limit>TDD Setup
BS Mode
UE Mode

GSP-9300 User Manual
320
Offset1 2 3 4
Start Freq2.7MHz
Stop Freq2.7MHz
RBW3MHz
Rel Start-22dBc
Rel Stop-22dBc
Return
Chan Integ BW3.84MHz
Chan Span3.96MHz
RBW10kHz
PSD Ref-74.3dBm/Hz
Return
Modulation>ERP-OFDM/
DSSS-OFDM
Min Offset/LimitValue>
Return
ERP-OFDM/DSSS-OPEM
ERP-DSSS/ERP-PBCC/
ERP-CCK
CH BW10M 20M
Min Offset/LimitValue>
Return
Offset1 2
Start Freq2.7MHz
Stop Freq2.7MHz
RBW3MHz
Rel Start-22dBc
Rel Stop-22dBc
Return
CH BW20M 40M
Min Offset/LimitValue>
Return
From: Measure>SEM> 802.11b/g/n/802.16>Ref. Channel
From: Measure>SEM> 802.11g>Offset/Limit
From: Measure>SEM> 802.11n>Offset/Limit
From: Measure>SEM> 802.16>Offset/Limit
From: Measure>SEM> 802.11b>Offset/Limit
From: Measure>SEM> 802.11n/802.16>Offset/Limit>Min Offset/Limit

APPENDIX
321
From: Measure>SEM>802.11g>Offset/Limit>Min Offset/Limit
802.11g modulation=OFDM
Offset1 2
On Off
Start Freq2.7MHz
Stop Freq2.7MHz
RBW
More 1/2
Return
Offset1 2
Rel Start-22dBc
Rel Start-22dBc
Return
Offset1 2 3 4
On Off
Start Freq2.7MHz
Stop Freq2.7MHz
RBW
More 1/2
Return
From: Measure>SEM>802.11g>Offset/Limit>Min Offset/Limit
802.11g modulation=DSSS
Offset1 2 3 4
Rel Start-22dBc
Rel Start-22dBc
Return

GSP-9300 User Manual
322
Absolute
Relative
Abs AND Rel
Abs OR Rel
Meas Type>Total Pwr Ref
Ref. Channel>
Offset/Limit>
Return
Total Pwr Ref
PSD Ref
Chan Integ BW3.84MHz
Chan Span3.96MHz
RBW10kHz
Auto ManTotal Pwr Ref
-74.3dBmAuto Man
Return
Offset1 2 3 4 5
On Off
Start Freq2.7MHz
Stop Freq2.7MHz
RBW10kHz
Auto Man
More 1/2
Return
Offset1 2 3 4 5
Abs Start-22dBm
Abs Stop-22dBm
Rel Start-22dBc
Rel Stop-22dBc
Couple Man
Fail Mask>Absolute
Return
From: Measure>SEM> User Define>

APPENDIX
323
TOIOn Off
ReferenceLower Upper
Limit0.00dBm
Pass/Fail TestOn Off
Return
From: Measure>TOI
NdB BWOn Off
NdB3.000dB
Return
From: Measure>More>NdB Bandwidth
HarmonicOn Off
Fundamental Freq.
1.000000MHz
Number of Order5
Return
From: Measure>More>Harmonic
P1dBOn Off
P1dBSetup >
Normalize >
Return
Center Freq100.000MHz
Gain Offset0.000dB
Average1
Start
Reset
Return
From: Measure>More>P1dB
Exec. Norm0dB
LocationPrev Post
Nomr.ON OFF
Return

GSP-9300 User Manual
324
EMC Pretest
EMI Test>
EMI M Probe>
EMI E Probe>
Voltage Probe>
EMS Test>
EMC Pretest
9k-150kHz
1GHz-3GHz
Return
Amb. Noise Reject
None HighCorrection
NoneOn Off
Recall limitNone
On Off
Peak TableOn Off
Scale TypeLog Lin
Return
150k-30MHz
30M-300MHz
300M-1GHz
30M-1GHz
None
Cor.factor
30M-300MHz
300M-1GHz
30M-1GHz
Return
CorrectionNone
On Off
EN55022A
EN55022B
FCC A
FCC B
Return
None
3m
10m
Other factor
Return
None
EN55022A
EN55022B
FCC A
FCC B
Conductance testing
None
Horizontal
Vertical
Other factor
Radiated testing
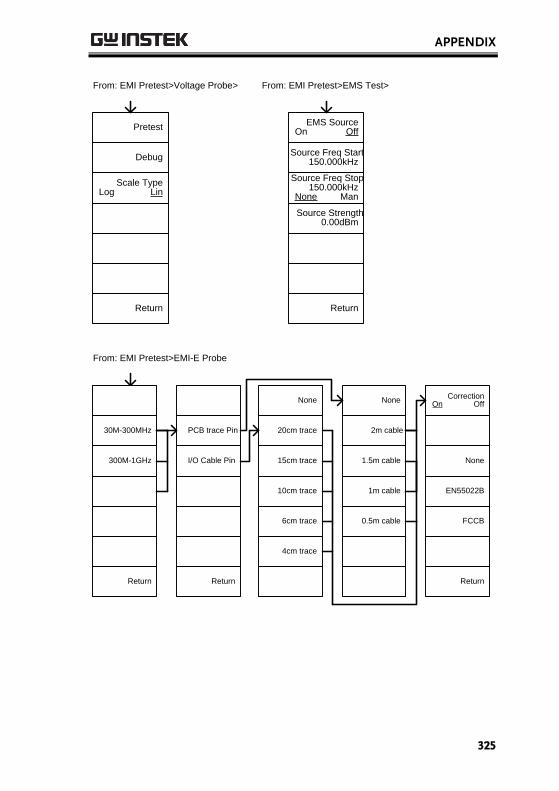
APPENDIX
325
EMS SourceOn Off
150.000kHz
150.000kHzNone Man
0.00dBm
Return
Source Freq Start
Source Strength
Source Freq Stop
Pretest
Debug
Scale TypeLog Lin
Return
From: EMI Pretest>Voltage Probe> From: EMI Pretest>EMS Test>
From: EMI Pretest>EMI-E Probe
30M-300MHz
300M-1GHz
Return
PCB trace Pin
I/O Cable Pin
Return
None
20cm trace
15cm trace
10cm trace
6cm trace
4cm trace
None
2m cable
1.5m cable
1m cable
0.5m cable
CorrectionOn Off
None
EN55022B
FCCB
Return

GSP-9300 User Manual
326
GSP-9300 Specifications The specifications apply when the GSP is powered on for 45 minutes * to warm-up to a temperature of 20˚C to 30˚C, unless specified otherwise.
* 45 minutes typical, 90 minutes maximum
Frequency
Frequency
Range 9 kHz to 3.0 GHz
Resolution 1 Hz Frequency Reference
Accuracy ±(period since last adjustment X aging rate) + stability over temperature + supply voltage stability
Aging Rate ±2 ppm max. 1 year after last adjustment
Frequency Stability over Temperature
±0.025 ppm 0 to 50 °C
Supply Voltage Stability
±0.02 ppm
Frequency Readout Accuracy
Start, Stop, Center, Marker
±(marker frequency indication X frequency reference accuracy + 10% x RBW + frequency resolution1)
Trace points Max 601 points, min 6 points
Marker Frequency Counter
Resolution 1 Hz, 10 Hz, 100 Hz, 1 kHz
Accuracy ±(marker frequency indication X frequency reference accuracy + counter resolution)
RBW/Span >=0.02 ; Mkr level to DNL>30 dB
Frequency Span
Range 0 Hz (zero span), 100 Hz to 3 GHz
Resolution 1 Hz
Accuracy ± frequency resolution1 RBW: Auto;

APPENDIX
327
Phase Noise
Offset from Carrier
Fc =1 GHz; RBW = 1 kHz, VBW = 10 Hz; Average ≥ 40
10 kHz <-88 dBc/Hz Typical 2
100 kHz <-95 dBc/Hz Typical 1 MHz <-113 dBc/Hz Typical
Resolution Bandwidth (RBW) Filter
Filter Bandwidth 1 Hz to 1 MHz in 1-3-10 sequence
-3dB bandwidth
200 Hz, 9 kHz, 120 kHz, 1MHz
-6dB bandwidth
Accuracy ± 8%, RBW = 1MHz Nominal3
± 5%, RBW < 1MHz Nominal
Shape Factor < 4.5:1 Normal Bandwidth ratio: -60dB:-3dB
Video Bandwidth (VBW) Filter
Filter Bandwidth 1 Hz to 1 MHz in 1-3-10 sequence
-3dB bandwidth
[1] Frequency Resolution = Span/(Trace points - 1) [2] Typical specifications in this datasheet mean that the performance can be exhibited in 80% of the units with a 95% confidence level over the temperature range 20 to 30 °C. They are not covered by the product warranty. [3] Nominal values indicate expected performance. They are not covered by the product warranty.
Amplitude
Amplitude Range
Measurement Range
100 kHz to 1 MHz Displayed Average Noise Level (DANL) to 18 dBm
1 MHz to 10 MHz DANL to 21 dBm
10 MHz to 3 GHz DANL to 30 dBm Attenuator
Input Attenuator Range
0 to 50 dB, in 1 dB step Auto or manual setup
Maximum Safe Input Level
Average Total Power
≤ +33 dBm Input attenuator ≥10 dB
DC Voltage ± 50 V

GSP-9300 User Manual
328
1 dB Gain Compression
Total Power at 1st Mixer
> 0 dBm Typical;Fc ≥ 50 MHz; preamp. off
Total Power at the Preamp
> -22 dBm Typical;Fc ≥ 50 MHz; preamp. on
mixer power level (dBm)= input power (dBm)-attenuation (dB)
Displayed Average Noise Level (DANL)4
Preamp off 0 dB attenuation; RF Input is terminated with a 50Ω load. RBW 10 Hz; VBW 10 Hz; span 500 Hz; reference level = -60dBm; trace average ≥ 40
9 kHz to 100 kHz < -93 dBm
Nominal 100 kHz to 1
MHz < -90 dBm - 3 x (f/100 kHz) dB
1 MHz to 10 MHz < -122 dBm
10 MHz to 3 GHz < -122 dBm
Preamp on 0 dB attenuation; RF Input is terminated with a 50Ω load ; RBW 10 Hz; VBW 10Hz; span 500 Hz; reference level = -60dBm; trace average ≥ 40
100 kHz to 1 MHz
< -108 dBm - 3 x (f/100 kHz) dB
Nominal 1 MHz to 10 MHz < -142 dBm 10 MHz to 3 GHz < -142 dBm + 3 x (f/1
GHz) dB
[4] DANL spec excludes spurious response. Level Display Range
Scales Log, Linear
Units dBm, dBmV, dBuV, V, W
Marker Level Readout
0.01 dB Log scale
0.01 % of reference level Linear scale
Level Display Modes
Trace, Topographic, Spectrogram
Single / split Windows
Number of Traces 4
Detector Positive-peak, negative-peak, sample, normal, RMS(not Video)
Can be setup for each trace separately
Trace Functions Clear & Write, Max/Min Hold, View, Blank, Average

APPENDIX
329
Absolute Amplitude Accuracy
Absolute Point Center=160 MHz ; RBW 10 kHz; VBW 1 kHz; span 100 kHz; log scale; 1 dB/div; peak detector; 23 1°C; Signal at Reference Level
Preamp off ± 0.3 dB Ref level 0 dBm; 10 dB RF attenuation
Preamp on ± 0.4 dB Ref level -30 dBm; 0 dB RF attenuation
Frequency Response
Preamp off Attenuation: 10 dB; Reference: 160 MHz; 20 to 30°C
100 kHz to 2.0 GHz
± 0.5 dB
2GHz to 3 GHz ± 0.7 dB
Preamp on Attenuation: 0 dB; Reference: 160 MHz; 20 to 30°C
1 MHz to 2 GHz ± 0.6 dB
2 GHz to 3 GHz ± 0.8 dB Attenuation Switching Uncertainty
Attenuator setting 0 to 50 dB in 1 dB step
Uncertainty ± 0.25 dB reference: 160 MHz, 10dB attenuation
RBW Filter Switching Uncertainty
1 Hz to 1 MHz ± 0.25 dB reference : 10 kHz RBW
Level Measurement Uncertainty
Overall Amplitude Accuracy
± 1.5 dB 20 to 30°C; frequency > 1 MHz; Signal input 0 to -50 dBm; Reference level 0 to -50 dBm; Input attenuation 10 dB; RBW 1 kHz; VBW 1 kHz; after cal; Preamp Off
± 0.5 dB Typical
±

GSP-9300 User Manual
330
Spurious Response
Second Harmonic Intercept
Preamp off; signal input -30dBm; 0 dB attenuation
+35 dBm Typical; 10 MHz < fc < 775 MHz
+60 dBm Typical; 775 MHz ≤ fc < 1.5 GHz
Third-order Intercept
Preamp off; signal input -30dBm; 0 dB attenuation
> 1dBm 300 MHz to 3 GHz
Input Related Spurious
< -60 dBc Input signal level -30 dBm, Att. Mode, Att=0dB; 20-30ºC
Residual Response (inherent)
<-90 dBm Input terminated; 0 dB attenuation; Preamp off
Sweep
Sweep Time
Range 310 us to 1000 s Span > 0 Hz
50 us to 1000 s Span = 0 Hz; Min Resolution = 10 us
Sweep Mode Continuous; Single
Trigger Source Free run; Video; External
Trigger Slope Positive or negative edge
RF Preamplifier
Frequency Range 1 MHz to 3 GHz
Gain 18 dB Nominal
(installed as standard)
Front Panel Input/Output
RF Input
Connector Type N-type female
Impedance 50 ohm Nominal
VSWR <1.6 :1 300 kHz to 3 GHz; Input attenuator ≥ 10 dB

APPENDIX
331
Power for Option
Connector Type SMB male
Voltage/Current DC +7V / 500 mA max With short-circuit protection
USB Host
Connector Type A plug
Protocol Version 2.0 Supports Full/High/Low speed
MicroSD Socket
Protocol SD 1.1
Supported Cards microSD, microSDHC Up to 32GB capacity
Rear Panel Input/Output
Reference Output
Connector Type BNC female
Output Frequency 10 MHz Nominal
Output Amplitude
3.3V CMOS
Output Impedance
50 ohm
Reference Input
Connector Type BNC female
Input Reference Frequency
10 MHz
Input Amplitude -5 dBm to +10 dBm
Frequency Lock Range
Within ± 5 ppm of the input reference frequency
Alarm Output
Connector Type BNC female Open-collector Trigger Input/ Gated Sweep Input
Connector Type BNC female
Input Amplitude 3.3V CMOS
Switch Auto selection by function LAN TCP/IP Interface
Connector Type RJ-45
Base 10Base-T; 100Base-Tx; Auto-MDIX USB Device
Connector Type B plug For remote control only; supports USB TMC
Protocol Version 2.0 Supports Full/High/Low speed
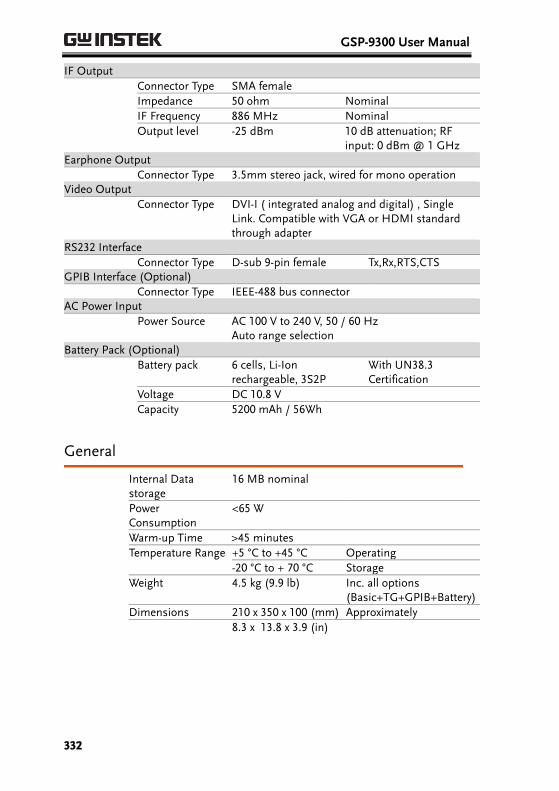
GSP-9300 User Manual
332
IF Output
Connector Type SMA female
Impedance 50 ohm Nominal
IF Frequency 886 MHz Nominal
Output level -25 dBm 10 dB attenuation; RF input: 0 dBm @ 1 GHz
Earphone Output
Connector Type 3.5mm stereo jack, wired for mono operation Video Output
Connector Type DVI-I ( integrated analog and digital) , Single Link. Compatible with VGA or HDMI standard through adapter
RS232 Interface
Connector Type D-sub 9-pin female Tx,Rx,RTS,CTS GPIB Interface (Optional)
Connector Type IEEE-488 bus connector AC Power Input
Power Source AC 100 V to 240 V, 50 / 60 Hz Auto range selection
Battery Pack (Optional)
Battery pack 6 cells, Li-Ion rechargeable, 3S2P
With UN38.3 Certification
Voltage DC 10.8 V
Capacity 5200 mAh / 56Wh
General
Internal Data storage
16 MB nominal
Power Consumption
<65 W
Warm-up Time 45 minutes
Temperature Range +5 °C to +45 °C Operating
-20 °C to + 70 °C Storage
Weight 4.5 kg (9.9 lb) Inc. all options (Basic+TG+GPIB+Battery)
Dimensions 210 x 350 x 100 (mm) Approximately
8.3 x 13.8 x 3.9 (in)
>

APPENDIX
333
Tracking Generator5 (Optional)
Frequency Range 100 kHz to 3 GHz
Output Power -50 dBm to 0 dBm in 0.5 dB steps
Absolute Accuracy ± 0.5 dB @160 MHz, -10 dBm, Source attenuation 10 dB, 20 to 30°C
Output Flatness Referenced to 160 MHz, -10 dBm
100 kHz to 2 GHz ± 1.5 dB
2 GHz to 3 GHz ± 2 dB
Output Level Switching Uncertainty
± 0.8 dB Referenced to -10 dBm
Harmonics < -30 dBc Typical, output level = -10 dBm
Reverse Power +30 dBm max.
Connector type N-type female
Impedance 50 ohm Nominal
Output VSWR < 1.6:1 300 kHz to 3 GHz, source attenuation ≥ 12 dB
[5] The minimum RBW filter is 10kHz when the TG output is ON.
USB Power Sensor (Optional)
Type Average power sensor Model: PWS-06
Interface to Meter USB cable to GSP9300 Front-Panel USB Host
Connector Type N-type male, 50 ohm nominal
Input VSWR 1.1: 1 Typical
1.3: 1 Max
Input Frequency 1 to 6200 MHz
Sensing Level -32 to +20 dBm
Max. Input Damage Power
≤ 27 dBm

GSP-9300 User Manual
334
Power Measurement Uncertainty @ 25 °C
-30 dBm to +5 dBm: 1 MHz to 3GHz: ±0.1 dB typical; ±0.3 dB max. 3 GHz to 6 GHz: ±0.15 dB typical; ±0.3 dB max. +5 dBm to +12 dBm: 1 MHz to 3GHz: ±0.15 dB typical; ±0.3 dB max. 3 GHz to 6 GHz: ±0.15 dB typical; ±0.3 dB max +12 dBm to +20 dBm: 1 MHz to 3GHz: ±0.2 dB typical; ±0.4 dB max. 3 GHz to 6 GHz: ±0.2 dB typical; ±0.4 dB max.
Power Measurement Uncertainty @ 0 to 25 °C
-30 dBm to +5 dBm: 1 MHz to 3GHz: ±0.25 dB typical 3 GHz to 6 GHz: ±0.25 dB typical +5 dBm to +12 dBm: 1 MHz to 3GHz: ±0.20 dB typical 3 GHz to 6 GHz: ±0.20 dB typical +12 dBm to +20 dBm: 1 MHz to 3GHz: ±0.35 dB typical 3 GHz to 6 GHz: ±0.30 dB typical
Linearity @ 25 °C ±3 %
Measurement Speed
100 ms for Low Noise Mode Typical 30 ms for Fast Mode

APPENDIX
335
GSP-9300 Dimensions
LOCAL
CONTROL
FILE MARKER AUXILIARY
Frequency
Autoset
Amplitude
Span
BW/AVG
Display
Trace
Sweep
Measure
Trigger
File
Recall
Save
Peak
Marker
Marker
System
Preset
Search
QuickSave
EMCPretest
7
4
1
0
8
5
2
9
6
3
/ Enter
BK SP
SweepMode
LimitLine
Sequence
OptionControl
Fast/Normal
F 4
F 3
F 2
F 1
F 6
F 5
F 7
RF INPUT 50
REV PWR +30dBm
TG OUTPUT 50 W W500mA MAX.
DC 7VOUTPUT +30dBm MAX.
MAX.DC ±50V MAX.DC ±50V
9 kHz 3 GHz
Spectrum AnalyzerGSP -9 3 0 0
350.0
213.
0
200.
0
100.0
105.7

GSP-9300 User Manual
336
Declaration of Conformity
We
GOOD WILL INSTRUMENT CO., LTD.
declare that the below mentioned product
Type of Product: Spectrum AnalyzerModel Number: GSP-9300
For the evaluation regarding the Electromagnetic Compatibility and Low Voltage Directive, the following standards were applied:
EMC
EN 61326-1: EN 61326-2-1: EN 61326-2-2:
Electrical equipment for measurement, control and laboratory use –– EMC requirements (2013)
Conducted & Radiated Emission EN 55011: 2009+A1: 2010
Electrical Fast Transients EN 61000-4-4: 2012
Current Harmonics EN 61000-3-2: 2014
Surge Immunity EN 61000-4-5: 2014
Voltage Fluctuations EN 61000-3-3: 2013
Conducted Susceptibility EN 61000-4-6: 2014
Electrostatic Discharge EN 61000-4-2: 2009
Power Frequency Magnetic Field EN 61000-4-8: 2010
Radiated Immunity EN 61000-4-3: 2006+A1: 2008+A2: 2010
Voltage Dip/ Interruption EN 61000-4-11: 2004
Low Voltage Equipment Directive 2014/35/EU
Safety Requirements EN 61010-1: 2010 (Third Edition) EN 61010-2-030: 2010 (First Edition)
GOODWILL INSTRUMENT CO., LTD. No. 7-1, Jhongsing Road, Tucheng District, New Taipei City 236, Taiwan Tel: +886-2-2268-0389 Fax: +886-2-2268-0639 Web: http://www.gwinstek.com Email: [email protected] GOODWILL INSTRUMENT (SUZHOU) CO., LTD. No. 521, Zhujiang Road, Snd, Suzhou Jiansu 215011, China Tel: +86-512-6661-7177 Fax: +86-512-6661-7277 Web: http://www.instek.com.cn Email: [email protected]
GOODWILL INSTRUMENT EURO B.V. De Run 5427A, 5504DG Veldhoven, The Netherlands Tel: +31-(0)40-2557790 Fax: +31-(0)40-2541194 Email: [email protected]
is herewith confirmed to comply with the requirements set out in the Council Directive on the Approximation of the Laws of the Member States relating to the EMC: 2014/30/EU, LVD: 2014/35/EU, WEEE: 2012/19/EU and RoHS: 2011/65/EU.

INDEX
337
INDEX 2FSK ........................................... 156 Accessories ................................. 12 ACPR ......................................... 127 Adjacent channel power ......... 127 Alarm output ............................ 120 AM Analysis ............................. 132 AM/FM demodulation sound
out ......................................... 143 Amplitude
Amplitude correction .................. 54 Attenuation .................................... 49 Auto scale ...................................... 50 Correction ...................................... 55 Input impedance ........................... 61 Pre-amplifier ................................. 62 Reference level .............................. 48 Reference level offset ................... 53 Scale ................................................ 51 Scale/div ........................................ 50 Vertical scale unit ......................... 53 View scale ...................................... 51
ASK measurement ................... 144 Autoset ........................................ 64
Horizontal settings ....................... 65 Vertical settings ............................ 65
Average Trace ............................................... 69 Type ................................................ 71
Bandwidth RBW ................................................ 66 VBW ................................................ 68 VBW/RBW ratio ........................... 68
Battery Safety instruction ............................ 5
Battery insertion ......................... 27 Carrier to noise ratio ............... 184 Caution symbol ............................ 3 Cleaning the instrument ............. 5
CNR ........................................... 184 Composite second order ......... 188 Composite triple beat .............. 189 Conventions ................................ 34 CSO ............................................ 188 CTB ............................................ 189 Date, Time, Wake-up clock ....... 30 Declaration of conformity ....... 336 Decoding
ASK ............................................... 147 FSK ................................................ 153
Default settings ........................ 285 Demo Kit ................................... 243
Activation .................................... 245 ASK ............................................... 243 FSK ................................................ 245
Display Backlight ...................................... 108 Brightness .................................... 108 Display mode
Setting .............................................. 110 Spectrogram ................................... 111 Topographic ................................... 112
Reference level line .................... 109 Spectrogram markers ................. 113 Spit spectrum view .................... 115 Topographic markers ................ 113 Video out ..................................... 109
Display diagram ......................... 21 Disposal instructions ................... 6 Disposal symbol ........................... 3 EMC
EMI E probe ................................. 212 EMI M probe ............................... 209 EMI Test ....................................... 203 EMS Test ...................................... 218 Overview ..................................... 202 Voltage probe .............................. 215
EMI Filter .................................... 72
GSP-9300 User Manual
338
EN61010 Measurement category .................. 4 Pollution degree .............................. 5
Environment Safety instruction ............................ 5
FAQ ........................................... 281 File
Copy files ..................................... 254 Correction data ........................... 251 Delete files ................................... 255 File explorer ................................. 251 File types ...................................... 250 Image preview ............................ 253 Limit line data ............................. 250 Move files ..................................... 254 Overview ..................................... 248 Power meter data ....................... 251 Quick save ................................... 263 Recall files .................................... 261 Rename files ................................ 256 Save files ...................................... 258 Screen files ................................... 250 Sequence data .............................. 251 Sort files ........................................ 253 State data ...................................... 250 Trace data .................................... 250
Firmware update ....................... 32 First time use instructions ........ 26 FM Analysis ............................. 138 Frequency
Center frequency .......................... 41 Center frequency step .................. 43 Frequency offset ........................... 44 Start frequency .............................. 42 Stop frequency .............................. 42
Front panel diagram ................. 14 FSK measurement ................... 150 Glossary .................................... 283 GPIB function check ................ 280 Ground
Symbol .............................................. 3
Harmonic measurement ......... 192 Image preview ......................... 253 LAN function check ................ 280 Language .................................. 118 Limit lines
Creation ........................................ 220
Deletion ........................................ 224 Overview ..................................... 220 Pass/fail testing .......................... 225
List of features .............................. 9 Manchester Decoding
ASK ............................................... 147 FKS ................................................ 153
Marker Delta markers ................................ 97 Functions
Frequency counter ......................... 100 Noise .................................................. 99
Move to trace ............................... 101 Moving delta markers ................. 98 Moving markers manually ......... 96 Moving markers to preset
positions .................................... 96 Moving reference markers .......... 98 Normal marker ............................. 95 Peak configuration .................... 105 Peak search .................................. 103 Peak table ..................................... 106 Table ............................................. 102
Marketing Contact ......................................... 281
Measurement 2FSK
pass fail ............................................ 158
2FSK .............................................. 156 ACPR ............................................ 127 AM Analysis ................................ 132
pass fail ............................ 136, 148, 154
AM/FM demodulation sound out ............................................ 143
ASK ............................................... 144 ASK decoding ..................... 147, 153 CNR .............................................. 184 CSO ............................................... 188 CTB ............................................... 189 FM Analysis ................................ 138
pass fail ............................................ 141
FSK ................................................ 150 Harmonics ................................... 192 NdB bandwidth .......................... 194 OCBW ........................................... 130 Overview ..................................... 125 P1dB measurement .................... 196 P1dB normalization.................... 199 Phase Jitter ................................... 160 SEM ............................................... 175

INDEX
339
3GPP .................................................178 802.XX...............................................180 Overview .........................................162 User ...................................................176
TOI ................................................ 182
Menu tree Amplitude ................................... 287 Autoset ......................................... 289 BW Avg ........................................ 289 Control options ........................... 300 Display ......................................... 293 EMC Pretest ................................. 324 File ................................................. 302 Frequency .................................... 289 Limit line ...................................... 290 Marker .......................................... 294 Measure ........................................ 309 Options ......................................... 300 Recall ............................................ 307 Save ............................................... 304 Sequence ...................................... 291 Span .............................................. 289 Sweep ........................................... 289 System .......................................... 296 Trace ............................................. 292 Trigger .......................................... 291
Miller Decoding ASK ............................................... 147 FSK ................................................ 153
NdB bandwidth ....................... 194 OCBW ....................................... 130 Occupied bandwidth ............... 130 P1dB measurement .................. 196 P1dB normalization ................. 199 Peak search ............................... 103 Peak table .................................. 106 Phase Jitter ................................ 160 Power down ............................... 29 Power meter
Activation .................................... 237 Data logging ................................ 239
Power on/off Safety instruction ............................ 4
Power up ..................................... 28 Pre-amplifier .............................. 62 Preset ......................................... 121
Power on settings ....................... 122 Settings ......................................... 122
User settings ................................ 121
Quick save ................................. 263 RBW ............................................. 66 Rear panel diagram ................... 19 Remote control ......................... 265
GPIB configuration..................... 266 Hislip ............................................ 269 LAN configuration ..................... 267 LXI password .............................. 268 RS232C configuration ................ 275 USB configuration ...................... 266 WLAN configuration ................. 270
Remote control function check275 Replace the clock battery ........ 282 Restore default settings ..... 33, 121 SEM
3GPP ............................................. 178 802.XX ........................................... 180 Overview ..................................... 162 User ............................................... 176
Seqeunce Editing .......................................... 227 Overview ..................................... 227 Running ....................................... 231
Service operation About disassembly ......................... 4 Contact ......................................... 281
Span Full span ......................................... 46 Last span ........................................ 47 Setting ............................................. 45 Zero span ....................................... 46
Specifications ............................ 326 Amplitude ................................... 327 Dimensions .................................. 335 Frequency .................................... 326 General ......................................... 332 Input/output ............................... 330 Power sensor ............................... 333 RF amplifier ................................. 330 Sweep ........................................... 330 Tracking generator ..................... 333
Spectrum emission mask testing175 Status icons ................................. 24 Sweep
Continous sweep .......................... 75 Gated sweep .................................. 75 Single sweep .................................. 74

GSP-9300 User Manual
340
Sweep Control ............................... 79 Sweep Mode .................................. 79 Sweep time .................................... 73
System Alarm output .............................. 120 Date & time .................................. 118 Date & time display ................... 119 Set language ................................ 118 System information .................... 117 View error messages ................. 117 Wake-up clock ............................ 119
THD ........................................... 192 Third order intermodulation
distortion .............................. 182 Tilting stand ............................... 26 TOI ............................................. 182 Trace
Detection modes ........................... 85 Icons ................................................ 82 Math ................................................ 83
Selecting trace ............................... 81 Type ................................................ 81
Tracking generator Activation .................................... 232 Normalization ............................. 233
Trigger Delay ............................................... 93 External trigger ............................. 91 Free run .......................................... 89 Mode ............................................... 92 Video trigger ................................. 89
UK power cord ............................. 7 USB function check .................. 280 VBW ............................................ 68 VBW/RBW ratio ........................ 68 Video out port .......................... 109 Warning symbol .......................... 3 Web server function check ..... 277