of copper in kings bay rnd cumberland sound(u) ocean
TRANSCRIPT

AD-RI64 161 SURVEY OF COPPER IN KINGS BAY RND CUMBERLAND SOUND(U) 1/2NAVAL OCEAN SYSTEMIS CENTER SAN DIEGO CA
LIEBERMAN ET AL. OCT 85 NOSC/TR-1862UNCLASSIFIED F/G 1112 NL
EEEEohEEEEohEEEomhhEEEEEEEEEEEhEEEEEEmhhEEEEEEEEEEEEEEEEEEohEEEEEEmhEEE

If i 28 1125
L32
L 112-2
IBI01111_ L EO 251 .
MICROCOPY RESOLUTION TEST CHART-ARDS -i963-A
'e4r
l&
[ F',. '
[F~t ,
[-.,

AD-A164 161
Technical Report 1062October 1985
SURVEY OF COPPER IN KINGS BAYAND CUMBERLAND SOUND
S. H. LiebermanR. K. JohnstonNaval Ocean Systems Center PT C0D. R. Bower -
Computer Sciences CorporationFEB19 1
S. M. InmanSan Diego State University Foundation - --
l Naval Ocean Systems CenterSan Diego, California 92152-5000
Approved for public release; distribution unlimited
C-J
,U.j
7.

NAVAL OCEAN SYSTEMS CENTERSan Diego, California 92152-5000
F. M. PESTORIUS, CAPT, USN R.M. HILLYERCommander Technical Director
ADMINISTRATIVE INFORMATION
The work described herein was performed by the Marine EnvironmentBranch, Code 522, Naval Ocean Systems Center (NAVOCEANSYSCEN). for theChief of Naval Operations. Naval Facilities Engineering Command, and Officer inCharge of Construction. Trident.
Released by Under authority ofP.F. Seligman, Head S. Yamamoto. HeadMarine Environment Branch Environmental Sciences
*ACKNOWLEDGEMENTS
The authors acknowledge the contributions of the Officer in Charge ofConstruction, Trident, without whose sponsorship this research would not havebeen possible: Peter W. Havens for his help in coordinating. planning. andsupporting the survey as well as his critical review of the manuscript: F. BruceHarrington and CMD T.J. Bukoski for their timely support in making schedulingarrangements and interfacing with the Naval Submarine Base. Kings Bay; ShaulaWalker for her diligent typing of required memos and correspondence: LCDR G.L.
-~ Smith and CWO R. Grey. Kings Bay Waterfront Operations. for their supportand assistance in achieving the survey objectives: and Harry Graf. San Diego
.-" State University Foundation. for his dedicated technical assistance throughout theoperation. Finally. Dr. George Pickwell. NAVOCEANSYSCEN. provided theimpetus as well as continued support for the study.
• ,, JG
.- '.
5~%

UNCLASSIFIED
REPORT DOCUMENTATION PAGEI. MINORT mCWETY CaUUPICAIit 11k IEiIucVE
UNCLASSIFIED _________________________
2.& SECURITY CLASSIICATION4 AUTHORITY 3. DISTRISUTIO#4/AVAILASIUTY OF REPORTf
2k. DECLASSIFICAflORN/DOWIRADING SCHEULE
___________________________________________ Approved for public release; distribution unlimited.
4 PERFORMING ORKIAMAIO REPORT IdUMBER(S) S. MONITORING ORGANIZAION RWPMR NUMBERI
NOSC TR 1062 _______ ______________________
G. NAME OF PERFORMISNG ORGANIIZAION 6b. OFF ICE SYMBOL 7.NAME OF MONITORING ORGANIIZAION
' Naval Ocean Systems Center Code 522 ___________________________
* Sc. ADDRESS ICR1'. Ste& &W ZIP COd) 7b. ADDRESS tCflV. Sat and ZP Cede
San Diego, CA 92152-5000 __________________________
s, NAME OP FUNDIMG/SPONSORIG ORGANIZATION T b. OFFICE SYMBOL 9. PROCUREMENT INSTRUMENT IDENTIFICATION NUMBER
Chief otf Naval Operations, fI Wkb
Naval Facilities Engineering Command, and OP4501CC Trident 032P __________________________
Sc ADDRESS (Coy Stat. *ndZIP Codv) 10 SOURCE OP FUNDING NUMBERS
Washington, DC 20360 PROGRAM ELEMENT NO. PROJECT NO. TAM NO AgencyWashington, DC 20390 Accession No.
*Kings Bay, GA 31558 ONIN NFEC Y DN488882I1I TITLE t~nch* S~awdt Chwsdkcat,on
SURVEY OF COPPER IN KINGS BAY AND CUMBERLAND SOUND1 2 PERSONAL AUTHORIS)
S.H. Lieberman and R.K. Johnston, NOSC; D.R. Bower, Computer Sciences Corporation; and S.M. Inman, S.D. State University Foundation130 TYPE OP REPORT 13b TIME COVERED 14, DATE OF REPORT (Vow, At&I 0v 1S. PAGE COUNT
Finl FOM15 Jan 85 23Jn8FialFRMo23Ja__ October 1985 107
16 SUPPLEMENTARY NOTATION
17 COSATI CODES 18. SUBJECT TERMS (Cotiwm on rewatif dnecawy and 40MV b h UC nwnbwJ
FIELD GROUP SUB-GOU4P Marine environmental survey craft (MESC)Anodic stripping voltammetry (ASV)
IS BSRAT CIms e, ewe n~eer d~~ndrhrblckm~iwAtomic absorption (AA) spectrophotometry
A multiparameter survey consisting of physical. chemical, and biological measurements was performed to map the copper distribu-tion in Kings Bay and Cumberland Sound, Georgia. The results of this study suggest (1) Kings Bay was probably not a source of elevated
* -copper levels during the study interval, (2) dewatering of the dredge spoil containment area does not appear to be a source of copper pollution,and (3) concentrations in the Lower Turning Basin of Kings Bay were slightly higher than levels in the Upper Basin or in Cumberland Sound,suggesting possible input from copper antifouling coatings.
20 DISTRIBUTION/AVAR.L5UTY OP ABSTRACT 21. ABSTRACT SECURIT CL.ASSIFICATION
UNCLASSIFODUUMITED Q SAME AS RPT UNCLASSIFIEDASSFIE22. NAMIE OFRSOSBEINDIVDUAL 22. TELEPHONE Itm, A,.. Cede 22. OFFICE SYMBOL.yS.H. Lieberman (619) 2254660 oe2
DD FORM 17 ,84 JAN 83APEIIN A EUE NTLEHUTDUASFIEDPISP
AL0TE DT"AEOSLT

SUMMARY
OBJECTIVE
A multiparameter survey consisting of physical. chemical. and biological measurementswas performed to map the copper distribution in Kings Bay and Cumberland Sound.Georgia.
METHOD
Continuous real-time measurements were made on board the survey craft fortemperature, salinity. oxygen, pH. chlorophyll a fluorescence, light transmission. cupric ionelectrode response. and bottom depth. Discrete samples were collected for copperanalysis by anodic stripping voltammetry (ASV) and atomic absorption (AA)spectrophotometry. Data are presented from underway mapping surveys of Kings Bay andCumberland Sound during ebb and flood tidal conditions, tidal studies at a fixed location
0 in Kings Bay. and an effluent monitoring station in an area receiving effluent from a* dredge spoil containment area undergoing dewatering.'S
RESULTS
Results ranged from 1.2 to 5.8 #g/L for discrete AA samples, 0.3 to 2.2 "6g/L fordiscrete ASV samples. and -200 to -40 mV for cupric ion electrode response. A two-waynested analysis of variance (ANOVA) showed no significant difference (P>0.05) for ASVsamples and a highly significant difference (P<0.0001) for AA samples with respect tosample location. The results of this study suggest that (1) Kings Bay was probably nota source of elevated copper levels during the study interval. (2) dewatering of the dredgespoil containment area does not appear to be a source of copper pollution. and (3)concentrations in the Lower Turning Basin of Kings Bay were slightly higher than levelsin the Upper Basin or in Cumberland Sound, suggesting possible input from copperantifouling coatings.
q jon For __
'.4
."., '"- •
7. 1.

CONTENTS
PageILLUSTRATIONS ............................................................................. v
TABLES ...................................................................................... vi
INTRODUCTION .............................................................................. I
METHODS .................................................................................... 2Field Measurement Program.............................................................. 2Instrumentation ............................................................................ 2Calibration Procedures .................................................................... 5
* ,Discrete Sampling Procedures ............................................................ 5Laboratory Copper Analyses.............................................................. 6Experimental Plan ......................................................................... 6
RESULTS ..................................................................................... 6*Underway Mapping Surveys.............................................................. 6
Tidal Monitoring Stations ................................................................ 23Effluent Monitoring........................................................................ 23
DISCUSSION .................................................................................... 23
SUMMARY AND CONCLUSIONS............................................................ 28
R EFER EN C ES .................................................. ..... 29
APPENDIX A. UNDERWAY MAPPING DATA........................................... A-1
APPENDIX B. TIDAL MONITORING DATA .................................... B-I
APPENDIX C. EFFLUENT MONITORING DATA ....................................... C-I
APPENDIX D. COPPER DATA: CHARTS SHOWING SAMPLE LOCATIONSAND VALUES FOR SAMPLES COLLECTED/MEASURED 19 JANUARY1985 ........................................................................ ............. D-1

ILLUSTRATIONS
Page
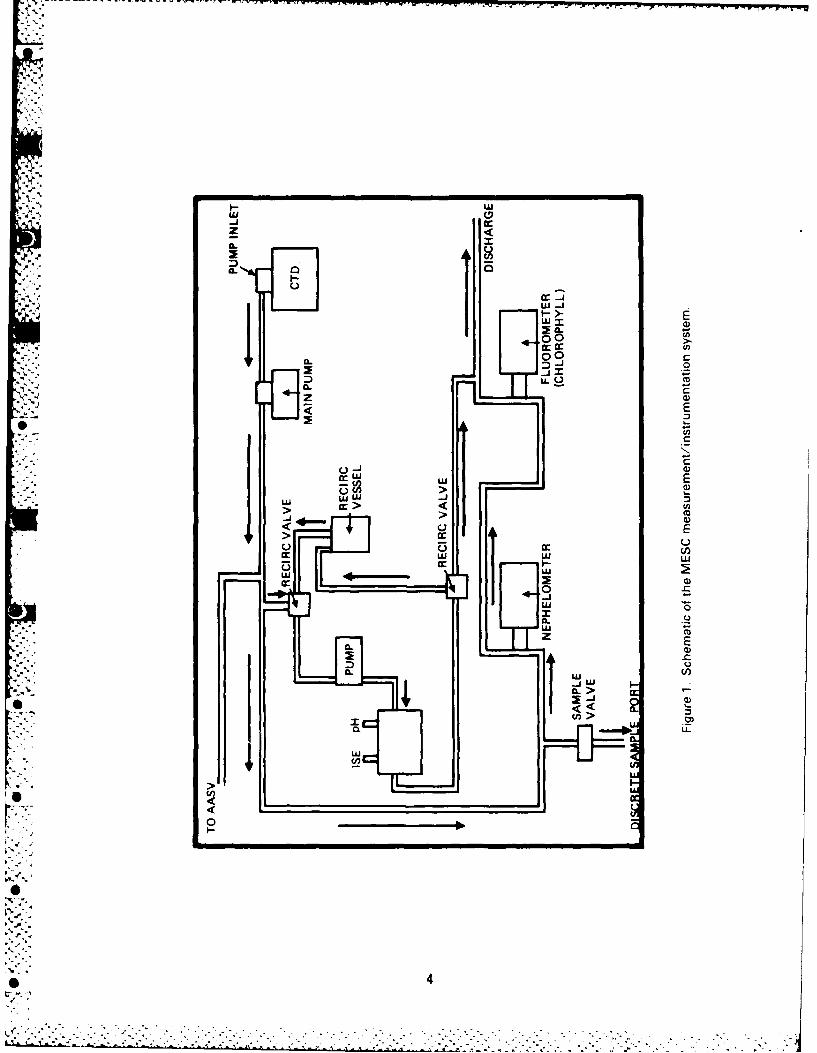
1. Schematic of the MESC measurement/instrumentation system ........................ 42. Location of sampling areas in the Kings Bay-Cumberland Sound .................... 73. Tidal height versus time for 15 to 24 January 1985 at the Crooked River
entrance ................................................................................................. .... . 94a. Composite cruise track showing area coverage obtained during underway
mapping conducted 19 January 1985: Upper Turning Basinand Low er T urning B asin ......................................................................... 11
4b. Composite cruise track showing area coverage obtained during underwaymapping conducted 19 January 1985: Cumberland Sound ......................... 12
5a. Locations of discrete samples collected during sampling on 19 January1985: Upper Turning Basin and Lower Turning Basin .............................. 13
5b. Locations of discrete samples collected during sampling on 19 January1985: Cum berland Sound ........................................................................ . 14
* 6. Expanded plot of time-series data from underway mapping conducted on19 January 1985 in the Lower Turning Basin. Kings Bay ............... 16
7. Expanded plot of time-series from underway mapping conducted 19 January1985 in the Lower Turning Basin. Kings Bay ......................................... 17
8. Bar graphs showing mean copper concentrations measured by (a) GraphiteFurnice AA. (b) Automated ASV. and (c) Cu-ISE as a function oflocation (area) and tidal stage ................................................................... 20
[vIi6,

TABLES
Page
I Parameters measured and instrumentation............................................ 32. Date, time, type of measurement. and location...................................... 83I Discrete copper ASV. AA values, and Cu electrode responses for Kings Bay
and Cumberland Sound (19 January 1985)..................................... 184. Sample categories used in the ANOVA............................................... 215a. ANOVA table for ASV data............................................................ 225b. ANOVA table for AA data ............................................................. 226. Discrete copper ASV and AA values in the area of the effluent
outfall .............................................................................. 24
0 vi
>:§::'...:. %

INTRODUCTION
Recent analyses of water in Kings Bay and Cumberland Sound show elevated andincreasing levels of copper. Values of total copper as high as 38 #g/L have beenreported (Naval Facilities Engineering Command (NAVFACENGCOM), 1984). Monitoringduring 1982-1983 frequently showed values in excess of the suggested EnvironmentalProtection Agency (EPA) criterion of 23 /g/L for marine waters (EPA. 1980). Thesevalues contrast with concentrations of approximately 2 #g/L measured in comparableestuarine systems in Georgia (Windom et al., 1983). Although results to date are basedon a limited number of discrete samples, there is concern about the apparent trendtowards higher concentrations. The question arises whether Navy activity, includingdredging operations in Kings Bay. may be responsible for these elevated copper levels.
In response to this concern, a comprehensive environmental study of copper inKings Bay and Cumberland Sound was conducted in January 1985. Detailedmeasurements of copper and supporting physical, chemical. and biological parameters weremade to evaluate the distribution of copper in Kings Bay and vicinity. The fieldmeasurement program was conducted using the Naval Ocean System Center's (NOSC)Marine Environmental Survey Craft (MESC). which uses a system of in situ andflowthrough monitoring devices (Zirino & Hightower, 1984). Measurements are madefrom a towed conductivity-temperature-depth (CTD) "fish" or on a flowing stream ofseawater provided by a pumped seawater system. Instrumentation aboard the MESCpermits continuous measurement of uncomplexed copper (i.e.. ionic Cu2+) on the pumpedseawater stream and near-real-time analysis of total dissolvable copper by automatedanodic stripping voltammetry (AASV). A data acquisition system records and displaysinformation from all continuous sensors (temperature, salinity, oxygen, pH, chlorophyll.light transmission. Cu2- . and bottom depth) at rates up to 30 samples a minute. Thisprovides the capability for tracking plumes and/or locating point sources while the craft isunderway or measuring variability as a function of time when the craft is moored at afixed location. The chemical and physical data are combined with navigational data togenerate underway maps of the environmental parameters of interest. In addition, real-
*' time display of copper data and supporting environmental data provide a mechanism forselecting sample sites for collection of discrete samples for copper analysis by traditionallaboratory procedures.
V
This report presents the results of measurements made from 15 to 23 January1985 Data are presented from underway mapping surveys of Kings Bay and CumberlandSound during ebb and flood tidal conditions, tidal studies at a fixed location in thevicinity of the Navy facilities in Kings Bay. and a monitoring station in which the survey
0r platform was moored in an area receiving effluent from a dredge spoil containment areathat was undergoing dewatering. Results from discrete samples collected for copperanalyses by traditional laboratory procedures are also reported.
Measurements made during this study are used to address several specificquestions: (1) Is there any evidence of a point source of copper that might be
7U contributing to the apparent elevation of copper levels in Kings Bay or CumberlandSound? (2) Are levels of copper significantly higher in Kings Bay than in CumberlandSound? (i.e.. Is the Navy responsible for the elevated copper levels?) and (3) What effect
4.
,"' " ...'. ' " ' '." -. .7 ." ..." .,' ..',.' ... ...,7 ' .. " : ":,'- , ".. , " " ".", " '. ', , '[ ,.'. -. '.-.. - . -..I

does the dewatering of dredge spoils have on the level of copper in this estuarinesystem?
METHODS
Field Measurement Program. Underway mapping, tidal monitoring, and effluentmonitoring were conducted from the NOSC MESC. The MESC is a self-contained, self-propelled. 38-foot shallow-draft survey platform that houses a suite of on-board physical.chemical, and biological sensors and a data acquistion and processing system. Speed ofthe craft during underway mapping was approximately 2 knots. Position of the craftduring mapping events was determined using dead-reckoning techniques with reference tofixed navigational markers and landmarks. The dead-reckoning method gives an estimatedposition resolution of *20 meters. Position of discrete samples collected during underwaymapping surveys was determined by interpolation between navigational fixes bracketing thetime the sample was collected (Johnston. 1983). During tidal monitoring, the craft wassecured to the medium auxiliary repair drydock (ARDM) pier. During effluent monitoring.
""S the craft was anchored approximately 10 meters from the mouth of the channel carrying*: effluent from the Mainside Disposal Area into Kings Bay at a location approximately 150
meters southeast of the USS SIMON LAKE (AS 33).
Instrumentation. Two types of copper measurements were made on board the craft. during the field study. Ionic or "free" copper was monitored continuously using a copper
ion-selected electrode (Cu-ISE) (Zirino & Seligman. 1981). Total "dissolvable" copperwas measured by AASV on discrete samples acidified to pH 2 with 50-percent UltrexHNO 3 (J.T. Baker Chemical Co.) (Zirino & Lieberman. 1975). Seawater for bothmeasurements was pumped on board the survey craft through approximately 5 meters ofnoncontaminating polyethylene hose using a Jabsco Model 18630-0003 sealless magneticdrive pump. The pump. which does not have any metal parts that contact the sample.was used to pull seawater from an intake attached to a CTD fish towed off thestarboard side of the survey craft. The fish was maintained at a depth of approximately1 meter below the surface of the water. Flow rate of the pumping system wasapproximately 40 gal/min.
* PIn addition to the copper measurements, supporting environmental data weremeasured using in situ sensors on the towed CTD system and sensors that mademeasurements on a pumped seawater stream on board the craft. A list of parametersmeasured and the instrumentation used is given in Table 1. Figure 1 is a schematic ofthe on-board manifold system.
Signals from the various sensors were sampled and recorded using a dataacquisition and processing system based on a dual processor microcomputer. Analogsignals from the CTD system, copper and pH electrodes. fluorometers. etc.. weresubjected to an integrating analog to digital (A-D) conversion and sampled in conjunctionwith the digital signal from the fathometer using an Analog Devices MMac 5000measurement and control subsystem. The data were telemetered to an IBM-compatiblepersonal computer (PC) and recorded on floppy disks The PC was also used to performreal-time calibration and hard-copy graphics display. Two-second sampling rates were usedduring underway mapping periods. For a nominal craft speed of 2 knots, this corresponds
2

Table 1. Parameters measured and instrumentation.
Sensor Type Parameter InstrumentationC,- .
_ In Situ Temperature Interoceans 513D CTDConductivityDissolved Oxygen
N Light Transmission
Bottom Depth Fathometer with Thru-HullTransducer
Pumped Realitive CU2 Ag/AgCI ISE
"Dissolvable" Cu Automated Anodic StrippingVoltammetry (Zirino &
* Lieberman, 1975)
pH Glass Electrode
Nephelometry Turner Designs with FlowAttachment
Chlorophyll a Turner Designs with FlowAttachment
Discrete Total Cu Graphite Furnace AA
3
-.-. -,,,'1-. -*
2 a.
CL 00-J 0
C.)
U. W- E,
L) CCz"
00
W< <
CL U)
I I
CA L

to a spatial resolution of 2 meters. Five- to thirty-second sampling intervals were usedfor tidal stations.
Calibration Procedures. The CTD system (temperature, conductivity, percenttransmittance, dissolved oxygen, and probe depth) was calibrated by the manufacturer(Interocean Systems. Sari Diego) prior to the field operation. The pH electrode wascalibrated against standard buffer solutions periodically during the operation.Nephelometer measurements were calibrated against a standard curve generated byadding formazine standard to 0.45 #-filtered seawater (American Public HealthAssociation. 1980).
Cu-ISE mV response was recorded directly. No attempt was made to calibratethe ISE in terms of Cu2 f because measured potentials in seawater do not representequilibrium potentials in the thermodynamic sense (Zirino & Seligman. 1981). In spiteof the non-Nerstian behavior of the electrode, measurements in seawater (Williams &Baldwin. 1976: Zirino et al. 1980) have shown increasingly positive potentials correlatewith higher copper concentrations as measured by other analytical techniques. Inaddition. Sunda and Guillard (1976) have presented convincing evidence showing it is the
* Cu 2- activity (a quantity closely related to the copper measured by the ISE) and not
the total copper concentration that determines the toxicity to planktonic organisms. Withthe above qualifications in mind, the Cu-ISE potential should be viewed as an indicatorof Cu 2 t in seawater and not as a measure of the total copper. Even though the Cu-ISE measurements are not directly comparable with other copper measurements, theelectrode provides useful information because it is the only method that provides acontinuous signal. Furthermore. the potential measured by the electrode appears to haveimportant significance with respect to the fraction of copper that is toxic to organisms.
ASV measurements are also sensitive to the form or speciation of copper inseawater. Under acid conditions, ASV measures that fraction of the total copper in thefree or ionic state and all complexes that can be reduced at the electrode. Metalstrongly bound to dissolved complexes or associated with the particulate material maynot be measured by this technique. ASV measurements are useful because they providea near-real-time means of field analysis not possible with traditional laboratoryprocedures
Cu-ISE and ASV measurements both provide a framework for selecting samplingsites and interpreting results for discrete measurements of copper by atomic absorption(AA) spectrophotometry. This provides a unique capability for tracking plumes andlocating point sources.
*g Discrete Sampling Procedures. All samples collected for discrete copper analyses*.' were collected in 250-mL polyethylene bottles soaked in a nonionic detergent for several*ii hours, rinsed with deionized water several times, soaked in 8 N HNO 3 for at least 48
hours, and then rinsed at least three times with ultrahigh purity (Milli-Q) deionizedwater (Millipore Corp.). In the field, each sample bottle was rinsed with three aliquotsof the sample before the final sample was collected. Several workers have shown thatrigorous cleaning of sample containers and careful sample handling procedures arerequired to avoid sample contamination (e.g.. Bruland et al.. 1979). After collection.samples were acidified to pH 2 with Ultrex nitric acid.
5

Samples for ASV analyses were either collected automatically by the ASVinstrument, which was connected to the pumped seawater system, or collected from thesampling port on the manifold in precleaned sample bottles. ASV samples collected on-line were acidified and analyzed immediately. Samples collected in bottles were acidified topH 2 and analyzed within 24 hours.
Copper samples analyzed by graphite furnace AA spectrophotometry were collectedfrom the sample port on the pumping system. Samples were stored in precleanedpolyethylene bottles, acidified to pH 2 immediately after collection, and returned to thelaboratory for analysis.
Laboratory Copper Analyses. Copper was determined using the atomic absorption-furnace technique (Method 220.2. EPA 1983). Measurements were made on a Perkin-Elmer 5000 spectrophotometer equipped with an HGA-2000 graphite furnace. For allanalyses. 75-#sL injections of a 1:4 dilution of the acid-digested sample were used. Thedetection limit of the method for these conditions is approximately 1 /g/L.
Experimental Plan. To determine whether there was a significant difference in the0concentrations of copper in specific regions within Kings Bay and Cumberland Sound. the
study area was divided into three regions: UPPER - the Upper Turning Basin of KingsBay. LOWER - the Lower Turning Basin of Kings Bay. and SOUND - the CumberlandSound area (see Figure 2). Horizontal mapping and discrete copper samples were takenin each region during flood and ebb tide. Six copper ASV samples and six copper AAsamples were taken in each region during both tidal states. An analysis of variance(ANOVA) was performed on the data to determine whether significant differences existbetween tidal state, location, and the interaction between tidal state and location. Theeffect of tidal variability was observed by collecting continuous data while the craft wasmoored to the ARDM pier. The effect of dewatering the dredge spoil containment areawas observed by anchoring the survey platform in an area receiving the effluent andcollecting continuous data during the dewatering operation.
RESULTS
* .Table 2 lists the date, time. and type of measurement conducted during the study.The complete suite of data from the three measurement series (i.e.. underway mappingsurvey, tidal monitoring stations, and effluent monitoring station) is presented inAppendices A. B. and C. respectively. Locations of the outfall station, tidal monitoringstation, and underway mapping areas are shown in Figure 2. So data can be referencedto tidal state, Figure 3 shows times and heights of high and low waters calculated forthe period of 15 to 24 January at tne Crooked River entrance station.
Underway Mapping Surveys. For each underway mapping survey (Appendix A). atime-series plot showing Cu-ISE response, chlorophyll fluorescence, pH, percent relative
Alight transmission, dissolved oxygen, salinity, temperature. and bottom depth is presented.a This is followed by a map (or maps) showing the corresponding cruise track of the
survey craft. Times corresponding to turning points and/or navigational fixes are
6
VLI

doo
-. 2
..
E
00
NN
CL
AEa
.2
LMCJ

Table 2. Date, time. type of measurement, and location
Date Time Type of Measurement Location
15-16 Jan 1918-0700 Tidal Monitoring ARDM Pier16 Jan 1640-1806 Underway Mapping CS16-17 Jan 1840-1010 Tidal Monitoring ARDM Pier17 Jan 1105-1155 Effluent Monitoring Outfall17 Jan 1336-1656 Effluent Monitoring Outfall17 Jan 1735-1750 Effluent Monitoring Outfall17-18 Jan 1818-0130 Effluent Monitoring Outfall19 Jan 1048-1215 Underway Mapping LB.UB19 Jan 1229-1345 Underway Mapping UBIB19 Jan 1346-1524 Underway Mapping LB.CS19 Jan 1524-1654 Underway Mapping CS.LB.UB19 Jan 1655-1819 Underway Mapping UB.LB.CS19-20 Jan 1953-0611 Tidal Monitoring ARDM Pier20-21 Jan 1615-1206 Tidal Monitoring ARDM Pier21 Jan 1524-1650 Underway Mapping LB22 Jan 1537-1922 Tidal Monitoring ARDM Pier22-23 Jan 2057-1154 Tidal Monitoring ARDM Pier
Key: CS=Cumberland SoundLB=Lower Turning Basin-Kings BayUB=Upper Turning Basin-Kings Bay
8
0. :
k, - ___

- -- - - - - -. - +
41
A C).9----- - - - - - - - - - =-.9 +
-- - - - -- - - -U - -
V. LV L
-- - - - - - --- - -
2.Coo
--- - - - -- - -S - - -
- --- - - - - -
- 10
-0 -_--- - - - - - - - - -
4-= -- - - - - - - J2
-- - --Q - - N -
D C 4 -
%. % %

provided along the cruise track to relate the time-series data to geographic location.Finally. a map (or maps) shows the location, as determined by interpolation from thetime of collection and bracketing navigational fixes, of each discrete copper samplecollected during that set of time-series measurements. The discrete sample chartfacilitates comparison of discrete copper measurements with ancillary underway data.
Measurements (Figure A-1) conducted 16 January along a cruise track (Figure A-2)proceeding from ARDM pier into Cumberland Sound to the north end of Stafford Islandand back along approximately the same cruise track show only minor changes. Becausenearly the same track was followed on the northern transect as on the return transect tothe south, there is an obvious symmetry to the data. The most significant feature is asmall temperature-salinity front (temperature gradient less than 0.5°C-salinity gradient lessthan 0.5°/oo) located approximately midway along the axis of Stafford Island. Althoughdissolved oxygen and light transmission showed higher values in this colder, less salinewater, chlorophyll fluorescence and Cu-ISE response remained nearly constant.
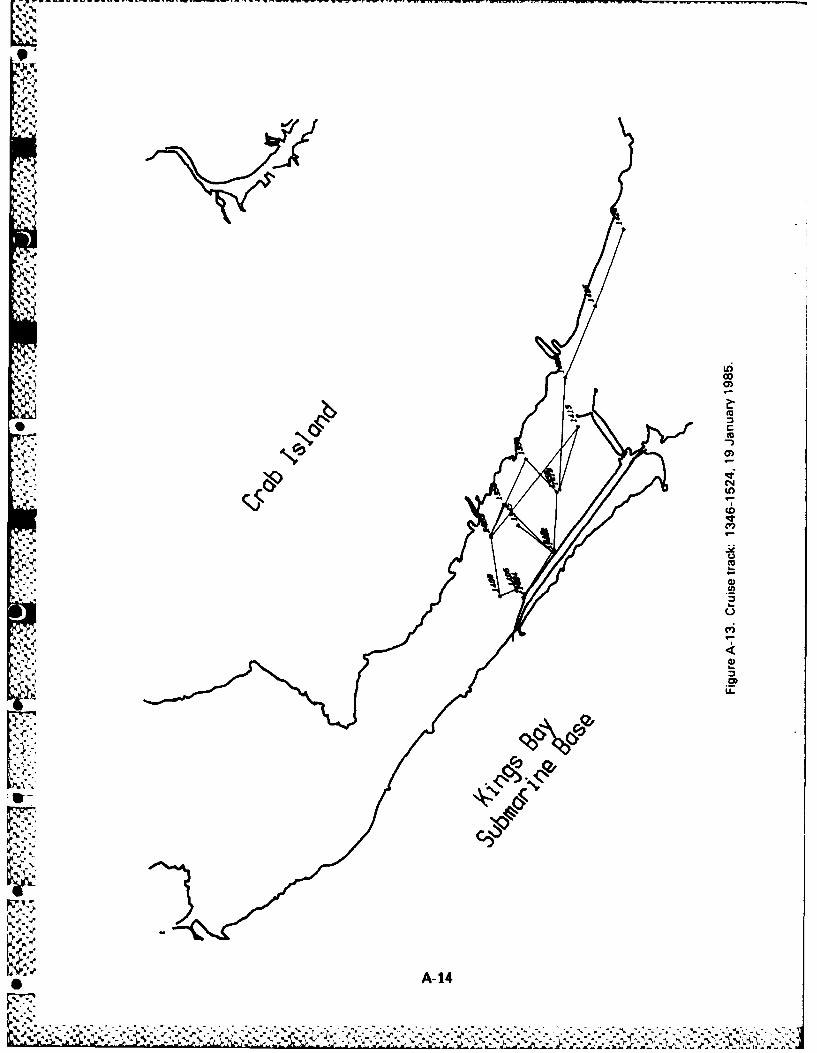
The most intensive mapping of the Kings Bay-Cumberland Sound area wasconducted on 19 January. Figures 4a and 4b show a composite cruise track of thecoverage obtained. Because of the overlap in coverage resulting from repeated transectsthrough the area. the data are divided into separate segments. Separate track charts aregiven in Appendix A for each segment of the time-series data.
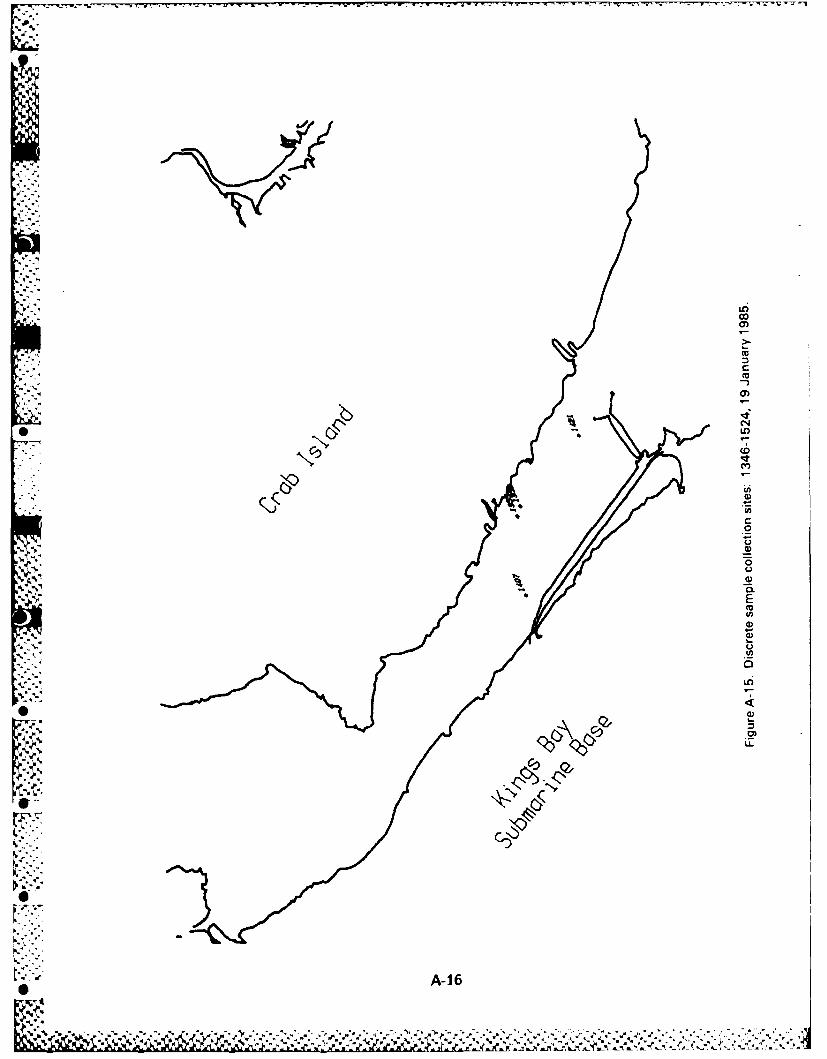
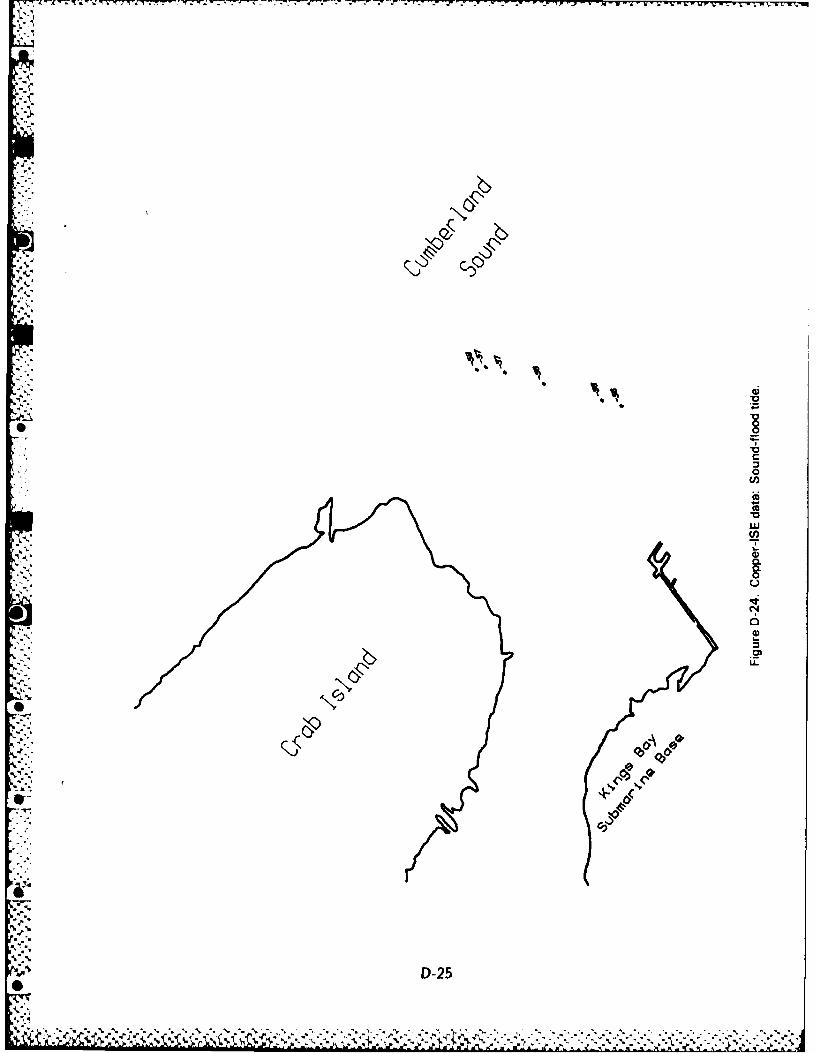
The comprehensive mapping program conducted on January 19 is the result of theexperimental sampling plan designed to test for differences in copper concentrationsbetween the Upper Basin. Lower Basin. and Cumberland Sound during ebb and floodtides. In addition to continuous underway mapping with the Cu-ISE. at least six samplesfor ASV and laboratory AA analysis were collected in each of the three areas during eachtidal stage. Figures 5a and 5b show the location of the discrete samples collected.Charts showing the time each copper sample was measured or collected and thecorresponding value from each of the three methods (Cu-ISE. ASV. and AA) are given inAppendix D.
Sampling to determine differences in copper concentrations within the study area
was conducted during one tidal cycle to minimize variability from other sources. For- example, if measurements are made on different days. an event such as a storm could
produce changes in fresh water input. physical mixing, sediment load. etc. Theseprocesses introduce a source of temporal variability that is difficult to resolve from thespatial variability of interest in this study.
Data from underway measurements on January 19 (Figures A-4. A-9. A-12. A-17.and A-22) show that waters in Kings Bay and Cumberland Sound are, in general, quitewell mixed. Relatively small changes in water quality parameters were observed over thesurvey area. Nominal ranges in values were as follows: temperature - 11.0 to 11.5°C.salinity - 30.5 to 31.5"/oo: dissolved oxygen - 8.0 to 8.5 mg L; percent lighttransmission - 65 to 85 percent; and pH - 7.9 to 8.2. The Cu-ISE electrode responseshowed the greatest range in values, varying between -40 and -200 mV.
10
XI-

.4.
- I-* .E
-4C
cczSal-
C15 221, Me
'1 Em
ao
~0
%~ 5~'cC
I'
-4 ~ ,..S *-~t'a'ED

o) 0
E C
0. 0
'D~
c m
cm "
r-c .Cecu . C
0 0~
Co E
112
4-)

46.
S C
0U .
0 0 0.
E
Ein
. E
00LL .C
13~

00U)C
(UAC
-0)
0
10
'S * S
1-0
W CL
0)00U0 EV -
E N.* *4** b.. C(
<%CC C? J
.2 u0
L~.Vcc
LL
14

The greatest change in copper electrode response was observed in the Lower Basinin the shallow waters (shoal waters) along the coast of Crab Island. Figure A-12 showsthat when the survey craft approached the shore of Crab Island. as indicated bydecreasing bottom depth. decreases were observed in light transmission and Cu2"' activitymeasured with the Cu-ISE. Details of these events are more easily seen in Figures 6 and7. which show two segments of the time-series data replotted using expanded scales.The data show decreases in Cu2- activity (more negative potential) associated withdecreases in bottom depth and light transmission and increases in temperature every timethe survey craft approached the shore of Crab Island. The effect of temperature on theCu-ISE in natural seawater has been determined to be -1.5 mV/oC (Rice & Jasinski.1976). During mapping intervals, observed temperature changes were less than PC andobserved changes in Cu-ISE were frequently greater than 100 mV. Therefore, temperatureeffects on the Cu-ISE were negligible. Note that decreases in Cu2 activity were notobserved in shallow waters in Cumberland Sound (e.g.. Figure A-12. 1454 to 1524) or inshallow waters in the Upper Basin (e.g.. Figure A-9. 1228 to 1300).
Results of copper measurements for the Upper Basin. Lower Basin. and Sound underebb and flood tidal conditions are presented in Table 3. Discrete samples for shipboard
, ASV analysis and laboratory graphite furnace-AA analysis were collected from the pumped, seawater system using procedures described in the methods section. Sampling was
coordinated to provide complementary samples for both methods. Cu2- activity measuredusing the Cu-ISE was obtained by extracting values from the continuous record thatcorrespond to the times discrete samples were collected for ASV and AA analysis. AAvalues ranged from 1.2 to 5.8 #g/L and ASV values ranged from 0.3 to 2.2 jig/L.These values are much lower than those recently reported for Kings Bay and CumberlandSound (NAVFACENGCOM. 1984). Cu2- electrode response ranged from a low of -120mV to a high of -40 mV.
Mean values measured by AA. ASV. and the Cu-ISE are compared as a function oflocation (area) and tidal state using bar graphs in Figures 8a. 8b. and 8c. Compared tothe Upper Basin and the Sound. AA values indicate higher copper concentrations in theLower Basin of Kings Bay under both ebb and flood tides. Both ASV and Cu2-electrode measurements suggest slightly higher values in all areas during the flood tidalstage.
A two-way nested ANOVA was performed to determine whether a significantdifference exists in the mean copper concentration between/within different locations andtidal stages. The sample groupings compared by the model are listed in Table 4. Thethree locations are as defined earlier in Figure 2 (Upper Turning Basin. Lower TurningBasin. and Cumberland Sound). The ANOVA results are shown in Tables 5a and 5b.Separate analyses were run on ASV and AA measurements. No significant differenceswere found between any groupings for ASV-determined concentrations (p>O.05).However. for the AA-analyzed samples, a highly significant difference was found forsample location (p<0.0001). The major source of variability was attributed to samplelocation. Levels measured in the Lower Turning Basin were higher than those determinedin the Upper Turning Basin or Cumberland Sound.
15
,...-.. .. -....-...-.. .. ..... .. , .... .. . . , .. ..

-ut ge P I
*1r)
1.3.
0)LL) 0a
c w .@
E- D LA
CL E~
CCD
-A-
*n - -18i m -m O
* .? - U)
S E
"i C
Lu C
Aj ~4)
r, C,
0)CM.(D -E
Ell 0*11 9131 09- 001- oiI.09 SL 06 1 9 s
ps" lb" MM aj z6 fmL
16

C
0
CL
4r
CRC
-~--4
si 00 s1 9PAR

- -• - ---
Table 3. Discrete copper ASV. AA values, and Cu electrode responses forKings Bay and Cumberland Sound (19 January 1985).
Area/Tide Time Cu2- ASV AA(mV) (#g/L) (#g/L)
Upper/Ebb 1183 -56 1.26 3.21150 -60.5 0.81 3.51204 -229" 0.76 5.21218 nd 0.51 1.81231 -113 1.15 1.81244 -102 0.92 1.8
Mean = -89.9 0.90 2.9*SD = -28.5 0.27 1.4
Lower/Ebb 1330 -83 0.58 4.01350 -83 0.65 5.41355 -96 0.97 5.31407 -86 0.39 2.91421 -86 1.33 4.51434 -121 0.31 3.9
Mean = -104 0.71 4.3*SD = -33.9 0.38 0.94
Sound/Ebb 1504 -85 0.45 3.51515 -80 0.48 3.71528 -70 1.16 4.1
1540 -70 0.72 1.9[ 1554 -43 0.46 1.2
Mean = -69.6 0.65 2.9*SD = -16.2 0.30 1.3
* Contamination suspected; value not included in statistics.
,-- .1
_i 18rS

Table 3. Discrete copper ASV, AA values, and Cu electrode responses forKings Bay and Cumberland Sound (19 January 1985). (continued)
Area/Tide Time Cu 2- ASV AA(mV) (#sg/L) (#sg/L)
Upper/Flood 1631 -53 0.57 3.31644 -44 1.11 3.61657 -51 0.69 5.21711 -51 1.05 1.91720 -53 0.75 2.61724 -54 0.75
Mean = -51.0 0.82 3.3*SD = -3.6 0.21 1.2
Lower/Flood 1731 -52 12.3 3.71733 -53 1.3 5.31734 -52 0.77 5.21736 -53 0.32 5.11737 -53 1.37 5.81740 -53 0.93 5.8
Mean = -53 0.94 5.1-SD = -0. 043 0.77
Sound/Flood 1750 -56 0.60 3.91751 -56 0.62 3.21752 -56 3.11753 -56 1.81754 -56 1.86 2.4
01756 -57 1.09 1.61757 -57 2.19 2.41759 -58 1.23 1.6
Mean = -56.5 1.27 2.5*SD = -0.8 0.65 0.88
*Contamination suspected, value not included in statistics.
4' 19

~' '. 01(a)S n=6 n5 n=5
E l nE 5tU FP a
PI~I
Lo- n =,6
C ).I .(b )
01.6-(bP P1.4- n,=5
E n=. -, PI.=-:
Pp.4
Pb .
VE LE SE IF LF IF
1 "W
"'i- (c)
C210 n=.4. u I
Stan Ord E Ut e I IF SF: ", ¢ AREA/TO E
UE = Upper Turning Basin/ebb tide UF = Upper Turning Basin/flood tideLE = Lower Turning Basin/ebb tide LF = Lower Turning Basin/flood tide
.4 SE = Cumberland Sound/ebb tide SF = Cumberland Sound/flood tideStandard deviations about each mean are indicated on the figure.
. Figure 8. Bar graphs showing mean copper concentrations measured by
(a) Graphite Furnace AA, (b) Automated ASV, and (c) CU-ISE as afunction of location (area) and tidal stage.
*- 20
6% .. . . . . . . .. . .. .

Table 4. Sample categories used in the ANOVA.
Category Description
Tidal State Comparison of pooled samples taken at ebbversus flood tide.
Location Comparison of pooled ebb and flood tidemeasurements in the three areas.
Tidal State X Location Comparison of mean concentrations at threeInteraction locations of ebb versus flood tide
measurements.
.'21
-'4
'O"
-"
Srd
4l
.1•
N 21
O4 - . - . . . -"

Table 5a: ANOVA table for ASV data.
Source ofVariation df SS MS F P
Tidal State 1 0.51297 0.51297 3.34519 NS .10 > P > .05
Location 2 0.182437 0.091219 0.56373 NS P > .10
Tide X Location 2 0.64492 0.32246 1.99278 NS P > .10Interaction
Error 28 4.53078 0.16184
Critical F.051;1.28 4.2 F1.1 0 :1. 28 =2.89
oF[. 051:2. 28 = 3.34 F1.1 0 1:2. 28 = 2.50
Table 5b. ANOVA table for AA data.
Source ofVariation df SS MS F P
Tidal State 1 0.253195 0.253195 0.21973 NS P > .10
Location 2 29.221566 14.61078 12.6795 ** P < .0001
Tide X Location 2 2.583314 1.296155 1.12092 NS P > .10Interaction
Error 30 34.569448 1.152315
CriticalF =4.17 F 1 0 11 30 =2.88
'-'','i Critical 1.051; 1.30
F 1051 2 30 = 3.32 F1.10 1:2. 30 = 2.49
22
:.L L L

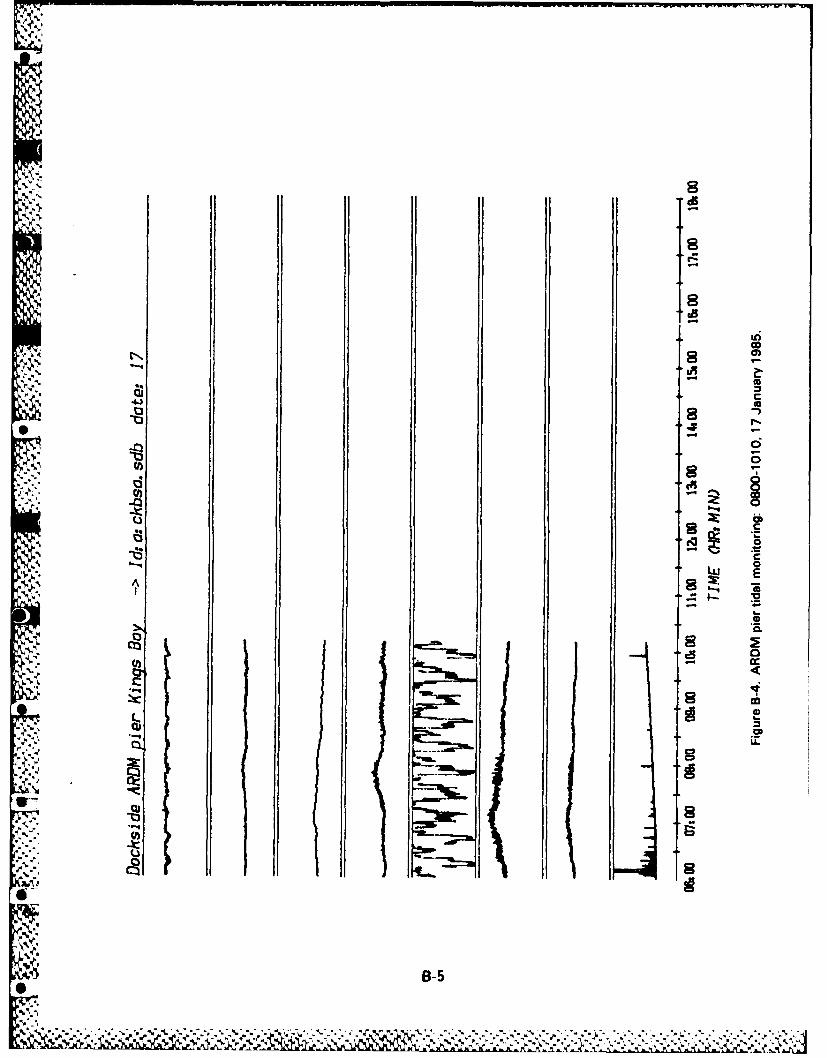
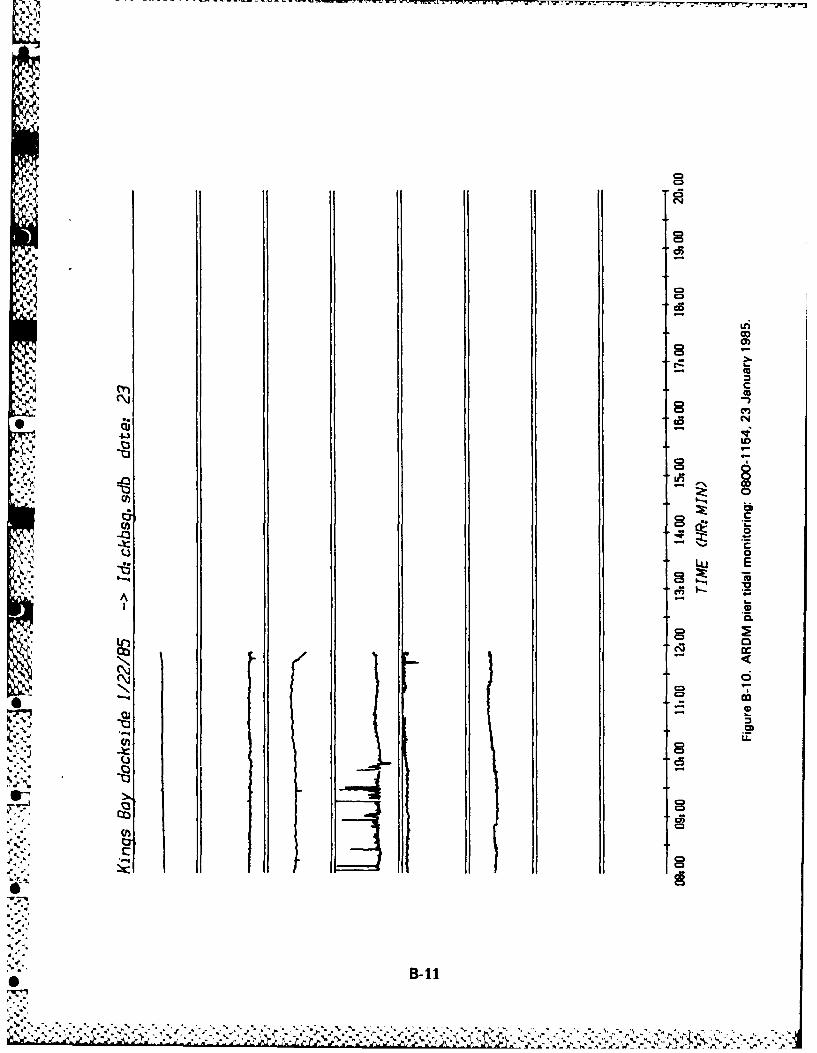
Tidal Monitoring Stations. Tidal monitoring stations were established to evaluatevariability in copper and other data as a function of time. The ARDM pier location wasselected because of its relative proximity to Cumberland Sound and the ease of samplecollection. We reasoned that if there were any significant differences between the watersof Kings Bay and Cumberland Sound. this location would provide an opportunity todocument these differences as a function of tidal state. Time-series data are presented inAppendix B. The parameters are the same as those in the underway measurements.Because position is fixed, bottom depth can be used as a measure of the tidal state.
Continuous tidal monitoring data (Figures B-1 to B-10) show the variabilityobserved at a fixed location in a dynamic estuarine environment. For example, Figure
*i B-6 shows that for a tidal range of approximately 2 meters, temperature rangedapproximately 2oC. percent of light transmission varied by 40 percent, and Cu-ISEresponse varied by more than 100 mV. A common feature observed in all the tidalstation data was a decrease in Cu-ISE electrode response (more negative potentials). adecrease in light transmission, and a decrease in temperature that usually occurred justafter low tide. Because the sensors were fixed to the survey craft, which moved up anddown with the tide, we could not be sure whether the observed changes were a function
*l of the distance the sensors were off the bottom or were due to resuspension of bottomsediments by tidal currents.
Effluent Monitoring. During the study period. dewatering of the Mainside DisposalArea was conducted. Effluent from the dewatering operation flowed through a channeland entered Lower Kings Bay at a point southeast of SIMON LAKE (Figure 2). This
* provided an opportunity to attempt to locate and characterize the effluent from thedredge spoils containment area at its point of entry into Kings Bay. Continuous datawere (Figure C-I) collected as the survey craft moved from its ARDM pier berth to alocation where the effluent was draining into Kings Bay. and data were collected whilethe craft was anchored at the mouth of the drainage channel through a tidal cycle(Figures C-2. C-3. and C-4) show the effluent could easily be distinguished from ambientKings Bay water by major differences in its properties. Figures C-1. C-2. and C-4 showthat the effluent water was warmer, more saline, showed lower relative light transmission.higher pH. higher fluorescence, and a dramatically more negative Cu-ISE response. Webelieve the sharp gradients observed in the continuous data were due to the effluentplume drifting in and out of the vicinity of the CTD and hose intake.
Mean values for discrete ASV and AA samples (Table 6) collected during theeffluent monitoring were similar to mean values determined for the Lower Basin duringthe mapping survey. When time-series data were used to separate the discrete sampleson the basis of whether the craft was sampling the effluent plume or the ambient water(Table 5). a standard t-test showed there was no significant difference between themeans of ASV (p>O.25) and AA values (0.25>p>0.10) for the two waters.
DISCUSSION4
A significant result from this study was that copper concentrations were lower thanthe 10 to 38 #g/L levels measured during the 1982-83 period (NAVFACENGCOM. 1984).During this survey, concentrations determined by graphite furnace AA did not exceed
23I
" " " " -: "-- "' " ',r , - ,'- ... " ' ' ' ' ;i : " i '" ' ' ' ;

Table 6. Discrete copper ASV and AA values in the area of theeffluent outfall.
Time ASV AA(#,g/L) (,g/ L)
1250 0.80 2.61322 0.2 2.6
• 1400 0.74 1.9
1758 0.650 2.60
1508 0.43 3.3
S1604 0.71 3.31643 0.57 4.01719 1.0 3.31734 0.50 1.21758 0.65 2.61931 1.5 3.3
2012 0.58 5.82048 1.0 5.12139 0.53 5.1
Al2205 0.97 5.82245 0.24 6.60n2324 0.52 2.4,<"0003 1.0 2.40
00.o41 0.41 2.40k"All Data- Mean = 0.73 3.7
- SD = 0.32 1.6
- In Plume Mean = 0.64 4.1-SD = 0.30 1.8
Out of Plume Mean = 0.72 3.3*SD = 0.36 1.5
-@ In Effluent Plume
,* 24.5- - . . . . .
?,.. . .. . . . . . . . . . .

6 /#g/L. Mean AA values for the Upper and Lower Turning Basins in Kings Bay rangedfrom 2.5 to 5.1 #g/L. There are several possible explanations for the lower valuesobserved in this study.
Major construction dredging activity concurrent with the 1982-83 sampling periodmay have produced short-term increases in copper levels in Kings Bay and CumberlandSound. Construction dredging could lead to higher concentrations of copper in the watercolumn through resuspension and/or oxidation with subsequent solubilization of insolublecopper complexes from the bottom sediments. Release of copper from bottom sediments
Vand resuspension of bottom sediments have been proposed (Windom et al.. 1983) toexplain dissolved copper concentrations measured at salinities between 30 and 36"/oo inother estuarine waters in Georgia.
Another possible source of copper is dissolution of carbonaceous material blastedduring construction dredging. Chemical analyses of carbonate sediment slurry mixturesshowed higher concentrations of dissolved copper than did slurries of clays and silts(Alvarez. Lehman & Associates. Inc.. 1984).
* In contrast to the 1982-83 period, no dredging activity had taken place for 1 to 2months prior to the sampling effort reported here. The lower copper values measured inthis study suggest that whatever the mechanism responsible for increased copper levels inthe water column (resuspension of bottom sediments, release from carbonaceoussediments, etc.). the effect is probably only short term.
Values of copper measured in Kings Bay and Cumberland Sound during this studyapproach concentrations determined in other estuarine systems along the southeast coastof the US. Windom et al. (1983) measured total copper concentrations (dissolved +particulate) in waters with salinities greater than 25*/oo of about 1.3 and 1.0 #g/L-1 forthe Savannah and Ogeechee estuaries, respectively. The ranges of copper concentrationsdocumented for water samples from Kings Bay are reported in NAVFACENGCOM (1984).
V. The ranges reported were 2 to 18 #g/L for the 1976-77 Environmental Impact Statement(EIS). <10 to 20 #g/L for 1980-81 environmental monitoring. 38 to 55 'Mg/L for 1981-82environmental monitoring, and 10 to 38 /g/L for 1982-83 environmental monitoring.These values suggest increases in copper associated with increased dredging occurring* from 1978 to 1983.
Great care must be taken when comparing concentrations measured by differentanalytical techniques. Various methods for measuring copper measure different fractionsof the total copper present in the seawater sample. Total copper is often divided into adissolved and a particulate fraction defined by filtration of the sample through a 0.45 am
V7 filter. The dissolved fraction can be further divided into three classes: (1) the ionic andlabile forms. (2) inorganic complexes and colloids and weak organic complexes, and (3)
.... strongly bound organic complexes and colloids (Zirino. 1981). The Cu-ISE measures onlythe ionic fraction. Analysis by ASV at pH 2 measures the ionic and labile as well assome of the copper associated with weakly bound complexes and colloids. Analysis by
• "AA spectroscopy following acid digestion measures the copper associated with classes 1.
25-,J
, ..,. " .,.., . .. r,,,",,,"-" . ,, . , .. _. ,...% , " .'' ",- . ,' ,. . •",•..'..... .-... . .,. ' .. ' . " . " ... - .-

2. and 3 as well as copper leached from the particulate component during acid digestion.Copper measured after acid digestion of the sample is designated as the "total soluble"fraction because this procedure transcends the fractionation produced by filtering. Theimportant point is there is no single correct procedure for measuring copper or any othertrace metal. Different methods measured different fractions of the total. These differentfractions may have special significance depending on the chemical, biological, or geologicalprocess of concern.
Collection of noncontaminated copper samples is a nontrival exercise and could beone possible reason why the 1982-83 copper values were higher. Only recently havecopper measurements in the marine environment produced results that give distributionsconsistent with controlling physical, chemical, and biological processes (Boyle & Edmond.1977). These results were obtained only after instituting special procedures. includingrigorous cleaning of sample containers and extremely careful sampling and analyticaltechniques. Procedures described for collecting samples for the 1982-83 samples do notmention how sample containers were cleaned (NAVFACENGCOM, 1984). In addition, thereport stated that water samples were introduced directly into bottles containing requiredamounts of acid. This obviously precluded rinsing of the sample container with thesample.
A second important observation is the results of this survey do not support theexistence of a point source of copper in Kings Bay. In fact. Cu-ISE measurementsshowed increasingly negative potentials (indicating lower Cu2 activities) in the effluentstream entering Kings Bay from the Mainside Disposal Area and in the shallow watersalong the shore of Crab Island. We believe that higher concentrations of dissolvedorganics may be responsible for the more negative Cu-ISE potentials in these waters.This hypothesis is supported by the correlation of higher levels of chlorophyllfluorescence and lower light transmission with more negative Cu-ISE potentials in theeffluent waters. Lower light transmission and more negative ISE potentials were alsoobserved in the shoal waters off Crab Island. The implication is that organiccompounds complex dissolved copper, which lowers the Cu 2- activity. Compared toambient waters in Kings Bay. measurements have shown that the effluent from theMainside Disposal Area has significantly higher concentrations of total organic carbon.ammonia, and nitrogen (Alvarez, Lehman & Associates, Inc., 1985). In the shoal watersoff Crab Island. negative Cu-ISE potentials may reflect the influence of organic ligandsassociated with the resuspension of bottom sediments in the shallow water column.Increasingly, negative Cu-ISE values associated with decreasing light transmission werealso observed following low tide at tidal monitoring stations. Resuspension of organicrich bottom sediments may be responsible for these observations as well.
Another possible explanation is the numerous streamlets that drain the marsh onCrab Island may contain relatively high concentrations of dissolved organics from themarsh itself or. possibly, organics that have percolated through the dike of the CrabIsland dredge spoils containment area. Some indirect evidence in support of the lattermechanism is the observation that orange bands (presumbably iron oxide) have beenobserved on the outside of containment area dikes (Personal communication from PeterW. Havens, ecologist. OICC Trident. Kings Bay. January 1985) This suggests there issome transport of dissolved constituents through the dikes surrounding the containmentareas.
26
t ",, ° . . "+ % +,% % "+ ", - " , ' • " - ° -,. ... . •- ° - ".,.•"- - ,' " .• -., . + - - "". " •-

Note that differences observed in Cu-ISE response between ambient waters andeffluent waters and between the Lower Basin and offshore Crab Island were not reflectedin ASV and AA values. This suggests that Cu2- activity may vary significantly due to
* .... , complexation by organics, but levels of total Cu appear to be nearly the same in thedifferent waters.
Based on analyses of samples collected during dewatering of the Mainside DisposalArea. we do not believe that the effluent represents a source of Cu to the Kings Bayand Cumberland Sound region. ASV and AA values are indistinguishable from ambientvalues. Cu-ISE potentials actually suggest that effluent waters show lower levels of thetoxic Cu2 - ion.
A nonpoint source of Cu is suggested by the observation that AA Cu values weresignificantly higher in the Lower Turning Basin than in the Upper Turning Basin or
~% Cumberland Sound during both ebb and flood tidal stages. Although values are still quitelow (the highest value measured was 5.8 /g/L). compared to the suggested EPA criterionof 23 /g/L. the situation should probably be monitored closely as Navy activity increasesat Kings Bay Submarine Base to determine whether this is a persistent feature. Elevated
* copper levels have been observed in several other bays and harbors where there are alarge number of boats painted with copper antifoulant coatings (Young et al.. 1979: Zirinoet al.. 1978).
The variability observed during tidal monitoring (see Figures B-1 to B-10) illustratesthe dynamic nature inherent in the estuarine environment of Kings Bay. The data showfluctuations occurring over the tidal cycle that could influence the comparability ofsamples collected at different phases of the tide. Couple this tidally induced variabilitywith seasonal changes and short-term weather events, and one begins to understand thedifficulty and complexity involved in comparing and interpreting monitoring data. Todistinguish between natural variability and the impact of man. knowledge must first beobtained to assess the natural variability and thereby identify the "background noise" ofthe system being studied (Buffington & Little. 1980).
The effect of natural variability on the comparability of data acquired during a long-term monitoring effort cannot be totally eliminated. However. the magnitude of the
* variability can be reduced by establishing a controlled sampling regimen. The followingguidelines should be used to minimize the natural variability factor.
I. Annual and seasonal sampling should be conducted during restricted periodicwindows For example. sample as close as possible to the third week in March each
;' year.
2. Sampling should be conducted during periods of representative weatherconditions within the seasonal interval Collection during periods of extreme weather tendto inject a large variability component.
3. Sampling should not be conducted during periods of extreme tidal flux.
4. Sample collection should be performed during comparable tidal states fromsample interval to sample interval.
27
0 '

5. Sample locations should be known and repeatable. In a small estuary. such as
Kings Bay, a small difference in sample location can cause a large variability component.NGenerally. sampling within a 10-meter radius may be desirable.
6. Establish sampling stations in well mixed. homogeneous areas. Shoals andsites of fresh water influx, such as creeks and drainage ditches, are highly variable areas.It may be best to establish midchannel stations.
7. The number of stations, areas, and samples per area or station should bepredetermined and not varied from year to year or sampling interval. Statisticalcomparisons require adequate sample populations to derive valid conclusions. Thestatistical test to be used and the sites to be sampled should be established prior tofield operations.
SUMMARY AND CONCLUSIONS
Results from this study show that copper concentrations in Kings Bay and_ Cumberland Sound are considerably lower than values reported during the 1982-83 period.
Because earlier measurements were made during periods of active dredging. this suggests(assuming previous measurements were based on noncontaminated samples) that increasesin Cu concentrations due to dredging activity are probably only short term.
Several important questions posed at the beginning of this study can now beanswered.
1. No evidence was found to support the existence of a point source of Cu in.- Kings Bay or Cumberland Sound. Obviously. the importance of this question was
diminished to a large extent by the finding that copper levels are within the range ofvalues measured from 1976 to 1977 (NAVFACENGCOM. 1984). before dredging activitywas initiated.
2. Dewatering of dredge spoil containment areas does not appear to be a sourceof copper Levels of copper measured by ASV and AA were not significantly different
* from values measured in ambient waters. Cu-ISE measurements suggest less availablefree (ionic) Cu ' in effluent water than in ambient water.
3. Concentrations of copper measured in the Lower Turning Basin of Kings Baywere slightly higher than levels in the Upper Basin or in Cumberland Sound. suggestingpossible input from copper antifouling coatings.
S28Io.~

REFERENCES
Alvarez. Lehman and Associates. Inc. (1984). Final report for carbonate resettlementtesting of dredge material from the connecting channel and upper turning basinNaval Submarine Base. Kings Bay. Georgia. Contract No. N68248-83-M-0317.
Alvarez, Lehman and Associates, Inc. (1985). Final report on daily environmental
monitoring of Kings Bay water quality in comparison with return flow water qualityfrom mainside disposal area. NSB. King Bay. Georgia. March through September1984. Contract No. N68248-83-C-0318.
American Public Health Association (1980). Standard methods for the examination ofwater and wastewater (15th ed.). American Public Health Association. Inc.. NewYork.
Boyle. E. and J.M. Edmond (1977). Copper in surface waters south of New Zealand.Nature, 253. 107-109.
0 Bruland. K.W.. R.P. Franks. G.A. Knauer, and J.H. Martin (1979). Sampling andanalytical methods for the determination of copper. cadmium, zinc, and nickel at thenanogram per liter level in seawater. Anal. Chim. Acta., 105. 233-245.
Buffington. J.D. and L.W. Little (1980). Research needs and priorities, in BiologicalMonitoring for Environmental Effects, edited by D.L. Wolf. Lexington Books. D.C.Heath and Company.
Environmental Protection Agency (1980). Ambient Water Quality Criteria Documents.United States Environmental Protection Agency. Office of Water Regulations andStandards. Criteria and Standards Division. Washington. D.C.
Environmental Protection Agency (1983). Methods for Chemical Analysis of Water andWastes. United States Environmental Protection Agency. Environmental Monitoringand Support Laboratory. Cincinnati. OH.
Johnston. R.K. (1983). Program DRAW8 users manual: A program for entering anddisplaying navigational data for the marine environmental data base system. (NOSCTech. Doc. 559) San Diego: Naval Ocean Systems Center.
Naval Facilities Engineering Command (1984). Environmental Monitoring 1982-1983.prepared by Jones, Edmunds & Associates. INC. for OICC Trident Naval Submarine
V11 Base. Kings Bay, Georgia. Contract No. N68248-80-C-0113.
Rice G. K. and Jasinski. R. (1976). In: Accuracy in Trace Analysis: sampling, sampleS handling and analysis. Proceedingsof the 7th IMR Symposium. Oct. 7-11. 1974.
P. LaFleur. editor Gaithersburg. MD, NBS Sec. Pulb. 422. Aug. 1976. pp. 899-* -915.
Sunda. W.G. and R R L Guillard (1976). The relationships between cupric ion activity andthe toxicity to phytoplankton. J. Mar. _Res. 34. 511-529.
29$

Williams. P.M. and R.J. Baldwin (1976). Cupric ion activity in coastal seawater. Mar.Sci. Comm.. 2. 161-181.
Windom. H.. G. Wallace. R. Smith, N. Dudek. M. Maeda. R. Dulmage, and F. Storti(1983). Behavior of copper in southeastern United States estuaries. Mar. Chem., 12.183-193.
Young. D.R., G.V. Alexander. and D. McDermott (1979). Vessel-related contamination ofSouthern California harbors by copper and other metals. Mar. Pollution Bull. 10,50-56.
Zirino. A. (1981). Voltammetry of natural sea water. in Marine Electro-chemistry, editedby M. Whitfield and D. Jagner. John Wiley and Sons Ltd.
Zirino. A.. C. Clavell. and P.F. Seligman (1980). Cu in the surface waters of the" Peruvian upwelling zone. Program of the IDOE Int. Symp. on Coastal Upwelling.
Los Angeles, CA. (abstract only).
Zirino. A. and J.D. Hightower (1984). Real-time environmental survey techniques. OceanScience and Engineering. 9. 239-252.
* Zirino. A. and S.H. Lieberman (1975). Automated anodic stripping voltammetry for themeasurement of copper. zinc. cadmium, and lead in seawater. in Analytical Methodsin Oceanography- (T.R.P Gibb. ed.) Adv. in Chem. Ser., No. 147. AmericanChemical Society.
Zirino. A.. S.H Lieberman and C. Clavelt (1978). Measurement of Cu and Zn in SanDiego Bay by automated anodic stripping voltammetry. Environ. Sci. Technol., 12.73-79
Zirino. A. and P F Seligman (1981). A note on the polarographic behavior of the Cu(ll)ion selective electrode in seawater. Mar. Chem., 10. 249-255.
30

APPENDIX A
UNDERWAY MAPPING DATA
-.11
1'.'-

N
C
''a
C-
4- m C IJ am-eo O
-. 6
L;!'
- -
0 C-
- -°
e;Zl I] ;'1 3 O! ?! 1 0OE 0 O!nc c O~ 2t E O II l O
eE
A -:A-
," - .. ,,..- .-, . . , . ., ,-.\, ., • ,-. .- ..._- - .. . -".. ...,. -. .....-.. -.- .-._-. ....-.... .. , . _ ,-. .,,.. . ... , - .',2. , 0.
* C.--.. . , ,.. " . " - " , , -, "-" . , , . . . . "-"-. . . -,_, - - . . -'-, - . .,, ". "

p-i3
.4L
(0
0 _0
16 c6
130
cU
0) w LU
LL
U) )
A-3
. . . -~ . & . ~ .

u
C4-u
00U)o
t4 W
CL
C-i
00cn Vc Cu
cn,
A-4)

1~41
0)0
4-I4
1 0))
CLC
v -u
C -
0 m lU Q aliil t t 0
AA-5

NN
St
,
L
C15U
A-.6
m" 4
r A-6

C4
<A-7
NO %l,

eLe
, V
CYN
!,UIc
CL
N! *
V.'V
-4.
-,.,.-

[Aci
00
c
CLE
CC.'
A-9

C=u
-UA
-9cc
-p -Leip OD
0Im0 4j -
.. c
-~ -4 o
-004
(3 U)
LU.
A E
LI:
N ILL
C')
o 1-in2- 3131 1 01 1 t 21 11 01
* A-10
W, r .-
*~4*~.S '-4. -- '.,, .. '-.. '* -**. -* * - -%- -

9o
.Lei
0)
04
C14
'NN

~C1
I')
E)
m
LL
A01

CJ
-Jca
0Y)
i L CD
'U
Lra)
LL
9c I
C3,
.+. .
ir(N) "M CAI p d =4 ji,, (1Afm)ap pOqgulmp-* ii 0yd
-
'I-' q7L
16,
A-14

% %
CIP
ivi
O
.4
CV)
A-15
I'001,
F:,-:- - - - - '
Lc)
U)
A-16
rz 4
C.

'Up
-qf
VSo
"q)L
'~1 E
cc(n
0)
U)
A-17

ELr
00
--
.04UO
C3-)
rri

CIP
(D
4
A-19-

-- - -- - -
(0
C4
U
LL
AC-))
Cvi
A02

CPC
LiOD
C
V-
'4)
U)c
E0
A-2Ll&

00
-I C4.1
0
)0* CLNE
C~C
A-.2

CS
csJ
4.3.
'50
* L6
cuu
C
A-23)

Lt)
.)LL
e.40
A-24

co
-6
An
C
IL)
C-5D
A-25
.1. 0,
14-
I A-25
. ' e~*~***

C
.2
0
i0(D
0)
- C
L0
A-26

.4,
,~:11I
10
(0
06
CD
A-27

U-
CI
L6~
i -4"
C
II 'n
I!-,)
-. 4 I Ii ._'
C-F
V)2
i, .". --
t 0at -m SL m I f at a at
' " A-28

iqi
'--
(-
4
C-)
CISo
C J
or
iA-29
-- .N

CD4
dLO
0r)
LA.
%9
A-30

%In
co
Cu4
*p 0
or.. ,,Y(0
A3
° .0
E
!C:fi(n,.:i0:
q.:.
1.,
B-" A-31

C14
CN
~D..2
U)
CD
C?
CD
LM
* A-32

APPENDIX B
TIDAL MONITORING DATA
* B-1

IIa
H I' I3
OU CD )
C2 00
II C3
a C3
00
4I ...C;;.4 ., I o
IN 0R- 0m~-' I -~j---3I' I CuIi Ij -
r~0)
I, H I 3
ii H IIIL lS E E SIA CWIPall hd =4 aj (r apnO nuu ri4) bm o O
1 ~B-2

-. 40I
Ql C94j :2
I 8 -AD
-cm Ii-~ iM
ii 8 9Icc
CL LL
r- I
C3C
A I Lu
£B-

-mm
Li
-IL-
-oo
-u 0Z -
Lu4.o AW0
.9.. rz
l(U
* c
J %
8N
SI.-
S'5
N ~:2w% '-4
UCS
S -,-US -
-o 6.9- -~
-~ 0'IJ 8 -d B
-~
ch 0(3 8 C6 ~ *~
C-
'-4 IL] 0-~ A E
-~ S
0
8c5 0
CD) -
S*I-
a'LL
-~-
a' 8
CI~
(3 I S
'4.
B-56
- . ...

C2u
C)C
C3u
C),
00
cu 0
.4.3 '*n*
aC X
0%.0
0~ C
-~ Cu
oL
0L
C5.
A~
C30
B-6-

8
IL)
80 0
CL
8o
-~B-7

'4.3
LM
'B6
4--
~~cI - C0
-. q. E
CL
-qB-8

* 0*
43 (CDC C
-il C;;
-c 0i
C2C
Lu 0
E
Lr~CL
I U
U.
'AA
QI -9
0)% %

00*' .a)
$ 0Z)
m 00
0
C3 0
Ljj 0cm Z E
A 0 3
(NjDN 0L
-~ 0 LL
-t C3
c Q0
0 21- ME- 5 * sz1 3 at I t 2 11 a1lN
OE m 01 5 SL 001 2E E ME s g L
6M) *A7[D ( D? W Nd w7 tv r (A/& ar A7 l~iirm P ifik o 4
B-1
-~~~~~M -- v~ u-. -- w -- -r. I.- -
cJ
0)
C2C
06
LL
csw
CB* A=
I S
C,)2
-~ cz
V..'
P i
APPENDIX C
EFFLUENT MONITORING DATA
S'p"
1,4
c-1

N: -
I Uc)
I0
%%, C
( C2
0 002 mpI 5 I-)2 l l 0&L S'E 00 m 0 E1 O l S
(AM +#M 4)lj DIV W4U)z(/ c rfo il 6 0
C-2.q

COD
CDCI if co'-4 1V1
CD -f)
I IAIIJ 0r
c
+3 CO
iiitU I9
C-3

/ 4
LrU)
In 0
CSC
L6* **tOD
4.r-mcaT
U)
N(3
I.- C
Ln 0
co E
Q L
-4.3,
U') LLU'
ve,0 21- 05- SB 1 So 01a L t I 0di CE 01 m L MI1 2E If DE a at1 0
C-4

- ~ .2~ -%j
00
0)0'I I M
0c
ics
00
iSS
cm 0CCu
-~ ~I
I I C%1% CV
0cmE
EL SI IE 0a m wt2 E DEa SLcm ##I (I.-, DR #4 u 14a d jlmp k W
C-5~' .
YAE
-]
APPENDIX D
COPPER DATA: CHARTS SHOWING SAMPLE LOCATIONS AND VALUES FOR SAMPLESCOLLECTED/MEASURED 19 JANUARY 1985.
AA and ASV values are in mV: Cu-ISE values are in relative mV.
D-
..
.
44
S' sZ,9% ;:,. :. ~ ;:: ,-:: :%:: ;::,t %:i ;: :: ': :;:,-::<: ::'? ,: -<: t;: :,:,:;::::t:.

IP=0
cZ
% %)
D-
, .0
) -'--A..
t.T 2-
t O-2
" ',. " [ " ,' ." ,' ." ,', , -, L, ',.' "- ," ', , .'', ',T'.-, . " ' " .': ',." '.' " """ " ,': '' "" ,'. . ".-". -". " ". ".." ",'"..

QI
C0.0
U
LM
LL
D-

72
06
D
.
w
0
*d._0
0.
0.
orU
(U
!: D-4
liV
; 2 ' -. j ' \ '- " ', ----.- ''-. -,,,'"'..' '- ''.'- , -. ''. '-''-'- .""" .'.-'.-"'-, '.,,w

IN 0
-1i
0
.M.0
-.
UD-5

-' ,,,- .j, -- , .' arT .~j.~flflWS*~ -r -~i-.v' a,, .ur n' Mr an ur t W~ 0'S3~ ~ -
a.
Y N?
-~j. .0.0a)C
.0
CCI-
a)0
Cu
0)0.0.00
-a,
C' 0~
sv
(5(
N
4
D-6
4~*~ :-'"~.*
* ~ *j ~ ~

4 0
LL
cp0
- D-7

'42
4.S
~C
4-E
ItsCN
00
D-8

II
-- 'IL
CLM2
.0
.0
D-9,

0
0A000
D-10
,Pw

4---.
~
N.,.
.0
c0
'4' *
ClC
D-11

-R1.64 161 SURVEY OF COPPER IN KINGS BAY AND CUMBERLAND SOUMD(U) 2/2
NAVAL OCEAN SYSTEMS CENTER SAN DIEGO CAUMCLSSITEDS H LIEBERMAN ET AL OCT 85 NOSC/TR-i@62 / 122 WUNLSII0F G 3 2
I.E

*11
Ig 11112.0
11111.2511
MICROCOPY RESOLUTION TEST CHART
~~~ ~ ~ . . .

%. .o
.4 4
CpC
c,0
()
U)
D.1
,€ "€,C@O"
0
e-
"-'26
.. , ,
• -'2* D-1
,' < : ; '. - , , . ".' , ." ; 1, " " . . " . . ' . . ."."C ' - ". " " " ". . . . " - " " - ' . " ' -- ". . ''.

.--. --CU - - - -- IP. '- ~
C~CN0
A-.-,* pL
0.
or.
D-13

CL
*6
.0N C)
7L.4% 4-
lb 95 4
-CD 14

rAA.
D-1

CL
CL
0
0.
LL
6NU
IZI,
D-16

.46
CL*0'U
LL
C~C
D-1

e-
CL.L
D-18
, ,,,.' ,'.','. . , 6" .. . / .€, '."• " "- .' '. .'.'".'' '2 'z, ",' -",-',,.,.....".," .. ';- '.": ",',', -";'.''!.'.'.\ ','.",:.,'- "" ",' ."- 0 -

CL* fN~0U
.0
D-1-

ma-P
ca
CL
0
LM
U,
6A.
D-20

WAY
CL
Lu
D-21)

(~%O
0
-LA
S.A
00
D-22

* 0
-'4-V
C
0L
D-23

-C
.1*L
N0
*4 *L4
.4. "6
t4LL
4". * a
D-2
1_,o
S?
CL
0Cu
LL
or
D 0
%C.,5 ' D-0
iC)
- K.>. " . . . " . . " Li.. " .- . - - .- ," . , ,, , - . . -. - - . .- . .- - .. . . . . .

p, ..-
>1
-. ' ,
'I.
,I- '.
":, 3-
.,
-,.2