of engineering (fe) examination as an...
TRANSCRIPT

USING THE FUNDAMENTALS
OF ENGINEERING (FE) EXAMINATION
AS AN OUTCOMES
ASSESSMENT TOOL
MARCH 2014
NATIONAL COUNCIL OF EXAMINERS FOR ENGINEERING AND SURVEYING NCEES.ORG


Steven F. Barrett, Ph.D., P.E.
John W. Steadman, Ph.D., P.E., F.ASEE
David L. Whitman, Ph.D., P.E., F.ASEE
USING THE FUNDAMENTALS OF ENGINEERING (FE) EXAMINATION
AS AN OUTCOMES
ASSESSMENT TOOL
ABOUT NCEES
The National Council of Examiners for Engineering and Surveying is a nonprofit organization made up of engineering and surveying licensing boards from all U.S. states, the District of Columbia, Guam, Puerto Rico, and the U.S. Virgin Islands. Since its founding in 1920, NCEES has been committed to advancing licensure for engineers and surveyors in order to protect the health, safety, and welfare of the American public.
NCEES helps its member licensing boards carry out their duties to regulate the professions of engineering and surveying. It develops best-practice models for state licensure laws and regulations and promotes uniformity among the states. It develops and administers the exams used for engineering and surveying licensure throughout the country. It also provides services to help licensed engineers and surveyors practice their professions in other U.S. states and territories. For more information, visit http://ncees.org.
© 2014 National Council of Examiners for Engineering and Surveying

INTRODUCTION
Institutions of higher education are increasingly being encouraged to evaluate their academic programs with reference to a national norm or standard. This pressure may come from state legislators who want to assign cost-benefit labels and measure the effectiveness of higher education, or it may result from accreditation requirements, which are progressively becoming driven by accountability and benchmarking. Whatever the reason, institutions must find practical, objective ways to assess their programs.
ASSESSMENT PROCESS
In engineering education, the ABET Engineering Criteria have, for over a decade, required a system of evaluation that includes program educational objectives, student outcomes, an assessment process to collect data on student outcomes, and an evaluation process that shows how this data is used to improve the program. The evaluation process may, and usually does, contain both direct and indirect measures. Direct measures allow the examination or observation of student knowledge against a measurable norm. Indirect measures attempt to ascertain the value of the learning experience through methods that do not involve actual student performance related to a specific outcome. A disadvantage of indirect measures is that assumptions must be made regarding the results of activities such as exit interviews, focus groups, and questionnaires. Accordingly, direct measures of student outcomes provide important advantages in program assessment.
One effective tool for direct assessment of certain aspects of engineering education is the NCEES Fundamentals of Engineering (FE) examination. This exam, developed to measure minimum technical competence, is the first step in the professional licensing of engineers. It is a pass-fail exam taken by approximately 55,000 people each year, most of whom are college seniors or recent graduates. For licensing, the examinee is interested only in whether he or she passed or failed. For assessment purposes, however, the pass-fail rate is of secondary importance, and the focus is instead on examinees’ performance in a given subject.
Effective assessment of academic programs requires a set of tools and processes to evaluate various aspects of education. If the tools are to have any value as benchmarks or have credibility on some objective basis, they should make it possible to compare the results over time. This is essential to the continuous improvement process, since determining the effect of curriculum or instructional changes on outcomes is critical. Assessment tools with this comparative value are particularly difficult to obtain. Methods such as evaluation of portfolios and student exit surveys lack uniformity.
1

FE EXAMINATION
As the only nationally normed exam that addresses specific engineering topics, the FE exam is an extremely attractive tool for outcomes assessment. In fact, since 1996, the FE exam has been formatted for the express purpose of facilitating the assessment process. For example, the FE Chemical, Civil, Electrical and Computer, Environmental, Industrial, and Mechanical exams include topics from both lower- and upper-level courses that appear in most institutions’ curricula. The FE Other Disciplines exam is also available for engineering majors that are outside the discipline-specific exams mentioned above. The topics included in the discipline-specific exams are determined via surveys that are sent to every ABET-accredited engineering program in the United States. Specifications are appropriately adjusted every 6–8 years. The most recent set of exam specifications was introduced in January 2014—at the same time that the exam moved from a pencil-and-paper format to computer-based testing (CBT).
For most topics, it is possible to compare results over different exam specifications. For example, within the FE Electrical and Computer exam, topics such as Mathematics, Probability and Statistics, Circuit Analysis, and Power are included in both the January 2014 specifications and the previous specifications. Thus, longitudinal comparisons (as discussed later) can continue over the change in specifications. Performance tracking for new topics in the January 2014 specifications (such as Software Development in the FE Electrical and Computer exam), however, will need to be initiated.
FE exam results can be used as one measurement in the assessment of the following student outcomes included in ABET General Criterion 3: (a) an ability to apply knowledge of mathematics, science, and engineering; (b) an ability to design and conduct experiments, as well as to analyze and interpret data; (c) an ability to design a system, component, or process to meet desired needs within realistic constraints such as economic, environmental, social, political, ethical, health and safety, manufacturability, and sustainability; (e) an ability to identify, formulate, and solve engineering problems; (f) an understanding of professional and ethical responsibility; and (k) an ability to use the techniques, skills, and modern engineering tools necessary for engineering practice.
Although the FE exam does provide one method of assessment, employing the exam as an assessment tool has both advantages and disadvantages; therefore, its widespread use in outcomes assessment should be analyzed carefully. The exam should not, for example, be used to determine the curricular content of any program. Its purpose is to test competency for licensure; it is not intended to force programs to be similar. For licensure purposes, the total score is evaluated rather than the score in any specific subset of questions. Passing the exam does not denote competence in all subjects but instead shows an average minimum competency across the exam as a whole.
One potential error in using the FE exam results as an assessment tool is focusing on the percentage of students who pass the exam. This criterion is too broad to be effective in improving instruction in specific topics; more specific measures are needed. Too often, the passing rates of individual programs are compared with those of other institutions, and these rates become more important than the subject matter evaluations. In such a situation, the focus becomes “teaching to the exam” and not truly assessing how well students have learned the subject matter in the curriculum.
2

USING THE FE EXAM AS AN ASSESSMENT TOOL
To properly use the FE exam as an assessment tool, the department or program faculty should first determine what topics they already emphasize in their program. This is a major part of the program educational objectives and student outcomes set by each program as required by ABET. After establishing the topics to be emphasized, faculty should set specific goals for student performance and then use the relevant portions of the FE exam to assess the students’ knowledge in specific areas, such as water resources, electric circuits, or machine design. The faculty should then compare their goals to the knowledge demonstrated by graduates of the program. For this assessment process to be valid, the population taking the exam must represent the entire population of graduates from the program. Many institutions that currently use the FE exam as one of their assessment tools require that all seniors take the exam and give a good-faith effort (but not necessarily pass).
Analysis of FE examinees over a number of test administrations has revealed that very few students fail to take the exam seriously. However, getting students to review materials before the exam, to prepare adequately, and ultimately to do their best work is a legitimate concern. Often, students do not lack motivation but instead struggle to make time for review in a crowded senior year (e.g., advanced coursework, capstone design, outside work commitments). Faculty who have doubts about whether students are putting forth their best efforts should take steps to motivate them, such as informing them of the importance of the results to their future or providing an incentive to pass the exam. Some programs that require all students to take the exam but do not require a passing score for graduation (the process recommended by the authors) offer an incentive to do well, such as offering to reimburse a portion of the cost of the exam to students who pass and also providing review sessions on topics pertinent to the exam.
Clearly, if the results are to be useful for outcomes assessment, the students must perform in a way that accurately reflects their understanding. It should be noted that when developing the Subject Matter Report (to be discussed later), NCEES works with psychometricians to remove random guessers so that assessment is not influenced by examinees who simply guess rather than attempting to correctly answer the exam questions.
Additionally, students should carefully consider when to take the FE exam during their senior year. For example, if they take it too soon, they may miss out on the benefit of course material covered during their final semester. With the new computer-based format, students can now schedule their appointment to take the FE exam up to one year before the test date. This makes it possible for them to book an exam appointment that accommodates completing particular coursework before taking the exam.
3
FE EXAM TOPIC COVERAGE
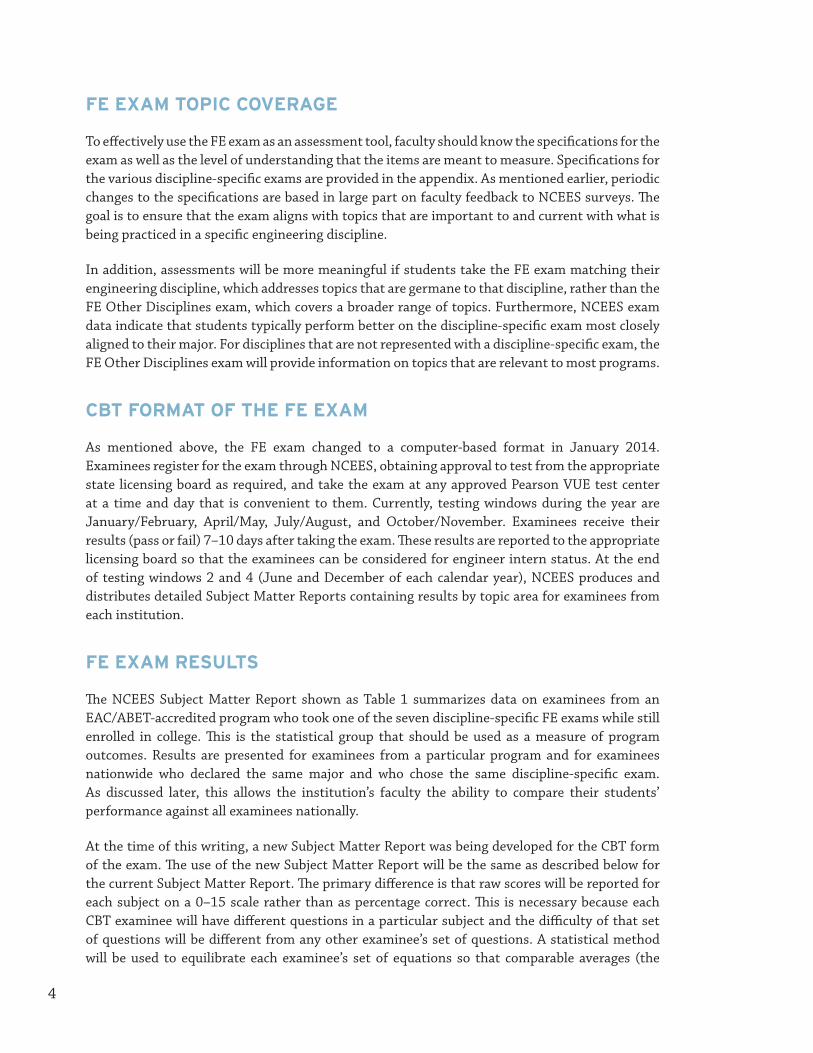
To effectively use the FE exam as an assessment tool, faculty should know the specifications for the exam as well as the level of understanding that the items are meant to measure. Specifications for the various discipline-specific exams are provided in the appendix. As mentioned earlier, periodic changes to the specifications are based in large part on faculty feedback to NCEES surveys. The goal is to ensure that the exam aligns with topics that are important to and current with what is being practiced in a specific engineering discipline.
In addition, assessments will be more meaningful if students take the FE exam matching their engineering discipline, which addresses topics that are germane to that discipline, rather than the FE Other Disciplines exam, which covers a broader range of topics. Furthermore, NCEES exam data indicate that students typically perform better on the discipline-specific exam most closely aligned to their major. For disciplines that are not represented with a discipline-specific exam, the FE Other Disciplines exam will provide information on topics that are relevant to most programs.
CBT FORMAT OF THE FE EXAM
As mentioned above, the FE exam changed to a computer-based format in January 2014. Examinees register for the exam through NCEES, obtaining approval to test from the appropriate state licensing board as required, and take the exam at any approved Pearson VUE test center at a time and day that is convenient to them. Currently, testing windows during the year are January/February, April/May, July/August, and October/November. Examinees receive their results (pass or fail) 7–10 days after taking the exam. These results are reported to the appropriate licensing board so that the examinees can be considered for engineer intern status. At the end of testing windows 2 and 4 (June and December of each calendar year), NCEES produces and distributes detailed Subject Matter Reports containing results by topic area for examinees from each institution.
FE EXAM RESULTS
The NCEES Subject Matter Report shown as Table 1 summarizes data on examinees from an EAC/ABET-accredited program who took one of the seven discipline-specific FE exams while still enrolled in college. This is the statistical group that should be used as a measure of program outcomes. Results are presented for examinees from a particular program and for examinees nationwide who declared the same major and who chose the same discipline-specific exam. As discussed later, this allows the institution’s faculty the ability to compare their students’ performance against all examinees nationally.
At the time of this writing, a new Subject Matter Report was being developed for the CBT form of the exam. The use of the new Subject Matter Report will be the same as described below for the current Subject Matter Report. The primary difference is that raw scores will be reported for each subject on a 0–15 scale rather than as percentage correct. This is necessary because each CBT examinee will have different questions in a particular subject and the difficulty of that set of questions will be different from any other examinee’s set of questions. A statistical method will be used to equilibrate each examinee’s set of equations so that comparable averages (the
4

institution’s and the national) may be obtained. National standard deviations will also be computed on this 0–15 scale. This publication will be updated when the new Subject Matter Report for CBT FE exams is available.
Examinees Taking 13 2,797 1,042
Examinees Passing 12 2,070 812
Examinees Passing % 92 74 78
#Exam Institution National National Prof+A&S/HGC Questions AVG% AVG% Standard AVG% AM Subject Correct Correct Deviation** Correct***
Mathematics 19 71 65 3.0 65
Engineering Probability and Statistics 8 60 53 1.6 54
Chemistry 11 69 59 2.2 60
Computers 8 76 72 1.5 73
Ethics and Business Practices 8 85 78 1.3 79
Engineering Economics 10 80 69 2.3 71
Engineering Mechanics (Statics) 8 72 59 2.0 60
Engineering Mechanics (Dynamics) 5 74 53 1.3 53
Strength of Materials 8 69 55 1.6 55
Material Properties 8 47 43 1.6 44
Fluid Mechanics 8 64 56 1.7 57
Electricity and Magnetism 11 39 43 2.4 43
Thermodynamics 8 60 46 1.7 47
PM Subject
Surveying 7 78 57 1.5 58
Hydraulics and Hydrologic Systems 7 78 63 1.5 64
Soil Mechanics and Foundations 9 65 62 1.8 62
Environmental Engineering 7 79 66 1.3 68
Transportation 7 81 72 1.3 73
Structural Analysis 6 55 44 1.1 45
Structural Design 6 65 59 1.4 60
Construction Management 6 62 61 1.3 63
Materials 5 75 67 1.1 67
Currently Enrolled Engineering
Subject Matter Report by Major and PM Examination
Board: Institution:
Board Code: School Code:
Major: Civil PM Exam: FE Civil
*Institution National Carnegie Comparator
Table 1. Subject Matter Report for Institution X October 2009
NCEES Fundamentals of Engineering examimation
ABET-accredited programs
* 0 examinees have been removed from this data because they (1) answered fewer than 10% of the questions or (2) were flagged as a random guesser.** The standard deviation above is based on number of questions correct, not percentage of questions correct.*** Indicates schools in your Carnegie classification; see www.carnegiefoundation.org.
TERMS AND CONDITIONS OF DATA USEThis report contains confidential and proprietary NCEES data. Any use of the data unrelated to accreditation review requires prior approval by NCEES.
5

6
APPLICATION OF FE EXAM RESULTS
Prior to beginning using the exam for assessment purposes, faculty should determine the expected performance in each topic area, depending on the emphasis of that topic in their program. For example, if a civil engineering program places little emphasis on surveying or transportation, students should be expected to perform accordingly. Conversely, if the program has a strong emphasis on structural analysis, one would expect a much higher performance in this area compared to the national average. For more conclusive results, faculty should also consider longitudinal performance over time rather than results from one Subject Matter Report. The form of this expected performance will depend on the analysis method chosen, a variety of which have been developed to examine the data from the Subject Matter Report with regard to program assessment. The two methods described in this paper are as follows:
Ratio Method
Scaled Score Method
RATIO METHOD
A simple and effective process for evaluating exam results is to compare the institution’s results with national averages by topic in a simple ratio. For this method, the ratio of the performance at Institution X to the national performance is calculated for each topic area emphasized in Institution X’s program. The faculty can develop appropriate expectations on this scale, determining how much above or below the national average is acceptable for their students. These expectation levels should be reasonable (remember that comparisons are between same majors taking the same discipline-specific exam) and, at the same time, should represent how the institution views its particular strengths. An expectation of 1.0 is certainly reasonable for most topics, while expectations of 1.05 to 1.10 might be reasonable on subjects in which the institution believes are its strengths.
As mentioned above, at the time of the writing of this version of this report, data from the CBT form of the FE exams was not yet available. The assessment examples provided are based on the pencil-and-paper exams that were offered twice a year (April and October of each calendar year). However, once data is generated by the CBT exams, the proposed methods of analysis will not change; the time frame simply will shift to June and December of each year.
Figure 1 shows the ratio scores from a specific Subject Matter Report. This type of figure can provide a quick check on how the most recent students performed on each topic within the exam. It also demonstrates why one should not use the pass rate of the exam as an assessment tool. Note that the pass rate of civil engineering students at ABET-accredited Institution X is above the national pass rate for all civil engineering students from ABET-accredited institutions. However, the students are performing below the faculty’s expectations on many of the individual topic areas.

7
Figure 1. Ratio scores for a particular Subject Matter Report
April 2013 FE Exam Ratio Score
Major: CVLE PM Exam: CVLE Goal
# took (InstX): 23 % Pass (InstX): 87% % Pass (Natl): 80%
Rat
io: I
nst
X t
o N
atio
nal
1.20
1. 10
1.00
0.90
0.80
0.70
0.60
Mat
hem
atic
s
Engin
eerin
g Pro
babi
lity
and
Statis
tics
Chem
istry
Compu
ters
Ethic
s and
Bus
ines
s Pra
ctice
s
Engin
eerin
g Eco
nom
ics
Engin
eerin
g M
echa
nics
(Sta
tics)
Engin
eerin
g M
echa
nics
(Dyn
amic
s)
Stren
gth
of M
ater
ials
Mat
eria
l Pro
pert
ies
Fluid
Mec
hani
cs
Elect
ricity
and
Mag
netis
m
Therm
odyn
amic
s
Surve
ying
Hydra
ulic
s and
Hyd
rolo
gic
Syste
ms
Soil M
echa
nics
and
Foun
datio
ns
Enviro
nmen
tal E
ngin
eerin
g
Tran
spor
tatio
n
Struc
tura
l Ana
lysis
Struc
tura
l Des
ign
Const
ruct
ion
Man
agem
ent
Mat
eria
ls
For assessment purposes, it is more informative to graph the performance on individual topics over time. Figures 2 and 3 show such graphs for student performance in two areas emphasized by Institution X.
Figure 2. Longitudinal study of Institution X’s performance in
Probability and Statistics
Subject: Probability and Statistics Inst X Results
Major: CVLE PM Exam: CVLE Expected Goal
Rat
io: I
nst
X t
o N
atio
nal
1.20
1. 10
1.00
0.90
0.80
0.70
0.60
Oct 0
5
Apr 0
6
Oct 0
6
Apr 0
7
Oct 0
7
Apr 0
8
Oct 0
8
Apr 0
9
Oct 0
9
Apr 10
Oct 10
Apr 11
Oct 11
Apr 12
Oct 12
Apr 13
Exam Date
8
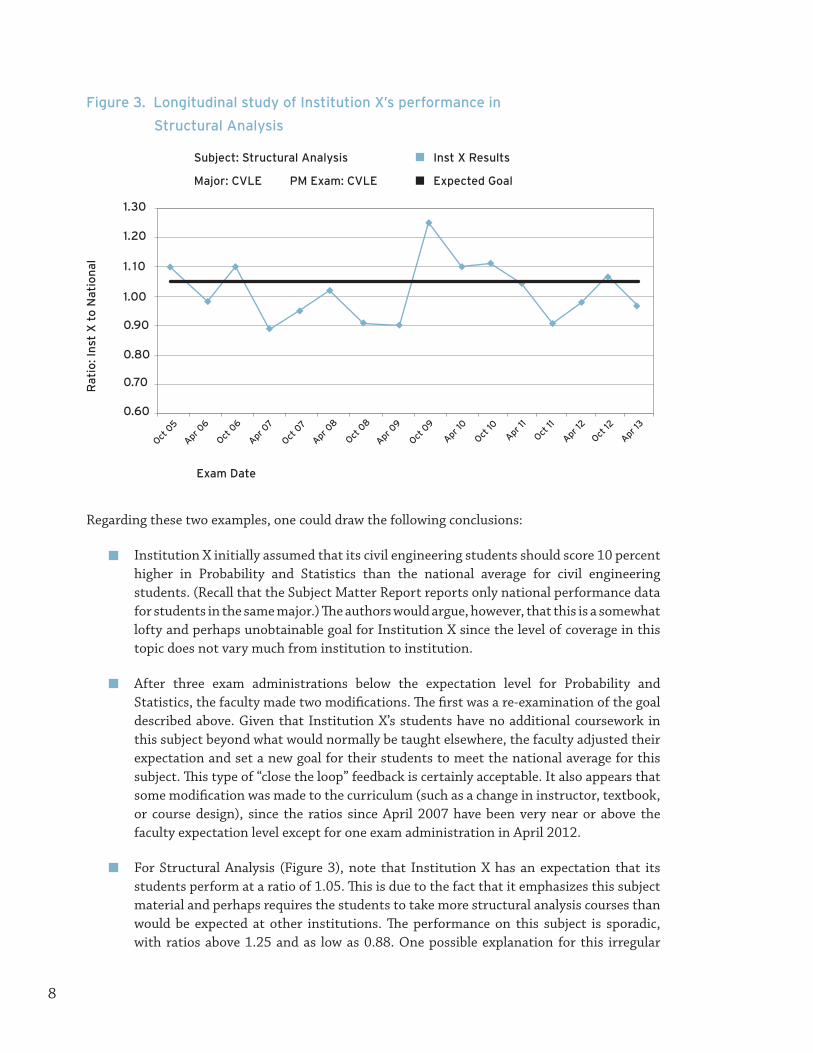
Figure 3. Longitudinal study of Institution X’s performance in
Structural Analysis
Subject: Structural Analysis Inst X Results
Major: CVLE PM Exam: CVLE Expected Goal
Rat
io: I
nst
X t
o N
atio
nal
1.30
1. 10
1.00
0.90
0.80
0.70
0.60
Oct 0
5
Apr 0
6
Oct 0
6
Apr 0
7
Oct 0
7
Apr 0
8
Oct 0
8
Apr 0
9
Oct 0
9
Apr 10
Oct 10
Apr 11
Oct 11
Apr 12
Oct 12
Apr 13
Exam Date
1.20
Regarding these two examples, one could draw the following conclusions:
Institution X initially assumed that its civil engineering students should score 10 percent higher in Probability and Statistics than the national average for civil engineering students. (Recall that the Subject Matter Report reports only national performance data for students in the same major.) The authors would argue, however, that this is a somewhat lofty and perhaps unobtainable goal for Institution X since the level of coverage in this topic does not vary much from institution to institution.
After three exam administrations below the expectation level for Probability and Statistics, the faculty made two modifications. The first was a re-examination of the goal described above. Given that Institution X’s students have no additional coursework in this subject beyond what would normally be taught elsewhere, the faculty adjusted their expectation and set a new goal for their students to meet the national average for this subject. This type of “close the loop” feedback is certainly acceptable. It also appears that some modification was made to the curriculum (such as a change in instructor, textbook, or course design), since the ratios since April 2007 have been very near or above the faculty expectation level except for one exam administration in April 2012.
For Structural Analysis (Figure 3), note that Institution X has an expectation that its students perform at a ratio of 1.05. This is due to the fact that it emphasizes this subject material and perhaps requires the students to take more structural analysis courses than would be expected at other institutions. The performance on this subject is sporadic, with ratios above 1.25 and as low as 0.88. One possible explanation for this irregular

9
performance is the small number of students who take any one particular exam. This can be accounted for in the scaled score approach discussed next. This type of performance also points out a suggestion that is made by the authors: put the subject matter on a watch list if it falls below the expected goal for two consecutive exam administrations, but do not attempt a curricular change in a subject matter area unless the students’ performance has been below the expected goal for three consecutive exam administrations.
To smooth out the performance—especially in subjects that might be covered very late in the curriculum—one can also average the October and April results over a particular academic year and plot the yearly average ratios. This is shown in Figure 4 for the Structural Analysis topic. In this case, the authors would suggest that a subject should go on the program’s watch list if it falls below the expected goal for one academic year but that a curricular change in a subject matter area should not be attempted unless the students’ performance has been below the expected goal for two consecutive academic years.
Figure 4. Academic year averaging
Subject: Structural Analysis Inst X Results
Major: CVLE PM Exam: CVLE Expected Goal
Rat
io: I
nst
X t
o N
atio
nal 1. 10
1.00
0.90
0.80
0.70
0.60
05–06
06–07
07–08
08–09
09–10 10–11
11–12
12–13
Academic Year
1.20

10
SCALED SCORE METHOD
The concept of the scaled score method was developed to assist institutions that have a relatively small number of examinees during each reporting period. This method requires the use of the standard deviation of the examinees’ results for each topic. It should be noted that in the current Subject Matter Report, the standard deviation ( ) that is reported is based on the number of questions correct, not on the percentage correct. For example, from Table 1, the national performance for Engineering Economics is an average of 8 questions correct (80 percent of 10 questions) with a standard deviation of 2.3 questions. Further examination of Table 1 reveals that in all subjects, ±3 effectively covers the entire range from 0 percent correct to 100 percent correct. In the Subject Matter Report being developed for the CBT exam format, the standard deviation will be based on the 0–15 scale discussed earlier.
The scaled score was developed to allow institutions to do the following:
Present the data in a form that represents the number of standard deviations above or below the national average for each topic (as compared to the percentage above or below the national average given by the ratio method)
Allow a range of uncertainty in the institution’s performance to account for small numbers of examinees
For the Subject Matter Report for pencil-and-paper FE exams, the scaled score is defined as follows:
For the Subject Matter Report for CBT FE exams, the scaled score is defined as follows:
11
standard deviation of the examinees’ results for each topic. It should be noted that in the current Subject Matter Report, the standard deviation (σ) that is reported is based on the number of questions correct, not on the percentage correct. For example, from Table 1, the national performance for Engineering Economics is an average of 8 questions correct (80 percent of 10 questions) with a standard deviation of 2.3 questions. Further examination of Table 1 reveals that in all subjects, ±3σ effectively covers the entire range from 0 percent correct to 100 percent correct. In the Subject Matter Report being developed for the CBT exam format, the standard deviation will be based on the 0-15 scale discussed earlier. The scaled score was developed to allow institutions to do the following:
• Present the data in a form that represents the number of standard deviations above or below the national average for each topic (as compared to the percentage above or below the national average given by the ratio method)
• Allow a range of uncertainty in the institution’s performance to account for small numbers of examinees
For the Subject Matter Report for pencil-and-paper FE exams, the scaled score is defined as follows:
For the Subject Matter Report for CBT FE exams, the scaled score is defined as follows:
Scaled score# correct at Univ X # correct nationally
national stan= −
ddard deviation
# of questions (% correct at Univ X % correct nation= − aally)100 * national standard deviation
Scaled score =topic score for Univ X− topic score national
topic national standard deviation
Jennifer Williams 2/18/14 9:54 AMComment [8]: Brittany: This is the formula that needs to be inserted on the next page (see next comment).
Scaled score =topic score for Univ X topic score national
topic national standard deviation
11
standard deviation of the examinees’ results for each topic. It should be noted that in the current Subject Matter Report, the standard deviation (σ) that is reported is based on the number of questions correct, not on the percentage correct. For example, from Table 1, the national performance for Engineering Economics is an average of 8 questions correct (80 percent of 10 questions) with a standard deviation of 2.3 questions. Further examination of Table 1 reveals that in all subjects, ±3σ effectively covers the entire range from 0 percent correct to 100 percent correct. In the Subject Matter Report being developed for the CBT exam format, the standard deviation will be based on the 0-15 scale discussed earlier. The scaled score was developed to allow institutions to do the following:
• Present the data in a form that represents the number of standard deviations above or below the national average for each topic (as compared to the percentage above or below the national average given by the ratio method)
• Allow a range of uncertainty in the institution’s performance to account for small numbers of examinees
For the Subject Matter Report for pencil-and-paper FE exams, the scaled score is defined as follows:
For the Subject Matter Report for CBT FE exams, the scaled score is defined as follows:
Scaled score# correct at Univ X # correct nationally
national stan= −
ddard deviation
# of questions (% correct at Univ X % correct nation= − aally)100 * national standard deviation
Scaled score =topic score for Univ X− topic score national
topic national standard deviation
Jennifer Williams 2/18/14 9:54 AMComment [8]: Brittany: This is the formula that needs to be inserted on the next page (see next comment).
Scaled Score =# correct at Univ X # correct nationally
national standard deviation
11
standard deviation of the examinees’ results for each topic. It should be noted that in the current Subject Matter Report, the standard deviation (σ) that is reported is based on the number of questions correct, not on the percentage correct. For example, from Table 1, the national performance for Engineering Economics is an average of 8 questions correct (80 percent of 10 questions) with a standard deviation of 2.3 questions. Further examination of Table 1 reveals that in all subjects, ±3σ effectively covers the entire range from 0 percent correct to 100 percent correct. In the Subject Matter Report being developed for the CBT exam format, the standard deviation will be based on the 0-15 scale discussed earlier. The scaled score was developed to allow institutions to do the following:
• Present the data in a form that represents the number of standard deviations above or below the national average for each topic (as compared to the percentage above or below the national average given by the ratio method)
• Allow a range of uncertainty in the institution’s performance to account for small numbers of examinees
For the Subject Matter Report for pencil-and-paper FE exams, the scaled score is defined as follows:
For the Subject Matter Report for CBT FE exams, the scaled score is defined as follows:
Scaled score# correct at Univ X # correct nationally
national stan= −
ddard deviation
# of questions (% correct at Univ X % correct nation= − aally)100 * national standard deviation
Scaled score =topic score for Univ X− topic score national
topic national standard deviation
Jennifer Williams 2/18/14 9:54 AMComment [8]: Brittany: This is the formula that needs to be inserted on the next page (see next comment).
=# of questions (% correct at Univ X % correct nationally)
100 * national standard deviation

The range of uncertainty comes from the following derivation.
From the concept of confidence interval on a mean:
The mean of a population ( ) is related to the mean of a sample size n ( ) by
where relates to the desired double-sided confidence interval given by . The value can be determined from the unit normal distribution table for any given value of .
Thus, the confidence interval on is .
Let
Since NCEES does not provide standard deviation data for individual institutions, it will be assumed that the national standard deviation can be substituted for the institution’s standard deviation. In that case,
Normally, for a 99 percent confidence interval would be 2.58. However, in this case, the uncertainty would be so large that the analysis results (see below) for all subjects would indicate that no action needs to be considered. The authors feel that this is unreasonable and suggest using a value of . This allows a reasonable amount of uncertainty based on the number of students taking the exam at any specific institution.
Therefore, the scaled score for the Subject Matter Report for pencil-and-paper FE exams is calculated as
And the range of uncertainty for the scaled score is
11
12
The range of uncertainty comes from the following derivation:
From the concept of confidence interval on a mean:
The mean of a population (µ) is related to the mean of a sample size n (x) by
or, the confidence interval on µ is
Since NCEES does not provide standard deviation data for individual institutions, it will be assumed that the national standard deviation can be substituted for the institution’s standard deviation. In that case,
Normally, for a 99% confidence interval Zα/2 would be 2.58. However, in this case, the uncertainty would be so large that the analysis results (see below) for all subjects would indicate that no action needs to be considered. The authors feel that this is unreasonable and suggest using a value of Zα/2 = 1.0. This allows a reasonable amount of uncertainty based on the number of students taking the exam at any specific institution.
Therefore, the scaled score is calculated as
And the range of uncertainty for the scaled score is
α ασ σ− ≤ µ ≤ +/2 /2x Z x Zn n
.ασ± /2Zn
ασ
= ± /2Let Univ XUniv X Univ X
Univ X
Y x Zn
.ασ
− = − ± /2Univ X
Univ X Natl Univ X NatlUniv X
Y x x x Zn
.α− −= ±σ σ
/2Univ X Natl Univ X Natl
Natl Natl Univ X
Y x x x Z
n
Scaled score
# of questions for a topic * (% corr
=−
=
x xUniv X Natl
Natlσ
eect at Univ X % correct nationally)100 * national standard deviati
−oon
.
.± 1# of takers at Univ X
11
standard deviation of the examinees’ results for each topic. It should be noted that in the current Subject Matter Report, the standard deviation (σ) that is reported is based on the number of questions correct, not on the percentage correct. For example, from Table 1, the national performance for Engineering Economics is an average of 8 questions correct (80 percent of 10 questions) with a standard deviation of 2.3 questions. Further examination of Table 1 reveals that in all subjects, ±3σ effectively covers the entire range from 0 percent correct to 100 percent correct. In the Subject Matter Report being developed for the CBT exam format, the standard deviation will be based on the 0-15 scale discussed earlier. The scaled score was developed to allow institutions to do the following:
• Present the data in a form that represents the number of standard deviations above or below the national average for each topic (as compared to the percentage above or below the national average given by the ratio method)
• Allow a range of uncertainty in the institution’s performance to account for small numbers of examinees
For the Subject Matter Report for pencil-and-paper FE exams, the scaled score is defined as follows:
For the Subject Matter Report for CBT FE exams, the scaled score is defined as follows:
Scaled score# correct at Univ X # correct nationally
national stan= −
ddard deviation
# of questions (% correct at Univ X % correct nation= − aally)100 * national standard deviation
Scaled score =topic score for Univ X− topic score national
topic national standard deviation
Jennifer Williams 2/18/14 9:54 AMComment [8]: Brittany: This is the formula that needs to be inserted on the next page (see next comment).
Scaled Score =# correct at Univ X # correct nationally
national standard deviation
11
standard deviation of the examinees’ results for each topic. It should be noted that in the current Subject Matter Report, the standard deviation (σ) that is reported is based on the number of questions correct, not on the percentage correct. For example, from Table 1, the national performance for Engineering Economics is an average of 8 questions correct (80 percent of 10 questions) with a standard deviation of 2.3 questions. Further examination of Table 1 reveals that in all subjects, ±3σ effectively covers the entire range from 0 percent correct to 100 percent correct. In the Subject Matter Report being developed for the CBT exam format, the standard deviation will be based on the 0-15 scale discussed earlier. The scaled score was developed to allow institutions to do the following:
• Present the data in a form that represents the number of standard deviations above or below the national average for each topic (as compared to the percentage above or below the national average given by the ratio method)
• Allow a range of uncertainty in the institution’s performance to account for small numbers of examinees
For the Subject Matter Report for pencil-and-paper FE exams, the scaled score is defined as follows:
For the Subject Matter Report for CBT FE exams, the scaled score is defined as follows:
Scaled score# correct at Univ X # correct nationally
national stan= −
ddard deviation
# of questions (% correct at Univ X % correct nation= − aally)100 * national standard deviation
Scaled score =topic score for Univ X− topic score national
topic national standard deviation
Jennifer Williams 2/18/14 9:54 AMComment [8]: Brittany: This is the formula that needs to be inserted on the next page (see next comment).
=# of questions (% correct at Univ X % correct nationally)
100 * national standard deviation
1# of takers at Univ X
12
The range of uncertainty comes from the following derivation:
From the concept of confidence interval on a mean:
The mean of a population (µ) is related to the mean of a sample size n (x) by
or, the confidence interval on µ is
Since NCEES does not provide standard deviation data for individual institutions, it will be assumed that the national standard deviation can be substituted for the institution’s standard deviation. In that case,
Normally, for a 99% confidence interval Zα/2 would be 2.58. However, in this case, the uncertainty would be so large that the analysis results (see below) for all subjects would indicate that no action needs to be considered. The authors feel that this is unreasonable and suggest using a value of Zα/2 = 1.0. This allows a reasonable amount of uncertainty based on the number of students taking the exam at any specific institution.
Therefore, the scaled score is calculated as
And the range of uncertainty for the scaled score is
α ασ σ− ≤ µ ≤ +/2 /2x Z x Zn n
.ασ± /2Zn
ασ
= ± /2Let Univ XUniv X Univ X
Univ X
Y x Zn
.ασ
− = − ± /2Univ X
Univ X Natl Univ X NatlUniv X
Y x x x Zn
.α− −= ±σ σ
/2Univ X Natl Univ X Natl
Natl Natl Univ X
Y x x x Z
n
Scaled score
# of questions for a topic * (% corr
=−
=
x xUniv X Natl
Natlσ
eect at Univ X % correct nationally)100 * national standard deviati
−oon
.
.± 1# of takers at Univ X

12
For the Subject Matter Report for CBT FE exams, the scaled score is defined as follows:
and the range of uncertainly for the scaled score is
Generally, it is more common for faculty to set student goals (expectations) based on the ratio score rather than on the number of standard deviations above the national average. As shown below, there is a mathematical relationship between the ratio goal and the scaled score goal. Thus, the ratio goal can be used to estimate an associated scaled score goal.
The scaled score can be rearranged as
In that case, the scaled score goal is then related to the ratio goal as
Unfortunately, the term depends on each subject as well as the results of each exam administration. The value of this term generally ranges between 2 and 4. The authors suggest using an average value of 3 to convert a ratio goal to an associated scaled score goal. That is, if the ratio goal is 1.05, the associated scaled score goal would be 0.15.
As discussed in the section on ratio scores, the authors suggest that an institution put the subject matter on a watch list if it falls below the expected goal for two consecutive exam administrations but not attempt a curricular change in a subject matter area unless the students’ performance has been below the expected goal for three consecutive exam administrations.
For the same topics previously discussed, the scaled score graphs are shown on the facing page.
13
For the Subject Matter Report for CBT FE exams, the scaled score is defined as follows: and the range of uncertainly for the scaled score is
±1
# 𝑜𝑜𝑜𝑜 𝑡𝑡𝑎𝑎𝑎𝑎𝑎𝑎𝑎𝑎𝑎𝑎 𝑎𝑎𝑎𝑎 𝑈𝑈𝑈𝑈𝑈𝑈𝑈𝑈 𝑋𝑋
Generally, it is more common for faculty to set student goals (expectations) based on the ratio score rather than on the number of standard deviations above the national average. As shown below, there is a mathematical relationship between the ratio goal and the scaled score goal. Thus, the ratio goal can be used to estimate an associated scaled score goal. The scaled score can be rearranged as
𝑆𝑆𝑆𝑆𝑆𝑆𝑆𝑆𝑆𝑆𝑆𝑆 𝑠𝑠𝑠𝑠𝑠𝑠𝑠𝑠𝑠𝑠 = !!"#$!
(𝑟𝑟𝑟𝑟𝑟𝑟𝑟𝑟𝑟𝑟 𝑠𝑠𝑠𝑠𝑠𝑠𝑠𝑠𝑠𝑠 − 1). In that case, the scaled score goal is then related to the ratio goal as
𝑆𝑆𝑆𝑆𝑆𝑆𝑆𝑆𝑆𝑆𝑆𝑆 𝑠𝑠𝑠𝑠𝑠𝑠𝑠𝑠𝑠𝑠 𝑔𝑔𝑔𝑔𝑔𝑔𝑔𝑔 = !!"#$!
(𝑟𝑟𝑟𝑟𝑟𝑟𝑟𝑟𝑟𝑟 𝑠𝑠𝑠𝑠𝑠𝑠𝑠𝑠𝑠𝑠 𝑔𝑔𝑔𝑔𝑔𝑔𝑔𝑔 − 1).
Unfortunately, the term !!"#$!
depends on each subject as well as the results of each exam
administration. The value of this term generally ranges between 2 and 4. The authors suggest using an average value of 3 to convert a ratio goal to an associated scaled score goal. That is, if the ratio goal is 1.05, the associated scaled score goal would be 0.15. As discussed in the section on ratio scores, the authors suggest that an institution put the subject matter on a watch list if it falls below the expected goal for two consecutive exam administrations but not attempt a curricular change in a subject matter area unless the students’ performance has been below the expected goal for three consecutive exam administrations. For the same topics previously discussed, the scaled score graphs are shown and some observations are as follows:
• For Probability and Statistics (shown in Figure 6), a ratio goal of 1.1 translated to a scaled score goal of 0.30, and a ratio goal of 1.0 translated to a scaled- score goal of 0.0. After the reduction in expectation that occurred for the April 2007 exam administration, one can see that, within the range of uncertainty provided by this analysis method, the institution has scored above the expectation level for all exam administrations except for April 2012.
• For Structural Analysis (shown in Figure 7), a ratio goal of 1.05 translated to a scaled
𝑆𝑆caled score =topic score for Univ X − topic score national
topic national standard deviation
1 .
11
standard deviation of the examinees’ results for each topic. It should be noted that in the current Subject Matter Report, the standard deviation (σ) that is reported is based on the number of questions correct, not on the percentage correct. For example, from Table 1, the national performance for Engineering Economics is an average of 8 questions correct (80 percent of 10 questions) with a standard deviation of 2.3 questions. Further examination of Table 1 reveals that in all subjects, ±3σ effectively covers the entire range from 0 percent correct to 100 percent correct. In the Subject Matter Report being developed for the CBT exam format, the standard deviation will be based on the 0-15 scale discussed earlier. The scaled score was developed to allow institutions to do the following:
• Present the data in a form that represents the number of standard deviations above or below the national average for each topic (as compared to the percentage above or below the national average given by the ratio method)
• Allow a range of uncertainty in the institution’s performance to account for small numbers of examinees
For the Subject Matter Report for pencil-and-paper FE exams, the scaled score is defined as follows:
For the Subject Matter Report for CBT FE exams, the scaled score is defined as follows:
Scaled score# correct at Univ X # correct nationally
national stan= −
ddard deviation
# of questions (% correct at Univ X % correct nation= − aally)100 * national standard deviation
Scaled score =topic score for Univ X− topic score national
topic national standard deviation
Jennifer Williams 2/18/14 9:54 AMComment [8]: Brittany: This is the formula that needs to be inserted on the next page (see next comment).
Scaled score =topic score for Univ X topic score national
topic national standard deviation.
13
For the Subject Matter Report for CBT FE exams, the scaled score is defined as follows: and the range of uncertainly for the scaled score is
±1
# 𝑜𝑜𝑜𝑜 𝑡𝑡𝑎𝑎𝑎𝑎𝑎𝑎𝑎𝑎𝑎𝑎 𝑎𝑎𝑎𝑎 𝑈𝑈𝑈𝑈𝑈𝑈𝑈𝑈 𝑋𝑋
Generally, it is more common for faculty to set student goals (expectations) based on the ratio score rather than on the number of standard deviations above the national average. As shown below, there is a mathematical relationship between the ratio goal and the scaled score goal. Thus, the ratio goal can be used to estimate an associated scaled score goal. The scaled score can be rearranged as
𝑆𝑆𝑆𝑆𝑆𝑆𝑆𝑆𝑆𝑆𝑆𝑆 𝑠𝑠𝑠𝑠𝑠𝑠𝑠𝑠𝑠𝑠 = !!"#$!
(𝑟𝑟𝑟𝑟𝑟𝑟𝑟𝑟𝑟𝑟 𝑠𝑠𝑠𝑠𝑠𝑠𝑠𝑠𝑠𝑠 − 1). In that case, the scaled score goal is then related to the ratio goal as
𝑆𝑆𝑆𝑆𝑆𝑆𝑆𝑆𝑆𝑆𝑆𝑆 𝑠𝑠𝑠𝑠𝑠𝑠𝑠𝑠𝑠𝑠 𝑔𝑔𝑔𝑔𝑔𝑔𝑔𝑔 = !!"#$!
(𝑟𝑟𝑟𝑟𝑟𝑟𝑟𝑟𝑟𝑟 𝑠𝑠𝑠𝑠𝑠𝑠𝑠𝑠𝑠𝑠 𝑔𝑔𝑔𝑔𝑔𝑔𝑔𝑔 − 1).
Unfortunately, the term !!"#$!
depends on each subject as well as the results of each exam
administration. The value of this term generally ranges between 2 and 4. The authors suggest using an average value of 3 to convert a ratio goal to an associated scaled score goal. That is, if the ratio goal is 1.05, the associated scaled score goal would be 0.15. As discussed in the section on ratio scores, the authors suggest that an institution put the subject matter on a watch list if it falls below the expected goal for two consecutive exam administrations but not attempt a curricular change in a subject matter area unless the students’ performance has been below the expected goal for three consecutive exam administrations. For the same topics previously discussed, the scaled score graphs are shown and some observations are as follows:
• For Probability and Statistics (shown in Figure 6), a ratio goal of 1.1 translated to a scaled score goal of 0.30, and a ratio goal of 1.0 translated to a scaled- score goal of 0.0. After the reduction in expectation that occurred for the April 2007 exam administration, one can see that, within the range of uncertainty provided by this analysis method, the institution has scored above the expectation level for all exam administrations except for April 2012.
• For Structural Analysis (shown in Figure 7), a ratio goal of 1.05 translated to a scaled
𝑆𝑆caled score =topic score for Univ X − topic score national
topic national standard deviation

13
Figure 5. Scaled score results for Institution X’s performance in Probability and Statistics
Subject: Probability and Statistics High Goal
Major: CVLE PM Exam: CVLE SS LowS
cale
d S
core
(S
S)
-1.00
Oct 0
5
Apr 0
6
Oct 0
6
Apr 0
7
Oct 0
7
Apr 0
8
Oct 0
8
Apr 0
9
Oct 0
9
Apr 10
Oct 10
Apr 11
Oct 11
Apr 12
Oct 12
Apr 13
-0.80
-0.60
-0.40
-0.20
0.00
0.20
0.40
0.60
0.80
Figure 6. Scaled score results for Institution X’s performance in Structural Analysis
Subject: Structural Analysis High Goal
Major: CVLE PM Exam: CVLE SS Low
Sca
led
Sco
re (
SS
)
-1.00
Oct 0
5
Apr 0
6
Oct 0
6
Apr 0
7
Oct 0
7
Apr 0
8
Oct 0
8
Apr 0
9
Oct 0
9
Apr 10
Oct 10
Apr 11
Oct 11
Apr 12
Oct 12
Apr 13
-0.80
-0.60
-0.40
-0.20
0.00
0.20
0.40
0.60
0.80
1.00
For Structural Analysis (shown in Figure 6), a ratio goal of 1.05 translated to a scaled score goal of 0.15. Using the ratio method, the students’ performance fell below the expected goal for five consecutive exam administrations (April 2007 through April 2009). However, using the scaled score approach, the goal was reached for April 2008, which indicated that this subject should have simply remained on the watch list. Subsequent results seem to indicate that the students are, once again, achieving at the expected level, with only a couple of single points below the expectation level (October 2011 and April 2013).
For Probability and Statistics (shown in Figure 5), a ratio goal of 1.1 translated to a scaled score goal of 0.30, and a ratio goal of 1.0 translated to a scaled score goal of 0.0. After the reduction in expectation that occurred for the April 2007 exam administration, one can see that, within the range of uncertainty provided by this analysis method, the institution has scored at or above the expectation level for all exam administrations except for April 2012.

OTHER ISSUES
In making an assessment using the FE exam results, faculty must also consider that some students may not have completed the coursework before taking the FE exam. For example, some students take structural design in the spring semester of their senior year; therefore, those who take the FE exam before taking that course will not be prepared for that subject area.
Effective assessment should result in continuous program improvement. Faculty should evaluate the results of student performance in individual subject areas. Doing so will identify areas in which students are performing below the goals established by the faculty and perhaps significantly below national averages. Evaluations should initiate not only the necessary changes in textbooks, teaching mechanisms, and laboratory procedures but also the possible reallocation of faculty to improve student performance. In one documented case in which FE exam results were used, student performance was significantly below the national average in Hydraulics and Hydrologic Systems. The department head was surprised because the student evaluations for the course had been very good over several years. However, upon investigation, he found that the laboratory procedures used to reinforce the theory were shallow and the performance demand on the students was low. The laboratory procedures and depth of instruction were improved over several semesters without lessening instruction on the theory. The most recent exam administrations indicate a significant improvement in student performance in this area. A point that cannot be overemphasized is that for assessment purposes, the results of multiple exam administrations should be considered and the exam content compared to the course content.
One challenge with using the FE exam for outcomes assessment is that at many institutions, not all engineering students take the FE exam. Thus, the institution has a self-selected sample that will, most likely, contain a higher percentage of the best and most motivated students. Evaluation of FE exam results for this situation can still be useful (a) if one assumes that the characteristics of the self-selecting group stay relatively constant from time frame to time frame and (b) if the evaluator looks at the trend of either the ratio score or the scaled score over time in addition to the student expectations set by the faculty. That is, the ratio or scaled score of a particular topic may always be exceeding the faculty expectation, but the ratio or scaled scores may be declining with time. This situation would be considered one in which curricular changes should be instituted to arrest the decline.
14

15
CURRENT USAGE
In 2010, NCEES surveyed 380 institutions with EAC/ABET-accredited programs that receive the Subject Matter Report to determine how many institutions use the FE exam as an assessment tool. Of the 84 respondents
30 (36 percent) indicated that some or all departments require students to take (but not necessarily pass) the FE exam to graduate
49 (58 percent) responded that they encourage students to take the FE exam
5 (6 percent) indicated that the students who wish to take the FE exam do so of their own volition
In addition, 70 institutions answered the question, “Does your program use the FE exam as part of your ABET assessment?” Of these, 57 institutions (81 percent) indicated that the FE is used for ABET assessment by at least some university departments.
CONCLUSIONSAfter much experience using the FE exam for outcomes assessment, the authors find it to be a useful part of a balanced assessment program that includes other standardized tests, assessment tools, alumni surveys, and placement data. The FE exam is particularly important because it is the only nationally normed test of lower- and upper-level engineering knowledge. The detailed reports of performance by subject area provide information that can help to evaluate a program’s success in achieving the student outcomes specified by ABET. Over time, these reports can also help programs document the effects of curriculum revisions, teaching innovations, and other actions taken to improve student mastery of engineering topics.
Based on their experience, the authors conclude the following:
Engineering programs should seriously consider using the FE exam subject-level performance data as part of their program assessment, with proper regard for the caveats described.
A program will gain the most from using the FE exam as an assessment tool if it requires all students to take the exam, particularly the appropriate discipline-specific exam, and if faculty establish specific goals for the program.
State licensing boards should be proactive in working with academic programs to stress the use and value of the FE exam as an assessment tool.
Institutions must remember that the primary purpose of the FE exam is to assess minimal technical competence. Other assessment tools need to be used to assess higher-level theories or critical thought that might be the focus of some portion of an institution’s program.

16
APPENDIX
FE EXAM SPECIFICATIONS AS OF JANUARY 2014
Listed below are the topics that the exams cover and the range of the number of questions in each topic area. Examinees have 6 hours to complete the exam, which contains 110 multiple-choice questions. The 6-hour time also includes a tutorial, a break, and a brief survey at the conclusion.
CHEMICALTopic No. of Questions Topic No. of QuestionsMathematics 8–12 Thermodynamics 8–12Probability and Statistics 4–6 Heat Transfer 8–12Engineering Sciences 4–6 Mass Transfer and Separation 8–12Computational Tools 4–6 Chemical Reaction Engineering 8–12Material Science 4–6 Process Design and Economics 8–12Chemistry 8–12 Process Control 5–8Fluid Mechanics/Dynamics 8–12 Safety, Health, and Environment 5–8Material/Energy Balances 8–12 Ethics and Professional Practice 2–3
CIVILTopic No. of Questions Topic No. of QuestionsMathematics 7–11 Fluid Mechanics 4–6Probability and Statistics 4–6 Hydraulics and Hydrologic Systems 8–12Engineering Economics 4–6 Structural Analysis 6–9Computational Tools 4–6 Structural Design 6–9Statics 7–11 Geotechnical Engineering 9–14Dynamics 4–6 Transportation Engineering 8–12Mechanics of Materials 7–11 Environmental Engineering 6–9Materials 4–6 Ethics and Professional Practice 4–6Construction 4–6 Surveying 4–6
ELECTRICAL AND COMPUTERTopic No. of Questions Topic No. of QuestionsMathematics 11–17 Electronics 7–11Probability and Statistics 4–6 Power 8–12Engineering Economics 3–5 Electromagnetics 5–8Properties of Electrical Materials 4–6 Control Systems 6–9Engineering Sciences 6–9 Communications 5–8Computer Networks 3–5 Linear Systems 5–8 Digital Systems 7–11 Signal Processing 5–8Ethics and Professional Practice 3–5 Computer Systems 4–6Circuit Analysis 10–15 Software Development 4–6
(DC and AC Steady State)
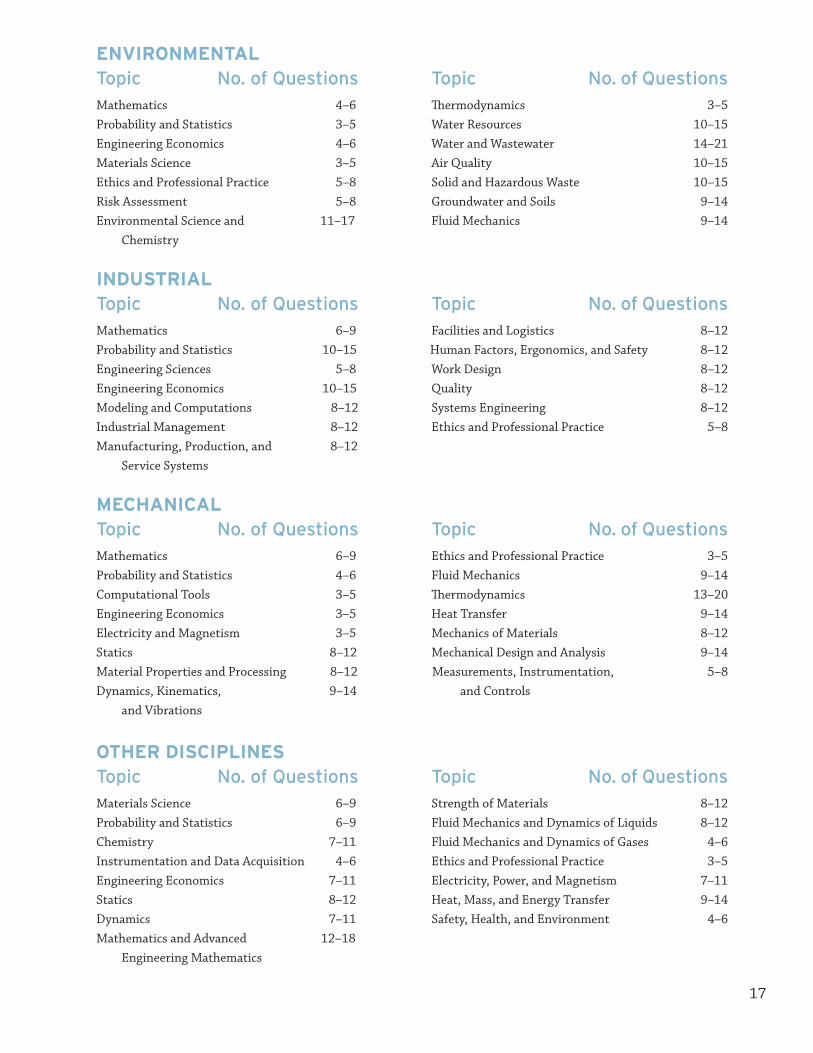
17
ENVIRONMENTALTopic No. of Questions Topic No. of QuestionsMathematics 4–6 Thermodynamics 3–5Probability and Statistics 3–5 Water Resources 10–15Engineering Economics 4–6 Water and Wastewater 14–21Materials Science 3–5 Air Quality 10–15Ethics and Professional Practice 5–8 Solid and Hazardous Waste 10–15Risk Assessment 5–8 Groundwater and Soils 9–14Environmental Science and 11–17 Fluid Mechanics 9–14
Chemistry
INDUSTRIALTopic No. of Questions Topic No. of QuestionsMathematics 6–9 Facilities and Logistics 8–12Probability and Statistics 10–15 Human Factors, Ergonomics, and Safety 8–12Engineering Sciences 5–8 Work Design 8–12Engineering Economics 10–15 Quality 8–12Modeling and Computations 8–12 Systems Engineering 8–12Industrial Management 8–12 Ethics and Professional Practice 5–8Manufacturing, Production, and 8–12
Service Systems
MECHANICALTopic No. of Questions Topic No. of QuestionsMathematics 6–9 Ethics and Professional Practice 3–5Probability and Statistics 4–6 Fluid Mechanics 9–14Computational Tools 3–5 Thermodynamics 13–20Engineering Economics 3–5 Heat Transfer 9–14Electricity and Magnetism 3–5 Mechanics of Materials 8–12Statics 8–12 Mechanical Design and Analysis 9–14Material Properties and Processing 8–12 Measurements, Instrumentation, 5–8Dynamics, Kinematics, 9–14 and Controls
and Vibrations
OTHER DISCIPLINESTopic No. of Questions Topic No. of QuestionsMaterials Science 6–9 Strength of Materials 8–12Probability and Statistics 6–9 Fluid Mechanics and Dynamics of Liquids 8–12Chemistry 7–11 Fluid Mechanics and Dynamics of Gases 4–6Instrumentation and Data Acquisition 4–6 Ethics and Professional Practice 3–5Engineering Economics 7–11 Electricity, Power, and Magnetism 7–11Statics 8–12 Heat, Mass, and Energy Transfer 9–14Dynamics 7–11 Safety, Health, and Environment 4–6Mathematics and Advanced 12–18
Engineering Mathematics
18
REPORT AUTHORS
Steven F. Barrett, Ph.D., P.E.
Steven F. Barrett is a professor of electrical and computer engineering at the University of Wyoming and also serves as the college of engineering and applied science’s associate dean for academic programs. He has served on the NCEES PE Electrical and Computer exam development committee since 2000. He is also an ABET Engineering Accreditation Commission program evaluator and a member of the IEEE Licensure and Registration Committee.
John W. Steadman, Ph.D., P.E., F.ASEE
John W. Steadman is dean of the University of South Alabama College of Engineering. He also taught at the University of Wyoming for 32 years, 14 of which he was head of the electrical and computer engineering department. He is a past president of NCEES and IEEE-USA and an emeritus member of the Wyoming Board of Registration for Professional Engineers and Professional Land Surveyors. He has served on NCEES exam committees since 1986.
David L. Whitman, Ph.D., P.E., F.ASEE
David L. Whitman is professor of electrical and computer engineering at the University of Wyoming. He is a past president of NCEES, a member of the Wyoming State Board of Registration for Professional Engineers and Professional Land Surveyors, and a member of the IEEE Licensure and Registration Committee. He has been involved with NCEES FE exam preparation since 2001.


P.O. Box 1686, Clemson, SC 29633
NCEES.ORG