of forest statistics far north mississippi · sttrckvolume 1 te 2 percent and hardwood.6to...
TRANSCRIPT
@ United States Department of Agrlcultue
Forest Statistics far Forest service North Mississippi Southern Forest Experrmsnt station Counties-1 994 New Orleans, Lau~slana
Joanne L. Faulkner, Palrlck E. Miller, Resourca t3ulletln Andrew J. Hahell, and Jack D. London SO-180 June 1993
FOREWORD
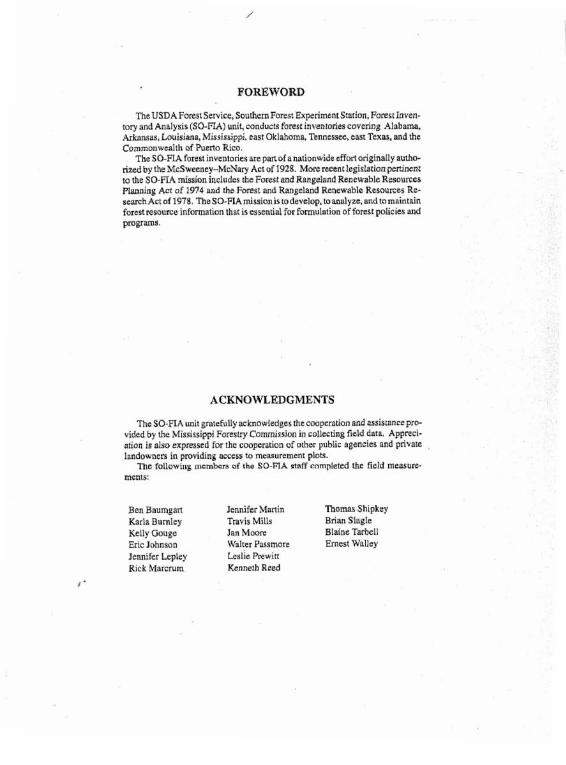
TheUSDA F ~ w t Service, Southern Forest HxperimtntStarion, Forest Invcn- tory and Analysis (SO-Ft4) unit, conducts f~rert~nventanes covering Alabam, Arkansas, Louisiana, Mlsaissippi, east Dklahoms. Tennessee, east Texas. and the Cwmmonwtalth of Puerta RJCO
The SO-FLA forestlavenldncs are part fa nationwidedfortofiginally authb riztdby the McSwecney-McNary Act of 1928. M o r e r m t legislat~onpe~nmt to the SO-FIA mission includes the Forest and Rangeland RencwableResources Planning Act of 1974 and the Forest and Rangeland Renewable Resources Re- starchAct6f 1978 TheSO-FIAmissionis todevelop, toanalyze, and tomaintain forestresOurce informatmn lhac~sesscnnal for formulation offorest policies and progms
ACKNOWLEDGMENTS
The SO-FIA unitgrateflllly acknowledges the mperaoon and ass~staaecp- vidcd by the Missrssimi Forestry Commission in collecting field data. Aflieci- aaon ir also expmsed for the cooperation of other public agencies and pnvaU , landowners im provihng access to measurcmtat plots.
Tnc fo l l~winy ~mcmbcrs of the SO-PIA etaff cnmpleted the field measure- ments:
Ben Bauqan Jennifer Manin Thomas Shipkey Karla Burnley Travis Mills Bnan Slagle KeUy Gouge Ian M o m Blahnu Tarbell Enc Johnson Walter Pasamoft Ernest Wallay Jennifer Lepley Leslie Pmw~tt Rick tvlarcrum Kenneth Reed

CONTENTS
METHODS ............................................................. 1
STATISTICAL RELIABILITY ............................................. 2
HIGHLIGHTS .......................................................... 3 Area ............................................................... 3
....................................................... Stand Sheturn 3 Invmtoq . . . . . . . . . . . . . . . . . . . . . . . . . . . . . . . . . . . . . . . . . . . . . . . . . . . . . . . . . . . 3
............................................... Components o l Change 4 Conclusions ......................................................... 4
AP PENDIX ............................................................. 4 Definition of 'Itm .................................................. 4 core Tables 1 through 25' .............................................. 7 Supplemenr~l Tables 26 through 44 ....................................... 22 Figures 1 thmugh 8 . . . . . . . . . . . . . . . . . . . . . . . . . . . . . . . . . . . . . . . . . . . . . . . . . . . 38
'Core t~bles rrre presented in r c s p u c to thc Soutkrn Industrial PomaQ' Research Council's M- ommendatiuns. These tables are identicul mmong Fomt Inventory and Anslysls unit! in thobtcm United States .


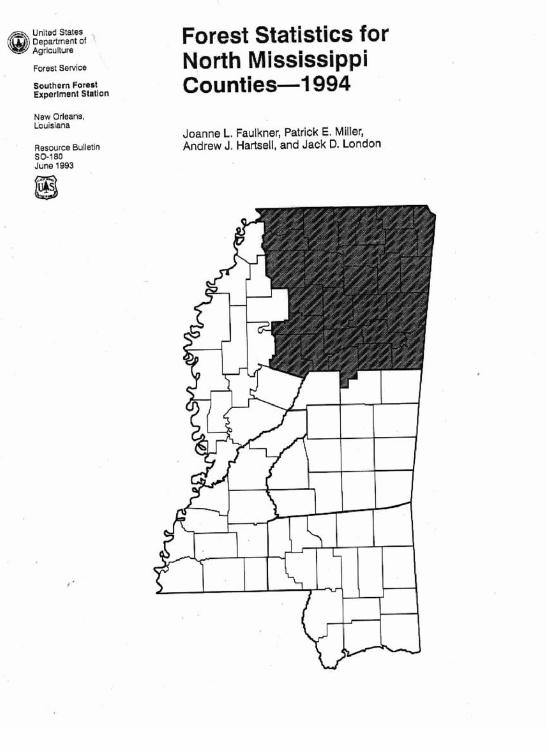
Forest Statistics for North Mississippi Counties-1994
Joanne L. Faulkner, Patrick E. Miller, Andrew J. Hartsell, and Jack D. h n d o n
INTRODUCTION
Tabul~ted sesults were derived from data obtdned during a 1994 forest inyenmy of n m h Mississippi counties (fig. 0. Field work wasebnduclcd from Dccmbw 1992 tt May 1993. Core tablcs 1 through 25 arecompubleamong Forcst Invento- ry and Analysis WA) units in thc Eastern United States. Sup. plemental tables 26 thmugh 44 pmvide infurrnabon beyond hat provided by the core tables. Cornpansons arc made k- wean results of the 1594 invcntmy and previous ~nvcntaries conducted in 1987 and 1977.
METHODS
The Southern Forea Experiment Station, FPrea Inventory \ and Andyds unit (SO-PIA) uses I two-phase smrnpleoftemp
my aerial-photo p i n t s and a systematic grid of pcnnanent ground plots The area of forested land wsdetemined by pho- loinmpretation oftemporary pints and field duck$ of ptrma- nmt plots. Field measurements were conducted on a subset d pwnancnt plDts spaccd 3 miles apsrt Trccr wcrt r n c r s d on plots that wtrcforesred at rhe time, ofthecurren~inventoryor at the time of the previous inventory.
Eachplor consisted of 10sarel l i tepoiotss~ovaabaut 1 a m At eachpoint, treesS.Oiltchss i n d i a m e r c r a t h s r height (d.b.h,)~Lsgtrw~sdltfttdformsuremtntan avariablb radius plot defined by a 37.5-factor prism. Thus, each tree se lected with the pnsrn represented 3.75 square fen of basal area w a r n . Trees from 1 0 m4.9 lnchcs in d.b.h. were tallied on a r - lr-75-acrc f i x d plol ac each of the finr three p in ts and at any remaioiogpa~ntswhcrc fcwer than tuo trees 5 Oinchesin d.b h. or larger were tallied. If no trees gnaw than 1.0 inch were ml- lied st a paint, then s d i n g s w m tallied. Sevcral plot-level measurmnents rclaung to timber and other forest resources were also cdleettd.
Tree dbta w t r e u s d to tsrimate volume, basal am., numk oltfees, and other plot-level variables Ownership informaDon was obtained for each rnaasuremcnt plot using tax records and other sourccs, Plot-lcvel estsrnates were expnnded using county-level factmderivdaspart ofthe fomtareadetemina- tian.
Over successive inventories, techniques have evolved m that some changes have been instituted In recent inventories these changes havc bccn mostly rrunor in scale and have b ~ t n instituted because of the availability of better methods or to
achieve greatercomparibility among FIA units. Thcse~bungm may, in somecases, affect the ability to d i s m minor shiis in resource trends.
The major changssffr%tlng?he 19941nventwyi$the df- fiad tree classificauoa s y s m that hsr, baen jn d k t sin= the 1988 inventory of Arkansas;. Trcc grndc 5 1s uscd m dcsignatc t m s capable of producing at leastme 1 2 - f d l o g or two 8-foot logs in the sawlog portion, but not capuble d producing a grad- able 12-footloginthebutc 16-foot scctlon. T k z t r c ~ f o n n c r - ly classified as rough or rotten culls-arc now included in growing stock. In previous inventones where t ius revlslon has been in effect, these t r e e s have increased softwood prowing- sttrckvolume 1 te 2 percent and hardwood.6to Spercent, Com- parisons of tha m n t Inventory with pnviws estimates of gmw~ng 6mck arc basad on data that havc bccn reproc~sscd m uccount for the change in defin~tion IS far as p s i b l e
Another change affecting the classification of growing- stock trees is the requirement that at least one-third of the saw- log volume (or prospective volume, in the case of smaller-than-sawtimhr sim trea9) has to km utllrzable. b viwsly, one-half thc v o l u m had to be utilizable In the prc- vious tnventones where i his revision in utilizable volume has been in effect, few m s have been ~Eected.
Twofinal changes affecting trend analysis iavolvs a n a cstl- mate changes, first, theuse of the U.S, Census Bureau's land area estimatss for tho dttcrminstiw of the land araa cxpadcrs affects arca change analyais In the 1987 survey, the U.S. Cen- sus Burenu's 1980 land area estimmtes were used; in the 1994 survey, the 1940 land area estimates were used The rerulr of this change is h a t wtal land mreu in this unit decressed 76,400 ucresfrom the 1987to1994 fomstsurveys. Mwhofthischanga is due to the Census Bureau's new definieion of the warn clnssi- Sication, which includes areas previously clas~fied ss land. Anotherchange affecting a m Vend analysis conctms tht clas- sification of national forest lands, Ia the 1989 sutvcy, forest area forall ownerships was calculated bassd on an estimate of fmea area for the county. That IS, tach national forest plat's expansion factor was based on the farast arca for the county in which the plot occurred. Far thc 1994 nurvey of Mississippi, national f m s t lands were enumerated, ~ n d each plot's expan- sion factor was based on khe forest area d nabonal forest lands in that county.
Because of the revi5Cd definitions and to better assess trends, analysis of trends jn inventory volum, gmwb, remov- als, and mortality will focus on live trees, sather han growing- ~twk, &S had been done in the past.
JOP-L Padh,Paui~k8, Millcr. AndrcwJ.!4amtll,nndJark D.lundon ~ ~ o ~ U . S . D c p e m o t a a l A g r ( e u l m ~ . P m s t ~ i c s . SrmlhcmPm~Exptj- mr Station. FMCsl l n v n ~ mnd Analysis, Slarkvillt, MS 39739
h l ~ b u a h s ZI) 14A 14 3 25.8 15.9 16 3 26.3 3 3
All C Q U ~ U (1.5 3 ,3 3 8 7.1 3.5 3.9 1.2 4.5
'By m d u m q l l l y l fpnrmla. t$smpling m r prcaln. UInn SO p c ~ c n ~
STATISTICAL RELIABILITY
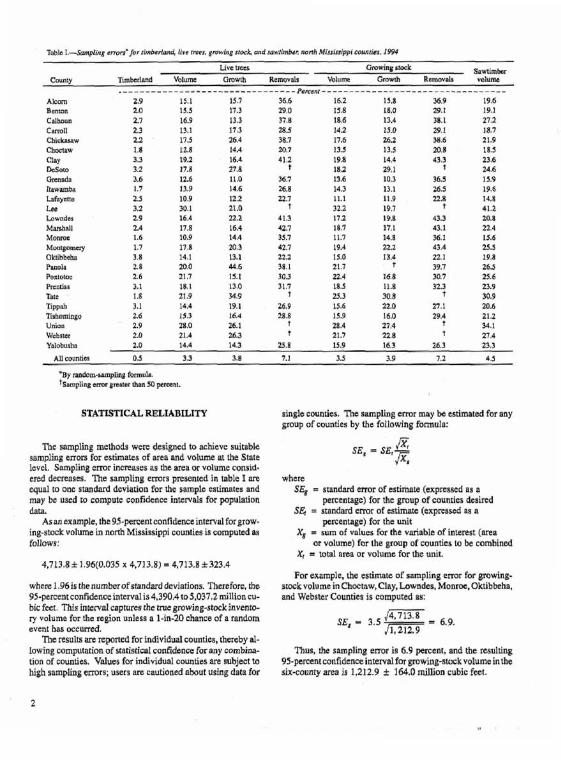
The sampliig methodl were designed to d c v e suitablt sampling moss for estimates of area and volume at the Sratc level Samplii error increases as the arer or volume consid- ered derrcascs. The sampllng crmrs presented in table 1 art equal to one standard devianon for the sample csumates and may be used u, compute confidence intervals for population dam
Assn example, the 95-pemnt confidence interval for grow- ing-stock volume in mnh Mississippi counties ~s computed as follow'
where 1.96 is the number ofstandard deviatiwa. Therefore, the 95-parcent confidence intcrval~s 4,390,4 to 5.033,2 million cu- bic feet. This interval captures the rmepwing-stack invent* ry volume for the region unless a 1-in-20 chance of a random event has oeeur~ed
The results are seported for individual cwnties, thcr8by al- lowing awnputation of ratistical coflidcnm for any combins- tion of counties. Values for individual counhes art mbject ta high sampling m r s , users are cauboned a b u t using data for
single countieb. 'Ilu sampling emor m q b tdmmted for army gmup of countics by the fallowing formula:
f i SE, = $E,- 4%
whew 3EB = nundsd c m of estkhte (expreescd &a a
percentage] for thc group of counties desired SE, = standard error of csurnate (expressed as a
percentage) for the unit XE = sum of values for the variriblc of interest (area
nr volumcE for the grwp of countits to be combined X, = total area or volume for the unit.
For example. the estbnaft of mnpling e m for growing- stock volume in Chmtaw, Chy, Lowndes, Monrat. Oktibbeha, and Wcbsttr Counties is computed as:
JGim SE, = 3.5 - 6.9.
Thus, rhe sampling error is 6.9 perant, snd the resulting 9S-psrcentconfidcnceintervdf0rgmwing-!~kvolumc inlbe six-county area IS 1,212.9 k 184.0 million cubic kt.

Invrmmy p e M and spccics amup
Gmss gfwft5
HIGHLIGHTS
Area
The north Mississippi survey unit is about 59 pcrcent for- esttd, with 4,858,000 acres of forest land. All of that forest land is classified as tirnbcrland; there is no w d l a n d or reserved umhrland. The area of timberland increasad 10 pcrcent since. 1987, with thc greatest increases in the pnvate corpwate and private ~ndiv~duak ownership classcs. Pnvate owners account for 91 percent of the timberland are=. T~mbwland owned by forest industries d-sed 68.300 acres, down lOpcrcent from 1987 The decrease in thenahanal forest m a is due to the cf- fccts of changes in the method of enumeratiq national fore~t area for the 1994 survey
The oak-hickory forest type covers 45 parcant of thc tim- berland of north Mississippi, and nmaIns the dominant forest type, after a 14 percent increase to 2,177,000 acres. The oak- gum-cypress m a also incmascd, up 21 percent fmm 1987 tc 716,100 acrcs. Pine type forests increased 21 percent to 1,137,300acres. Theplantsd-pinefonsttypcshowed the great- est change-up 116 ptrccnt to 783,400 acres. Twenl).-two per- cent of the ~ncrwsc in planred pine curr red on l a d y that wsrc formerly agricultursl. Natural plne and oak-pine areas de- creased.
Sin= 1967, trends in timberland arm by stand-size class rc- vtal a 53 percent increase In the urea of the sapling-sccdling class to 2,018,800 acres, whercas rhc other stand-size classes decreased in area. Sapling-secdljng stands now account for sbaut 42 percent of the timberland area. Thin compares with
While the numbs of Lye trccp in all diameter claases in- creased 5 w e n t since 1987, the largest increase forboth soft- woods a n i hardwoods was mainly ia trees less than 5 0 inches in d.b.h The number of livs aces greater than 5.0 inches in d.b.h. decreased 6.5 w e n t alnce 1987.
Softwoods less than 5,O inches in d.b.h. -ed 30 per- cent. While the number of a o M s p r c r tbmn 5 0 inches in , d.b.h. decraasd 10.5 percent, thenumber in the 5.G t06,g-inch class i n c w e d about 10 percent. The other diameter classes (greater than 5,O inches) increased slightly w decreased,
Forhardwoods, the number of liw Zms less than 5 0 inch- in d.b.h. increased about 5 percent. Fbt Vets greater than 5.0 inches in d b.h, the number of tracs dtcrtascd 4 percent, w ~ t h decreases occurring in the 5 0- ta 14.9-inch classes, and in- crertses in the IS 0-tnch and larger clrtsses
In Iwhng at trends in live-tree basal m, s o h d basal area dmrtased 19 percent, while hardwoad basal arel de- trcnsad 10 percent. For roftwaods, the average basal area of sapling-seedling trcer increased 12 percent to 3.8 square feet per acre, while the basal area of poletimberand sawtimbcr trccn decreased 16 pcrccnt and 29 percent respectively, Dtcrtascs in average basal area were evident for all s ~ u s of hardwoods. ranging finm 5 p t m m in the sawtimk category to 15 percent In the pbletimber category. The average basal area of all-live trees is 69.7 square feet ptr acm. down 13 percent fmm 1987 esumates. Seventy-one percent d the bass1 a r t a is in hard- woods, and 29 percent is in s o h d s .
Inventory sapltng-s&lingstands ac~ountin~for313~srccntaf theumber- Softwood l lve- tm volume decrcastd 13 gc~cent since land in lggT when were ranked sccandhhind sww- 1987. Shortleaf pine volume decreased 33 percent and naw 'mhL Sawumber decreased vent to cbrnprises only 34 percent of the softwood live-ttw volume, acres. They have nQW fallen to second (behind sapling-seed- ling atand Q , riccountirip for 36 percent of a l l timberland. ~ $ ~ ~ ~ ~ ~ ~ ~ ~ ~ ~ ~ t ~ n ~ ~ ~ ~ ~ ~ ~ ~ ~ ~ ~ w ~ :
with 43 percent in 1g87p dc- countP for 62 percent sf the sDfiwood live-tree volume creased. down 10 percent since 1987 tc 1,054,300 acres. (compared with54percentin 1987). Redcedar ~ l u m c i s u p 3 6
percent, but st111 c~mpt is t s asmall percentage (3 percent) ofthe softwood volume.
Hardwood liwuec volume, 67 percent of all lire-me rot- urne, increased slightly. ?his change, howcvcl, was not statisti- cally significant,

Average live-tree volume per acre in north Mrssissippi is 1,09Zcubicfeetperacre, down 11 percent from 1229cubicfeet per acre In 1987. Softwood vclvme per acre is362 cubic feet. down 21 prcent fmm 1987. whereas hardwood volume per acre ru 730 cubic feet, down 5 percent.
While overall softwood aawumbec volume decmsed 11 percent, volume in highquality gradcs 1 and2 has ~ncrcaad 35 percent. Ksrdwocd sawtimber volume increastd slightly: again, tho change was not ststirtically signifmnt. However, hard- volume in gradcs 1 and 2 increased 58 percent. A changctn tree-grading mcthods couldascount for somc of this changc.
Components at change.
Zhe awmgc net annual growth of live-trrc volume fram 1987 to I994 was down sUghHy (1.3ptrccnn) to59.4cubic fcet per acre per year over the previous perrod (1977 m 1987). For the entire unit, growth of all bve softwabds increased 15 per- cent, while growth of all live hardwoods increased 3 purcnc.
Average rtnnual hve-We mortality increased for all s p i e s . Softwood mortality increased 11 percent, and h n r d r o ~ d mortalicy incrcascd 2.0 percent.
Average annual l i v ~ t r e t removala for the period increased significantly for bothsoftw& and hardwoods, up 77 percent and 72 percent respectively Softwoods camprised 56 petcent of the average annual llvetree removals, while hardwoods comprised the mnaning 44 percent. These percentagca are the name ss for the previous period
Avcrage annual sawtimber removals rnm than doubled since !he 1977 to 1987 pcriod. Softwood ~ r n o v a l s increased 99 perctnt, and hardwood removals increased 130 w e n t
The average n u annual all Livu growth-to-removals trtnds indicateadtc~asing inventory, Softwo&sare decrcasingmt an annual average of 51.4 million cubic feet. Statistically, the hardwood inventory remained unchanged, Current growth-to- removals trends could. however. indicate a decreasing invento- ry in the future
Concludons
Changes in the f m t reaourccs of north Missislippi arcevi- dent. Timbmlmd areaincreased 10 pemnt, and the area inpjne plantations showed a large increaw. Sapling-wedling stands now constitute the greatest ponion of the timberland bas?.
Removals of alllive tms inereaged significantly during this perid. Thisrcveals a changc over the previous period froman increasing inventov to a decreasing invcntoly.
APPENDIX
Definltlon of Terms
Pode~iRher t r e r d o f t w d 5.0 i n c h ta 8.9 inchesin dl- arneter at breast height (d.b.h.1 and h a r d w d 5.0 to IO.9 in- chts in d.b,h.
Rough, mnen, Mdsalwbledeadtrdt9-See "tree clasaes." Sapling-Trees 1,O Inch to 4.g inches tn d.b.h. Sawt ider tree9-Trees 9.D inches and larger in d.b.h. for
s o f t w d and 11.0 rnches md larger for hardwmds. &ed!irrg+Trees lcss than l,O inch in d.b.h, and grcatcr
than 1 foot rallforhardwoods,greaterthan 6hchtstallfor soft- wwds,and greater rhan0,S Inch indlameterat ground Level for longlec pint.
Forest land-Land mt least 16.7 percent stocW by forest trees of uny sizs, or formerly having such hec cover, and not currently developed far n o n f m t uses, Minimum arcc wnsid- end for classification is 1 acre. Forest land isdividedinto tim- b l a n d , reserved timberland, and wdtnnd .
Re~enlcd timberfund-Productive public forest land wath- drawn from timbcr utiliz~tion through statute or administrative regulations
Trmberland--Fmst land that Is producing, or is capable of . producing, crops of indurtrial woad and ir not wllhdrawn from timber uuliition. ?imberiand is synonymous with "commca- cial forest lsnd" in prior repons.
Wadland-Forest knd ~ncapabls of y l c l d i crops of in- dusmal w e d because of adveree site d i t i o n s .
Forest Types
Elm-ush-corronww&Forc~~ in which elms, ashes, 01' cottonwoods, singly or incombinauon, comprlst a plurality d the stocking. Common assoeiatcs include willowa, sycamore, American beech. wnd maples.
Lab/uil)~shonr'e&pirre-Fmts in which pines (exccpt Ianglcafand dash ~ i n e s ) and eastemndcedar, singly 0 t h com- bination, comprise: a plurality of the stocking. Common assaciates ~nclude oaks, hickories, and gums.
brrgleaf-slash pine-Forests in which longleaf m slarrh plncs, singly or in combination, comprise a plurality of the s m k i i g . Co~~rmon as so^-iates includc othcr southern pines, oaks, and gums.
N~nry,pe&~rnbtrland c u m f l y unoccupied by any live rrea or seedlings; for examplc, very recent clcarcur nrcas,
OoLgum%ypnss-Bottomland forests in whch tupelo, blackgum, swcetgum, oaks, or southern cypress, singly or In combinati~d, comprise a plurality of the stocking except w h m pines comprise 25 to49 percenr, m whichcase the stand would ke classified oak-pine. Common associates include EOttOn- wwds. wrllows, ashes, elms, hackberry, nnd maples.
Oak-hrcko+Forests in which upland oaks or hi&es, singly or ~n combmation, comprise a plurality of the stocking, except whtrcpines comprise25 to 49percent, tn whlch case the stand would bc classifid oak-pine, Common associates in- clude yellow-poplar, elms, maples, md black walnut,
Oak-pine--Forests in which hardwoods (usually upland oaks) comprise a plurality of thm stachng, but In which soft- woods, except cypress. comprw 25 to 49 percent of the stock- ing. Common associates include gums, hickories, and yeUow-poplar.

Gmrsgmwrh-Tots1 M s e hstandvalume computedon growing-stock trees or live uees ~t l a s t 5.0 inches in d.b.h, Gross gmwth equalr survivor growth, plus ingrowth, plus growth on removals, plus growth on rnomlity, plus cull hcre- ment (forgrowing stock computations). Grass gmwth includes mcmality.
Nel change-Incressc or d-se in sbnd wkrrmc mm- purcd on growing-stock trees or l ivt t w s at hast 5.0 Inch in d.b.h. Net changs is equal to net growth minus removals.
Net gmwth-Incrcase i n s t ~ n d volume computed an grow- ing-stock trees or ltvc trtcs at least 5.0 inches in d.b h Net gmwth 1s q u a 1 to gross gmwth minus monality
Avemge annuai mor!alt~Average annual sound-wood volume of growing-smk or live vees thut died from natural causes for rhe intenurvey period.
Averare annual removoh-Averhgc net mnual volume of I
I growing-stock arlive trees runaved from the inventory by har- I vesting, cultural operauons (such a5 timberstand impmve-
ment], landclearing, or changes in land use for rhc intersurvcy perid.
Avemge net annual grwvllr-Avenge net annual vdume incrtnst of growing-stock or live trees for the intersurvey pri- ad. --
Bu~aiarea-The area in quart feet of ofthe cmss section st breastheinhtof a single t m o r of all the VeesInastand,usually expressedin square feet per acre,
Cullincremenr-The change in growing-stwkvolume due to grow~ng-srock, rough, or rottentrees changing me class bc- tween surveys.
D.b.k. (dramcteratbrea~l herght+Trce dlamctcrin inches, outs~de bark, usually measured at 4,5 feet a h v c ground
Dramc?@r classe~-The 2-~nch diamctcr classes extend $om 1.0 inch below to 0.9 inch abovc the sm~ed midpaint. Thus, rhe 12-inch class iacludcs trces 11 0 inches through 12.9 inches in d.h.h.
D.o.b, (diamerer outside bdrk)--Stem diameter including bark
tog gmdes-A clnssificarion of logs based on sxtsrnnl charnctcristics as indicators of quality or value,
Mprroliry--Nurnbcr or sound-wwd volume of growlng- stock lncs or livt trees that died from natural causer dur~ng a specified period,
Norural sra~tds--Stands with no evidence of anificral re- generation rncluding those stands established by seed-tree re- generation methods.
Platiet!onr--Planted or amficially reeded stands. Re~t~avals--The net volumc of growing-stock or live t r e s
removed from the inventory by harvesting, cultural opermonfl [such as timber stand ~mprovcrnent), land clearing, or changes in land use.
Snwlog portion--That p ~ ? i o n of the bole of a sawlrmber uee between a I -foot stump and the sawlog top.
Sawiog top--The point on the bole of a sawtimber tres abovc which a sawlog cannot beprodwed. Thednimum saw- log top 1s 7.0 Inches in d.0.b. for s o f t w d and 9.0 inches in d a b , for hardwoods.
ScIfic! red oah-A gmup of several red oak species m- posed of cherrybark, Shurnad, and northern red oaks. Qhcr red oak species are incllrdd In tht "other red oaks" p u p .
Select whit* w k A gmlrp d several white oak spccics composed of white, swamp chcsmut, swamp white, chinkspin, Durand, and bur oaks. Other white oak s p i e s are included in the "other white oab" gmup.
Sate clam-A classification of forest land in f a m s ofp ten- tlal capacity to grow crops of industrial w d .
grode-Aclassificstion of the sawlog ponionof SBW-
timbettrtts based on: ( I ~ ~ h c g r a d c o f thcbunlogor (2) theabll- ~ t y topmducc atleast one 12-footortwo 8-foocl~gs in theupper section of tht sawlog portion. n e e grade is an indicatorofqual- ity; grade 1 is thc'best qunliy.
Upprrrtem pornion-That pan of the mdn stem d a snw- limber tree abovt the gawlog top to a d.0.b. vf4.0 inshcs or to the point where the main stem brc& inta limbs.
Ownerehlp Masses
F o n n e m r t e d land-Lands. operated as a unit of 10 acres or morc and from which the sale of agric\llturalproducts totals $1,000 or more annually.
Formr mdu~rry lan&Lands owned by cornpanlea or indl- viduals operating wood-using plants (eitherprimary or second- -1.
Norlanfflfaresr fad-Federal lands that have been legally designated as nalion~lforests or purchase units and other lands under the administration of the F m s t Scrvicc, ~ncluding exper- imental areas.
Nonirsdusftial privare land (nyomte+Lands privately owned by private corporations 0therthBn forest industrjcs snd incorporated farm!..
Noninrlrrsrrrnl pn'wte l a d I1ndlvidual)-Lands privately nwnei hy individualx other than forest industries or farmers.
Brlrer Federal land-Fcdcral lands other t h ~ n nat~onal fc- rests.
Sibre, caun& ~lndnlunlcipa! land-hnds owned by S W s , counties, and local public agtncics or municipdltier. or lands leased to these govemmcntnl unttfl for SO years or mvm,
Norrstockadstdnds-Stands less thnn 16.7 percent slaekcd with live trtcs
Po!erirrrber srond&tonds at least 16 7 percent stocked with live trccs, w ~ t h half or r n o r e d this stocking in sawtimber or poletimber trces, and with poletimber stocking cxceed~ng that of sawtimber $toeking.
Supllng-srcdl~ng sronds-Stands at least 16,7 percent stocked with lrvc trets, with more than half of this stochng in saplings or seedlings.
Sa~vh~nber s tandeStands at least 16.7 pcrcent stocked with Iive trees. wilh half or morc of this stocking in sawumber or poletimber trees, and wrth snwtimber stoclungnt least qua1 to poletimber stocking,

Stocking is a measuredtheextent to which the growth po- tential~fthe site isutiliuedhy trreegorpnempted by vegekarivc cover. Stocking is determid by comparing the stand dens~ty in terms of number of trees or basal m a with a specified sun- d a d . Therefore, full stmkitq is 100 v e n t of h e stocking standard.
The tabulation below shows the density standard in terms of trees per arre by size class required for 111 stncking.
Inches lrickes
S d l i n g s 600 14 72 2 540 I 8 60 4 460 20 51 6 340 22 42 S 2Ao 24 36 10 155 26 31 12 115 28 27 14 90 30 24
Stocking categories are arbiaglrily defined as follows: OprrmdEIysrosked--Stands 81 to 100 percent stocked with
growing-stock trees Thcsc stands are growing toward a folly gtwktd condhon (idtal space required for tach treeincms- with age]. Optimum growth and bolt form mcur in this range.
OversrdckedStandsg~atcr than 1DDpercant stocked with growing-stock rrees. Thcsc stands will, become stagnant with mortality of ~nd~viduals increasing a s stacking increases over 100 percent.
UndersrockeUtunds 0 to 60 percent stocked with grow- ~ng-atocktrces. These stands wlll tske avcry long time to reach fullstocking. Meanwhile.powrbolcfm wiUresult, and much ofthe productivity will be placed on heavy limbs instead of on thc bole.
Tme Clwses
Commef'clal species-'kc species currently or ptentially suitable for indutrial wood pdvcts.
Cull ;me-Reugh or rotten tms. Gmwing-stock tne-Living trees of commcrc~rl species
clusstfjed as sawumber, polctirnber, saplings. nnd peedlings. Trees must contain at least one 12-foot or two 8-foot logsin thc sawlcg ponioncumritly or potentially (if toosmall to q~lelify) tobcclassed as ymwmg stock. Thelag(s)mustmeet dirncnsion and merchantability standards toqualify. Trees must also hava
currently or potentidly one-third of the gross board-fwt vol- ume in sound woad.
Hardwmkib-Dicotyldonous trees, usually broad leaved and deciduous.
t l ve tress--All living trees. Included arc all s h e clsssta, dl we classes, and bath cornmmial snd o m m i d spdes .
Noncomerciul species-Tfce species of t p ~ c a l l y small size, p m r form, or inferior qualiq that normally donotdevelop into tms sultable for industtial wvod products.
Rortenrrees-Live trccs of commercial dprcias thrt are Un- merchantable for sawlogs currently or potentidly because of rot deduction in the sawlog secuon See definitionof growing- stock trees.
Rough t r e e s L i v e bws af commercial species that are un- merchantable for sawlogs currently ot potentially because of roughness or poor f m i n the sawlog section. Also includedare all bve trees of noncommercial species. Sccdefri~tion of p o w - ing-stock trces.
Salvablc $pod ; r e e d t a n d i g or d ~ w n c d dead ?n!e that were formerly growing stmk and ancansidered merchantable Trees must be at least 5.0 inches in d b.h. to qudify.
S o f R u a o d ~ n i f t r o u s trees, usually Evergreen, having leaves that are needlcs or scalelike.
Volume
Valumr of cull-The cubic-foot volume of sound w d in mugh androttentrccs ar least 5.0 inchealn d.b.h. from a 1-foor tltump tvaminimum 4.0-inchtvpd.a.b.of thecentral stem or to the point where the central stem breaks into limbs.
VoIu~le ofgrowing s ~ o c L T h e cubic-foot volume of sound wood in growing-stock trees at least 3,O Inches in d b.h, fram a I-foot stump to a minlrnum 4.0-inch top d a b , d the ccntral stem or to the point where Lhc centml stem breaks into limbs.
Volume oftiwe ?recs--Thecubic-foot volumeof sound woad in growing-stock, rough, and rotten trees at least 5 0 inches in d.b h. from a I -fmt stump to a minimum 4.0-inch top d.0.b. of the ccnual stem or to the point where the central stem b& into limbs.
b l u ~ ofsawjog portbn ofsnwn'&? twr~--The cubic- f w t volume of sound wood in Iksswlog m i o n af sawtimber trees. Volume is the net result after deductions for rot, sweep, and othcr defects that affect use for lumber.
Volume of srawtinrbe+The board-fwt volumc (Interns- tionaI IlPinch Rule) of sound wood in the aawlog portion of sawumber trea. Volumc is the net result after deductions for rot, sweep, and other defects that affect use for lumbcr.
Volume of timber-The cubic-fmt volume of swnd w w d in growing-stock, rough, rottell, and salvmble dead trcesat least 5,Oinchts ind.b.h. froma I-foot stump to a minlmum 4.0-inch top d.o.b of rhe central stcrn or to ~ h c point where the central stem breaks into limbs.
Core Tibles 1 through 25
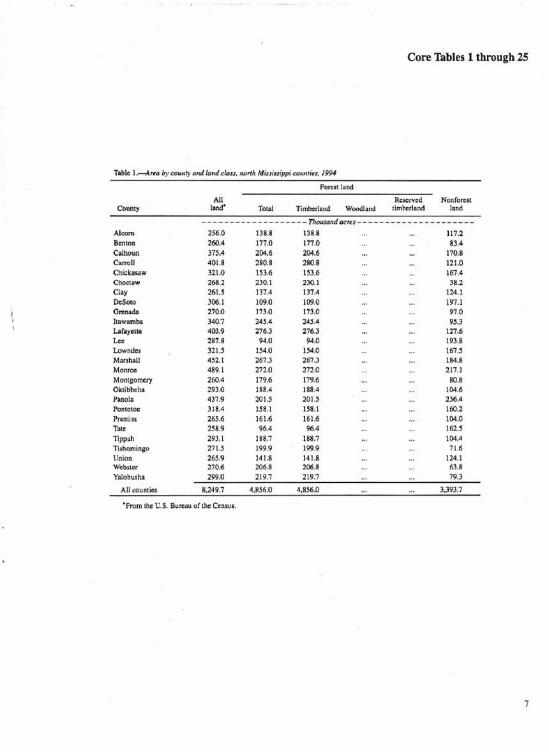
F m # t lmd
All RtatIvtd NonBall W n W land' Talrl Timkflrod W d l a n d timberlad land
- - - - - - - " - - - - - - - - - - - f i w r a n d a c m # - - - - - - - - - - - - - - - - - - - - -
Almm 256.0 138.8 138.8 117.2 Benton 2 m 4 177.0 ITI.0 83.4 Calhoun SEA 2W.6 2W.6 17[1.8 Csrmll dU1.8 280.8 280.8 121.0 Chlekn~w 321d 153.6 153.6 h67.6 C b c t a w 268.2 230.1 230.1 38.2 CLny 261.5 137.4 137.4 BU.1 IkSwr 306.1 109.0 109.0 19'7.1 art d m 270.0 773.0 173,O V.0 Itswamba 3437 245.4 245.4 95.3 Lafayelm 4W.9 276.3 2.76.3 127.6 Lct 287.8 94.0 94.0 193.8 h d e s , 321.5 154.0 154.0 167.5 Marshall 452.1 267.3 37.3 184.8 M n a m 489 1 232 0 272 0 217.1 Mnnlpome~ 760.4 179.6 179.6 80.8 Oktibbrha 2g3.0 188.4 1BB.d 1W.b Panolu 437.9 201.5 201.5 236.4 P e o ~ o ~ o c 318.4 158.1 158.1 160.2 Remiss 2a.6 161.6 161.6 1WB T ~ I E 258.9 96.4 96.4 161.3 Tlppnh 293.1 188.7 188.7 1W.4 Tlshominpo 271.5 1999 1499 71 6 Union 165.9 341.8 141.8 124.1 Wbsm 210,6 l d b S 266.8 63.8 Yfilobushs 799.0 219.7 219.7 79.3
A l l caun~its E.2A9.7 4,856.0 4,836.0 ... 3.393.7
'From tha U.S. Bureau ofthc Ccnsus.

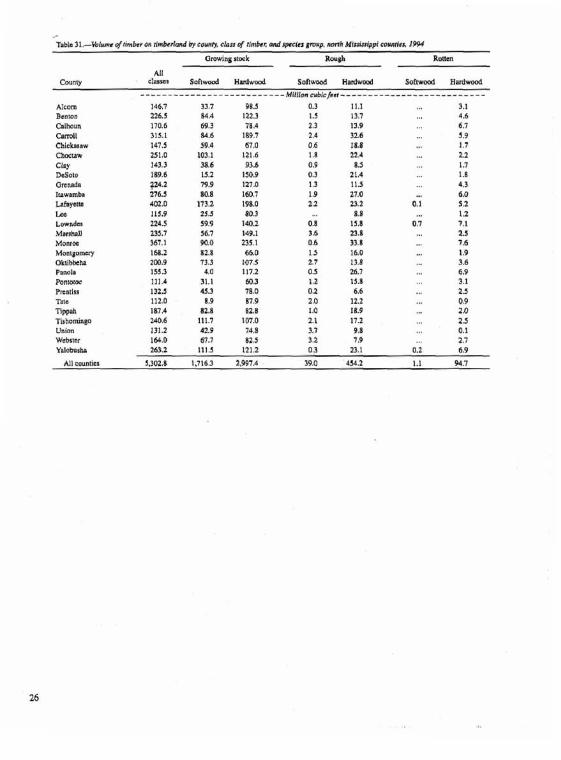
n b l c AM 6fllmbe&d by eowrty undmvrtanhig class, narh MhJbJippi cbumtrr, I994
AU N a t l d Mlac. Cnunry and h C CwW ownenhipa forest ftdcnl Slate municipal induray' P m s r carparatst t d i v l d u ~ l ~
Websler M6.S 81.3 59,l 7.4 59.1 Yd~buha 219.7 211.0 38.8 5.5 16.6 105.d 5.5 27.1
AII cmn*s a ~ 5 6 . 0 186.9 213.7 19.8 14.6 6ma 1,235.6 208.5 2,366.1
Table 3 . 4 ~ ~ ofdnbsrlandbywmry arrdfimxl@pegmup nonk Mtfflrdp~ wunrias, I9W
Fonsr rjqe grwp
lablolly-shonlcsf a h a
A l c m Bcnton Cslholln Ganall Chickss~w Choctaw Clay Dcsato Grsnada Itnwrmba
Lafayettc Lcc Lowndes Mnrshall Monmc Mmtgomuy Dktlbbeha h n ~ l a

l l b h 3 . 4 ~ of~lmbedmdby cwnrp u n d j % m ~ ~ ~ p d g r w p mrrh Mialsxlpgl m l l c s , I 9 C a r t l n u d
Pmst @p p u p
LObblly~ShwtlPaf P C
Oak- dnk- bak-pm Elm-asC C m l y T a l Plaalsd Nsasal pine hlfliary cypm~ cortanwod
- - - - - - - - " - - - - - - - - - - - - - - - - - - - - " - ~ ~ ~ m d B C w d - - - - - - - - - - - - - - - - - - - - - - - - - " - - - - -
P D O ~ I D C 158.1 39,4 6.2 18.1 16.8 5 , ~ Prtndas , 161.6 26.1 15.6 41,7 67.8 10.4 Tst. 96.4 7.4 66.8 22.3
T~PW 188.7 33.6 14,3 23.8 93A 19.1 4.8 Tishominpo 199.9 Zb.6 a0.0 40.0 93.3 20.0 Uni4n 141.8 36.2 36.2 60.4 9,O Wbstm 206.8 11 8.2 7,4 14.8 665 \latoburha 219.7 27.7 11.1 53.8 s . 3 n.7
All EOUIIIIII 4656.0 783.4 353.9 794.8 2.177.0 716.1 M.9
All Sapling- Nmmcktd Cowry c l s w ~ Sawdmkr P o l e h k seedlie# ~ r - 1
Alcorn Bmwn W o u n Wll Ch~ckaaaw Choctsw Clay DCSdLa ortnsda Itawamba LaPaysrts Loo Lnwndts Marshall Msmr M o n t p ~ q ~ Okubkhn P k n ~ l a , Pontblac
PrenUBS Taw
mesk nshorn~ngo Union WSb6W Yalohush
Al l wunticl

~ a b h 5 . 4 r a o a,frl~n$rrlmrd by cawrr). mdrin clars. mrlh Misrbippl coumrlrr, 1PVd
Slm Class (Cvbicfcrf /uc~rJ AU
County cIas5es r l6S 12b165 85-120 5C-85 4 0 ------ Thoym"dbEI(9 ---------- "-- - - 2 - - - - - -
Alcam Bentmi Calhwn Cam11 Chl~ksleW Rroctaw n a y DeSom Orenada Iqrwambn Ldayelk Lcs Lorvpdcs
Marshall M*lornt MontgQmcry Oktibkdha Paoola Ponsto~ Pnnllls mte Tippnh Ttshomlngo Wn~on Wcbsfu
Table 6-- -Am ofrrir~krrla~rd by eazmq- mndrtockhrg chm dgmwltw-nork ~raaa. vonll Ml~sl~slppl muntiax, 15?W
S10ckng dd(l (PdM6111>
All Counly EI~I=I >I30 1W-130 -100 1 6 . 7 4 <16.1
- - - - - - - - - - - - - - - - - - - - - - - n , p ~ m , d ~ c ~ * - - - - - - - - - ~ - - - - - - - - - - - - -
Alcarn 138.8 39.7 69.4 28.7 Btnm 177.0 31.4 71.7 663 6-7 Cslhmn W , 6 14.8 1D1.3 57.6 Cnml l 280.8 59.1 155.2 31.7 14.8 Chickrrsw 153.6 10.7 82.7 50.1 10,i C b a l n w 23U.1 26.8 133.1 70.1 C h y 137.4 5.0 23.9 65.7 35.8 6.0 DeSolo t UP .O 9.1 81.6 18.2 Grcnnh 173.0 6.7 9 . P 93 2 1 3 3 Iuwambe 245 4 5.2 83.6 lIH7 41.8 5. i Ldayette 276.3 52.0 156.8 65.6 Lcc 94.0 18.8 47.0 28.2 Lwvedcr 154.0 6.4 32.1 102.7 12.8 Mmrshall 257.3 14.7 18.5 103.3 I0E.7 22.1 M o n m 271.0 12.4 31.1 173.1 49.5 Mootkdnlery 179.6 6.2 37.1 103.3 24.8 62 Oktibbchn 188.4 4.4 35.0 1W.6 39,d Ponoln Z(J1.5 91.6 82.4 27.5 Pbntoroc 158 1 28.7 73.2 45.0 11.3 Prcniiss 161.6 31,3 114.7 15.6

Tut 96.4 1A 37.1 44.5. ?,4 Kpp& 188.7 , 9.5 33A 79.1 a0 4,8 nshomiap 199.9 m.0 126.6 26.6 6.7 Union ldl,B 27.1 69.5 45.2 Webam 206.8 14.8 66.5 110.8 14.8
'tsblt 7.--AM of l l m k h d b y f m a wypr and m r h l p cla~z, nonh M l # s l ~ x l ~ I COW?IE#, J9W
Qmm AU Katlwral (khef Fcrssl mdustry- 0 t h ~
hrea typc owncrotupa fmn public indusuy l a ~ s n d privatt
- ------------ - - ---------- ~ h o ~ m , ~ a c m -- - - - ----------
-
Srblklng dsss (Percent) Ownership All
class classsa r 130 1W-130 60-1M 16.744 <lbd - - - - - - - - - - - - . - - - - - - - - - - b m R d B p m f - - - - - - - - - u - - - - - - - - - - - - - -
~arirnd IWCII 186s 54.5 114.0 163 2.1 Other pvbflc 236.1 56.6 106.4 51.7 43.5 FWosl induuy 561.9 17,O 1482 315.9 80.7 mat indus~4celed 39.0 6.2 5.7 27.1 , , ~
0 t h p r i n t 1,810.2 63,O 63.3 2.028.8 971.8 112.2
Al l ownerships 4,856 0 8 6 1 899.2 L392.2 1,120.4 157.9

Tablr 9.-Am of llmbrrla~rd byprrsr a d zt0rerrdai.a c l a ~ , north Mimi-ippt tdunfla, 1994
Stand-sim clela Al l Snpllng- Nwrb~kcd
Fmst t y p c t a a m Sawdmkr Poldmbsr aeedling UCBB
- - - - - - - - - - - - - - - - - - - 2 - - - - - - - ~ m m d a C m J - - - - - - - - - - a - - - - - - - - - -
bblelly+honlcaf pint 1.137.2 336.2 275.5 au.5
Table Il),-,4~~11bcrafliva trsrr M thrrberlond by sp&lda a~ddanaler d m , rnanh MJzsls#/pp~ mwnrisa. 3924
D i a m s r clnss (Iirchas a/ bmast h e i g k )
AU 1 3.C 5 , 7& 9.0- 1 l . b 19 ,s IS,& 17,& 19,@ 7.l.b s w s classes 2.9 4.9 6.9 E.9 10.9 12.9 14.9 169 IL.9 20.9 28.9 229.0
- - - - - - - - - - - - - - - - - - - - - - - - - - - - - - - T h o w 9 e , ~ f m p r - - - - - - - - - - - - - - - - - - - - - - - - - - - - - - -
Longlcaf~lashpinc~ 1.670 dl1 ... 110 199 71 90 ... ... -.. Sbrtlcel-loblolly~mss 529.135 224754 129.807 Em273 43.218 21.526 14563 7,269 4,342 1.671 9W 584 23
Taa l aonwwis 618J66 977,305 lSl,BE? 88.211 46947 22,996 13,511 7PP4 4,706 1,730 966 616 do
Stlert while asks 117.678 W.2M 27276 l 1 . W 6,372 3,588 L675 2,062 1.727 1,094 573 681 dS Selm red ankg O ~ h c r whlb o a h OLhu rsd D U ~
ETickary Hard m q l c Soh rnaplc Bprch S w l g u m T u p t l ~ b l n c k ~ u m A911
Cmwnwwd-sspa Basswmd YcllrJw+plel ~locl : wllnut Qlhor h s r d w d s
i'blnl h a r d 4

Taul aolwcda
Solm white oak0 Sthccr red elks 0th whik mks Other red o a b Hickmy Hard maplc soa mplt Beech Swsagum Tupclc-blnckgum Ash CmttomwBapcn Barswaod Ycllow-poplor Blnck walnut o w h a r d W
Tmalhsrdwmd~ 8M.569 384.003 159.155 la3581 54,892 37,791 24.91% 16,923 10,886 5.M 3,2M 3.678 392
All rpsics 1,341,793 blf.97d 189.1k9 181.162 101,016 59,9U 39.988 24,338 15,537 7.WO d,2W 6,255 418
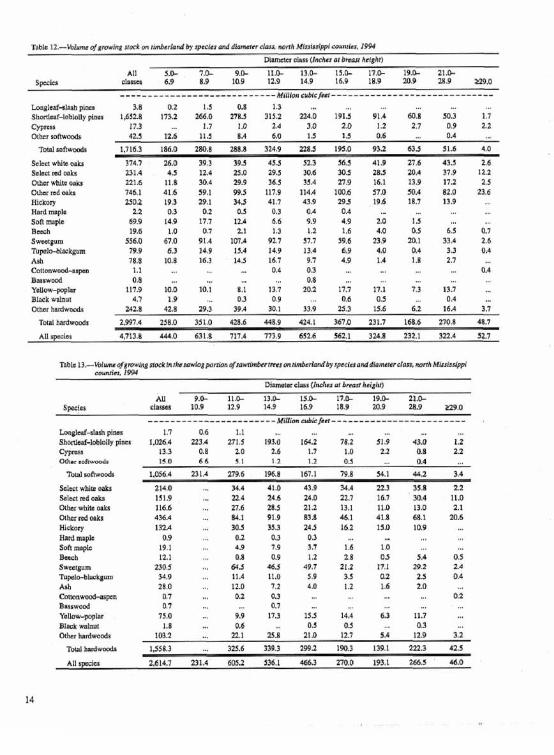
All 5 . h 9 I1.k 1 1 5 17,s 19.0- 1l.b s w ~laasta 6.9 . 1119 129 I d 9 16.9 18.9 209 1B.B S9.0
---------------------------- M'l11~ &fcJw I - - - - - - - - - - - - - - - - - - - - - - - - - - - - -
Langleaf+la$h phms 3.8 0.2 1.5 0.8 13 ... $hrtlcaf-l&ldy k . 8 i,632.8 1732 266.0 271.5 319 2 226.0 1915 91A MI a 50.3 1.7 Cypnss 17.3 ... 1.7 1.0 2 4 3 0 20 1 2 2.7 0.9 2 2 Other soltvroa 4 2 3 12.6 11.5 8.4 60 1,5 1.5 0.6 ., OA
--
'ME~ mffwmd~ 16.3 196.D 2W.8 288.8 3a4.9 2 8 . 5 195.0 932 63.5 $ 6 4.0
Stltct whlto oskr 374.7 26.0 39.3 39.5 43.5 523 56.5 4 27.6 43.5 2.6 Sel tc~ d edaaks 231.4 4.5 12.4 2 5 0 2.9.5 30.6 M.3 16.5 2QP 37.9 12.2 O h r rhlm o a k O t k d b B k b Hlckwy Hard m p l u sofl mpk Be& s w m 7 7 I p e l e k g u m Ash C o t t m ~ s p e e Bssswwd Yallpli& Bhck walnut Othcr hsrdwmdp
Tatsl hadwods ZW1.4 258.0 351.0 428.6 448.9 424.1 367.0 211.7 16B.6 270.8 48.7
A l l p a c k s 4,713.8 4MO 631.8 717.4 7739 652.6 562.1 324.8 232.1 322.4 52.7
Mnnw!ar class IIwhw a1 bmmr haiebrl
Lmplcai-da~h p l n ~ s Shwllaaf-lobhlly p i m
CYPMS Othsr sof*vm&
Tom! m s
Wed while & %lea fed o h Other whte &a other ncd D&s
HLckory Had mqls SaR mspk Bec.c!l Swcelgum Tupelo-blackgum Aeh C M m n w o ~ n Rmswad Yehw-poplar lack wglmr 1.8 ... 0.6 , 0.5 (1.5 ... 0.3 Oth~thardurods 13932 ... 22.1 25.8 21.0 12.7 5 4 12.9 3.2
Tpral hard- 1,558.3 ... 325.6 339.3 299.1 190.3 139.1 222.3 425
All apsars 2,614.9 231A 6053 536.1 46h3 270.0 193.1 a665 4b.b

hpkal-alm6h p l m S h m h - l o b l d l y plnu CyprcPS Other s o w s
Taal mirwmda
Stkcl whlle w h s Smlnctdoatr D l k white o h 0 t h d d~ks Uicknry Wsrd mlple Son maple Beech Swrcrpum nlp~bbhCkgUm h h CMmnwxd-aem B a a 4 Y&W-pap1nr Black wdnut Other h o d 4
Totat hadwoods
AUspeCltS

Tabk l?.-l$lurns ofsmwlng mckmd mwfimbar om timberland by W W mdapscrer g ~ , Rarrh hf!~~idslpplwwriss, IPM G r d g mrck Sawtimber
Sofiwwd Hmrdwmd , SalPwod W d P;m PLM
All All County rp~cjes W c d Nalural O k soh* !idt speclss Plamsd NaluraI O W S& Hardt
-- - ,J,fil[im --- - -- - --- - - - - ---- -- - --- - M i l h n h r d f d --- --- ------A A h r e 132.3 7.1 3.9 1.8 22,l 76.4 417.9 17.2 93.9 7.0 50,s 249.2 Benton MS.? 5 . 8 31.5 1.1 'X.3 94.0 745.9 ZM.9 151.2 1.B 76,2 310.8 C&wn 1 4 51.6 I 2 5 22.8 52.6 379.6 146.1 523 6.3 37.6 137.3 Cmnll 274.3 20.6 58.9 5.0 71,l 118.b 9'76.4 49.4 265.3 13.4 184.8 663.7 Chlckasnw 1265 I 42.7 1.1 19.7 47.4 4462 53.1 2 1 6 1 1.3 33,P 141.7 Choclsv 224.7 235 '17.7 1.8 43.0 78.7 833.2 124.0 359.9 9.2 86.8 259.4
132.2 0.7 37.6 0.3 26.2 67.4 475.3 1.6 158.8 73.1 241,s BeSm 166.1 , 14,6 0.6 562 S4.6 648.0 ... 30.1 2.8 213.0 &2,1 are- 2M.9 32.9 43.8 1.2 49.7 77.4 728.8 129.11 117.1 19 123.1 2845 lmwnmba 241.5 30.B 48.6 1.4 65.2 95.5 7W.O 105.6 213.2 8.1 1313 319.7 Lsfapttc 371.3 2.8 j66.D 45 56A 141.6 1P54.3 7.5 7a.2 l i d 7 5M.3 Let 105.8 ... 35.3 Q.3 XJA 5P.P 413.1 ... 125.5 ... 421 245.4 LOmdes MO.1 214 33.3 5.2 , 56.0 84.2 750.4 77.1 1855 28.8 141.5 317.6 Marshall 205.8 1 13.9 1.6 78.4 m'l 736.4 160.8 34A 11.6 271.7 2579 M a m 325.1 38.4 30.5 1.2 62.0 153.0 1.1159 56.2 274.1 4.5 206.3 574.8 M O ~ ~ ~ W ~ 148.8 12.2 ss.2 la 28.0 38.0 423.4 2.2 236.9 2 3 5 7 tmx OhlhMaha 180.7 15.9 112.2 5.3 26.6 80.9 657.5 36.6 U4.7 6.6 88.1 289.7 Pnn& 1 Z t . l ... 1.7 2.2 5a.l 63.0 368.4 Ed 7.0 171.6 l8 lA Ponlmm 91.3 9 3 19.1 2,7 22,d 37.8 201.0 l a 8 BZ.6 2,9 27.6 77.1 Pmtibc 123.3 8.0 33.9 2.6 29.1 , 48.9 3LF4.2 11.3 129.0 5.2 62.3 187.5 h t c 96.8 ... 6.2 2.9 32.0 55.1 338.7 29.1 13.7 1W.6 191,3 T1pw.h 165.6 94.6 28.0 0.2 221 60.8 479.6 142.4 71.7 ... 59.1 m.1 nshomiup 21B.7 51.7 59.2 0,s 3 71.6 731.1 202.3 235.6 2 3 84.4 2063 Union 117.7 7-3 3 d 4 l d 45.4 29.3 4182 5.2 159.0 ... 161.3 427 Wcbser 150.1 39.7 26.4 1.6 155 66.9 379.3 31.1 115.7 62 40.3 1 S . s Yalobusbo 232.7 64.9 4 3 0 2.6 3.4 81.7 864.5 917.6 161.5 35 993 282.7
AllcwnUcs 4.713.5 596.8 1.059.8 59.7 1,051.6 1.9459 16156.5 1.hM.1 4.632.1 134.9 2757.8 A717.6
'Hardwocd sprcicl wllh an a- lpzcjfic gr5vil)l of 0.50 ~ I C B I such 81 turns. yel lw-pph, C l t~nwmds, red mplc, bowword& aspeas, and willows kardwsd species with an svcrdgs spscitic grsdly paurthnn 0.50 lueh ar oaks. hard maples, hickdes, and green and whik ask.

Sawtlmbcr m r Swlbg paninn 2,614.7 304.6 7 1 8 8 28.3 4 1 . 6 l.D95,7 Upper stsm @on 594.6 61.2 116.3 5.6 11 6.4 265.2
TOM 3jw.3 3m.9 844.7 33.9 579.0 1,300.P
Pddrnbm mes IJMd 225.9 215.1 25.8 472.6 564.9
All p i n g - s t m k me6 4,713.8 396.3 1.D59.S 59.7 1,051.6 1.945.9 hUgh UCt6
All c l W I 5.3362 610% 1.LIB90 74.3 13d93 2,312.8
'Hardwobd sptcltswrthan awagtapc iRfgruvr rydD 50mIcsc !ueh nagums. y s l b w - ~ p h r , ~ n m o o d s , r o d m m p k basswds , aspros, and willova
' ~ a r d w r n d species w ~ t h an nvtrnge speuficgrmrily grtarcr lm 0 50 such a9 onb, hmd maples, hiclrwjc~, sad ree en and whiu wh
TBbIt 17-Wum~ d l im msa arrdgmwiw neck on rlm8rrland by pwnarahlp class and s p i c z gmup, rmrth M&~kr;ppi carrrtllss, 39W
Uve trees Growing stmk
Softwwd Hardwmd 3 o h ~ Hsfdwpod
Pine Pins
A'! All OwnoRhi~ clsls sprclos ~ lanrcd h.mrsl C&S Soh* ~mrdt S W ~ C ~ A m ~ t d Marural 0th Soft' . H d t - -- -- -- - - - - -- - - -- - --- - - - - - -- - - - , + f ( I 1 , ~ CYbtFJcc, - - - - -- --- - - -- -- - - -- --- - -- --- Nmlimal mresl 370.6 43.6 113.2 1.6 6 , 1 5 6 343.5 42.9 112.3 1,6 49.6 137.0 0 t h public 135.3 21.3 42.6 7.9 116.3 141.2 298.5 11.3 41.6 6.7 100.7 128.2 F& iedu~lry 519.7 225.9 77.2 6.8 81.3 128.5 576.9 222.9 73.7 6.1 69.7 102.4 Parex lndustfy-lca$€d 40.8 16.5 105 , 5.9 8.0 37.9 1 10.5 ... 4.1 6.7 Dmpr privat. 4.0361 300.2 B34P 54.7 9S3o 1,864.1 3.557.1 293.2 81P3 45.2 827.3 1,571.5
All awncrships 5.3U2.8 €474 1,0779 71.1 1243.0 2,903.4 4.713.8 546.8 1.059.8 5 . 7 1.051.6 1.945.9
'Hardwood spenaP uilh 8n aXtr1ga 8pccoAc eravity of D 50 or loso mh pump )ellow-poplar, waronwoods. d msplc. bas~wood6. upens, o n d ~ r l l o u ~ '~srdnoad sprc.cs aorn m awmde spccrr.cgn\rry grcavm h n 0 50 s ~ c h arasrs. h a d maple, n.ckbne%.andgrsenand uhirc meh

All All Cwnly sp~c~cs Plaamd Nmlurpl m)thrr Soft' ~ s r d t speelns PlanLcd Natural Mkcr Soft' ~ . r d t
- ---------- -h'f[l,o., c " b ~ f M - - --- -- ---- ----------- M l l h &dfi*t ----- --- ---- Alem 7.5 1,1 1.E . 1.2 3.3 27.4 3.6 7.d 0.3 3A 126 Emton 12.9 4.6 1.9 0.1 1.6 4.2 57.8 24.7 9.4 4.2 5.7 S8,l Cnlhoun 9.8 3.5 0.9 4 , 1.9 1.5 31,4 1 9 4.8 4 1 5.8 3.6 Carroll 13.5' 1 9 A9 0.3 3.1 3.5 53.7 4.8 2 2 7 1,D 1R7 14.4 Chickasaw d.5 2.9 3.1 ... 0.S 1.7 34.3 7 3 17.5 0.1 4.4 52 Chocfaw 13.1 2.7 5.3 0.2 2.9 2.5 58.6 10.8 315 0.2 5.7 95 Clay 10.1 ... 2.4 ... 1.4 6.3 41.3 ... Ion ... 43 26.9 P=$OtO 4.0 1.1 03 ... 1.3 2.1 15.2 1.6 1.7 ... 4.9 7.0 armada 15.5 4.4 4.1 ... 2.1 4.9 7 11.2 27.1 hZ 6.7 15.3 Ilswmba 13.1 3.1 3.4 ... 2 5 4.0 51.5 11.1 18.5 ... b.0 1 7 3 Lafsycla 21.6 3.1 10.5 0,a LO 3.8 lm.9 M.8 H.9 0,s 5.3 m,l LBe 11,6 2.7 2,4 0.1 2.6 3.9 48.9 14.0 12.1 .. 4.7 1B.O Luwndta 9.0 1A 1.4 I 2.7 3,6 35.6 3.2 8.B 4.7 5.9 14.3 M h a l l 13d 2.7 0.6 0.8 5.7 5.7 55.0 11.9 4 . 1 8 7 28.6 13.8 n m n 5 .5 4.1 1.7 ... 3,4 63 5 9 3 6.1 104 0.5 I . 3&6 Mentgomrry 8.0 1.9 2.9 0.1 1.8 1 2 17,2 0.3 14.4 a 1 3.9 -1.6 Oktibbtkd 9.4 1.2 4.1 0.5 1 2 2.2 38.3 3,6 24.6 GI 3.1 6.5 Pnnola 5,1 3.0 ... ... 0.7 IA 21,s 12.6 . 0.4 1.9 6.7 PonMloc 9.9 2.6 2.3 0.2 2.3 2.1 23.1 1.0 10.5 D.2 1 7.3 Plsntrgb 8.6 1.6 2.5 ... 1.2 3.2 35.9 2.7 12.9 0 . 7 6.2 153 Tnk 3.1 0.2 4.5 0.3 0.7 2,9 16.1 2.2 4 2,2 2.7 99 T ~ P P ~ 9.3 4.9 2.6 0.3 1.5 31.5 1 2 8.9 .,. 3.0 7.5 Thhamingo 11.3 a2 4.3 0.1 1.3 35 5h3 14.7 23.3 0.1 0.9 11.3 Unim 6.9 1.3 2.0 ... 2.0 1.6 36.9 1.0 13.9 ... 13.2 8.8 Webam 13.1 6.3 0.9 ... 1.7 4.1 29.2 3.0 6.3 6.1 4.1 13.6 Yalobusha 16.7 5.0 5.5 0,s 2.2 3.9 a.3 25.4 246 0.2 6.7 11.4
~ l l munties 261.1 71.7 71.8 2.9 0 &3 1, lM. l 240.3 376.6 7.5 155.8 922.9
'Hardwmd apdm wirhan a m p sgeciiic pvi t ) mFD.50or lrsr bsgums, y d w - p p l a r , OManmds, nd rnapb?.bkgwaods. arprmk and wlllaws. f~ardumad apeetas w i h an avemgs specific gravity gram than 0 5 0 fueh ar W hd maw, Mclmdos, mud g w and whlte nsh.

Gmwbng rtock Snwlimkr
Sofrwwd Berdwmd SoRrmd B a r d d
Rnr Pine
All All County m Plantd N e m t Mhs $offq ~ardt Plehtd N e W 0 t h SaPI' Hmd
A 1 c m Bcnfan Calhman Carmll Chickma Chpctaw
Clay D e S m Gmadu Ifewamba Lataystto Lac Lwmdss Mnrshsll Mmme
M~ntkormay OLnihbehn Parwla POnmtOC
R c d ~ Tam
'lishemiago Unlon Wsbstsr Yelobush
All ~rmnticr
'Hnrd*md spt t tr w.tbaa A\mgsspeclflcgra\lryof 050 wlaasrucb a p g ~ m s , y c l l a u - p p h a r f t o n w d r , rcd maple. bassroods,aspsna and wJows. ' ~ a m w d Species nlhan w e r a g spec.0~ gra\ll) groamrhan 0 50 s r h ss d s . hard maples, hlckorlea, snd p n aoa w h ~ o s s b .
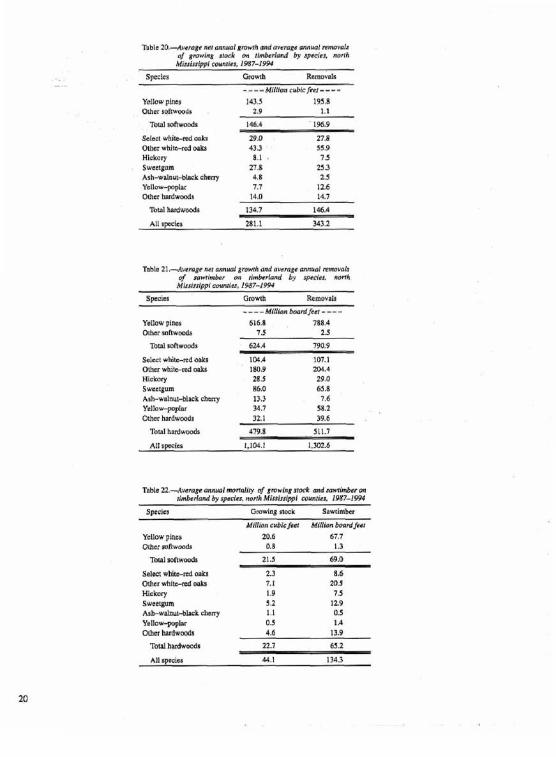
Table 20 -4wmgc nst m o ~ l g w l h and ovsnqa mnual rrnmvulx a.t gnnvilrg s!dR on llmberlnnd by waelt, nonh M i a ~ i r r l p p l c w P e ~ , 1987-I3W
Species Gmwth Rbnwsls
---- Mlllbn cubw frel----
Yellow p i m 143 5 193.8 Ohcr ~ofruar& 2 9 1 1
All a& 281.1. 343.2 .
a b l e 21 d w w g r ant d g m f h and ousrags mnwl r p d of fawtlmhr M rlrtrbrdud by @elf$ bsrrk
YISIIsslppl rnMnlW$, 198s-1594
Speclel Gmwth Ekmwnls
----M~llmbwrdjxt----
Yellow p ~ m 6168 788 6 Othcr~wmd.3 7 5 2 9
mml rs~waads 624.4 790 9
S&t w h i w d abks IMA lW.l Othw wtubrcd &s 1W 9 2WA H~ckary 28 5 29 0 Swetwm 860 65 8 A s ~ w a l n u W chcrry 13 3 7 6 Yelbw-poplnr 34 7 58 2 Oher hrdwwds 32.1 311 6
T o t l l ~ w o d 479 8 511.7
All spats 1,104 1 1.3m.6
Specior Grnwlrlg stock Sawlimber
Million cMlc feet Million bwrdfiet
YcLlow a i m 20.6 67.7
Selsct whire-red asks 2.3 8.6 Othu white-ml &s 7- 1 20.5 KcIielmry 1.9 7.5 Swee ylum 5.1 12.9 A ~ ~ w ~ u ~ c k r r j l , i (15 Y t l l o ~ l a r 0,5 1A Other hardwds 46 13.9
TMal hardwmh 22.7 63.2
A l l SF+& 44.1 134.3
-- - -
Gmwth Rmwmls
S o f r w d Hardwwd SaPlwood Hsrdwod
Fhe Piot
AU - AU Ownership clmls rpeia. Planted Natural Other Soh' nard7 w i e a ' mke~rd N P M % Snff Had?
-- - - - -- - -- - -- - - - - - -- - -- - - L y{i{Im &fC,&, --- - - - - - -- - -- -- - - -- - -- - - - - 2- - - Nm8ond MI! 11.3 2J 4.9 ,.. 0.6 3 1 . , 7.8 0.4 5.4 ... 0.4 1.7 -%CC public 8.7 0.9 2.8 4 2.5 2.0 7.9 0.6 4.4 0.5 1.2 12 Fdttll induslry 38.3 23.3 6.4 0.5 4.2 5.0 444 17.5 15.4 0.1 5.2 6.2 Fmcsl irdusvy-I~amd 2.0 LO 0.1 ... ' 0.2 D.4 "., ... ,.. .,, ,,, Otherpivat. , 220.0 43.9 9 . 6 2.0 43.0 33.5 203.1 53.4 90.6 0.6 44.7 85.8
All mvnvrships 281.1 71.7 7 2.9 50.5 84.3 383.2 71.9 123.9 1.1 5 M.9
'Hadmad mcies wlth I n avarqr s p i t i c gravly olO.50 ae l e s auch ax g u m , yrllow-pplar, emnwoodr , rcd rosplt. b # m & nopnl, d w l l b w s . f ~ s r d w o d s p i e s wlfh on avorags n p i h gravity gmter than 0 SO such ar oaks, hsrd maplcr, hickories, and gcccn and while aah. . . . .. .,.
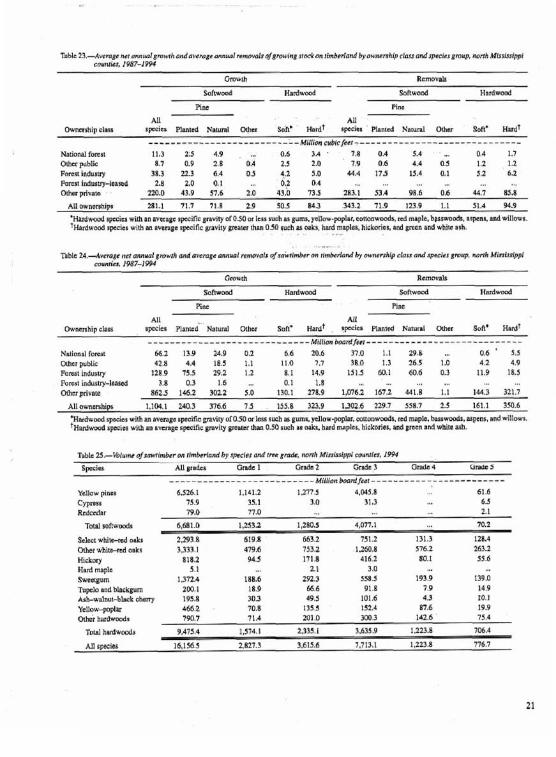
. Tablc 24.4vsmg. net mnuol gmwh md e n q s m u a l mmm& pla&mBer on tlmbcrlond by o w r x l r l p clors ond amcler gmw, mrth Mla~kxlppl
munfisj, 1987-1W
All All Ow-ipdass , spaeln mnad' Noturd othm SM' ~ a i - d ~ . ?pica PlanDad Nahlral m r r Soh' hrdt
----------------------------- M i i l d r n h M f ~ ,-------------- -------------- Ndlmrl forest M.2 13.9 249 0.2 6.6 20.6 37a 1 29.8 ... 06 ' 5.5 Other public 42.8 4.4 1 . 5 1.1 11.0 1.7 0 1.3 265 1.0 4.2 49 FOM i n d u m ~ 128.9 7 5 29.2 1.2 8.1 14.9 151.5 60.1 60.6 0.3 11.9 18.5
All a w d i p 1.1M.l 264.3 376.6 7.5 . 165.8 33.9 1,302.6 219.7 55S.7 2.5 161.1 350.6
' H a d u m d sp- w l f i an avmgs 6pccif.c grariiy of OSO or hs r lch as gums. ycllou.paplar, muonwds, dmaplc , bss~wwda. lspcns and u ? l l w ~ '~ard6rndrpcc.cs rrrhan stcragcspecik grav19 p a t c r h a n 050 m:h as Mks. h a d maplca. hitkaoes and prccn a n d u h sash
Tnbk ZS.-Volvmc o f s m l ~ r n h r an rlmbedaad by W e r dim gmds, mnh hf*bl~~rssippl cuunlh~, I994 Spcdes All grm8cs Grdc 1 Grade 2 Grdc 3 Gradc 4 bra* 5
Y&w plnts C yprcss Rcdcrdnr
Tual soft-
S& wtrlte-d & M h c r w h ~ w e d asks
Hlckw Hard mnplo Sweaprn Tuph mud bl~ckgurn Ash-walnut-black ekmy Yellow-pap1ar Other hadwrvpodl
All apcc(es

Supplemental Tables 26 through 44
Table 26.-.Awa nfr imbsrhd by ffurtd a&a.Jora#l ryps gmw and sand origin, north Mivl#fl& rountler, T9M
Plnt w e e Other h a r d w d i p s
Slsnd age clmss Plaoled Naturml PLMrcd N u t d Plantrd Nmwd
h b 1 -------------------------- 'TRaum&oc*~ - --. -- -- --- -- - -- - --- --- -- - 1-10 4i3A 4.4 S2,l 19.0 86.9 ' 72.8
11-2m 174.4 17.1 28.9 1 2 6 6 4 21-30 35.2 11.7 3 1 4 0 63.0 6.7 41-50 a,2 >M 1.9
Table 27 - I $ l w e qfmfhumd gwhg $rock on tirnbwlmdb c ~ u o l y and fumt type y w v , ndrrh M*~flxlppl ewrvks, I9W
Fmal type group
Loi~blly-shrmltnI PLW
m- Oak- m-em- Blm-nsc County Tom1 Planred Nn~ural pine hickory ~ y p 1 ~ 8 1 m u o n M
- - - - - - - - - - - - - - - - - - - - - - - - - - - - - - - . W l / / ( P - - - - - - - - - - - A l c m 9.7 7 , l 7.9 7.3 10.6 0.9 Bmtm 84A 42.3 10.6 242 1.1 Calhmm 69.3 44.8 9.8 14,7 Carmu 84.6 13.1 14.c 26.6 27.4 9.0 Chicksssw 59.4 13.6 30.1 12.1 1 .? [Ihoctaw 103.1 23.4 34.3 27.9 173 Clsy 38.6 0.7 30.9 4.9 2.6 DCSulO 15.2 1Q.3 4.9 Grcnsda 79.9 32.9 6.8 26.3 13.5 0.3 Imw-h B0.E 18.7 23 7 17 2 9.1 I1 Lafaycttc ' 173.2 99,2 50.7 21.0 24 L.cE- X.5 23.2 2.3 Lowndcs 599 19.0 0.2 23.4 0.4 lb,4 OA Marshall 56.7 n.8 2 3 14.6 5.& 5,2 I~ ID~W W.D 32.9 a03 30.7 13.2 2.8 Mmlgmlay 82.8 12,2 36.0 23.1 10.8 Oktibbcha 73.3 14.9 21 .O 26.1 10.5 0.B h n o h 4.0 0.2 2.6 1 3 ~ o n m m 31.1 9.3 3.0 11.5 7.2 Prentlss 45.3 11.0 ih7 15.5 8.1 Tetc 8,P 1.0 7.9 Trppah 87.8 54.4 14.4 4.9 8.6 0.7 nshmningo 111.7 4B.1 16.6 25.6 1B.E 2 6 Union 42.9 1.5 17,4 18.1 Wcbsltr 67 7 39.1 12.5 102 5.9 Ytlobusha 1113 43 9 2J.6 25.5 11.5 0.2
AII C Q U M ~ . 1,716.3 535.7 4 0 6 , ~ 4 7 1 ~ 164.2 38,$ a4

Alcom 9L.3 0,3 6.0 71.8 11.2 0.3 Btnmn , 122,3 3.5 1.0 U.0 77.9 14,9 Cslhaun 78,4 7.7 10.3 33.5 6.8 Cmrmll 189,7 1.7 14.3 130.8 43.0 Chic- 6Tfl 2.1 17.5 473 C h m w , 1216 Z,P 4.3 21.5 73.3 283 % 93.6 1 D 6.3 0.6 53.1 32D DeSam 150.9 8.8 94.9 47.2 Grenada 127.0 4.2 l7,7 M.7 4 a S llswamba 160.5 1.7 86.2 80.8 '61.0 Lafayetto 198.0 17.1 39.6 121.6 19.8 bo 80.3 0.6 25.8 33.8 20.1 ~ o ~ d o s tm.2 a.7 12.9 1.5 125.1 Msrghall 149.1 3.1 0.5 9,4 Z d d 935 19.6 M o m 233,l 7.5 D.4 24.9 121.3 75.0 M D ~ Q ~ 66.0 0.3 9.1 153 39.0 2 1 oktibbchn 107,s 2.0 125 27.9 35,l Panda 117.2 70.1 47.1 Ponmtw 60.3 0.3 0 1 5.9 53.1 Prcntlas 76.0 1,l 1.4 8.2 46.6 Uld Tare 87.9 0.3 663 22.9 Tippmh 828 2.2 4.4 6.6 58.9 g.6 1.2 flshmingo 107.0 5Ll 7,3 18.6 54,5 25.1 Union 74.8 0.7 135 56.4 4 2 Webslsr 82,S L4 1 ,V 5.7 72.4 Yalobusha 1211 3.5 2.6 lS.6 733 16.1
All eounlies 299TP 50.4 5B.b 362.8 1,714.7 79S.a 15.0

Tmble Z9-Mhr n f m ~ g m w t n g s m d In /he mwhg padon dfrawhmbar rmr PO dmhrhnd by rormlynridfd~ff Wegmufi p . M I ~ d k n ' p p ' rorurrls8.1994
Fomsttypc gmup
Lnblolly-shorrlesf PIM
Oak- D&- Omk- Blm-arh-
A l c m 19.9 3.0 3.9 d.B 7A 0.8 Bmfm 58.1 28.4 5.2 1BA 6.0 Cslhoun 338 , 26.7 4.6 1.7 carnu 52.11 2.0 8.2 21.4 17.9 2.5 Cticka!nw 42.2 9.3 23.2 9.4 0.2 Cho~taw 74.0 17.7 27.0 18.1 11.3 Clay 24.7 0.3 21.4 1.9 1.1 DeSm 3 , l 2.l 3.6 Ortnmda 51.4 21.3 4.3 lS.O 10.5 0,3 I t a w m h 51.6 17.0 14.4 12.1 5.9 1,9 Lafaysttc 123.9 67.9 38.2 15.7 2.1 I== 18.5 17.7 0.8 Lowedm 44.4 128 0,2 11.2 14.0 01 Marshall 34.0 20.9 1.5 5.5 2.8 2.2 Munrrrt 52.6 7.7 9.2 22.9 10.8 2 1 Montgomcn 42.0 0.5 202 14.3 7.1 Oktibbchm 46.0 6.4 125 193 6.1) 0,7 hmla 2.8 1.8 1.1 Ponlota: 15.4 1.7 1.4 0.1 4.2 Prcntirs 243 2.9 4.3 lkq 6.2 Tale 7.0 0.7 6.3 T P P ~ ~ 37.1 25.5 3.7 3.2 4 3 0.2 i3shmningo 72.0 33.2 12.0 12.1 12.9 1.8 Uwian 28.3 1.1 12.3 13.2 Wcbslcr 24.5 6 .0 6.6 8.3 3.6 Yalobustm 72,9 36.9 14.0 12.8 9.2
All counties 1.0.76.4 a5.2 261.2 312.6 177.5 29.7 0.2

WBo amup b b l n l l ~ l e a l
piw O p Oak- Elm-esh
CamW Total ~lantod N a m l P ~ W ~ L Y 'z mtmwma - - - - I - - - - - - - - - - - - - - - - - - - - - - - - - - M i I I i ~ ~ & ~ C & ~ 7 - - - - - - - - - - - - - - - - - - - - - - - - - - - - -
A l c m 50.3 02 2 4 41.7 5.1 01 Bemm 62.5 1,l 12.1 38.2 11.1 Calhm 29.0 2,h 1.9 1B.9 3.5 Carrrm LM.4 0.9 6.8 71.6 24.1 Chickunw 2B.1 1.0 7.6 195 Choctaw 57.4 0 .7 1,s 5,7 38.1 11,5 Cloy 52.1 1.4 01 30.4 19.1 D c h 98.6 5.7 . 56.3 36.7 Grwada 66.7 1.1 6.4 31.2 28.1 Itavnrnbs 73,6 5.1 30.0 W d Lafayam lM.l 57 22,5 685 b4 LCC 48.6 13,s 2 4 3 ~ . a Lowndel 7-72 0.3 6,L 50.8 Marshall 81.8 3.6 0.1 4 5 13.8 57.8 8.0 M o m 126.9 2A 143 67.5 42.6 hlontpmmy 2C1 2.1 3.5 20.1 03 OMbt6ha 60.5 0.3 6.6 1.0 2d.6 R ~ l a 6D.7 33.0 27.6 Ponbtrx 17.8 D.d K1 1.4 l S , P Rcntirils 40.8 0.7 0.2 3.3 23.2 13.3 'h* d9.3 0.3 37.4 11.6 'Ilppeh' 44.9 1.3 1.9 2.9 33.6 5.1 0.2 'Ijshmnjngo 48.5 2.0 B.6 25d 12.6 Union 42.7 5.7 34.0 3.0 W0bVm 38.0 D.7 1 A l.4 33.5 Ynlobusha a.6 2,8 1.a 13,s . 37.4 7.8
bll mudel 1558.3 17.7 21 A 167,4 880.6 4629 8.4
-
anwing dock h s h ~ancn All
Cmnw c l m l S o h d H n & d S o h W HardW SoR- Hardurnad -------------------------- Mltl{on <"bi~fiar - - - -- - - - --- - - - - - -- - -- - - - - -
Alcorn 146.7 33.7 9B.5 0.3 11.1 3.1 B c n m 226.5 84.4 122.3 1.5 13.7 4h Celbun 1'10.6 69.3 78.4 2.3 13.9 611 Cmrmll 315.1 M.6 189.7 1.4 32.6 5.9 Chicbanw 147.5 59.4 67.0 0.6 18.8 1,7 C h ~ u w 251.0 103.1 121.6 1 .B Za A 1.2 Clay 143.3 38.6 93.6 0 9 8.5 1.7 &Soto 119.4 142 150.9 0.3 21.4 1 .8 G m d n 224.2 79.9 127.0 1.3 11.5 4.3 Ilawamba 276.5 m a 11MI,T 1 .P 27.11 6.0 laPe?eae dM.0 173.2 198.0 2,2 23.2 0.1 5,2 Lct 113.9 23,5 L16.3 g.1 ... 12 ~ w n d e a 224.5 59.9 140.2 0.8 15.8 0,T 7.1 Marshall 235.7 56.7 149.1 3.6 23.8 2.5 Monrpe 367.1 W.0 22.5 1 0.6 33.8 7.6 Monymnay 165.2 82.8 66.0 1,3 16,O 1.9 Ok~ibbeta 2m.P 73.3 107.5 2,T 13.8 3.6 Panela 153,3 4.0 117.2 03 26.7 6.9 P o n m t ~ 111.1 31.1 m.3 1.2 15.8 3.1 Prcnllss 132.5 45.3 79.0 0.2 6.6 2.3 nta 112.0 8.9 B7.9 2.0 1 2 2 0.9 nppsh lm.4 82.8 82.1 1.0 1 t.9 2.0 Tuhomingo 240.6 111.7 Iw.0 2.1 11.2 25 Union 131.2 42.9 71.8 3.7 9,s 0.1 webaa 1S.O 67.7 82.5 3.2 1.9 2.7 Yalobusha 263.1 111.5 121.2 0,3 23.1 0.1 6.9
All wunlies 5.302.8 1,716.3 W 7 . 4 39.0 654.2 1.1 a4.7

Tabla 3 3 A u n b e 7 of (IV* !WE an ~rrnkhand By d e ~ I I C d ~ d e b u d d ~ n m a ~ ~ r ~ h ~ f . norlh h f t ~ r l s ~ p p cwAm 19W
Dlamstm ctass (Inchas at bmntr hsighr)
AU 1 . 3 & 5 C- 7 0- 9 11 b 13 b 15 b 17.0- 1PKL 21.& S W ~ clasm 2 9 4 9 6 9 8 9 10.9 I 2 9 14.9 16.9 16.9 209 28.9 2290
- - - - - -- - - - - - - - - - - - - -- nwsr3~d tmC3 -- - - - - - - - - - - - -- --- - -- - - - - - --- Shsh prom Ipm 611 110 199 71 80 . . ShonMpnm 1W,4Y 33,410 21.177 15,036 11,75U 7,614 6221 2.768 1.617 456 188 137 .. Lobhlly plnc 428.703 191.345 fb3,636 65337 31,468 13.912 8,343 4.501 2.865 l a i d 715 M7 23 P~dccdr 84.170 SO.Bd7 20,184 7.828 3.196 1,267 633 lob 64 26 , 17 .. C y p s s 3,991 I.W3 1,B95 . 293 133 233 119 99 33 15 17
TMa] softwoodr 618,366 277.305 151,887 88.211 46,QO3 U,9% 15.511 7.494 4.705 1,?M 9W 616 40
Sclcct whim d~ 117.678 @,134 27,576 11.045 6.3'12 3,588 2.675 2.062 1.727 1.089 573 681 55 Select fed oaks O t k whl* oakr 0 t h d &6
Sweet pecan Watm hickmy Olher hlckoner Psrslmmon Nard maple Frafi maph Bpxsldcr Bsech S w u m BlaFLrgum Olhu gurn&pha Wh,tc aah Olhcr ash-
S m w a C o t t m w d , Eassw~0d Yellouhppl' Mamvha Sacubay WllloW I l l a r k walput Black ekcrry A m e r l w clm Other dm6
River birch n=-w Black locust Orhcr lmusts Saasalras Dogwood Holly Mhtr c o m i a l
Totsl hmrdwoods
N a n a m m e d
All s p x j d
31.719 12.W 5,932 2$44 2,359 2340 2,721 1.392 1.W 743 490 616 131 62,771 26.824 11,603 5.716 6.216 3.9% 3,352 2.147 L.423 555 426 4 m 93
210,861 127.471 22.111 17.815 11.375 9.7% B.164 5.298. 3,634 1.859 1.313 1638 308. ... . . . . . . . . . . . . ... ... 813 610 97 39 4& 20
739 ... 555 ... 103 . . . 35 2'1 a0 . . . . . . 158.285 111.328 19.786 10,279 6,165 3329 2.m 2.095 901 H9 412 285 . 6
. . . . . . . . . . . . . . 39-297 a662 5.390 2.193 9 6 212 103 23 . . . . . . . . . . . . 4.0% 2897 567 192 270 104 22 18 27
190.517 144.820 28.476 8.953 4.269 l.98E 804 659 319 82 85 54 ... . . . ... 14.989 11.705 2139 235 231 342 137 112 76 11
1D.Zld 7.433 1.358 411 157 201 162 83 65 115 21 164 12 46L9M 297.471 83.683 37.608 18.2a 10,766 5.672 2,398 1.744 $26 978 428 23 100,913 f9,OX 4 0 1 3.IPd 1.630 954 593 231 138 46 41 4
... ... 2,675 958 539 319 363 159 164 77 57 26 9 ... 15,014 101042 2,S9 1201 618 465 169 19d d2 I B 9 7 ... 36,701 24.395 4,719 3.203 1.836 P75 971 358 191 46 28 39
... 3,271 1,178 414 397 321 161 344 213 105 56 158 25 . . . . . . . . ... 134 6 0 3 8 2 3 6 7
... . . . . . . . . . . . . . . . . . . lo0 71 28 M.853 39.696 7P16 4 . X 1868 832 894 7 2 495 335 142 177 3
. . . . . . . . . . . . . . ... 390 190 ... 115 28 36 20 . . . . . . . . . 8.477 4.078 2.922 1.W 221 89 95 49 ... I 2 ... ... 34.390 22.634 B.5'/7 1,4H 593 365 231 149 128 3b 12 ... ... ... 2.455 61t 862 627 115 133 58 18 15 17 ... 63.925 50,225 8.1SB 3.209 1.255 771 31 117 24 dS 37 22
21,365 15,746 1.735 1.586 851 513 394 171 236 50 29 44 3 166,510 121,MB 31,450 7.986 2.911 1.590 851 405 115 90 40 47 11
... 8,777 4.836 2,091 612 182 346 174 166 186 76 58 49
... . 8,472 3,322 1 1.0~ GW 872 319 263 108 n 33 M . . . . . . . . . . . . 9.392 5,803 2369 705 359 114 PO 36 16
921 833 ... ... 56 ... 33 . . . . . . . . . . . . . . . . . . . . . . . . . . . . . . . . . 17,741 32,249 3.137 975 356 115 36 28
. . . . . . . . . . . . . . . . . . . . . 181.BOh 124.MS 50.632 6.443 544 138 . . . . . . . . . . . . . . . . . . . . . . . . . . . L.&IO 1.742 ... 98
... 1g.444 11.918 7 1.526 452 165 118 21 23 11 M Z
... 110,493 160,793 35,013 9.077 2.991 1.657 432 159 279 47 32 14
2,895,569 1,81K,793 35.069 236,181 10.335 71.MS 47,519 27,803 18#8 8.4B8 5.a08 5.675 735
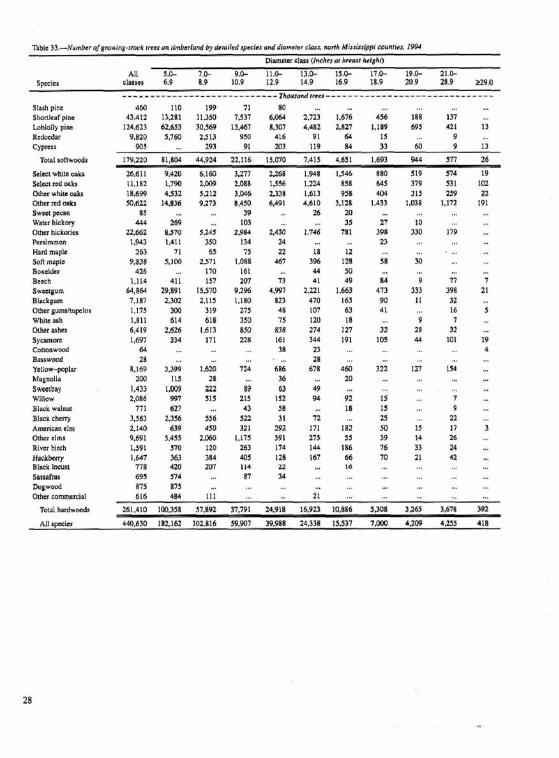
Tabts 33,-Numb#r drmm'w-rmk fmrr om timbsrlandby dctuikd spacirs anddrneter c l ~ s , north YicBkIppl W l e r , I G W
S h b plne S b d d plnc Loblolly pi= Bcdccdmr Cyprrsr
r m a l s D f l w ~ d ~
Seleer whm oaks Sdr~l d 8 d U
Dhcc wbl* &s Obcr rcd oak! SWDDf PC89
WaW hick Wy Otbr hlckmcs Rrsimmon Hard map12 Soft moplc B ~ r t d r r Beech Sw~ctpum Blackgum O W pumaupclaa l V h ~ l c nsh Dlker ashrr S y a m t c m w d BaMIvwd
Yellow-poplar Mngndla Sseelbay W,llOW Black weIda1
Blsck cherry American rlm Orhcr elms Rmcr brfch Hackberry Blwk Ilacuu
Sassafras h z d Other cornmsrcial
Total h a 1 d w d 6
All specrcs
1S.6g 4.532 1312 3,Wb 2.338 1,613 958 4U4 315 539 22 50,612 14.836 9373 &4SQ 6P91 d.610 3.12% 1,631 1.W8 1 191
85 ... 39 . 26 20 ... 444 264 ... 103 . 35 27 10
22,661 8 7 5.243 2,984 2.430 1.7d6 7'18 398 330 179 ... 1.943 1411 UO 134 24 ... ... 23 ...
263 71 65 75 2.2 18 12 9,838 5.1W 231 1.MB dbl 396 128 5B M ...
426 ... 170 161 ... d4 30 1.114 411 153 2[vl 73 41 49 sa 9 7 7 7
64,864 29,891 1S.570 9,286 4997 Lnl 1663 473 333 398 21 ... 7.187 2,302 2.115 1.1W 823 430 163 90 11 32
1.175 3G4 319 275 4s 107 63 dl ... 16 3 1,811 614 618 350 ' IS 120 18 9 7 ... 6,419 2.6Z6 1,613 850 838 274 127 32 28 31 ... 1.697 334 171 228 ldl 344 191 105 M 101 19
Ed ... ... 38 23 ... ... 4 28 ... . . . . 28 ...
8.169 3399 1.620 72d 686 638 4M) 322 127 ISd ... ... ... 200 115 28 36 20
1.433 1$C9 221 29 Q 49 ... ... 2,086 997 515 213 152 94 92 IS 7 ... . ... 771 627 ... 43 38 I8 15 P ... ... ... ... 3J83 a346 556 522 31 12 IS 22
2.ld4 639 dSO 321 29' 171 192 M 15 17 3 9.W1 j,d55 La60 1,175 H1 275 5 5 39 14 26 ..,
... 1.591 570 120 261 114 144 IS6 76 33 24 ... 1,MS 363 384 5 128 161 66 70 21 42 778 420 207 11.1 22 ... l d 695 574 ... 87 Y 875 2175 ...
... ... 616 484 1 1 1 21

Table 34.-mums oJllua rmu# on ~ l m ~ v l m d by dslufbd rpecf#b and d i m I u t cl-8, mrrh Mibpissippi cwrrfie~, 19W
Msmtrer C ~ I Ihekaa a1 bm81 hai~htl - ,
AIL 5 . 1 9 . 1 1 3 . h t 5 . b 7 lo.& 2 l . L Spcics chaca 6.9 8.9 10.9 12.9 14.11 11.9 189 9 28.9 229.0
Slush pins Shortlcmfplm Labhlly prne Redcular Cyprtoa
Toral s o f l w d a
S B l M whim olkr &IM Ed ~aks Ohor whla nab Mher red daks S m t r pcenn Waror hrckw OUIor hrckme~ Rraimmen H r d maple $oh maplr Bd &r
Baefh Swtcrgum B M g u m Othcr grrmalrualos Wh~k ash Other ashes Sycomm Car mawood B u s s w d Ycllaw-paplmr Mspol~m Sweetboy M l l o w Elsck walnut Black chary Amvlcan elm O k elms Rwtr blah HacLrbcq
EQJ: l m s l Ohcr locunls Sntrahs Dogwood Holly 0 th c o m m ~ a l
Tom1 hardwmd~
Noncommaelm1
All 8-
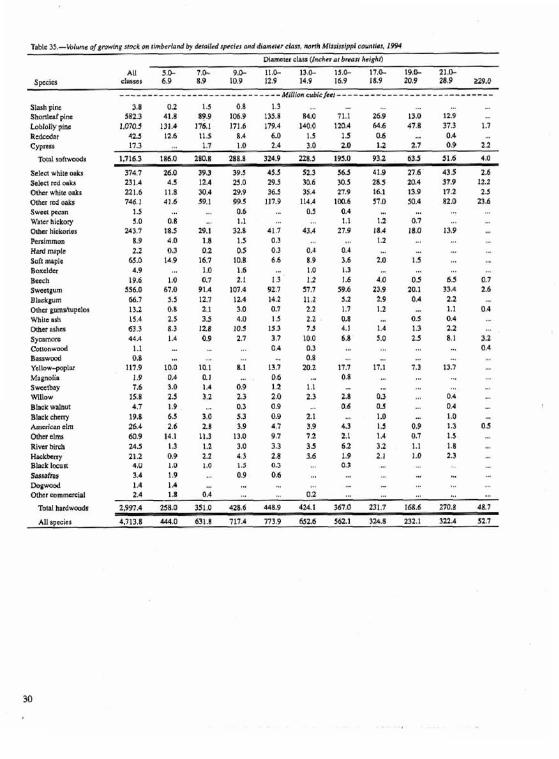
Slash pint 3.8 0 3 1.5 0.8 1.3 Shon!d@nt 582.3 41.8 99.9 1069 135.8 84.0 71.1 269 13.0 12.9 Lobhlly pns 1.070.5 131A 176.1 171.6 179.4 140.0 120.4 b4.6 d7.B 373 1.7 Rcdudar 42.5 126 11.5 8 A 6.a 1.5 15 0.6 ... OA ,+. Crprss 17.3 . 1.7 10 1.4 3.0 2.0 1.2 2.7 0.9 2.2
TstJ mf IwCds
Seleel whlts c-aka Sclccl n d o n h Olkcr whrls d 6 m c r rcd a k a Swt t p a n Watt! hlclrory OUlcr hicknrles Pcdmmw Hard maple Saff m p l e Boxcldrr Beech Swectgwp Blackgtm M h c r gurnahupclos Whitc ark other asher 5,cnmrc C ~ m d B a w d Ycllw-poplar Magnol~a S w I b a y Willmv Bhck walnut Black cherry Ampican elm O*er elms Rlvcrbhh
=lL
Saszahs hwd Other mmmlml
TMd hmrdrvmdr
All sg r~ ica
Slash paa S M t a l p I m b b l d l y p ~ n e W C E d w I
Cyprc.*
Total s o h d
Wet whrlc m k ~ SelM rrd O l b
(Sthre whim wk% Othcr red oaks swm pcmn
Wnler hlekary Olhcr tuckmja Pcrslmmon Hard maple Soh m ~ p l c Boncldcr Beech S.ucc~gum B M s u m Mhcr gurnrhup=k W h h a&
Olker ashes 5!camort C d t o n d Bassmu3 Ycl low-poplar Mqnolie Swtctbay WlllOW Blbck walnut Black c h c q kmmcmn elm Mhcr clmr ~ w t r mmn Hackkrfy B I U C ~ !ma Sasrafru
Othtr mrnmu~ial
TMal hsrdwmds
All Ip"Ek3

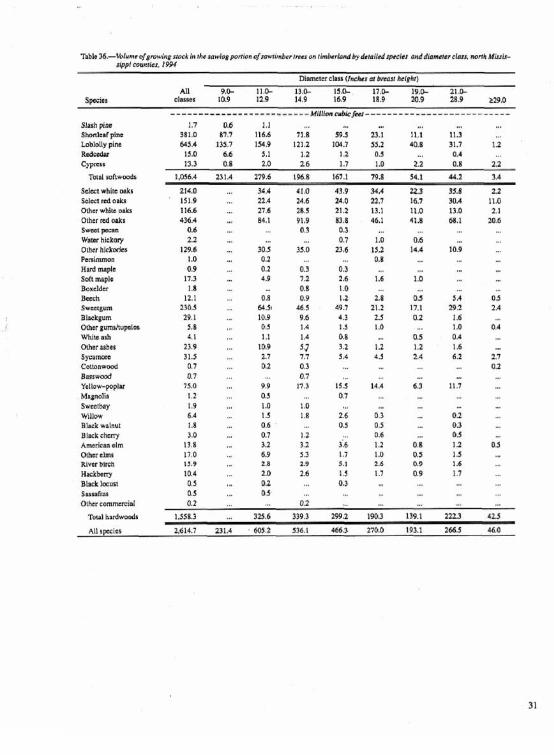
Wc 37.-Yalumr ofllue rm~ m r b h r L d b y d # m l E e d ~ ~ a # andcE~bx oft imbr~ m h MLS;8- znpp mtrltlks, 1994
All Gmwlng Spaclss UVE alock Rough sot lea
------------- -M,l l ,a . cub,cp@p-- - -- -------- ~ I S & p l ~ 3 8 3.8 S h n l c d p c 591,9 582.3 9.5 Lhldly pm 1,089 7 1,070.5 lg.2 Rcdcedar 52 6 4k5 Q.7 0.5 CYprcm 18,4 17 3 R6 a6
SGleet rcd aaks W c r while omks Other red oaks 5- pecan W t s r hichry Other hle tmhs h m m m Hard mapb 5& mpLt Boaelk Bccch Sweetflm Blefkpurn Orher gumdtupha Whiw ash OOdr &or S>cambre Cullonwmd Basswmd
YellovhpDplw Msaooltm Swt tbvy Wll lw Black d n v r Blrck ehtrry American clm Qthr elms Rlver birch Hackbcrry B k k 1cs-t
OWr ]was Earrsfm Do#wod Holly Other conunemial
"id hardWrnd6
Nmrcemmerclnl
All a-

Table JS.-T$luuar dwwhberfor tm b& 1 # l*M by derallcd 8pacirJ mid dfdmeter claf3, n o d Mh~idrippi cwaIia#. 1W
Mamcter e l l = /hr/u~d brearthsiahl
AU 9 11.g 13.0- 1 S . b 17.P 1P.b 2 1 L Sprcjts elnsrss 10.9 12.9 14.9 16.9 18.9 20.9 28.9 a g . 0
--------------------- --- -Mildim bdd"dW ,--- --- - -------------- - -- -- Slash pdnc 1,7 1.7 Sh&af pina 598.7 88.7 126.8 132.7 103.1 63.9 3 9 9 43.6 Loblolly pine 540.8 33.5 74.8 76.5 IZlA . 87.5 72.0 Rcdccdnr 77.0 32.5 26.7 3.9 3.8 3.2 ... 2.8 CyprCaQ 35.1 , 2.3 ... 2.9 3.6 5.5 5.5 15.4
Taa l a & d s 1,253.2 157.0 230.0 215.2 239.2 199.6 132.11 123.9 L5,d
Swim whim onh 3B3.3 58.8 11P. l 72.4 1324 Select nd amks 2365 . 21.1 62.5 47.8 84.1 21.1 0 t h whim oak8 1M.1 11.3 257 18.8 41.2 8.1 0 t h red & 376.5 ... U . 9 66.3 99.5 1464 36.4 Watm Ykmy 4.0 . 4.0 Om W m i t ~ W.5 ... 23.7 20.8 5 m.3 Soft msplu 2.8 2.0 S w ( g u r n 188.6 ... 18.9 708 29.9 69.8 BLackgurn 11.0 ... 6.4 1.5 3.1 Olhtr ~ u m ~ u p c l o s S.0 3.5 4,s whim ash 7.3 ... 5.0 ... 2a Wtr ashua 16.0 ... 6.0 6.9 3.0 Sycsmort 37.8 ... 11.3 7.5 ... 18.8 Ycllow-ppglar 70.8 ... 4.3 25.8 13.1 27.8 Black walnut 2.2 2.2 B h k chmy 4=9 7,8 ... 2.1 Anmican r141 7.1 ... 4.6 ... 2.4 Rivcr birch 10.9 ... 52 2 2 ... 29 Ancbemy 11.4 .. . 2.9 2.7 1.2 4.7
Total hadwmdr 1,574 1 . 196.5 424~2 329.9 563 7 68 1
AU aptclca 5.827 1 1 . 230 0 2152 427.7 563 6 462.8 687 6 83 4
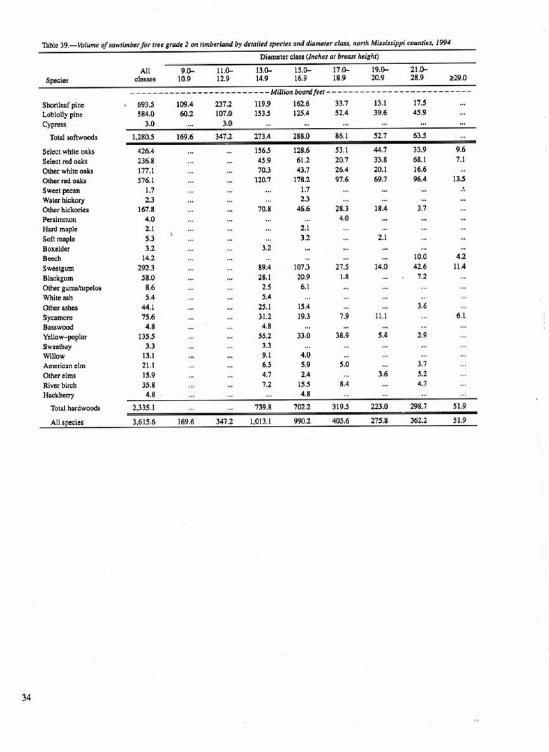
Tabh 35(.-mluma ofeowlkbhrfor tree z r d 2 rn t i m h d a d by d#td#~fuodd iamr l t rckur , n m h Mlxsimippi m d t d , IW DimWr class Unchar at h! hsighlj
Cypsess
mtal m R w d
SelrcI whim S t l t C l pCd
cam whtc ostp OhzrcdMks S w e l pscsn Warn hlEkery Mhcr hlckorlcr Pwalmmon Hnd mapla Soil maple Boxolder B m h Swelgum Blackgum Other gumdtupok Whue ask Other bshcr S y c m m Bnsswwd YcUow-poplar Swer thy Wlllow Amcricsn dm Otkcrtllns b v c r blmh Hacbrry 4.6 . ... 4.8
Total hnrdworrds 2,335.1 739.8 702.1 319.5 223.0 2P6.7 51.9
All specbes 3,615.6 169.6 347.2 1 .QIJ . I 2 405.6 275.8 3621 51.9

Table 4 0 , - W m a ofwwthbrrfw Iw 3 M rhbtrlandk+ ~ai iada~scds~ and&rwrar elm, n o d MsdI~s@pl couruira, 1W
Dlsmcaa class I lnda a: b M kW0
Slash plat Shonlcaf pim tpb1my pino
=ypm= Total l 0 h D d l
Stlcel whiu aaks Select md n a b O h r whl* oaks omr d Watm h i c k w Olher h c k m i o b -on
Hard W l s Soft mpk Bctch Swwtpm Blackgum Other gumhpcl2* Wbllt ssh Other ash- Spsmor t Caurrnwmd Yello-pep1nr Magnolia Svntlbay WdLow
Black walnut Black cherry Amujcan olm Other tlms Rlvcr bimh Hwkbehy ~lacli I m n ~ ~ m f ~
All 9,& 1 1 , 3 1 5 . b 1 19.L 21.h dassss 10.9 1 . 9 14.9 16.9 18.9 20.9 284 219.0
------------------------- M l H h bwldf& - --- -- - ---- --- --- -- --- " 7-
65.5 RS
43.6 1.8
1.4 7.3 165 29
11.4
15.5
3.0 1.0
2.4 S f i 3.9
Olher m m x i s t 0.9 .. 0.9
Total h a r d r v d 3,635.9 ... 1.3642 834.3 590.4 29ZA 174.7 333.7 34.2
All BwlOs 7,713.1 9b4 7 2.4904 1,617 0 1,171.2 604 7 363.4 440.8 608

Salec~ whiu m k s Scltct red oaks 0th whicc Oaka otter nd &a Swwt p a n
O h t h * k d H Soft msplt Boxddec B u d s=mm Blsckpm (kker s h e s Sycamore Cononvrood Ydlow-ptrplnr Sweatbay Wmllow Anvmcae clm 0th elms h v e r b i d
-
Fmal All Ndsnal Dther b~t#t IndusL?y- Other
S m c s mncnhlps Tgmst publlc indust7 b d privntc
Sslccr whitt-re3 oBks Olhcr whk-mdoaks R i c k r f Hard me@t Swactgum Tupeloand bleek#um Ash-walnubb1aGk chary Y~~lDWpoplar Olhtf Lardwcda
Total hardwood%
All q d c i ~ I
Net G m d k v r l a Man+li~
All All AU Cdualy qxclts Wwwd HMmd wcier Soft- W w d wcias S O W H d w d
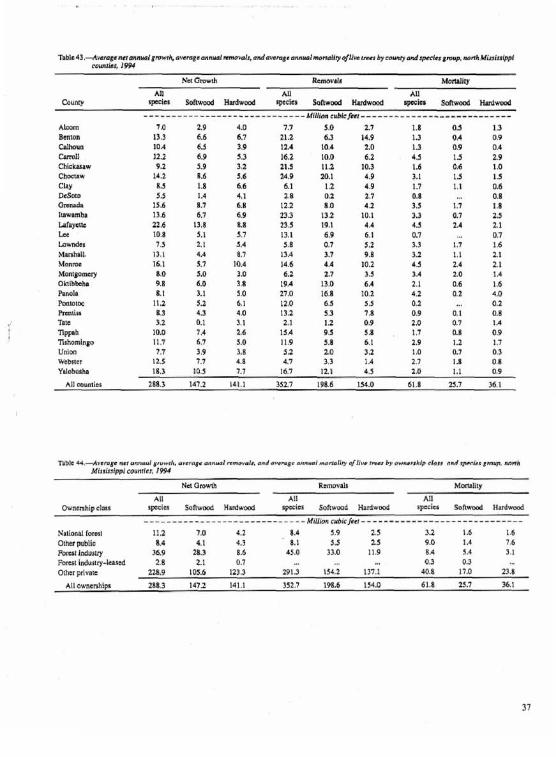
----------------------------- iWiili0.q cvble fw -- - -- - - - - -I-- -- --- --- ---- - - -- A I m 7,O 2.9 4.0 7.7 5.0 2.7 14 a5 1.3 Benm 13.3 6 8 6 7 21.2 6.3 14.9 1.3 a4 0.9 CalhDun 10.4 6.5 3.9 12A I04 2.0 1.3 0.9 0.4 h ~ d l 12.2 6.9 5.3 16.2 10.0 6.2 4.5 1.5 2.9 C h i c h w 9.1 5.9 3.2 11.5 112 la3 1.6 0.6 I& Ch-w id.2 8.6 5,4 2d.9 a l l 4.9 3.1 1 3 1 3 Clay E.5 1.8 6.6 6 1 1,2 4.9 1.7 1.1 0 6 DrSotO 5.5 1.4 4.1 2.8 02 2.7 0.8 0.8 Grenada 15.6 8.7 6.E 12.2 8.0 4,2 9.5 1.7 1.8 llawmmba 13.6 6.7 6 9 23.3 13.2 10.1 3 1 0.7 1 5 Lafayulo 22,6 13,8 a.8 23,5 19.1 4.4 45 2.4 2, l k c m a 5.1 3.7 13.1 6.9 6.1 0.7 0.7 Lawndos 7,5 2.1 J A 5,E 0.7 5.2 3.3 1.7 i .6 Murehsll. 13,l 4.4 8.9 13.4 3.7 9.1 5.2 1.1 2.1 Manrot 16.1 5.7 l a 4 14.6 4 4 10.1 4.5 2.4 2.1 M o n t ~ o q 8,0 5.9 3.0 6.2 2.7 3.5 3.4 2,b 1.4 Oblbbehm 9.B 6.0 3.8 19.4 13.0 6d 2,l 0,6 I .6 Pam13 8.1 3.1 50 27.0 16.8 1h2 4.2 0.2 4D h m ~ m 11.2 5.2 6.1 12.0 6.5 5,s 0.2 0.2 R c m i s o E.1 4.3 4.0 13,l S,3 7.8 0.9 0 , l 0.8 ma 3.2 a 1 3.1 2.1 1.2 0.9 2.0 0-7 I A Ttppah 10.0 1.4 2.6 15,4 9.5 5.8 , l,? 0.B R9 nshmfng~ 11.7 6.7 ~ f i 11.9 5,s b , ~ 1.9 1.2 1.7 Union 7,7 3.9 3.8 5.2 3.0 3.2 1 .O 0.7 0.3 Wcb'ebswr 12,s 7,7 4.5 4,7 3 3 1.4 2.7 1.8 0.8 Yalabuakm 18,3 10.5 1.7 16,7 12.1 45 2 .O 1.1 0.9
All cwntlcl 288.3 147.2 141.1 352.7 198.6 1540 61.8 25.7 36.1
Tab10 M.-Avarrrg. ~ ~ u m w l ~ b m w r h . nvsra#r annrdmm-k andarsm8c m a m a 1 m r h l l y v~IIwI-, bydwnrrshfp dd,, o d - ' n a g m y , fisrrh Mu!Ia~@$l munflcs, 11994
Ntl Omwh Rtmvrls Momlily
AII ALI Al? O w m h i p class species Softwmd Hardwwd @ p i t s S g f t w d H d w d sspocrcs Sallwood H a r d w d
----------------------------- WII I I~n~ytAcfe~f -------------------------- --- Natlmal lorest 11.2 7,O d.2 8.4 5.9 2,5 3.2 1.6 1.6 olkv pvbli a,r 4.1 4.3 8.1 5.5 2.3 9.0 1.4 7,6 b r u t industy 36.9 ~ 8 . 3 8.6 45.0 33.0 11.9 E.4 3.4 3.1 F o r d iodultry-ltasbd 2.8 2.L 0.7 0.3 0.3 Mhcr privale 223.9 105.6 123.3 291.3 154.2 137.1 4I1.8 17.0 21.8
All ownsnhip 288.3 147.2 141.1 352.7 198.6 1M.O 61.8 25.7 36.t
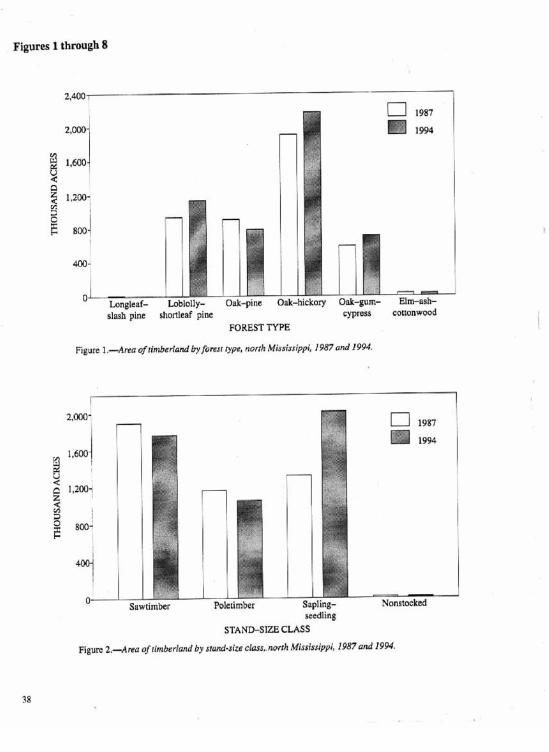
Figures 1 through 8
slashpine shortleaf pine
I C " 1 I- . .. - - . . . . , nk-gum- Emssh-
cypress cortonwood
FOREST TYPB
Sawtimber Fwlctimber Sapling- seedlidg
STAND-SIZE CLASS
Figure 2 . d r e a of rinhrlarsd By srand-slee class.. nwrth MrWississippi, I987 and1994
I ROU
YEAR AND SPECIBS ClROW
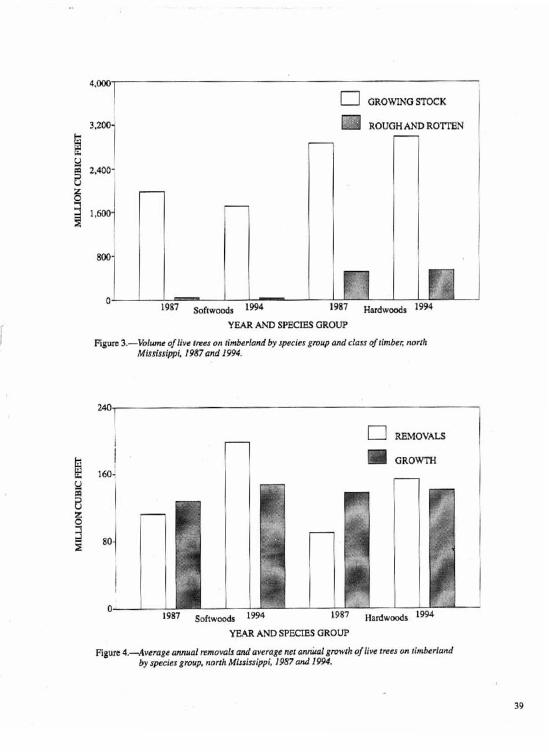
Figure 3 . -blme oj1Lvr trees ori timberland by species gmup and elms of riwtbac ~ r i l r Mississippi, 1987 and i9W.
a GROWTH I
YEAR AND SPECIES GROUP
Figure 4.--Avera#a anmi m m m l s umd wcmge net atinira/ gmwrh ~fafivc rncs on tlmbcrfarcd By species group, north hfh$1s~ippi, 1987 Md 1994.
DIAMETER CLASS (INCHES)
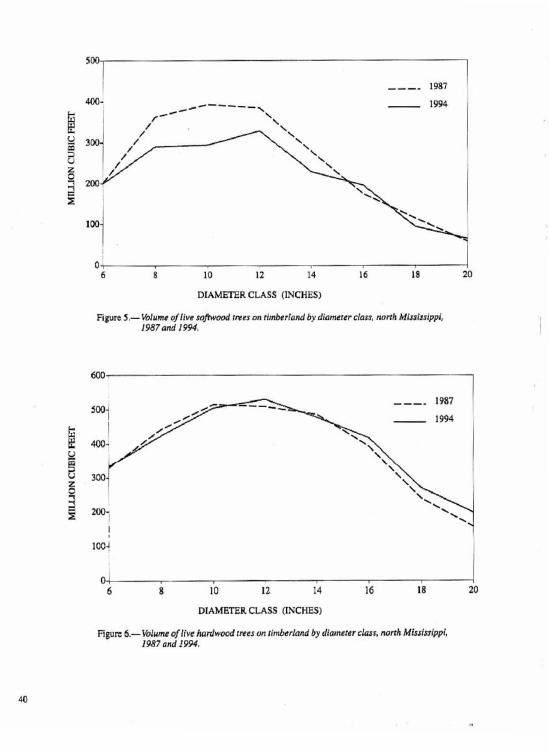
Figure 5 .- b l v m r of five fafnuaod trees on rlmberland by dlansc!er cluss, mr~h Mi~sisslppl, I987 and 1994.
0 1 6 8 10 12 14 16 18 20
DIAMETER CLASS (INCHES)
Figure 6.-Volume oflive haTdwood!rees an tintberind b) diametcr c h s , north Midsslppl, 1987 and 1994.

DIAMETER C U S S UNCHES)
Figure 'l.-hr~&er w f l b ro$?wood tmes on timberlad by dimcter class, north Mlsfhippi. I987 and 1994.
---. 1987 I 160- - 1994
I 0,
6 8 10 12 14 16 18 20
CLASS WCHeS)
Rgure 8.-Nwmberof~iw hardwoodmes w rimbcrIond by diamcrtr class, m f l h hfi.lissrmippi, 198 7 and 1994.

Faulkner, Joanne L.; Miller, PatrickE.; Hartsell, Andrew J,; London. JackD. 1993. Forest gtatisticsfor north Mlssisalppi countica-1994, Resour. Bv11. SO-180. Ncw Orleans, LA U.S. Department of Agriculture, Forest Sewicc, Southern Forest Exparirnent Stahan. 41 p.
Tabulates forcat resource information from a n e w invenrory of h e northern counties of Miasissippi.
Kwords! Area, forest type, ownership, stand sizc, volumt.
Per'iona of m y raw, colot, national origin, as& Bge, religion, or with any disab~lity are mlcome lo use and enjoy all fwllitles, propama, and services of the WSDA. Dlscriminatlon in any form ia strrctly agarngt aagcncypol~cy, and BhouId be reported to the Secretary oFAgriculture, Washington, DC 20250.