of greece - nbg · of greece greek economy, compris bulk form supported by exceptional climatic...
TRANSCRIPT

*
Supported by exceptional climatic conditions, agriculture is a key sector for the
Greek economy, comprising 2.9 per cent of GDP and 14 per cent of employment
(compared with an EU average of 1.2 per cent and 5 per cent, respectively).
However, the lack of a clear agricultural strategy has led the sector to rely heavily
on European subsidies, incapable of exploiting the dynamics of the rapidly-
expanding international market. Greek agricultural production increased by less
than 20 per cent during the past 25 years (compared with 220 per cent globally
and 86 per cent in Europe). In fact, Greek agricultural value added, excluding
subsidies, dropped by 13 per cent during the past 20 years, while other
Mediterranean countries (Spain, Italy, France) managed to increase value added,
excluding subsidies, by about 15 per cent during the same period.
Moreover, the food supply chain has a relatively small manufacturing component
(adding just 40 per cent to the agricultural production versus 70 per cent in
Western Europe), as most Greek agro-food products are consumed or exported in
bulk form.
On the other hand, ¼ of Greek food exports have exploited Greece’s comparative
advantages and gained significant shares in the international market (e.g. olives,
yogurt and honey). Their common strategy is to target high-income countries
(such as the euro area, UK, US, Japan), with branded products in packaged forms.
Aiming to quantify the unexploited dynamics of the Greek agro-food sector, NBG
Research focused on: (i) the potential for higher agricultural production (by
following the high R&D and high vertical integration examples of countries like
New Zealand, The Netherlands, Israel); as well as (ii) the development of a larger
food manufacturing sector (i.e. transform bulk production to high-value-added
products).
According to our estimates, there is potential for extra value added from the agro-
food sector to the Greek economy of about €12.2bn per year, equivalent to 6.9
per cent of GDP (€9.1bn directly and €3.1bn through the indirect boost to the
agricultural inputs and packaging industries). However, this requires the formation
of an efficient food value chain:
Agricultural production should become more technologically sophisticated. In
fact, the reformed CAP offers opportunities for a more professional approach
to agricultural activity, with less dependence on income subsidies and more
focus on upgrading the production process.
The limitation of small-sized farms could be overcome by a business-oriented
operation of agricultural cooperatives, with managing boards including
producers, marketers and researchers.
The vertical integration in the food supply chain should also aim towards the
development of strong brands. In this context, the promotion of PDO
products should be encouraged and synergies from sectors such as tourism
for the successful branding of Greek agro-food products should be
developed.
Economic Analysis Division Eolou 86, 10232 Athens, Greece
SECTORAL REPORT
December 2015 NATIONAL BANK
OF GREECE
Unlocking the potential of Greek agro-food industry
Paul Mylonas, PhD NBG Group +30 210-3341521, e-mail: [email protected]
NATIONAL BANK OF GREECE Sectoral Report December 2015 1
Research Coordinator:
Jessie Voumvaki, Senior Economist
+30 210 3341549
e-mail: [email protected]
Analysts:
Athanasia Koutouzou, Economist
+30 210 3341528
e-mail: [email protected]
Georgios Sakkas, Economist
+30 210 3341547
e-mail: [email protected]
Eirini Zampeti, Economist
+30 210 3341646
e-mail: [email protected]
0
1
2
3
4
1991
1993
1995
1997
1999
2001
2003
2005
2007
2009
2011
2013
trill
ion €
World food production value
Asia America Europe Africa Oceania
Source: Faostat, NBG estimates
30% 24% 24%
18% 21% 23%
18% 16% 12%
13% 14% 14%
10% 14% 16%7% 7% 8%
0%
20%
40%
60%
80%
100%
1991 2001 2013
Disaggregation of world agricultural production value
Cereals Meat Dairy
Fruit Vegetables Oil crops
Other crops
Source: Faostat, NBG estimates
Supported by exceptional natural conditions, agriculture is a key
sector for the Greek economy, covering 2.9 per cent of GDP and 14
per cent of employment (compared with an EU average of about
1.4 per cent and 5 per cent, respectively). However, the lack of a
clear agricultural strategy led the sector to rely heavily on European
subsidies, which to a large extent determined the level (and in
some cases the type) of production. Specifically, subsidies amount
to about 22 per cent of the value of agricultural output in Greece,
compared with 12 per cent, on average, for Mediterranean
countries. These structural deficiencies have undermined the
sector’s natural competitive advantages and have crippled its export
capacity (currently demonstrating a trade deficit of €1.2bn,
compared with a cumulative surplus of €18bn for other European
Mediterranean countries).
Moreover, forces acting on the sector are also leading to change,
including: (i) the recent reform in the Common Agricultural Policy
(CAP) that implements stricter rules in terms of production quality
and use of funds; (ii) the critical importance of exports to revive the
Greek economy; and (iii) the increased competition in world
markets. The production of higher value-added food products as
well as their efficient promotion is the only way forward for the
Greek agro-food industry. Successful implementation of the above
would create an efficient food value chain, covering all stages of
production (from agricultural research, to the production and
packaging of differentiated products as well as strategic
marketing/branding). Such a strategy would generate food products
that are national champions, able to access niche markets in high-
income countries.
CURRENT SITUATION OF AGRO-FOOD INDUSTRY
1. A rapidly-changing world market
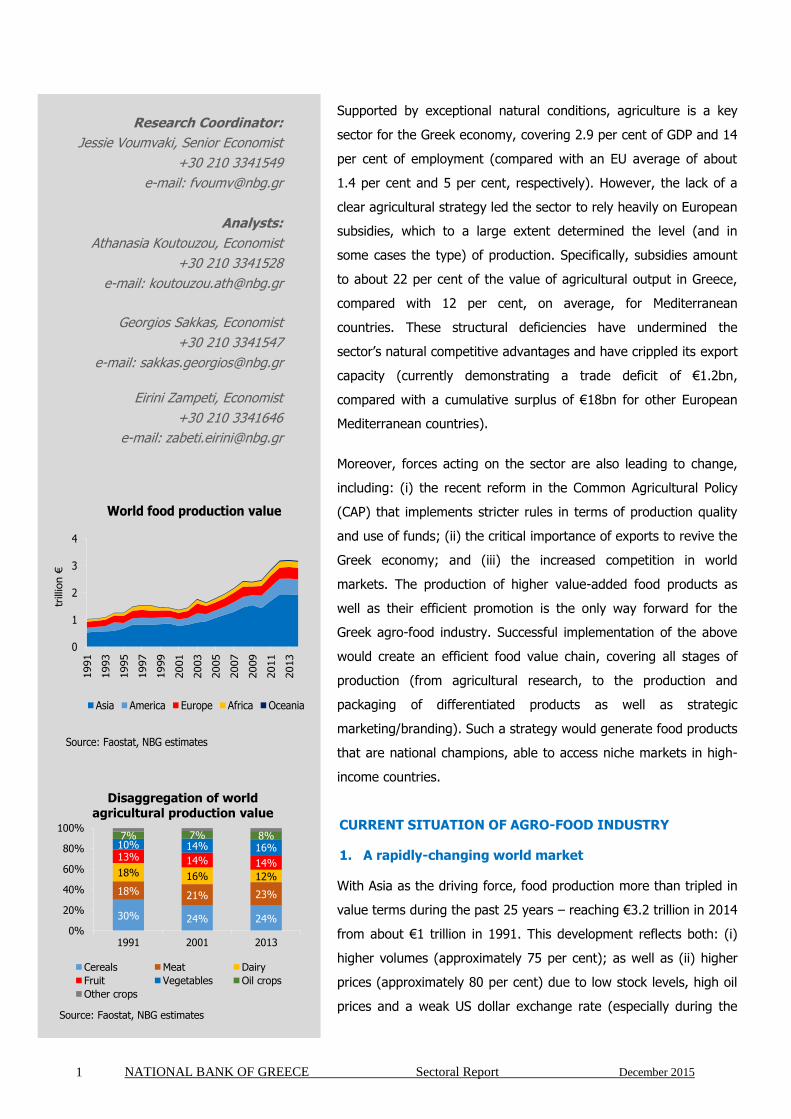
With Asia as the driving force, food production more than tripled in
value terms during the past 25 years – reaching €3.2 trillion in 2014
from about €1 trillion in 1991. This development reflects both: (i)
higher volumes (approximately 75 per cent); as well as (ii) higher
prices (approximately 80 per cent) due to low stock levels, high oil
prices and a weak US dollar exchange rate (especially during the

NATIONAL BANK OF GREECE Sectoral Report December 2015 2
0,0
0,3
0,6
0,9
1,2
Europe Oceania America Asia Africa
tons
per
pers
on
(anually
)
Per capita food consumption
1990 2014
Source: Faostat, NBG estimates
-1% 44% 35% 36% 78%*
*growth rate of population
0
200
400
600
800
1000
1200
1991
1993
1995
1997
1999
2001
2003
2005
2007
2009
2011
2013
bill
ion €
International food imports
EU intra EU extraAsia North-Central AmericaSouth America AfricaOceania
Source: Eurostat, World Trade Organization, NBG estimates
0
200
400
600
800
1000
1200
1991
1993
1995
1997
1999
2001
2003
2005
2007
2009
2011
2013
bill
ion €
International food exports
EU intra EU extraAsia North-Central AmericaSouth America OceaniaAfrica
Source: Eurostat, World Trade Organization, NBG estimates
past decade). During the past two years, however, the
strengthening of the dollar, lower oil prices and the catching up of
production to higher consumption have exerted downward pressure
on food prices. This development has in fact counterbalanced the
volume increase (6 per cent during the past two years) and thus
has broadly stabilized the value of world food production. Looking
forward, the recent sharp decline in world food prices (by 20 per
cent) is expected to exert a significant brake on food production.
Within this dynamic environment, Asia currently covers more than
60 per cent of global production, from 51 per cent in 1991 (with
Chinese production growing at an average annual rate of 30 per
cent, and thus contributing 50 per cent of Asia’s production in
2014). Moreover, Asia holds a dominant position in the production
of all food categories, covering up to 65 per cent of cereals, fruit
and vegetables production and 50 per cent of meat and dairy
production. In this context, Europe supplies 13 per cent of global
food production (from 22 per cent in 1991), while the Western
hemisphere accounts for about 18 per cent during the past two
decades (with the US and Brazil contributing 43 per cent and 25 per
cent, respectively, of the Western hemisphere’s production). At this
point, it is important to note that the global increase in food
production was not uniform across all product categories.
Specifically, vegetables and meat production have soared during
1991-2013 (posting an average annual growth of 18 per cent and
15 per cent, respectively), while dairy products and cereals have
increased by less (posting an average annual growth of 6 per cent
and 8 per cent, respectively).
Turning to the demand side, the higher production has been
absorbed by greater food demand as: (i) the world population
increased by 37 per cent during the past 25 years; and (ii) per
capita food consumption increased by 27 per cent. Specifically, Asia
more than doubled its food consumption volume - reflecting both a
population growth of 36 per cent and a higher per capita
consumption by 51 per cent during the past 25 years. Also
noteworthy is the case of Africa, where an astonishing population
growth (78 per cent during the past 25 years), combined with
higher per capita consumption (by 23 per cent), increased
consumption in volume terms by 120 per cent. On the other hand,
NATIONAL BANK OF GREECE Sectoral Report December 2015 3
-
3
6
9
12
15
1991
1993
1995
1997
1999
2001
2003
2005
2007
2009
2011
2013
bili
on €
Greek agricultural production value
Oil crops Fruit Vegetables
Cereals Meat Dairy
Other crops
Source: Faostat, Eurostat, NBG estimates
21%10%
17%
12% 14%11% 12%
16%
21% 32%
21% 25%
13%9%
19%29%
25%39% 26%
14% 14% 22% 25%35%
0%
25%
50%
75%
100%
Disaggregation of agricultural production value
Fruit Vegetables Cereals Olive Oil
Other crops Meat Dairy
Source: Eurostat, NBG estimates
3,6%
1,6%1,3%
0,6% 0,7%0,4%
1,4%
0,4% 0,3% 0,4%0,2% 0,1%
0%
1%
2%
3%
4%
Share of Greek production to world production
1991 2013
Source: Faostat, NBG estimates
European consumption remained broadly stable in volume terms
during the past 25 years, as the small increase in per capita food
consumption – which in fact remains the highest in the world (970
kg per capita per year compared with a world average of 800 kg) –
was counterbalanced by a 1 per cent population decline.
Unsurprisingly, food exports have also flourished (registering an
annual average growth of 15 per cent during the past 25 years)
and thus currently cover 34 per cent of global production (from 24
per cent in 1991). While Asia is the leader in global production,
Europe is the main region of origin - accounting for more than 40
per cent of international exports in 2014 (with ¾ covering intra-EU
trade). Africa presented a significant increase in food exports,
posting annual average growth of 23 per cent during the past 25
years, but its market share remained extremely low (covering 4 per
cent of the world exports in 2014). Turning to the destination
regions, the Asian market is the leader, covering more than ⅓ of
total imports (or ½ if we exclude the intra-EU trade) – with 41 per
cent of its imports originating in countries of the Western
hemisphere. In this context, the Western hemisphere has a huge
trade surplus (approximately €125bn in 2014) and Asia a matching
trade deficit, while other regions have broadly balanced food trade
flows.
2. A key sector for Greece, posting disappointing growth in
terms of: (i) production …
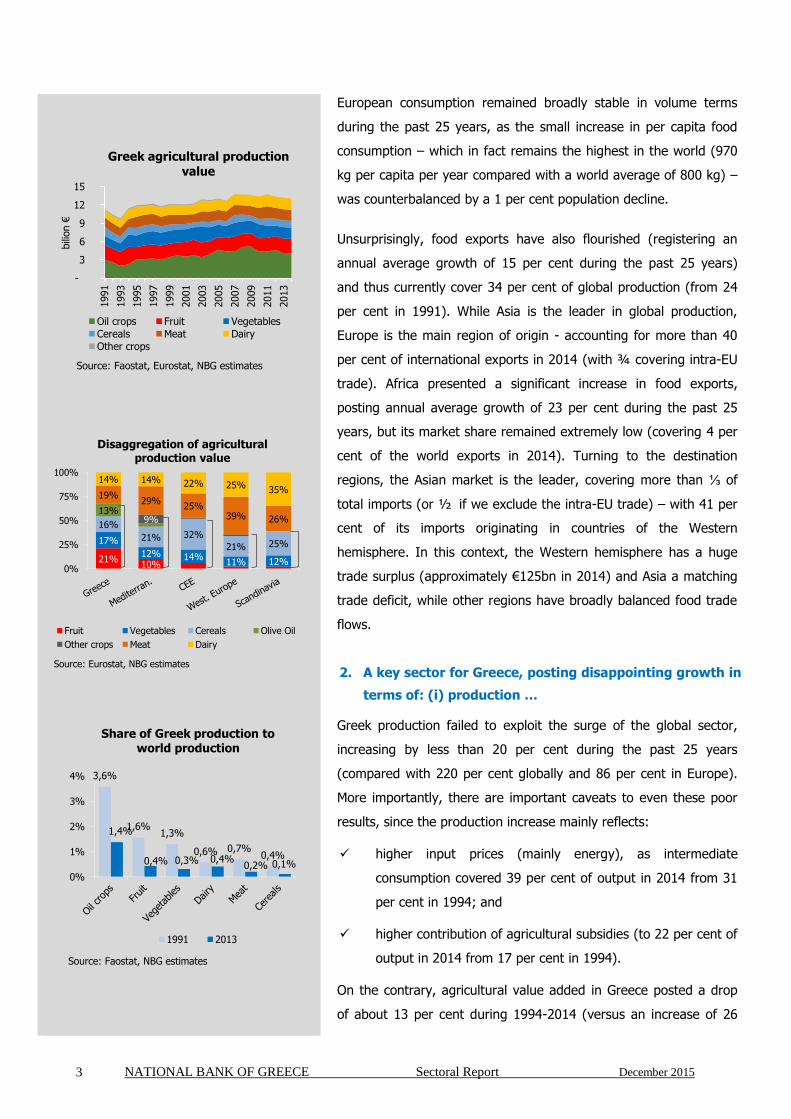
Greek production failed to exploit the surge of the global sector,
increasing by less than 20 per cent during the past 25 years
(compared with 220 per cent globally and 86 per cent in Europe).
More importantly, there are important caveats to even these poor
results, since the production increase mainly reflects:
higher input prices (mainly energy), as intermediate
consumption covered 39 per cent of output in 2014 from 31
per cent in 1994; and
higher contribution of agricultural subsidies (to 22 per cent of
output in 2014 from 17 per cent in 1994).
On the contrary, agricultural value added in Greece posted a drop
of about 13 per cent during 1994-2014 (versus an increase of 26

NATIONAL BANK OF GREECE Sectoral Report December 2015 4
0
3
6
9
12
15
1994
1996
1998
2000
2002
2004
2006
2008
2010
2012
2014
€bill
ion
Greece: Agricultural sector output
Intermediate consumption
Subsidies
Gross value added (excl. subsidies)
Source: Eurostat/Economic Accounts of Agriculture, NBG estimates
0% 20% 40% 60% 80% 100%
FinlandLatvia
SlovakiaSweden
LuxembourgBelgiumNorway
Czech RepublicIreland
DenmarkLithuaniaGermany
PolandSwitzerland
BulgariaAustria
PortugalEstonia
HungaryCroatia
SloveniaFrance
United KingdomNetherlands
GreeceRomania
MaltaSpain
CyprusItaly
Agricultural sector output
Gross value added (excl. subsidies)SubsidiesIntermediate consumption
Source: Eurostat/Economic Accounts of Agriculture, NBG estimates
70%
52%
52%
42%
40%
0% 20% 40% 60% 80%
Western Europe
Mediterranean
Scandinavia
Central-Eastern Europe
Greece
Manufacturing value added of agricultural products
(% agricultural output*)
Source: Eurostat, NBG estimates
* excluding subsidies
per cent on average in EU) - covering 2.9 per cent of GDP in 2014,
from 6.4 per cent in 1994 (but still higher than the EU average of
1.2 per cent of GDP in 2014). However, agricultural value added
accounts for a large share of agricultural production in Greece
compared with the EU average (39 per cent and 30 per cent,
respectively) mainly reflecting the fact that Greece has a relatively
high contribution of permanent crops (e.g. olive trees), covering 30
per cent of total agricultural production versus 9 per cent in the EU
and thus has lower seeds and forage needs.
Against this background, Greek agricultural products lost market
share both in the world (from 0.8 per cent in 1993 to 0.3 per cent
in 2013) as well as in Europe (from 4.5 per cent in 1993 to 2.8 per
cent in 2013). Specifically, all subsectors of the Greek food market
lost considerable ground in the international market – with Greece’s
main exports posting the largest drops (with oil crops losing 2.2 pps
of the world market, and fruit and vegetables losing more than 1
pp). Dairy products proved to be the most resilient, posting a
reduction of about 0.2 pps (covering 0.4 per cent of the world
production in 2013 from 0.6 per cent in 1991).
…(ii) manufacturing value added …
Indicative of the sector’s disappointing strategy is the fact that the
food supply chain in Greece appears to have a limited
manufacturing component compared with other European regions.
Specifically, the ratio of food manufacturing value added to
agricultural production (excluding subsidies) is 40 per cent in
Greece compared with 70 per cent, on average, in Western Europe.
This development pinpoints the fact that a large share of Greek
agricultural products is actually consumed or exported in bulk form
(e.g. 73 per cent of olive oil versus 20 per cent in Italy), and thus
there is substantial unexploited potential for further value added
creation by the Greek agro-food industry.
… and (iii) performance in international markets
While devoting a large share of its resources to the agricultural
sector (equivalent in value-added terms to 2.9 per cent of GDP
compared with an EU average of about 1.2 per cent), Greece is a
net importer of food products posting a trade deficit of €1.2bn in

NATIONAL BANK OF GREECE Sectoral Report December 2015 5
y = 4,3118x - 0,2348R² = 0,3562
-60%
-40%
-20%
0%
20%
40%
0% 5% 10% 15%
Tra
de B
ala
nce
/(Export
s+Im
port
s)
Agricultural Production/GDP
Food Trade Balances in European Countries
Spain
Italy
Greece
Source: Eurostat, NBG Estimations
Bulgaria
5
12
17
6
0
5
10
15
20
Greece Mediterran. Europe World
ha
Average size of farms
Source: World Bank, Eurostat, NBG estimates
52% 44%29%
25%19%
15%
18%
18%
26%
4%
8%14%
11% 16%
0%
20%
40%
60%
80%
100%
Greece Mediterranean Europe
% o
f fa
rms
Size structure of European farms
(0-2] ha (2-5] ha (5-20] ha
(20-50] ha >50 ha
Source: Eurostat, NBG estimates
2014 (from €1.7bn in 2005)1 versus a trade surplus of €9bn for the
EU as a whole. Also note that if we take into account the inputs for
agricultural production (e.g. seeds, animal feed, fertilizers), the
food trade deficit widens by about €1.1bn (thus reaching €2.3bn in
2014)2. The problem is that, while the import-dependency in the
Greek food sector is relatively low (27 per cent vs 46 per cent in the
EU), the extroversion of the agro-food industry is even lower (21
per cent of production value vs 47 per cent in the EU). Note that
import dependency is proxied by the ratio of the value of food
imports to the food production value (agricultural
production+0.5*food manufacturing production), while the degree
of extroversion is proxied by the ratio of the value of food exports
to the food production value (agricultural production+0.5*food
manufacturing production).
IDENTIFYING THE STRUCTURAL PROBLEMS OF THE GREEK
AGRICULTURAL SECTOR
Against this background, the focus of our analysis turns towards
investigating the reasons why Greece has proven unable to exploit
the flourishing global demand for food products. This fact is
frustrating considering that Greece’s climate is extremely favorable
for the production of several agricultural products. In particular, the
sunny weather conditions and the existence of an extended
coastline provide natural competitive advantages for growing high
quality products, especially fruit and vegetables. Therefore, the
factors that hinder the growth of Greek agricultural sector must be
sought in structural inefficiencies, restricting it from realizing its
potential.
The sector is characterized by small and fragmented agricultural
holdings…
Most agricultural units in Greece are small, family-owned holdings.
Specifically, the average farm is about 4.8 ha (compared with 12.5
ha on average in other Mediterranean countries), with more than ½
being extremely small, i.e. smaller than 2 ha (versus 44 per cent in
other Mediterranean countries). Sole holders and other family
members cover 83 per cent of employment (in terms of annual
working units (AWU)), slightly higher than the Mediterranean
1 Note that this analysis concerns the period between 2005-2006 and 2013-2014 (due to volatilities in annual agricultural production). 2 Greece is a net importer of agricultural inputs (€0.2bn total exports and €1.3bn total imports). It should be noted that most European countries are net importers of agricultural inputs (with the exception of The Netherlands and Belgium).

NATIONAL BANK OF GREECE Sectoral Report December 2015 6
0%
20%
40%
60%
80%
Fin
land
Neth
erlands
Denm
ark
Irela
nd
Sw
eden
Fra
nce
Malta
Aust
ria
Belg
ium
Slo
venia
Germ
any
Spain
Italy
Port
ugal
Cze
ch R
ep.
Latv
iaPola
nd
Est
onia
Hungary
Gre
ece
Slo
vakia
Lithuania UK
% a
gricu
ltura
l sa
les
Market share of cooperatives in agriculture
Source: European Commission: "Support for Farmers' Cooperatives", November 2012
R² = 80%
1
3
5
7
1 3 5 7
pro
duct
ion p
roce
ss s
ophis
tica
tion
(sca
le fro
m 1
to 7
)
company spending on R&D(scale from 1 to 7)
Technology and business sophistication
Source: WEF/Global Competitiveness Report 2014-15, NBG estimates
Chile
Denmark
Estonia
Germany
Greece
Ireland
Israel
Italy
Japan
KoreaNetherl.
Norway
Spain
Turkey
UK
US
China0%
1%
2%
3%
4%
5%
0% 1% 2% 3% 4% 5%Agric.
R&
D/A
gric.
Valu
e A
dded
Total R&D/GDP
R&D expenditure/ Added ValueAgriculture vs. Total Economy
Source: OECD, Faostat, NBG estimates
average (74 per cent). The most important effect of small holdings
is the cost disadvantage since Greek farmers cannot benefit from
economies of scale like many of their competitors.
… inefficient organization
The organization of farmers in cooperatives is a common practice in
agriculture, aiming to limit the negative consequences of
fragmented production and increase the bargaining power of
smaller farmers. However, agricultural cooperatives have a small
market share of about ⅕ in the Greek market, compared with 40
per cent on average in Europe3. Moreover, Greek cooperatives face
problems regarding their efficiency, including quality control and
traceability, hindering the promotion of premium products.
Therefore, their operation is often limited to the distribution of
production subsidies to farm owners and other administrational
activities for production of products in bulk, instead of acting as an
organized enterprise with a clear business strategy.
… and low technological and knowledge sophistication…
In addition, the technological sophistication of agricultural
production is inferior compared with other EU countries. Specifically,
while global expenditure on agricultural R&D has doubled during the
past two decades, reaching €27bn in 2012 (in PPP terms)4, Greece
remained a laggard in this field. In fact, R&D investments in Greek
agriculture amount to just €38mn annually or €11/ha (compared
with €33/ha on average in the EU and €19/ha globally). An
important factor hindering R&D is the poor links with research
institutions. As a result, Greece has not taken advantage of the
global trend for a more sophisticated and efficient agricultural
production (e.g. improve production yield and quality as well as
resistance to disease).
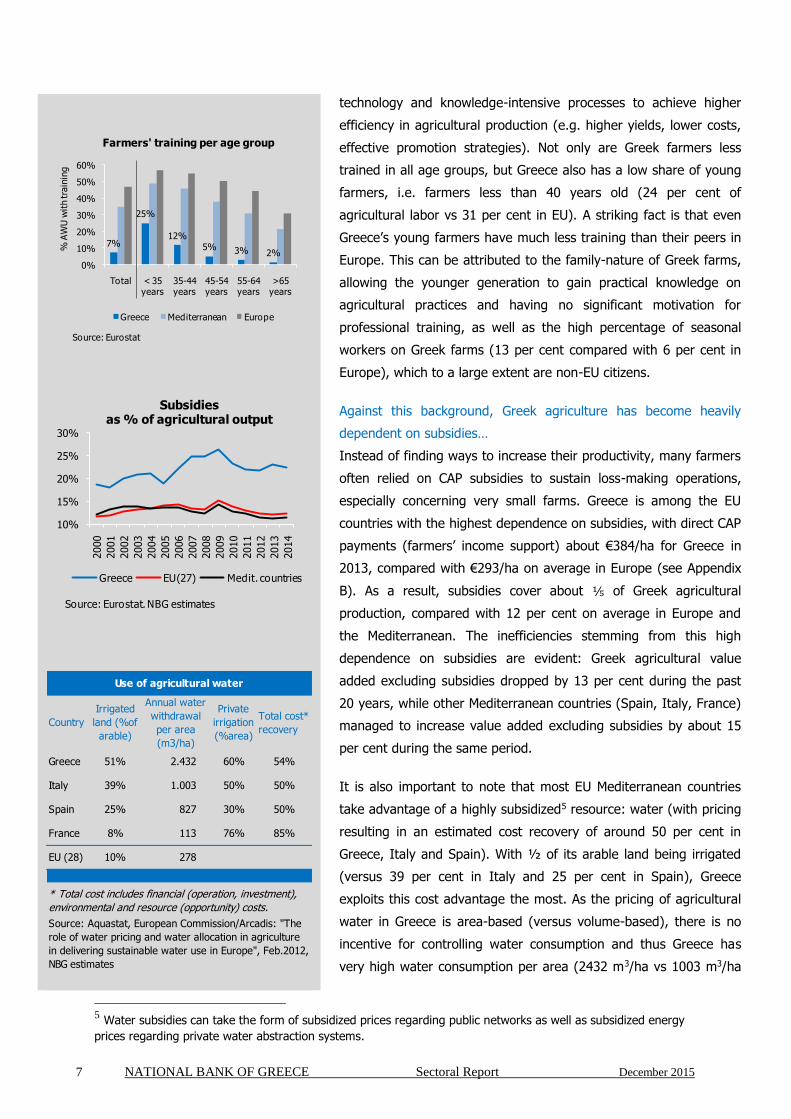
A secondary explanation for the low usage of technological
advancement is the fact that only 7 per cent of employees have
professional training (partly due to the family-nature of Greek
farms), compared with 50 per cent in Europe. To understand this
training gap, one should examine training by age group, since the
average age of agricultural employees is correlated to the use of
3 Finland, The Netherlands and Belgium are the countries where cooperatives have the highest market share,
covering 65-75 per cent of the respective markets, mainly concerning dairy production. 4 Indicative of the increase in R&D activity in the global agricultural sector is the growing use of genetically modified seeds. Specifically, the global market for genetically modified seeds has posted an average annual growth of about 15 per cent during the past 5 years, reaching a value of €23bn in 2012, which is equivalent to ⅓ of the global seed market
(from 25 per cent in 2008).
NATIONAL BANK OF GREECE Sectoral Report December 2015 7
7%
25%
12%5% 3% 2%
0%
10%
20%
30%
40%
50%
60%
Total < 35 years
35-44 years
45-54 years
55-64 years
>65 years
% A
WU
wit
h tra
inin
g
Farmers' training per age group
Greece Mediterranean Europe
Source: Eurostat
10%
15%
20%
25%
30%
2000
2001
2002
2003
2004
2005
2006
2007
2008
2009
2010
2011
2012
2013
2014
Subsidies as % of agricultural output
Greece EU(27) Medit. countries
Source: Eurostat, NBG estimates
Country
Irrigated
land (%of
arable)
Annual water
withdrawal
per area
(m3/ha)
Private
irrigation
(%area)
Total cost*
recovery
Greece 51% 2.432 60% 54%
Italy 39% 1.003 50% 50%
Spain 25% 827 30% 50%
France 8% 113 76% 85%
EU (28) 10% 278
Use of agricultural water
* Total cost includes financial (operation, investment),
environmental and resource (opportunity) costs.
Source: Aquastat, European Commission/Arcadis: "The
role of water pricing and water allocation in agriculture
in delivering sustainable water use in Europe", Feb.2012,
NBG estimates
technology and knowledge-intensive processes to achieve higher
efficiency in agricultural production (e.g. higher yields, lower costs,
effective promotion strategies). Not only are Greek farmers less
trained in all age groups, but Greece also has a low share of young
farmers, i.e. farmers less than 40 years old (24 per cent of
agricultural labor vs 31 per cent in EU). A striking fact is that even
Greece’s young farmers have much less training than their peers in
Europe. This can be attributed to the family-nature of Greek farms,
allowing the younger generation to gain practical knowledge on
agricultural practices and having no significant motivation for
professional training, as well as the high percentage of seasonal
workers on Greek farms (13 per cent compared with 6 per cent in
Europe), which to a large extent are non-EU citizens.
Against this background, Greek agriculture has become heavily
dependent on subsidies…
Instead of finding ways to increase their productivity, many farmers
often relied on CAP subsidies to sustain loss-making operations,
especially concerning very small farms. Greece is among the EU
countries with the highest dependence on subsidies, with direct CAP
payments (farmers’ income support) about €384/ha for Greece in
2013, compared with €293/ha on average in Europe (see Appendix
B). As a result, subsidies cover about ⅕ of Greek agricultural
production, compared with 12 per cent on average in Europe and
the Mediterranean. The inefficiencies stemming from this high
dependence on subsidies are evident: Greek agricultural value
added excluding subsidies dropped by 13 per cent during the past
20 years, while other Mediterranean countries (Spain, Italy, France)
managed to increase value added excluding subsidies by about 15
per cent during the same period.
It is also important to note that most EU Mediterranean countries
take advantage of a highly subsidized5 resource: water (with pricing
resulting in an estimated cost recovery of around 50 per cent in
Greece, Italy and Spain). With ½ of its arable land being irrigated
(versus 39 per cent in Italy and 25 per cent in Spain), Greece
exploits this cost advantage the most. As the pricing of agricultural
water in Greece is area-based (versus volume-based), there is no
incentive for controlling water consumption and thus Greece has
very high water consumption per area (2432 m3/ha vs 1003 m3/ha
5 Water subsidies can take the form of subsidized prices regarding public networks as well as subsidized energy
prices regarding private water abstraction systems.
NATIONAL BANK OF GREECE Sectoral Report December 2015 8
79
337
273 269
57
0
100
200
300
400
Greece(25th)
France(1st)
Spain(3rd)
Italy(4th)
Portugal(32nd)
index (
EU
28=
100)
Branding Index for agricultural products
Source: Eurostat, NBG estimates
* the branding index is based on the relative export price of agricultural products (taking into account the market share of each product)
0
150
300
450
600
750
900
Italy
Germ
any
UK
Bulg
aria
USA
Cypru
s
Spain
Russ
ia
Neth
erl.
Fra
nce
mill
ion €
Top 10 export markets(70% of Greek exports)
Fruit Vegetables Fish
Olive Oil Dairy Other
Source: Eurostat, NBG calculations
- 250 500 750 1.000 1.250
Other
Non-alcoh. drinks
Wine
Meat
Alcoh. drinks
Other oil crops
Sugar, coffee etc
Cereals
Dairy
Olive Oil
Fish
Vegetables
Fruit
million €
Value of Greek food trade by product
Exports Imports
Source: Eurostat (2013), NBG calculations
in Italy and 827 m3/ha in Spain). Excluding water subsidies, the
value added of agriculture is reduced considerably.
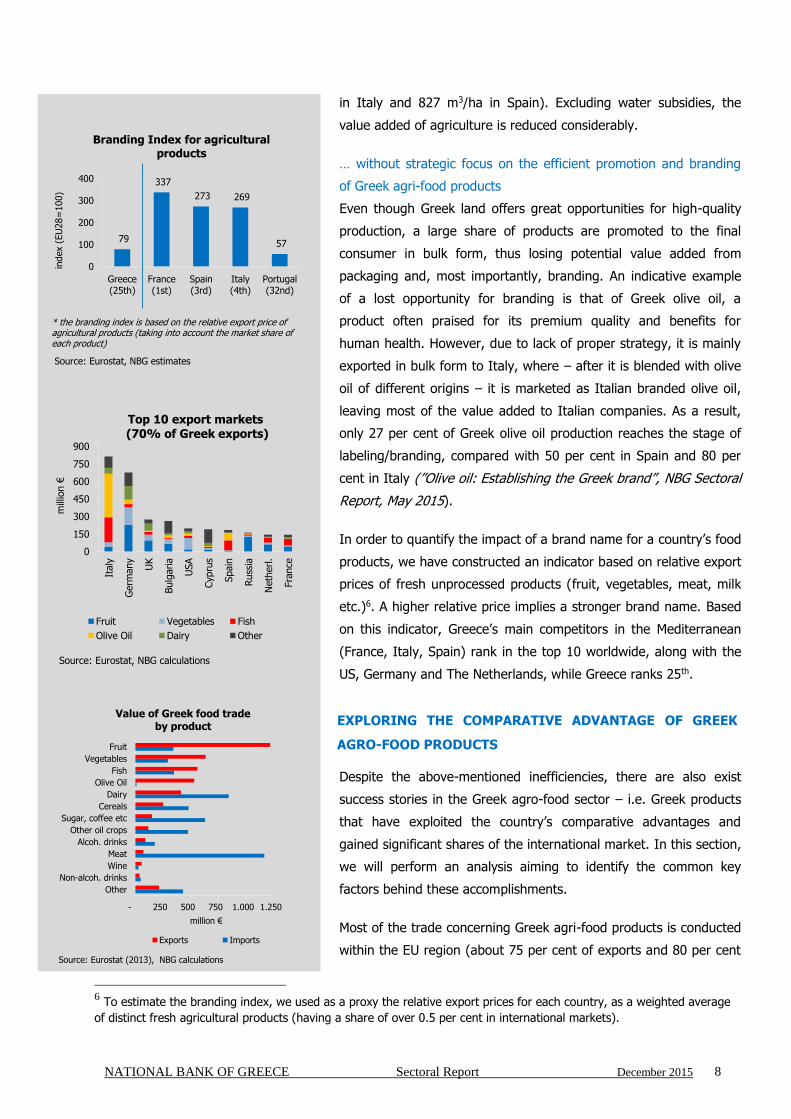
… without strategic focus on the efficient promotion and branding
of Greek agri-food products
Even though Greek land offers great opportunities for high-quality
production, a large share of products are promoted to the final
consumer in bulk form, thus losing potential value added from
packaging and, most importantly, branding. An indicative example
of a lost opportunity for branding is that of Greek olive oil, a
product often praised for its premium quality and benefits for
human health. However, due to lack of proper strategy, it is mainly
exported in bulk form to Italy, where – after it is blended with olive
oil of different origins – it is marketed as Italian branded olive oil,
leaving most of the value added to Italian companies. As a result,
only 27 per cent of Greek olive oil production reaches the stage of
labeling/branding, compared with 50 per cent in Spain and 80 per
cent in Italy (”Olive oil: Establishing the Greek brand”, NBG Sectoral
Report, May 2015).
In order to quantify the impact of a brand name for a country’s food
products, we have constructed an indicator based on relative export
prices of fresh unprocessed products (fruit, vegetables, meat, milk
etc.)6. A higher relative price implies a stronger brand name. Based
on this indicator, Greece’s main competitors in the Mediterranean
(France, Italy, Spain) rank in the top 10 worldwide, along with the
US, Germany and The Netherlands, while Greece ranks 25th.
EXPLORING THE COMPARATIVE ADVANTAGE OF GREEK
AGRO-FOOD PRODUCTS
Despite the above-mentioned inefficiencies, there are also exist
success stories in the Greek agro-food sector – i.e. Greek products
that have exploited the country’s comparative advantages and
gained significant shares of the international market. In this section,
we will perform an analysis aiming to identify the common key
factors behind these accomplishments.
Most of the trade concerning Greek agri-food products is conducted
within the EU region (about 75 per cent of exports and 80 per cent
6 To estimate the branding index, we used as a proxy the relative export prices for each country, as a weighted average
of distinct fresh agricultural products (having a share of over 0.5 per cent in international markets).
NATIONAL BANK OF GREECE Sectoral Report December 2015 9
19%
15%
6% 6%5% 4% 4% 4% 3% 3%2%
1% 1%
13%
1%
26%
1% 1% 0% 0%
0%
5%
10%
15%
20%
25%
30%
Italy
Germ
any
UK
Bulg
aria
USA
Cypru
s
Spain
Russ
ia
Neth
erl.
Fra
nce
Main export partners andGreek products' penetration
% of Greek agric. exports
% of Greek products in target market's agric. imports
Source: Eurostat
Regions
Share of
Region in
Greek Exports
2013 ↓
Greek
Exports/Region's
Food Imports
2013
Change of the
Share of Greek
Exports/Region's
Food Imports*
European Union 76,5% 0,8% -0,1%
Eurozone 56,7% 0,8% -0,2%
Germany 15,3% 0,9% -0,2%
France 3,3% 0,3% 0,0%
U.K. 6,2% 0,6% -0,1%
Netherlands 3,3% 0,3% -0,1%
Italy 18,5% 2,2% -0,6%
Spain 4,2% 0,7% -0,1%
Scandinavia 3,0% 0,5% 0,1%
S.E.Europe 14,5% 3,5% 1,2%
Asia 4,1% 0,1% 0,0%
China 0,5% 0,0% 0,0%
India 0,1% 0,0% 0,0%
Japan 0,5% 0,0% 0,0%
Arab Countries 1,8% 0,1% -0,1%
Rest Europe 10,7% 0,7% 0,0%
Russia 3,6% 0,5% 0,2%
Turkey 0,9% 0,5% -0,5%
North America 5,6% 0,2% 0,0%
Africa 1,3% 0,1% 0,0%
Egypt 0,6% 0,3% 0,2%
Latin America 0,5% 0,0% 0,0%
Brazil 0,1% 0,0% 0,0%
Mexico 0,2% 0,0% 0,0%
Oceania 1,3% 0,4% -0,2%
Total World 100,0% 0,4% -0,1%
Greek food exports per region
*Period 2005 - 2013
Source: Eurostat, WTO, NBG Estimates
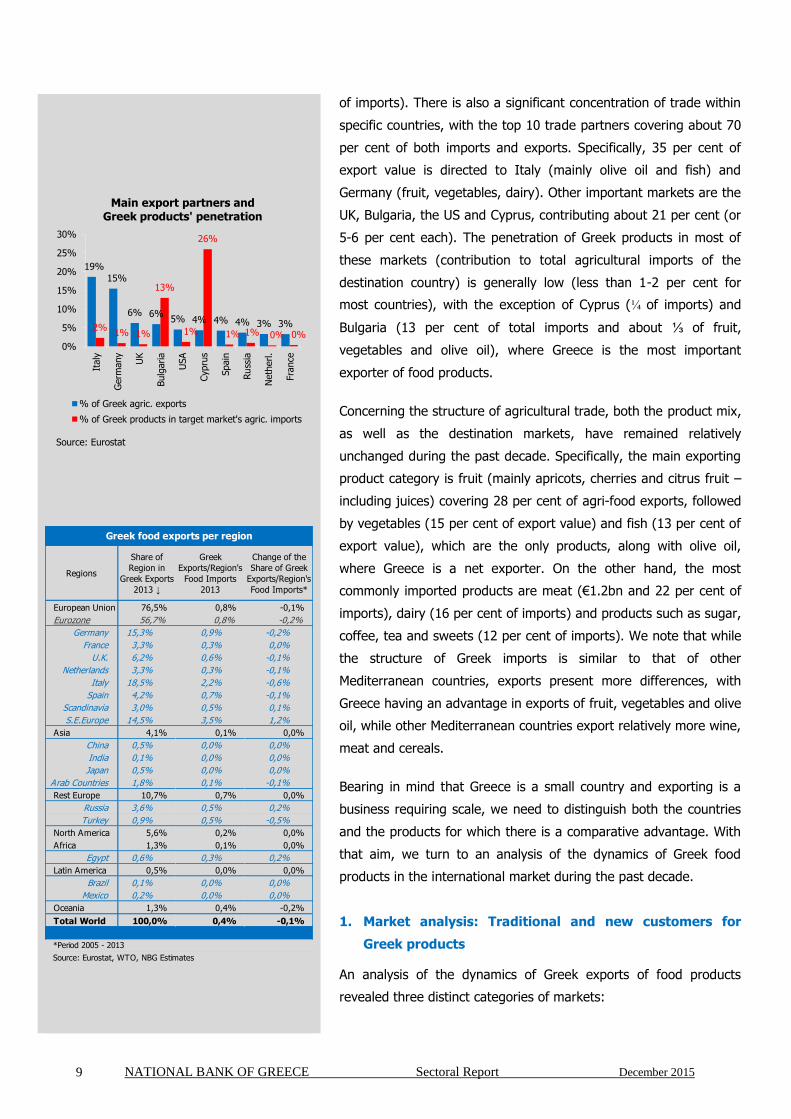
of imports). There is also a significant concentration of trade within
specific countries, with the top 10 trade partners covering about 70
per cent of both imports and exports. Specifically, 35 per cent of
export value is directed to Italy (mainly olive oil and fish) and
Germany (fruit, vegetables, dairy). Other important markets are the
UK, Bulgaria, the US and Cyprus, contributing about 21 per cent (or
5-6 per cent each). The penetration of Greek products in most of
these markets (contribution to total agricultural imports of the
destination country) is generally low (less than 1-2 per cent for
most countries), with the exception of Cyprus (¼ of imports) and
Bulgaria (13 per cent of total imports and about ⅓ of fruit,
vegetables and olive oil), where Greece is the most important
exporter of food products.
Concerning the structure of agricultural trade, both the product mix,
as well as the destination markets, have remained relatively
unchanged during the past decade. Specifically, the main exporting
product category is fruit (mainly apricots, cherries and citrus fruit –
including juices) covering 28 per cent of agri-food exports, followed
by vegetables (15 per cent of export value) and fish (13 per cent of
export value), which are the only products, along with olive oil,
where Greece is a net exporter. On the other hand, the most
commonly imported products are meat (€1.2bn and 22 per cent of
imports), dairy (16 per cent of imports) and products such as sugar,
coffee, tea and sweets (12 per cent of imports). We note that while
the structure of Greek imports is similar to that of other
Mediterranean countries, exports present more differences, with
Greece having an advantage in exports of fruit, vegetables and olive
oil, while other Mediterranean countries export relatively more wine,
meat and cereals.
Bearing in mind that Greece is a small country and exporting is a
business requiring scale, we need to distinguish both the countries
and the products for which there is a comparative advantage. With
that aim, we turn to an analysis of the dynamics of Greek food
products in the international market during the past decade.
1. Market analysis: Traditional and new customers for
Greek products
An analysis of the dynamics of Greek exports of food products
revealed three distinct categories of markets:
NATIONAL BANK OF GREECE Sectoral Report December 2015 10
Regions
Share of
Region in
Italian Exports
2013 ↓
Italian
Exports/Region's
Food Imports
2013
Change of the
Share of Italian
Exports/Region's
Food Imports*
European Union 67,3% 5,1% -0,3%
Eurozone 52,4% 5,1% -0,4%
Germany 19,2% 8,5% -1,3%
France 11,9% 8,4% 0,0%
U.K. 8,5% 5,7% 0,3%
Netherlands 3,5% 2,3% -0,1%
Italy 0,0% 0,0% 0,0%
Spain 3,5% 4,0% -0,8%
Scandinavia 3,6% 4,1% 0,1%
S.E.Europe 4,5% 7,9% -1,8%
Asia 7,7% 0,7% 0,0%
China 1,4% 0,5% 0,2%
India 0,2% 0,4% 0,2%
Japan 2,2% 1,3% 0,2%
Arab Countries 1,8% 1,0% 0,1%
Rest Europe 8,4% 3,9% -1,1%
Russia 2,0% 2,1% 0,0%
Turkey 0,5% 1,9% -0,8%
North America 10,8% 2,9% -0,4%
Africa 3,0% 2,0% -0,1%
Egypt 0,2% 0,7% 0,0%
Latin America 1,4% 0,7% 0,0%
Brazil 0,5% 1,8% -0,1%
Mexico 0,3% 0,5% 0,1%
Oceania 1,4% 3,2% -0,2%
Total World 100,0% 3,0% -0,6%
Italian food exports per region
*Period 2005 - 2013
Source: Eurostat, WTO, NBG Estimates
Regions Greece Italy EU28
European Union 5,0% 6,1% 7,3% 7,3%
Eurozone 3,4% 5,6% 6,7% 7,2%
Germany 4,2% 4,9% 6,8% 7,5%
France 4,4% 6,6% 6,3% 6,7%
U.K. 1,9% 5,5% 5,1% 4,6%
Netherlands 3,9% 8,6% 8,4% 9,8%
Italy 1,1% - 3,8% 4,6%
Spain 2,6% 1,1% 3,2% 3,9%
Scandinavia 13,8% 8,9% 8,6% 8,6%
S.E.Europe 20,2% 5,4% 12,1% 9,6%
Asia 10,6% 19,6% 16,6% 18,1%
China 38,7% 72,8% 55,3% 34,9%
India 121,7% 54,5% 20,3% 28,7%
Japan 6,1% 6,5% 2,1% 3,2%
Arab Countries 9,5% 29,7% 16,5% 25,6%
Rest Europe 14,9% 9,4% 13,6% 15,6%
Russia 36,9% 17,7% 16,5% 18,3%
Turkey 7,7% 15,1% 17,0% 26,1%
North America 7,8% 5,2% 4,6% 7,9%
Africa 16,8% 13,9% 18,6% 15,6%
Egypt 97,1% 24,3% 20,5% 21,9%
Latin America 55,6% 16,1% 12,7% 15,5%
Brazil 58,3% 28,4% 28,4% 30,2%
Mexico 101,2% 13,2% 8,1% 9,6%
Oceania 5,4% 12,5% 13,2% 13,8%
Total World 6,2% 7,2% 8,5% 11,3%
Source: Eurostat, WTO, NBG Estimates
Annual Growth Rates
Annual Growth of Country's Exports*Annual Growth
Rates of the
Region's Food
Imports*
*Period 2005 - 2013
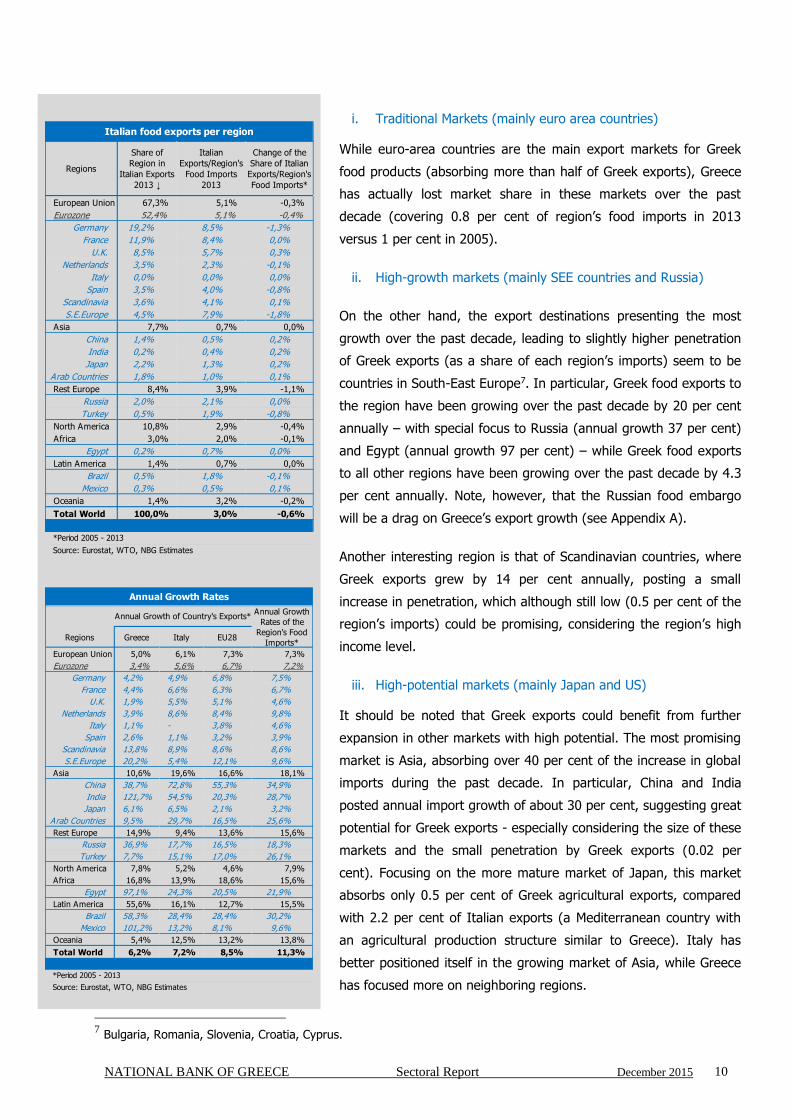
i. Traditional Markets (mainly euro area countries)
While euro-area countries are the main export markets for Greek
food products (absorbing more than half of Greek exports), Greece
has actually lost market share in these markets over the past
decade (covering 0.8 per cent of region’s food imports in 2013
versus 1 per cent in 2005).
ii. High-growth markets (mainly SEE countries and Russia)
On the other hand, the export destinations presenting the most
growth over the past decade, leading to slightly higher penetration
of Greek exports (as a share of each region’s imports) seem to be
countries in South-East Europe7. In particular, Greek food exports to
the region have been growing over the past decade by 20 per cent
annually – with special focus to Russia (annual growth 37 per cent)
and Egypt (annual growth 97 per cent) – while Greek food exports
to all other regions have been growing over the past decade by 4.3
per cent annually. Note, however, that the Russian food embargo
will be a drag on Greece’s export growth (see Appendix A).
Another interesting region is that of Scandinavian countries, where
Greek exports grew by 14 per cent annually, posting a small
increase in penetration, which although still low (0.5 per cent of the
region’s imports) could be promising, considering the region’s high
income level.
iii. High-potential markets (mainly Japan and US)
It should be noted that Greek exports could benefit from further
expansion in other markets with high potential. The most promising
market is Asia, absorbing over 40 per cent of the increase in global
imports during the past decade. In particular, China and India
posted annual import growth of about 30 per cent, suggesting great
potential for Greek exports - especially considering the size of these
markets and the small penetration by Greek exports (0.02 per
cent). Focusing on the more mature market of Japan, this market
absorbs only 0.5 per cent of Greek agricultural exports, compared
with 2.2 per cent of Italian exports (a Mediterranean country with
an agricultural production structure similar to Greece). Italy has
better positioned itself in the growing market of Asia, while Greece
has focused more on neighboring regions.
7 Bulgaria, Romania, Slovenia, Croatia, Cyprus.

NATIONAL BANK OF GREECE Sectoral Report December 2015 11
yogurt
fetacherries
strawberries
olives
tomatoes
sea bass -sea bream
oranges
olive oil
meat
milk
potatoes
-100%
-75%
-50%
-25%
0%
25%
50%
75%
100%
-0,5 0,5 1,5 2,5 3,5
Change in M
ark
et
Share
(2005-2
014)
Revealed Comparative Advantage
Food Products: Greek Exports
HIGH-GROWTH PRODUCTS
LAGGARDS
Sources: Eurostat, Comtrade, Faostat, NBG Estimates
*Rescale has been done in order to show all the products.
i) gained market share
(24% of Greek food exports)
Olives Sesame
Dairy products Snails
White wine Fruit & vegetables
Honey preserved in vinegar
ii) bought market share
(12% of Greek food exports)
Apples Marmalades
Cherries Rice
Clementines Tomatoes
Strawberries Kiwis
iii) lost market share
(33% of Greek food exports)
Olive oil Oranges
Sea bass/bream Peaches
Grapes Apricots
Currants Watermelons
Figs Cucumbers
Prepared tomatoes
Asparagus
Mapping of Greek food products
with comparative advantage
(69% of Greek food exports)
A. High-Growth Products
B. Laggards
Source: Eurostat, Comtrade, Faostat, NBG estimates
2. Products’ analysis: High-growth products and laggards
With a view to identify specific products with a successful export
strategy, we have performed a relative comparative advantage
analysis using 68 products covering 81 per cent of Greek food
export value in 2014. Specifically, the product classification was
based on the following criteria:
Revealed Comparative Advantage 8: If a country’s share in
world exports of a specific commodity is greater than the
country’s overall share in total world exports, then the
country enjoys a comparative advantage in exporting that
commodity.
Change in penetration 9: Measuring the gain or loss of Greek
market share in world exports of a specific product between
2005 and 201410.
Based on the combination of these criteria, we distinguished two
product categories in which Greece has a comparative advantage in
the world markets:
A. High-growth products that have gained market share in the
international market during the past decade (covering 36
per cent of total Greek food exports in 2014 from 25 per
cent in 2005).
B. Laggards that have lost market share in the international
market during the past decade (covering 33 per cent of
total Greek food exports in 2014 from 38 per cent in 2005).
A. High-growth products
These products seem to have achieved their growth on two
types of strategies:
There are those which gained market share through a
quality promotion strategy and advanced production
procedures, remaining about 1.5 times more expensive than
their competitors. These products (covering about 27 per
cent of Greek exports) have managed to exploit their
special attributes and create high consumer awareness in
8 The RCA of a specific product (i) is calculated as , where X represents export value.
9 The penetration of a specific product (i) in the world market is calculated as , where X
represents export value. 10 We note that this analysis concerns the period between 2005-2006 and 2013-2014 (due to volatilities in annual
agricultural production).

NATIONAL BANK OF GREECE Sectoral Report December 2015 12
i) gained market share
Product form: Packaged/branded
Market penetration: High
Destination Market: High Income
ii) bought market share
Product form: Bulk
Market penetration: Low
Destination Market: Low Income
iii) lost market share
Product form: Bulk
Market penetration: High
Destination Market: Low Income & Italy
Strategies of Greek agro-food exports
A. High-Growth Products
B. Laggards
Source: Eurostat, Comtrade, Faostat, NBG estimates
international markets. They are mainly dairy products
(cheese and yogurt), olives, natural sweets and honey. The
most typical case of such a product is the Greek feta
cheese, which is recognized as a PDO product (protected
designation of origin) in the EU and increase its penetration
by 17 percentage points while increasing its relative price
by about 5 per cent between 2005 and 2014.
On the other hand there are products that bought their
market share (covering about 9 per cent of Greek food
exports). Specifically, they managed to increase their
market share by 0.8 percentage points on average, by
equally lowering their relative prices (0.8 per cent on
average lower than their competitors). These products
mainly include fresh fruit such as apples, cherries,
clementines, strawberries and kiwis. We note that, to a
large extent, they were newcomers to the international
market (as the average penetration of those Greek products
was below 1 per cent in 2005) and they used their low-price
strategy to target low-income markets of Eastern Europe
(including Russia).
B. Laggards
The products that lost market share despite their competitive
advantage covered ⅓ of Greek food exports. These include
products like olive oil, sea bass/sea bream, oranges, peaches
and apricots, cucumbers and watermelons. Their common
characteristic seems to be that they are exported in bulk form
and that they have a relatively high penetration in the global
market (about 4-5 per cent), suggesting that they have
exhausted the limits of buying market share.
This analysis suggests that the most effective exporting strategy is
to target high-income countries with branded Greek products in
packaged forms. On the other hand, exporting bulk products to low-
income countries has a clear growth ceiling and it can only be
sustained by continuously lowering prices.

NATIONAL BANK OF GREECE Sectoral Report December 2015 13
11
26
33
19
0
10
20
30
40
Greece Mediteran. EU(28) World
€per
ha
Agricultural R&D
Source: World Bank, Faostat, NBG estimates
Estonia
FranceGermany
Greece
Hungary
Ireland
Israel Italy
Netherl.
Norway
Spain
UK
Romania
0%
1%
2%
3%
4%
5%
0% 1% 2% 3% 4% 5%
Agriv R
&D
/Tota
l R&
D
Agric. Value Added/GDP
Agricultural sector contribution in total Value Added and R&D
Source: OECD, Faostat, NBG estimates
WHAT NEEDS TO BE DONE
Our analysis so far has led to two main conclusions for the
performance of Greek agricultural exports:
i. On the one hand, despite growing global agricultural
production and trade, Greece lost market share, even in
traditional export markets such as Germany and Italy. In
fact, the small size of agricultural farms (along with the
weak organizational capacity of cooperatives) places them
at a disadvantage in terms of cost and branding, and
therefore makes them more vulnerable to rising
international competition.
ii. On the other hand, there are undeniable success stories of
Greek agro-food products that have stood out in the
international market during the past decade.
Policy should focus on the actions that will combine Greece’s
comparative advantages with best practices applied in other
countries (see Box).
In that light, especially as agricultural production is highly
segmented in Greece, the establishment of a well-functioning
food value chain is a necessity, i.e. a strategic alliance between
farmers and other supply-chain partners to produce and
distribute significant volumes of high-quality, differentiated food
products11. Against this background, it seems fortunate that the
current juncture – with the new CAP focusing on supporting
innovative efforts, rather than offering direct subsidies, as well
as the new Horizon2020 initiative under the National Strategic
Reference Framework (NSRF) – is very supportive of such a
change in strategy.
Indeed, the building blocks of the new growth model of the
Greek agro-food sector should comprise:
The moderation of negative effects from the small size of
agricultural properties through the implementation of
initiatives to unite individual farmers in a common purpose
within some form of organization. Such an entity would
allow a much needed increase in bargaining power,
11 Food value chains exemplify “creating shared value” concept, introduced by Porter and Kramer. [Porter M. and
Kramer, M. (2011), “Creating shared value: How to reinvent capitalism and unleash a wave of innovation and growth”, Harvard Business Review, 6-77.]

NATIONAL BANK OF GREECE Sectoral Report December 2015 14
Spain
Denmark
Germany
Greece
FranceItaly Austria
Romania
Finland
Sweden
R² = 51%
0
10
20
30
40
50
30% 50% 70%Agricu
ltura
l R
&D
(€/h
a)
% of agricultural employeesless than 55 years old
Young farmers and business sophistication
Source: Eurostat, Faostat, NBG estimates
24%
31%
0% 10% 20% 30% 40%
PortugalIrelandGreece
SloveniaMalta
CroatiaAustriaFinland
GermanyBelgiumSlovakia
FranceItaly
LithuaniaEU avg
SwedenLatvia
PolandCzech Rep.
BulgariaLuxemb.RomaniaHungary
NetherlandsSpain
CyprusEstonia
Denmark
% empl. less than 40 years old
Young employment in agriculture
Source: Eurostat
considering the fact that both suppliers of seeds and food
distributors are highly concentrated and large players
control the international food market.
i. One way to accomplish this would be through a
more business-oriented operation of agricultural
cooperatives (which – despite a few exceptions -
focus on administrative activities instead of unifying
farmers and promoting agricultural products under
a single label). To this end, managing boards
including producers, marketers and researchers
should be formed. A successful example of a Greek
cooperative is Chios Mastiha Growers Association.
Apart from the collection of the local production,
this cooperative has taken considerable actions to
promote the product (through its subsidiary shop
chains, Mastiha Shops), to enhance its promotion
strategy by collaborating with universities and
research centers, and recently to recognize its
medicinal properties (and consequently sign a
contract with an international pharmaceutical
company, GNC).
ii. Another way to enhance efficiency would be
through the creation of supply chain agreements
between manufacturers and farmers12. In fact, the
examination of successful cases of branded
products with high export market shares reveal that
agricultural product promotion is more effective
through vertical integration. This usually involves a
manufacturing company or distributor organizing
smaller producers, taking measures to guarantee
stability in quality and quantity and promoting
agricultural production (achieving a critical mass)
under a common brand. Indicatively, about 14 per
cent of Greek farmers have benefited from contract
farming, while another 25 per cent are willing to try
it in the future, based on a survey of the Aristotle
12 Manufacturers form an agreement with farmers (or cooperatives) of their choosing for the delivery on a specific
date of a certain volume of production fulfilling certain criteria (product quality, method of production, viability of enterprise). The manufacturers often support the farmers through technical assistance. That process is often moderated by a financial institution which brings together the interested parties and provides financing under specific criteria. As a result, farmers cover their needs in working capital, minimize the uncertainty of demand and raise their bargaining power when purchasing supplies.

NATIONAL BANK OF GREECE Sectoral Report December 2015 15
- 20 40 60 80 100 120
Local supplier quantity
Local supplier quality
Business impact of rules onFDI
Business EnvironmentIndex*
Index (world avg=100)
Business Environment Index
Europe Greece
Source: WEF (Global Competitiveness Report 2015), World Bank (Doing Business report 2015), NBG estimates
* The Business Environment Index is calculated as the average of the three subcomponents.
33%44% 51%
35%
38% 22%19%
30%
16% 20%22% 24%
13% 14% 8% 11%
0%
20%
40%
60%
80%
100%
Greece Medit. EU28 World
Structure of agricultural production value
Meat-Dairy Fruit-Vegetables
Cereal Other crops
Source: Eurostat, Faostat, NBG estimates
University of Thessaloniki. Successful examples in
several EU countries include: i) brewing companies
with barley growers; ii) milk companies with
livestock breeders; and iii) wine companies with
grape growers.
Concerning the technological upgrade of the production
process, R&D could be promoted through the cooperation of
public institutions, research centers (e.g. universities) and
private companies, with the acquired knowledge and
research being managed and accessed through a single
entity. It should be noted that investment in technology
does not necessarily mean new inventions or discoveries. Ιt
could also involve adaptation of available technology to the
needs of specific products or regions (e.g. tailor-made
seeds) – especially in light of climatic change challenges.
Moreover, taking into account the biodiversity of its natural
environment, Greece could invest in the research of the
medicinal properties of unique domestic plants and promote
them to the high-growth natural pharmaceutical and
healthcare global industry.
Complimentary to this effort would be concerted actions to
undertake workforce development (training programs) as
well as introduction of incentives (through targeted use of
EU funds) in order to attract more young farmers to the
agricultural sector, which would better fit to promote
modernized production and targeted business strategies.
We note that young farmers (less than 40 years old) cover
about 24 per cent of Greek agricultural employment,
compared with 31 per cent in Europe.
Increasing production efficiency and producing a technically
superior product is not sufficient for agribusinesses to
develop competitive advantage, they also need to adopt
strategic planning models. In particular, they need to
develop strong brands, close relationships throughout the
supply chain and market orientation. The creation and
promotion of a national brand (or regional brands) with
specific characteristics as well as product certification (PDO,
PGI and certified seeds) could be helpful to that direction.
Apart from policy measures to attract FDI in food
manufacturing, it is also important to build infrastructure in

NATIONAL BANK OF GREECE Sectoral Report December 2015 16
order to promote efficiently our fresh products (note that 38
per cent of our agricultural production are fruit and
vegetables compared with 19 per cent on average in EU).
Due to the fragile and perishable nature of the product, this
subsector requires a high degree of coordination between
the different actors along the value chain. In particular, the
key supporting activities for the fresh products to reach
their destination in good condition are:
i. a packaging industry to supply the appropriate
containers and cold storage units on a regular and
reliable basis, and
ii. logistics and transportation services to ensure timely
delivery.
NATIONAL BANK OF GREECE Sectoral Report December 2015 17
BOX: INCREASING AGRICULTURAL PRODUCTIVITY –
CASE STUDIES FROM OTHER COUNTRIES
Drawing from best international practice, the analysis that follows
discusses the three main drivers of agricultural TFP (cooperatives,
branding and R&D) in order to provide practical guidance on how to
facilitate the adoption of efficient solutions in the agro-food sector.
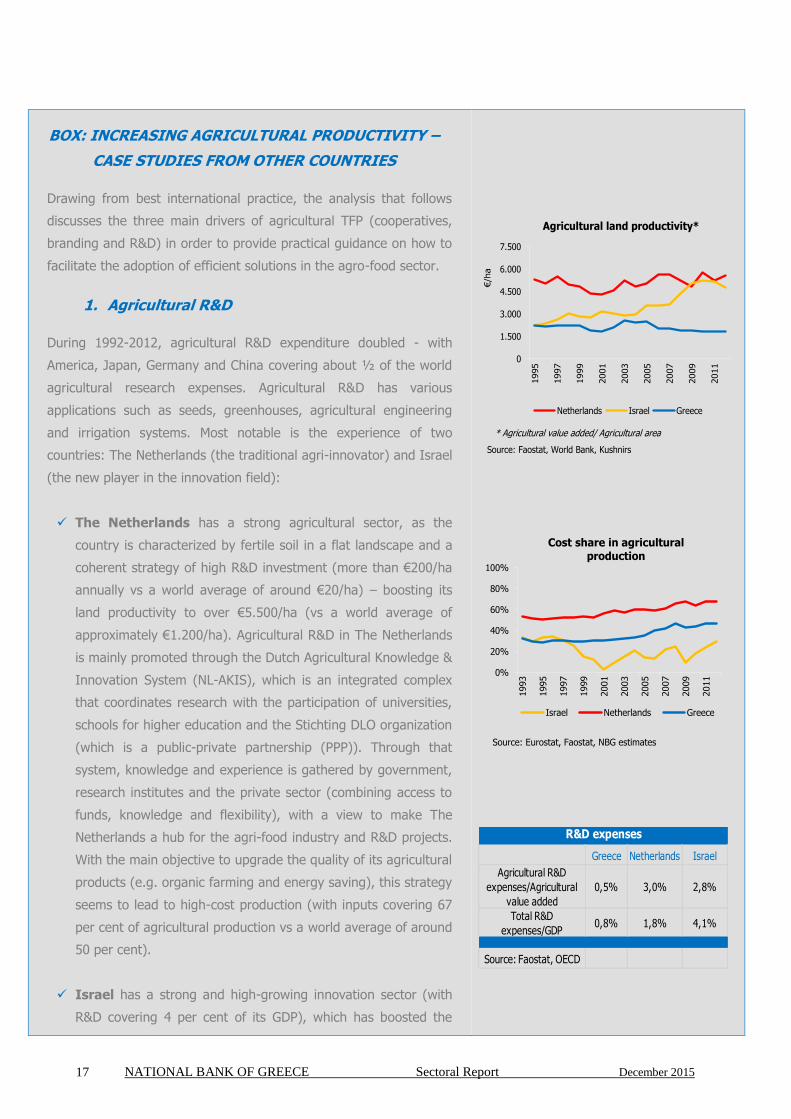
1. Agricultural R&D
During 1992-2012, agricultural R&D expenditure doubled - with
America, Japan, Germany and China covering about ½ of the world
agricultural research expenses. Agricultural R&D has various
applications such as seeds, greenhouses, agricultural engineering
and irrigation systems. Most notable is the experience of two
countries: The Netherlands (the traditional agri-innovator) and Israel
(the new player in the innovation field):
The Netherlands has a strong agricultural sector, as the
country is characterized by fertile soil in a flat landscape and a
coherent strategy of high R&D investment (more than €200/ha
annually vs a world average of around €20/ha) – boosting its
land productivity to over €5.500/ha (vs a world average of
approximately €1.200/ha). Agricultural R&D in The Netherlands
is mainly promoted through the Dutch Agricultural Knowledge &
Innovation System (NL-AKIS), which is an integrated complex
that coordinates research with the participation of universities,
schools for higher education and the Stichting DLO organization
(which is a public-private partnership (PPP)). Through that
system, knowledge and experience is gathered by government,
research institutes and the private sector (combining access to
funds, knowledge and flexibility), with a view to make The
Netherlands a hub for the agri-food industry and R&D projects.
With the main objective to upgrade the quality of its agricultural
products (e.g. organic farming and energy saving), this strategy
seems to lead to high-cost production (with inputs covering 67
per cent of agricultural production vs a world average of around
50 per cent).
Israel has a strong and high-growing innovation sector (with
R&D covering 4 per cent of its GDP), which has boosted the
0
1.500
3.000
4.500
6.000
7.500
1995
1997
1999
2001
2003
2005
2007
2009
2011
€/h
a
Agricultural land productivity*
Netherlands Israel Greece
Source: Faostat, World Bank, Kushnirs
* Agricultural value added/ Agricultural area
0%
20%
40%
60%
80%
100%
1993
1995
1997
1999
2001
2003
2005
2007
2009
2011
Cost share in agricultural production
Israel Netherlands Greece
Source: Eurostat, Faostat, NBG estimates
Greece Netherlands Israel
Agricultural R&D
expenses/Agricultural
value added
0,5% 3,0% 2,8%
Total R&D
expenses/GDP0,8% 1,8% 4,1%
R&D expenses
Source: Faostat, OECD

NATIONAL BANK OF GREECE Sectoral Report December 2015 18
productivity of almost every segment of its economy. Regarding
agriculture, the main objective of Israel’s R&D initiatives is to
provide solutions to the problem of scarcity of natural resources
(particularly water), considering that over half of the country is
arid or semi-arid. Facing those adverse natural conditions, it is
remarkable that Israel has raised its land productivity to the
level of the rich-in-natural-resources Netherlands. Agricultural
R&D in Israel is mainly promoted through public authorities and
specifically the Israeli Agricultural Research Organization (ARO),
which is responsible for about ¾ of the county’s agricultural
research and acts as the link between the research centers and
the farmers. With applications in several areas of agriculture
(from engineering agriculture and irrigation systems to resistant
seeds and productive cows), Israel has not only managed to
raise its agricultural land productivity significantly but also
succeeded to lower its production costs (29 per cent of
production value vs 67 per cent in The Netherlands).
2. Agricultural Cooperatives
EU agricultural cooperatives are mainly concentrated on the dairy
and the fruit and vegetables segments (covering 60 per cent of the
total cooperatives’ production) and have substantially different
development in each country (covering more than 60 per cent of
production in Finland, Denmark and The Netherlands and less than 5
per cent in Romania, Bulgaria and Cyprus).
Company-cooperatives
After numerous mergers between smaller cooperatives, some of
the North European cooperatives have become large international
companies ranking among the top companies of their sector, like
the Dutch Friesland Campina and the Danish Arla Foods (with their
annual turnover exceeding €10bn in 2014). At this point it is
important to note that large cooperatives are not a European
phenomenon. A typical non-EU example is Fonterra – a company-
cooperative in New Zealand, consisting of approximately 11,000
dairy producers (95 per cent of country’s dairy production). The
creation of this cooperative improved both the production volume
and the exports of milk and dairy products13.
Greece Netherlands Israel EU28
Inputs Index 161 123 148 100
Natural
Attributes 164 96 89 100
Technology
Index33 525 380 100
Brand Index 79 262 24 100
Cooperatives
Index44 174 105 100
* for index definitions see appendix
Source: World Databank, WEF, Eurostat, Faostat, NBG
estimates
Agricultural land productivity: Main factors*
Dairy33%
Fruit & Vegetables
27%
Cereals18%
Pig meat10%
Wine8%
Olives3%
Sugar1%
Sheep meat0%
Value of Produce Marketed by Cooperatives in EU, 2010
Source: Support for Farmers' Cooperatives, European
Commission Final Report
0%
20%
40%
60%
80%
Fin
land
Neth
erlands
Denm
ark
Irela
nd
Sw
eden
Fra
nce
Malta
Aust
ria
Belg
ium
Slo
venia
Germ
any
Spain
Italy
Port
ugal
Cze
ch R
ep.
Latv
iaPola
nd
Est
onia
Hungary
Gre
ece
Slo
vakia
Lithuania UK
% a
gricu
ltura
l sa
les
Market share of cooperatives in agriculture
Source: European Commission: "Support for Farmers' Cooperatives", November 2012
13 After the dairy industry restructuring act 2001 in New Zealand, the milk production increased by 67 per cent during
2001-2014. Simultaneously, the increase in production led to an annual average export growth of about 28% during 2001-2014 stemming from both the price and the production volume increase (while the annual average export growth was only 4% during 1994-2000).
NATIONAL BANK OF GREECE Sectoral Report December 2015 19
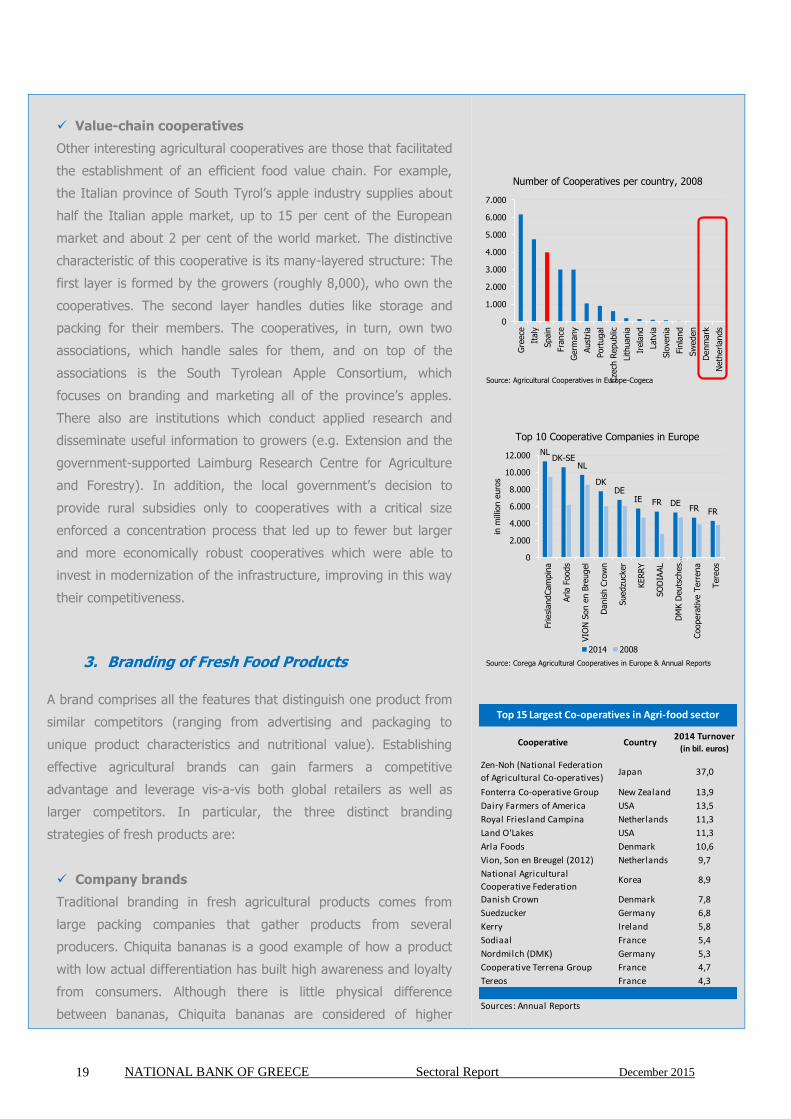
Value-chain cooperatives
Other interesting agricultural cooperatives are those that facilitated
the establishment of an efficient food value chain. For example,
the Italian province of South Tyrol’s apple industry supplies about
half the Italian apple market, up to 15 per cent of the European
market and about 2 per cent of the world market. The distinctive
characteristic of this cooperative is its many-layered structure: The
first layer is formed by the growers (roughly 8,000), who own the
cooperatives. The second layer handles duties like storage and
packing for their members. The cooperatives, in turn, own two
associations, which handle sales for them, and on top of the
associations is the South Tyrolean Apple Consortium, which
focuses on branding and marketing all of the province’s apples.
There also are institutions which conduct applied research and
disseminate useful information to growers (e.g. Extension and the
government-supported Laimburg Research Centre for Agriculture
and Forestry). In addition, the local government’s decision to
provide rural subsidies only to cooperatives with a critical size
enforced a concentration process that led up to fewer but larger
and more economically robust cooperatives which were able to
invest in modernization of the infrastructure, improving in this way
their competitiveness.
3. Branding of Fresh Food Products
A brand comprises all the features that distinguish one product from
similar competitors (ranging from advertising and packaging to
unique product characteristics and nutritional value). Establishing
effective agricultural brands can gain farmers a competitive
advantage and leverage vis-a-vis both global retailers as well as
larger competitors. In particular, the three distinct branding
strategies of fresh products are:
Company brands
Traditional branding in fresh agricultural products comes from
large packing companies that gather products from several
producers. Chiquita bananas is a good example of how a product
with low actual differentiation has built high awareness and loyalty
from consumers. Although there is little physical difference
between bananas, Chiquita bananas are considered of higher
0
1.000
2.000
3.000
4.000
5.000
6.000
7.000
Gre
ece
Italy
Spain
Fra
nce
Germ
any
Aust
ria
Port
ugal
Cze
ch R
epublic
Lithuania
Irela
nd
Latv
ia
Slo
venia
Fin
land
Sw
eden
Denm
ark
Neth
erlands
Number of Cooperatives per country, 2008
Source: Agricultural Cooperatives in Europe-Cogeca
NLDK-SE
NL
DKDE
IE FR DEFR FR
0
2.000
4.000
6.000
8.000
10.000
12.000
Friesl
andCam
pin
a
Arla F
oods
VIO
N S
on e
n B
reugel
Danis
h C
row
n
Suedzu
cker
KERRY
SO
DIA
AL
DM
K D
euts
ches…
Coopera
tive T
err
ena
Tere
os
in m
illio
n e
uro
s
Top 10 Cooperative Companies in Europe
2014 2008
Source: Corega Agricultural Cooperatives in Europe & Annual Reports
Cooperative Country2014 Turnover
(in bil. euros)
Zen-Noh (National Federation
of Agricultural Co-operatives)Japan 37,0
Fonterra Co-operative Group New Zealand 13,9
Dairy Farmers of America USA 13,5
Royal Friesland Campina Netherlands 11,3
Land O'Lakes USA 11,3
Arla Foods Denmark 10,6
Vion, Son en Breugel (2012) Netherlands 9,7
National Agricultural
Cooperative FederationKorea 8,9
Danish Crown Denmark 7,8
Suedzucker Germany 6,8
Kerry Ireland 5,8
Sodiaal France 5,4
Nordmilch (DMK) Germany 5,3
Cooperative Terrena Group France 4,7
Tereos France 4,3
Sources: Annual Reports
Top 15 Largest Co-operatives in Agri-food sector

NATIONAL BANK OF GREECE Sectoral Report December 2015 20
quality. All this is a result of a very well-organized distribution
network and a sustained promotional effort (the company spent
$28mn on advertising in 2014). Other examples of this branding
strategy include Rooster potatoes (Bartlett Ltd), Jablum coffee and
Bolthouse farms juices.
Varietal brands
Another business model of food branding is based on the
development of a distinct variety of a common product. In this
case, a company develops, under specific standards, a special
variety of a high-quality product. Then the company provides
technical support throughout the cultivation period of the product
and finally undertakes the promotion under its own brand or
trademark. The branded products must follow a consistent look
and feel, as well as meet certain quality specifications, in order to
capture and maintain consumer loyalty. Some well-known
examples of this type of branding are:
The Certified Angus Beef trademark (CAB, a USDA
certified brand): All CAB products are of high-quality and
receive above average prices as they are produced under
10 strict exacting standards in order to meet specific
flavor, juiciness, tenderness and nutrition ingredients.
Moreover, all meat packers, distributors and retailers who
use CAB brand must fulfill licensing agreements and audit
requirements to maintain their right to participate.
Pink Lady apples: Pink lady is a world-wide recognized
protected trademark through which is traded a very
special and high quality apple variety from Australia. The
International Pink Lady Alliance (IPLA) is an international
organization of producers, marketers and propagators that
promote pink lady as “so much more than an apple”. Star
Fruit in France is the owner of the operating rights of this
trademark within the EU.
Summerkiwi: The firm Summerkiwi promotes an early-
ripening kiwi variety founded by an Italian research center
(Caldesi School). The producers choosing this brand (i)
are overseen by the company’s technicians from the first
phases of installation until the plants begin to grow and
(ii) make use of a preferential marketing run by
commercial agents collecting the product and selling it
under the summerkiwi trademark.
Duolce Buona
bananas
Dole
bananas
Chiquita
bananas
1.39 1.70 1.89
Banana prices* in Greek market
*prices (€/kg) in supermarkets 2015
Cox applesBraebum
apples
Pink Lady
apples
2.12 2.40 4.22
Apple prices* in UK market
*prices (€/kg) in supermarkets 2013
Greek beefAngus beef
(US)
Relative
price
Minced meat 10 22 2.2
Meat** 14 32 2.3
Fillet 29 65 2.2
Beef meat prices* in Greek market
*prices (€/kg) in online market**rump meat-picanha

NATIONAL BANK OF GREECE Sectoral Report December 2015 21
Geographical brands
Chile has recently strengthened its fruit sector by implementing an
extensive branding strategy. In particular, the Chilean Fruit
Exporters Association (ASOEX) along with many producers
developed the campaign “Foods from Chile, Source of Life” which
helped the fruit industry in establishing its reputation and position
around the world. Each fruit has become recognizable with its own
logo and is now considered of high-quality in international markets.
Another example is the Plantation Reserve sugar - a product
produced in Barbados that stands out in the international market
because of its natural taste and aroma combined with a distinctive
color and texture. The product was developed by the contribution
of Barbados government and the West Indies Sugar & Trading
Company of Barbados which undertook its promotion under the
brand “Plantation Reserve”. The brand can be seen in retail stores
in Barbados, the Caribbean and EU receiving approximately three
times the average world price. Note that the same branding
strategy can be accomplished for a particular geographical region
of a country (as can be the case with the PDO system). An
example of this strategy is the Darjeeling Tea - a tea produced in
the Darjeeling region of India that has achieved “Geographical
Indication” status. The Tea Board of India has managed to ensure
its proper production and guarantee its geographical indication,
and thus the Darjeeling Tea has become widely known as the
“Champagne of teas”, achieving premium prices.
Bringing it all together – The case of New Zealand
New Zealand is characterized by a mild temperate climate, many
kilometers of coastline and fertile soils. All these factors led to a
strong agricultural sector which contributes 6.9 per cent to New
Zealand's GDP. In view of the fact that New Zealand is the only
developed country where farmers don’t receive any kind of
subsidies, it is remarkable achievement that this small country, far
from the large consumer markets, is an important player in the
international market of premium fresh agricultural products. Its
strategy seems to be grounded around three main building blocks:
business-oriented cooperatives, applied research and a multi-layer
branding strategy.
New Zealand has established a company - “The New Zealand Way
Relative
price1
Market
share2
Relative
price1
Market
share2
Grapes 1.1 19% 1.0 2%
Apples 1.1 10% 0.7 0.4%
Pears 1.1 6% 0.6 0.1%
Mandarins 1.4 2% 0.7 1%
GDP (bil.€)
Agr. Value
Added (%GDP)
Population
(millions)
3.3% 3.8%
17.8 11
Chile Greece
194.3 178.8
Branding in agri-food products
Chile Greece
1 Export price for each product, relative to the average world export price for the same product
2 Market share in the international market
Source: Comtrade, World Bank, NBG estimates
Black tea Green teaDarjeeling
tea
2.3 6.4 9.8
Tea prices*
*prices (€/100g) in online market

NATIONAL BANK OF GREECE Sectoral Report December 2015 22
Limited” owned by the public development agencies for trade and
tourism - that manages the country brand. With a fern (a native
plant) as a logo and the “100 per cent pure” as a slogan, New
Zealand has built its overall brand personality as a “clean, green
and smart” country. Through a Brand Partner Program, domestic
companies are permitted to use the country brand on their
products. This has increased awareness for products from New
Zealand in the international markets and has set the stage for the
cooperatives to add a second layer of branding – a product specific
one.
Dairy products, kiwis, honey, lamb and wine are some of the
subsectors that have benefited from the country branding strategy
and have emerged as global leaders. Specifically, one of New
Zealand’s well-known cooperative is Fonterra - a company-
cooperative consisting of approximately 11,000 dairy producers (95
per cent of country’s dairy production). The creation of this
cooperative in 2001 improved both the production volume and the
exports of milk and dairy products. Specifically, the milk production
increased by 67 per cent during 2001-2014, while exports grew in
value terms by 28 per cent annually during the same period (vs an
annual growth rate of around 4 per cent during 1994-2000). In
fact, Fonterra by investing in IT resources (e.g. virtualization and
cloud infrastructure) and extensive applied R&D (with annual
expenses of $50mn for innovation centers, a biotechnology
subsidiary as well as funding research in Auckland university) has
emerged as the world’s largest dairy exporter. Another large
cooperative is Kiwifruit New Zealand that (under the competitive
pressures of Chinean and Italian kiwis) has successfully introduced
the distinct brand of Zespri, which through both R&D efforts (to
introduce new varieties) and global marketing campaigns managed
to create consumer awareness and receive premium prices.
Similarly, the honey producers’ cooperative has succeeded to
differentiate their product by registering a special ingredient of
New Zealand’s honey (under the Unique Manuka Factor trademark)
and thus establishing the premium Manuka honey brand.
Relative
price1
Market
share2
Relative
price1
Market
share2
Kiwis 1.3 37% 0.6 5%
Honey 4.7 8% 1.7 0.5%
Apples 1.2 5% 0.7 0.4%
Wine 1.2 3% 0.9 0.2%
GDP (bil.€)
Agr. Value
added (%GDP)
Population
(millions)
1 Export price for each product, relative to the average world export price for the same product
2 Market share in the international market
Source: Comtrade, World Bank, NBG estimates
Branding in agri-food products
New Zealand Greece
New Zealand Greece
141.8 178.8
6.9% 3.8%
4.5 11
0
50
100
150
200
New Zealand Greece
index (
EU
avg=
100)
Agriculture: Total Factor Productivity
Input Output
Source: World Bank, WEF, Eurostat, Faostat, NBG estimates
x 0.7
x 2.3

NATIONAL BANK OF GREECE Sectoral Report December 2015 23
1,5
3,02,7
2,2
1,4 1,2 1,2
0%
15%
30%
45%
0
1
2
3
4
Gre
ece
South
Aegean
Cre
te
South
Gre
ece
Nort
h G
reece
Nort
h A
egean
Centr
al G
reece
thousa
nds
€per
ha
Land exploitation and productivity per region
Gross Value Added/ha - left axis
Exploitation (UAA/total land) - right axis
Source: Eurostat, NBG estimates
1,5 1,6 1,5
1,1
0,0
0,5
1,0
1,5
2,0
Greece Medit. EU28 World
thousa
ns
€per
ha
Agricultural Value Added per ha of land
Source: World Databank, Eurostat, NBG estimates
Greece Medit. EU28 World
(i)Coastline per area
(m/sq.km.)104 16 40 26
(ii)Sunshine (,000
hours/year)2,8 2,6 2,0 2,5
(iii)Precipitation volume
(10^9 m3/area)11 17 25 85
(iv) Soil Quality**
a. Carbon content in
topsoil (% weight)1,1% 1,3% 2,9% 1,7%
b. Land degradation
(% severe degr.)48% 23% 44% 37%
c. Land erosion 65% 31% 23% 24%
Source: World Bank, Aquastat, NBG estimates
Natural Attributes of Agricultural Land*
*The Natural Attributes Index consists of equally weighted
components i-iv (after turned into indices).
**The Soil Quality Index consists of equally weighted
components a-c (b-c inverse), after turned into indices.
WHAT CAN BE ACCOMPLISHED
Having outlined the critical policies, the analysis turns to
investigating the sector’s potential. Aiming to quantify the
unexploited dynamics of the Greek agro-food sector, NBG
Research focuses on the two main links of the food supply chain:
the potential for higher agricultural productivity and
the development of a larger food manufacturing sector.
1. Increasing the productivity of agricultural land
The utilized agricultural area (UAA) in Greece covers about 26 per
cent of total land (or 3.5mn ha) compared with 35 per cent in the
Mediterranean (including African regions) and 37 per cent
globally. Land productivity is about €1,500 of gross value added
per ha of utilized agricultural area, close to the EU average and
slightly less than that of Mediterranean (EU-med) countries. We
note that the level of agricultural value added does not include
subsidies on agricultural production. As expected, there are
significant differences per region, with productivity ranging from
€1,200/ha in Central Greece (18 per cent of agricultural land) to
€3,000/ha in the South Aegean (2 per cent of agricultural land).
With a view to quantifying the determinants of agricultural land
productivity, we have constructed a cross-sectional model based
on a worldwide sample of 167 countries. Based on the Total
Factor Productivity (TFP) literature14, we establish a two-step
approach. First, we estimate a Cobb-Douglas production function
which includes the three conventional inputs: labour, capital and
materials (water, seeds, fertilizers and forage)15. Second, we
construct a TFP index (proxied by the residual of the above-
mentioned production function). Though the drivers of TFP are
complex, we have distinguished four main parameters:
Technology level (proxied by agricultural R&D
expenditures, source: Faostat)
Efficiency gains stemming from economies of scale
14 Ball, V., Butault, J., Mesonada, C. and Mora, R. (2010), “Productivity and international competitiveness of
agriculture in the EU and the US”, Agricultural Economics, 41, 611-627. Capalbo, S., Ball, V., and Denny, M. (1990), “International comparisons of agricultural productivity: Development and usefulness”, American Journal of Agricultural Economics, 72, 1292-1297. Coelli, T. and Rao D. (2005), “Total factor productivity growth in agriculture: A malmquist index analysis of 93 countries, 1980-2000”, Agricultural Economics, 32, 115-134. 15 In order to take account for the effect of the different size of each country’s agricultural land, we have
expressed the variables in terms of their level per hectare of agricultural land.
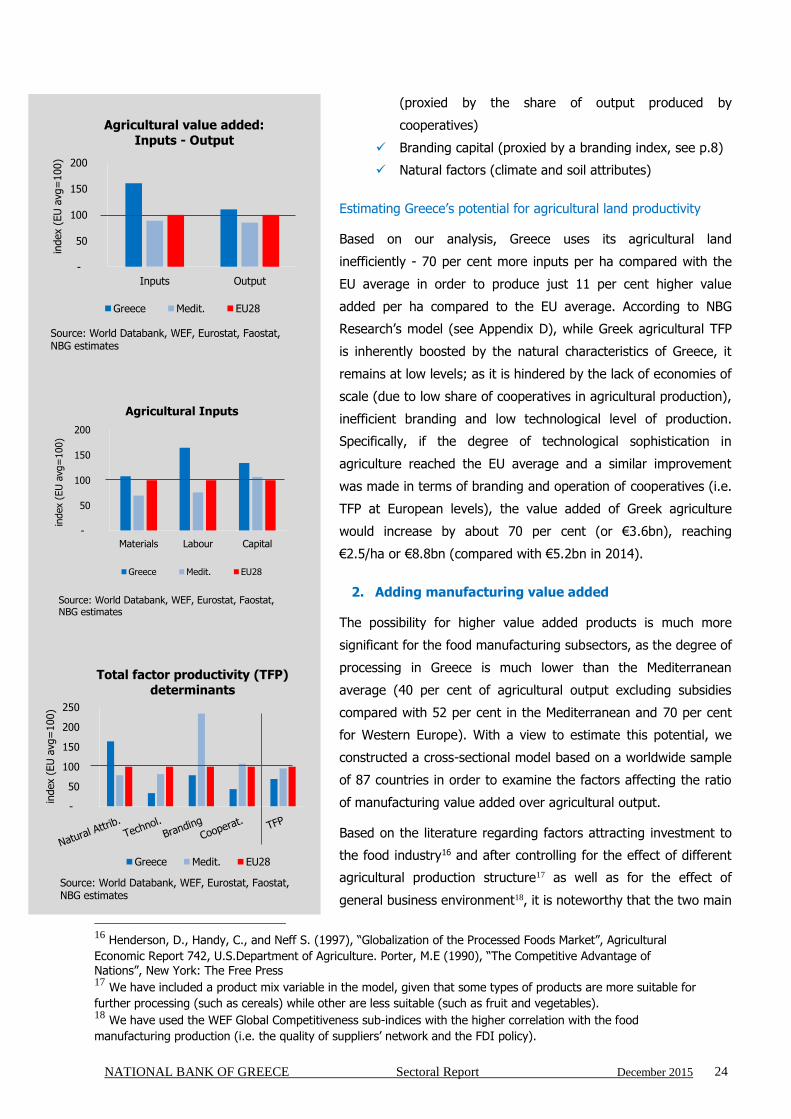
NATIONAL BANK OF GREECE Sectoral Report December 2015 24
-
50
100
150
200
Inputs Output
index (
EU
avg=
100)
Agricultural value added: Inputs - Output
Greece Medit. EU28
Source: World Databank, WEF, Eurostat, Faostat, NBG estimates
-
50
100
150
200
Materials Labour Capital
index (
EU
avg=
100)
Agricultural Inputs
Greece Medit. EU28
Source: World Databank, WEF, Eurostat, Faostat, NBG estimates
-
50
100
150
200
250
index (
EU
avg=
100)
Total factor productivity (TFP) determinants
Greece Medit. EU28
Source: World Databank, WEF, Eurostat, Faostat, NBG estimates
(proxied by the share of output produced by
cooperatives)
Branding capital (proxied by a branding index, see p.8)
Natural factors (climate and soil attributes)
Estimating Greece’s potential for agricultural land productivity
Based on our analysis, Greece uses its agricultural land
inefficiently - 70 per cent more inputs per ha compared with the
EU average in order to produce just 11 per cent higher value
added per ha compared to the EU average. According to NBG
Research’s model (see Appendix D), while Greek agricultural TFP
is inherently boosted by the natural characteristics of Greece, it
remains at low levels; as it is hindered by the lack of economies of
scale (due to low share of cooperatives in agricultural production),
inefficient branding and low technological level of production.
Specifically, if the degree of technological sophistication in
agriculture reached the EU average and a similar improvement
was made in terms of branding and operation of cooperatives (i.e.
TFP at European levels), the value added of Greek agriculture
would increase by about 70 per cent (or €3.6bn), reaching
€2.5/ha or €8.8bn (compared with €5.2bn in 2014).
2. Adding manufacturing value added
The possibility for higher value added products is much more
significant for the food manufacturing subsectors, as the degree of
processing in Greece is much lower than the Mediterranean
average (40 per cent of agricultural output excluding subsidies
compared with 52 per cent in the Mediterranean and 70 per cent
for Western Europe). With a view to estimate this potential, we
constructed a cross-sectional model based on a worldwide sample
of 87 countries in order to examine the factors affecting the ratio
of manufacturing value added over agricultural output.
Based on the literature regarding factors attracting investment to
the food industry16 and after controlling for the effect of different
agricultural production structure17 as well as for the effect of
general business environment18, it is noteworthy that the two main
16
Henderson, D., Handy, C., and Neff S. (1997), “Globalization of the Processed Foods Market”, Agricultural
Economic Report 742, U.S.Department of Agriculture. Porter, M.E (1990), “The Competitive Advantage of Nations”, New York: The Free Press 17 We have included a product mix variable in the model, given that some types of products are more suitable for
further processing (such as cereals) while other are less suitable (such as fruit and vegetables). 18 We have used the WEF Global Competitiveness sub-indices with the higher correlation with the food
manufacturing production (i.e. the quality of suppliers’ network and the FDI policy).

NATIONAL BANK OF GREECE Sectoral Report December 2015 25
-
0,5
1,0
1,5
2,0
Manufacturing value added / Agricultural production
Greece Mediterranean average
Source: Eurostat, EL.STAT., NBG estimates
Current Potential
Assumptions
Technology Index* 33 100
Brand Index* 79 234
Product mix (crops/livestock) 3.2 3.2
Business Environment Index* 81 100
Estimates
Food manuf. Value Added
(% of agricultural output) 40% 54%
Food manuf. Value Added
(mil. €)4 9.5
** excl. subsidies
Greek Food Manufacturing Value Added:
Assumpitons and Estimates
* Indices: EUavg=100
factors affecting the manufacturing intensity of a country’s agro-
food sector are two of the factors that also determine agricultural
productivity (i.e. branding and R&D). This fact suggests that
branding and R&D provide a double benefit to agri-food sector:
increasing agricultural production as well as the share of
manufacturing on agricultural production.
Estimating Greece’s potential for food manufacturing value added
Based on our model, Greece – with its special characteristics and
current business environment – should create food manufacturing
value added in the range of 40 per cent of the agricultural
production value, close to its realized level.
However, there is significant upside. In case Greece could achieve
European R&D levels19 and Mediterranean level of branding20,
food manufacturing value added could increase by €2.5bn
annually (€1.7bn through branding and €0.8 through technological
upgrade)21. Importantly, an improvement of the business
environment to achieve similar conditions with the EU average
would bring a further increase in manufacturing – with the ratio of
manufacturing reaching 54 per cent of agricultural output (from
40 per cent currently).
Taking into account the potential increase of agricultural
production (as described in the previous section), it results in a
total increase of €5.5bn in food manufacturing value added (from
€4bn to €9.5bn).
Summing up
Our estimates: (i) confirm the significance of the factors outlined
by analyzing case studies of other countries; and (ii) point to
potential considerable gains. In particular, critical changes in
branding strategy, cooperatives’ network, production technology
and business environment could provide an annual benefit of
about €9.1bn in terms of value added (€3.6bn from agriculture
and €5.5bn through food manufacturing processing), equivalent to
5.1 per cent of GDP. There will also be indirect effects through
higher domestically produced inputs for the agricultural production
19 This translates in the increase of agricultural R&D from €11/ha to €33/ha (EU average). 20 This translates in the increase of branding index from 79 to 234 (Mediterranean average). 21 We note that these variables affect both the agricultural value added (per ha of land) as well as the degree of
manufacturing processing (from 38 to 46 per cent of agricultural output).
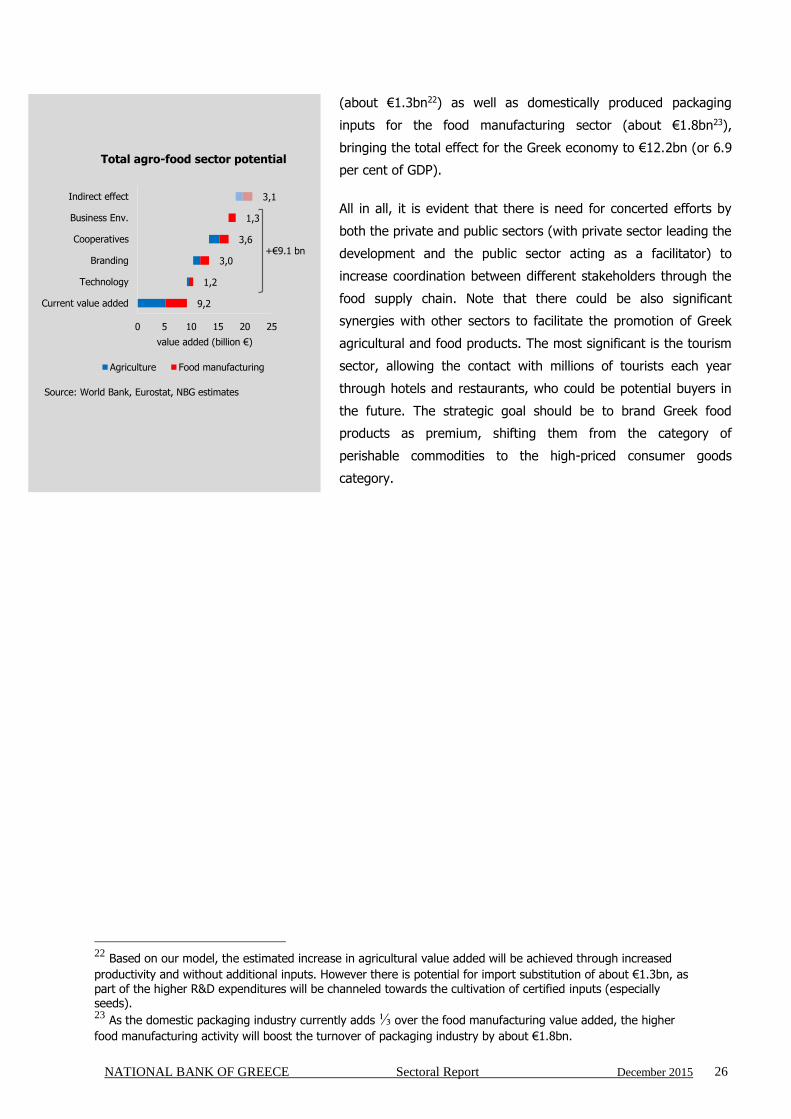
NATIONAL BANK OF GREECE Sectoral Report December 2015 26
9,2
1,2
3,0
3,6
1,3
3,1
0 5 10 15 20 25
Current value added
Technology
Branding
Cooperatives
Business Env.
Indirect effect
value added (billion €)
Total agro-food sector potential
Agriculture Food manufacturing
Source: World Bank, Eurostat, NBG estimates
+€9.1 bn
(about €1.3bn22) as well as domestically produced packaging
inputs for the food manufacturing sector (about €1.8bn23),
bringing the total effect for the Greek economy to €12.2bn (or 6.9
per cent of GDP).
All in all, it is evident that there is need for concerted efforts by
both the private and public sectors (with private sector leading the
development and the public sector acting as a facilitator) to
increase coordination between different stakeholders through the
food supply chain. Note that there could be also significant
synergies with other sectors to facilitate the promotion of Greek
agricultural and food products. The most significant is the tourism
sector, allowing the contact with millions of tourists each year
through hotels and restaurants, who could be potential buyers in
the future. The strategic goal should be to brand Greek food
products as premium, shifting them from the category of
perishable commodities to the high-priced consumer goods
category.
22 Based on our model, the estimated increase in agricultural value added will be achieved through increased
productivity and without additional inputs. However there is potential for import substitution of about €1.3bn, as part of the higher R&D expenditures will be channeled towards the cultivation of certified inputs (especially seeds). 23 As the domestic packaging industry currently adds ⅓ over the food manufacturing value added, the higher
food manufacturing activity will boost the turnover of packaging industry by about €1.8bn.

NATIONAL BANK OF GREECE Sectoral Report December 2015 27
Appendix A: The effects of the Russian embargo to the EU food sector
The conquest of the Ukrainian province of Crimea led many western Governments to implement financial
sanctions against Russia and Russian companies. As a response, the Russian Government implemented, in August
2013, certain countermeasures aiming to reduce Russia’s dependence on food imports from the EU, US, Norway,
Canada and Australia, while simultaneously signing a series of interstate agreements with South American, African
and Asian countries to substitute for the embargoed food imports. The Russian Government has recently
announced that the embargo on food imports will continue at least until July 2016.
EU-Russia trade before the embargo
EU exports to Russia had reached €120bn in 2013 (i.e. the year before the embargo), of which almost 10 per
cent were agro-food products. While the EU exports’ dependence in the Russian market is low (2.7 per cent of EU
food exports), there are neighboring-to-Russia countries (like Lithuania, Latvia, Finland and Estonia) with food
export dependence in the range of 20-30 per cent. As far as specific products are concerned, EU exports to
Russia comprise mainly meat (15 per cent), beverages (14 per cent), dairy (13 per cent) and fruit (11 per cent).
CountryTotal Food Exports to
Russia* (in million euros)
Share in EU 28
Food Exports to
Russia*
Dependence of
Food Exports from
Russia* ↓
Losses from Russian
Embargo** (in million
euros)
Losses/Total
Exports**
Lithuania 1.362 12,3% 32,9% -772 -18,4%
Latvia 651 5,9% 30,2% -116 -5,2%
Finland 411 3,7% 26,3% -296 -18,9%
Estonia 240 2,2% 19,6% -110 -8,8%
Poland 1.227 11,1% 6,8% -746 -4,1%
Cyprus 14 0,1% 5,0% -10 -3,8%
Denmark 600 5,4% 3,7% -376 -2,3%
Greece 162 1,5% 3,6% -128 -2,9%Hungary 231 2,1% 3,2% -45 -0,6%
Slovenia 32 0,3% 2,9% -7 -0,7%
Germany 1.475 13,3% 2,4% -599 -1,0%
Austria 230 2,1% 2,4% -83 -0,9%
Ireland 223 2,0% 2,3% -151 -1,5%
Italy 653 5,9% 2,0% -217 -0,7%
Netherlands 1.386 12,5% 1,9% -516 -0,7%
Spain 571 5,2% 1,6% -345 -0,9%
Czech Rep. 84 0,8% 1,5% -12 -0,2%
Belgium 454 4,1% 1,5% -269 -0,9%
Croatia 15 0,1% 1,4% -2 -0,2%
Sweden 95 0,9% 1,3% -22 -0,3%
Bulgaria 42 0,4% 1,2% -1 0,0%
France 662 6,0% 1,2% -303 -0,5%
Portugal 48 0,4% 1,0% -13 -0,3%
Luxembourg 8 0,1% 0,9% -2 -0,2%
Romania 41 0,4% 0,9% -8 -0,2%
Slovakia 24 0,2% 0,8% -2 -0,1%
U.K. 132 1,2% 0,6% -66 -0,3%
Malta 0 0,0% 0,0% 0 0,0%
EU28 11.072 2,7% -5.217 -1,2%
Russian Embargo's Losses for EU member states
* 2013, **A ug.'14 - Jul.'15Source: Eurostat, C alculations NBG
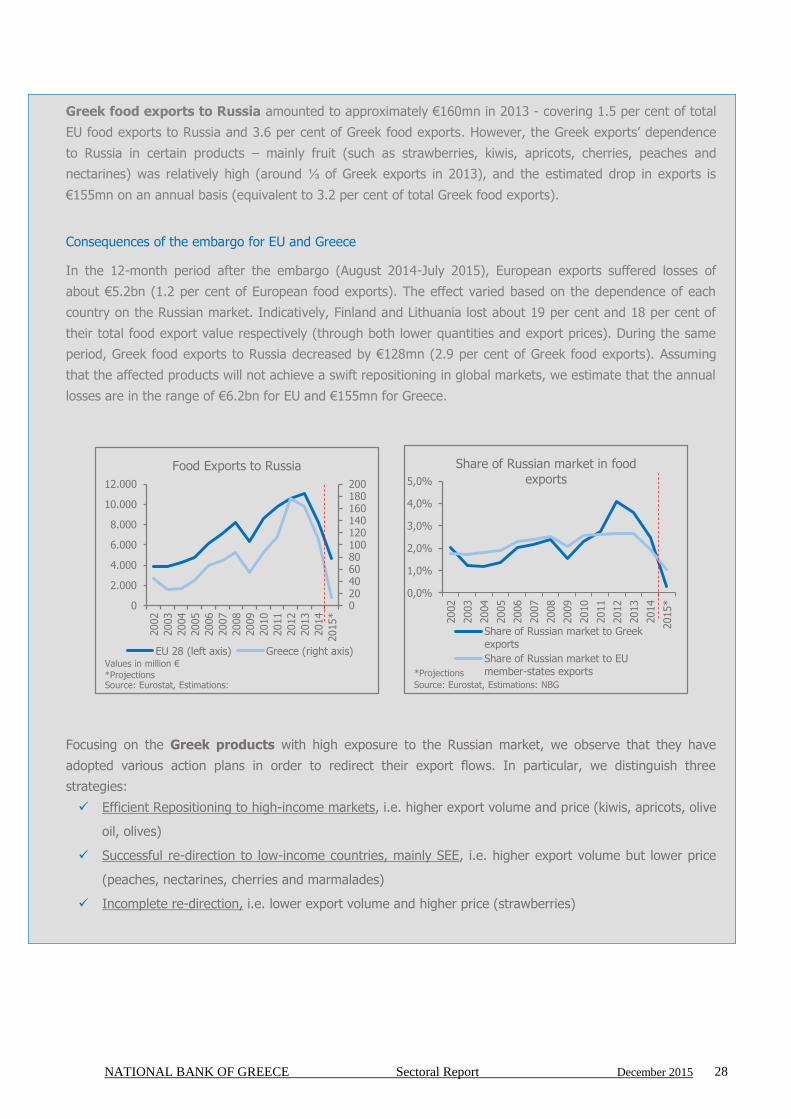
NATIONAL BANK OF GREECE Sectoral Report December 2015 28
Greek food exports to Russia amounted to approximately €160mn in 2013 - covering 1.5 per cent of total
EU food exports to Russia and 3.6 per cent of Greek food exports. However, the Greek exports’ dependence
to Russia in certain products – mainly fruit (such as strawberries, kiwis, apricots, cherries, peaches and
nectarines) was relatively high (around ⅓ of Greek exports in 2013), and the estimated drop in exports is
€155mn on an annual basis (equivalent to 3.2 per cent of total Greek food exports).
Consequences of the embargo for EU and Greece
In the 12-month period after the embargo (August 2014-July 2015), European exports suffered losses of
about €5.2bn (1.2 per cent of European food exports). The effect varied based on the dependence of each
country on the Russian market. Indicatively, Finland and Lithuania lost about 19 per cent and 18 per cent of
their total food export value respectively (through both lower quantities and export prices). During the same
period, Greek food exports to Russia decreased by €128mn (2.9 per cent of Greek food exports). Assuming
that the affected products will not achieve a swift repositioning in global markets, we estimate that the annual
losses are in the range of €6.2bn for EU and €155mn for Greece.
020406080100120140160180200
0
2.000
4.000
6.000
8.000
10.000
12.000
2002
2003
2004
2005
2006
2007
2008
2009
2010
2011
2012
2013
2014
2015*
Food Exports to Russia
EU 28 (left axis) Greece (right axis)
Source: Eurostat, Estimations:
Values in million €
*Projections
0,0%
1,0%
2,0%
3,0%
4,0%
5,0%
2002
2003
2004
2005
2006
2007
2008
2009
2010
2011
2012
2013
2014
2015*
Share of Russian market in food exports
Share of Russian market to Greekexports
Share of Russian market to EUmember-states exports
Source: Eurostat, Estimations: NBG
*Projections
Focusing on the Greek products with high exposure to the Russian market, we observe that they have
adopted various action plans in order to redirect their export flows. In particular, we distinguish three
strategies:
Efficient Repositioning to high-income markets, i.e. higher export volume and price (kiwis, apricots, olive
oil, olives)
Successful re-direction to low-income countries, mainly SEE, i.e. higher export volume but lower price
(peaches, nectarines, cherries and marmalades)
Incomplete re-direction, i.e. lower export volume and higher price (strawberries)

NATIONAL BANK OF GREECE Sectoral Report December 2015 29
Exports in
tonnes
Current
Annual
Level*
Change in
Annual
Level After
Embargo**
Export Price
After
Embargo***
%Δ in
Export Price
Germany 13.084 5.894 1.049 10,7%
Spain 12.033 8.714 878 -3,8%
Lithuania 10.270 8.539 736 5,7%
Poland 8.135 3.464 775 6,1%
Italy 7.992 4.803 749 13,0%
Romania 7.311 1.340 629 11,7%
Bulgaria 5.560 1.509 292 -29,1%
Netherlands 4.222 1.543 1.002 9,0%
U.K. 4.173 1.823 1.083 -6,3%
Egypt 2.515 1.252 546 12,5%
Subtotal 75.294 38.880
Russia 0 -28.470
Total Exports 116.014 16.729 803 3,6%
Kiwis: Greek Exports
No Exports
***Euros/tonneSource: Eurostat, Calculations: NBG
*After embargo: Aug.'14-Jul.'15**Prior embargo:Average Aug.'12-Jul.'13 & Aug.'13-Jul.'14
Exports in
tonnes
Current
Annual
Level*
Change in
Annual
Level After
Embargo**
Export Price
After
Embargo***
%Δ in
Export
Price
Bulgaria 11.962 3.810 232 -30,3%
Lithuania 9.224 8.070 644 2,0%
Turkey 5.627 4.105 410 -6,9%
Germany 5.192 1.337 528 -32,5%
Moldova 5.169 1.931 675 -16,7%
Poland 4.621 884 521 -22,7%
Latvia 3.305 3.195 577 -32,7%
Egypt 2.638 1.198 406 -15,4%
Spain 1.508 1.072 459 -48,3%
Serbia 1.259 882 358 -55,4%
Subtotal 50.504 26.483
Russia 1.961 -27.678
Total Exports 79.505 -6.006 473 -28,6%
*A fter embargo: A ug.'14-Jul.'15
**Prior embargo:A v erage A ug.'12-Jul.'13 & A ug.'13-Jul.'14
***Euros/tonneSource: Eurostat, C alculations: NBG
Peaches: Greek Exports
730
Exports in
tonnes
Current
Annual
Level*
Change in
Annual
Level After
Embargo**
Export Price
After
Embargo***
%Δ in
Export
Price
Moldova 6.954 4.678 1.192 2,9%
Cyprus 1.882 1.110 1.431 25,0%
Latvia 1.315 1.193 1.337 19,0%
Lithuania 1.285 1.050 1.837 53,7%
Czech Rep. 639 238 1.535 9,5%
Estonia 303 295 1.714 22,4%
U.A.E. 184 184 4.143 na
Kuwait 67 46 5.222 19,0%
Sweden 42 40 1.438 -46,1%
Ireland 33 33 999 na
Subtotal 12.703 8.867
Russia 0 -14.863
Total Exports 19.960 -14.119 1.476 12,2%
*A fter embargo: A ug.'14-Jul.'15
**Prior embargo:A v erage A ug.'12-Jul.'13 & A ug.'13-Jul.'14
***Euros/tonneSource: Eurostat, C alculations: NBG
Strawberries: Greek Exports
No Exports
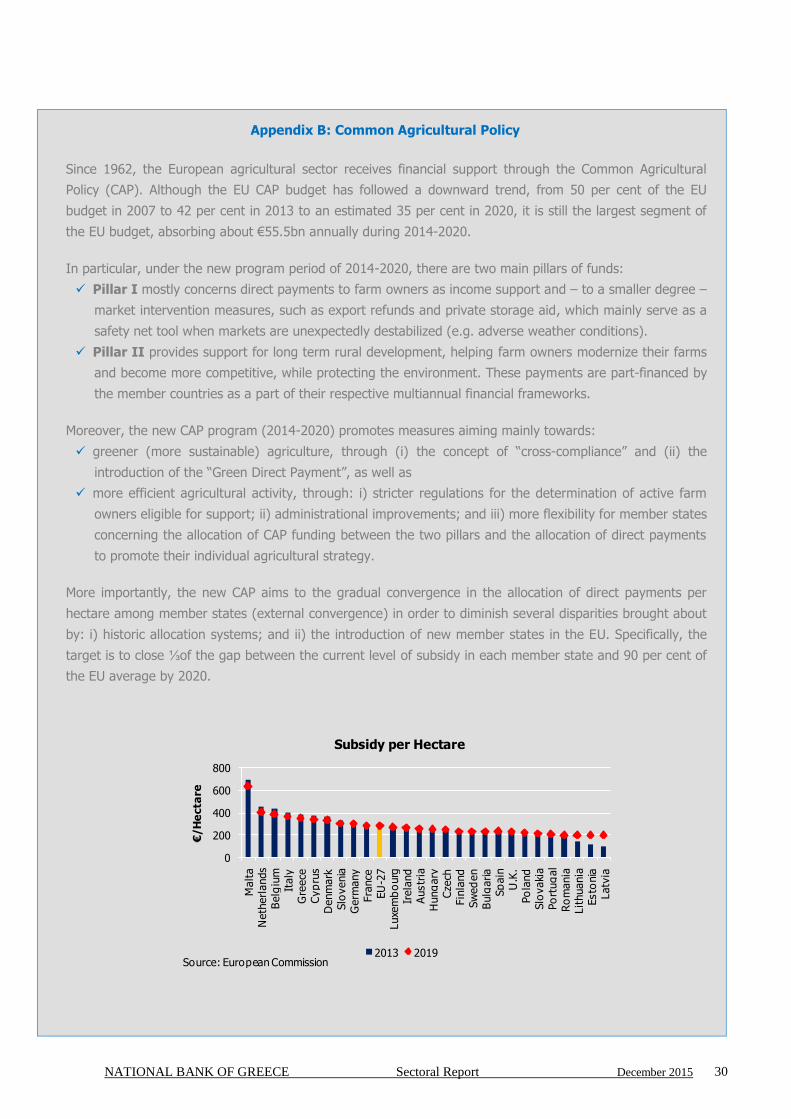
NATIONAL BANK OF GREECE Sectoral Report December 2015 30
Appendix B: Common Agricultural Policy
Since 1962, the European agricultural sector receives financial support through the Common Agricultural
Policy (CAP). Αlthough the EU CAP budget has followed a downward trend, from 50 per cent of the EU
budget in 2007 to 42 per cent in 2013 to an estimated 35 per cent in 2020, it is still the largest segment of
the EU budget, absorbing about €55.5bn annually during 2014-2020.
In particular, under the new program period of 2014-2020, there are two main pillars of funds:
Pillar I mostly concerns direct payments to farm owners as income support and – to a smaller degree –
market intervention measures, such as export refunds and private storage aid, which mainly serve as a
safety net tool when markets are unexpectedly destabilized (e.g. adverse weather conditions).
Pillar II provides support for long term rural development, helping farm owners modernize their farms
and become more competitive, while protecting the environment. These payments are part-financed by
the member countries as a part of their respective multiannual financial frameworks.
Moreover, the new CAP program (2014-2020) promotes measures aiming mainly towards:
greener (more sustainable) agriculture, through (i) the concept of “cross-compliance” and (ii) the
introduction of the “Green Direct Payment”, as well as
more efficient agricultural activity, through: i) stricter regulations for the determination of active farm
owners eligible for support; ii) administrational improvements; and iii) more flexibility for member states
concerning the allocation of CAP funding between the two pillars and the allocation of direct payments
to promote their individual agricultural strategy.
More importantly, the new CAP aims to the gradual convergence in the allocation of direct payments per
hectare among member states (external convergence) in order to diminish several disparities brought about
by: i) historic allocation systems; and ii) the introduction of new member states in the EU. Specifically, the
target is to close ⅓ of the gap between the current level of subsidy in each member state and 90 per cent of
the EU average by 2020.
0
200
400
600
800
Malt
aN
eth
erl
ands
Belg
ium
Italy
Gre
ece
Cyp
rus
Denm
ark
Slo
venia
Germ
any
Fra
nce
EU
-27
Luxe
mb
ourg
Irela
nd
Austr
iaH
ung
ary
Cze
chFin
land
Sw
ed
en
Bulg
aria
Sp
ain
U.K
.Po
land
Slo
vaki
aPo
rtug
al
Ro
mania
Lit
huania
Esto
nia
Latv
ia
€/H
ecta
re
Subsidy per Hectare
2013 2019Source: European Commission

NATIONAL BANK OF GREECE Sectoral Report December 2015 31
Implementation of CAP reforms in Greece
As Greece is one of the member states with a high direct subsidy per cultivated land (€384/ha in 2013 vs. an
EU average of €293/ha), its share in the EU CAP budget is expected to fall to 3.5 per cent in 2019 from 5.6
per cent in 2007 (about €2bn annually for the period 2014-2020 compared with €2.5bn during 2007-2013).
Against the background of the main principles of the new CAP, Greece has allocated 77 per cent of its
available funds in Pillar I and 23 per cent in Pillar II - a structure similar to the previous programming period
(2007-2013) but with certain changes, leading to the redistribution of Pillar I funds among Greek farmers:
Under the previous system, payments were solely based on declared production levels during 2000-
2002 (irrespective of current level and type of activity) giving no motivation for new production. While
to a large extent direct payments are still decoupled from production (apart from specific products24
that receive subsidies linked to production – absorbing 8 per cent of direct payments), now there are
requirements of minimum activity (e.g. cultivation of at least ½ of declared land per farmer).
Additionally, for the first time the greatest part of pillar I (85 per cent) is divided in two distinct
categories: i) the Basic Payment (55 per cent of annual payments); and ii) the Green Direct Payment
(30 per cent of annual payments) which is only granted under certain environmental criteria. We note
that small farmers25 can obtain the full payment without obligation to fulfill the set criteria.
With a view to achieving a gradual convergence of support per type of activity, the level of direct
payments per farmer is determined based on the following allocation scheme:
i) arable land will absorb 47 per cent of funds (€420/ha),
ii) permanent crops will absorb 28 per cent (€500/ha)
iii) pastures (for livestock) will absorb 25 per cent (€250/ha), compared with 19 per cent of direct
payments during 2007-2013.
In an effort to moderate the convergence process, there is a provision for a maximum drop of 30 per
cent for each farm owner per hectare during 2015-2019.
The remaining 7 per cent of Pillar I will be used to support: i) farm owners in areas with natural
constraints (e.g. mountainous areas), absorbing 5 per cent of direct payments (transferred to Pillar
II); and ii) young farmers (less than 40 years old) absorbing 2 per cent as an incentive to join the
sector and modernize the production process.
24 Products that can be subsidized based on the level of production (coupled payments) are legumes, forage,
sugar beet, hard wheat, bovine animals, goats, rice, industrial tomato, seeds, oranges for juice and asparagus. 25 The “small farmers” scheme concerns about 340,000 Greek farmers (½ of total) receiving annual direct
payments lower than €1,250 (9.6 per cent of direct payments).

NATIONAL BANK OF GREECE Sectoral Report December 2015 32
55%
30%
2%
8%5%
Pillar I Decomposition
Basic Payments Greening
New & Young Farmers Coupled Payments
Transer to Pillar II
Source: OPEKEPE
47%25%
28%
Greek CAP
Arable Areas
Pastures
Permanent Plantations
Source: OPEKEPE
As far as Pillar II is concerned, projects for Rural Development during 2014–2020 will absorb €4.7bn of the
CAP budget (estimated to reach a total of €6bn including private co-financing). The implementation of the
program aspires to modernize the country’s agricultural production model and create 50,000 new jobs. The
basic priorities of the program are:
To enhance the competitiveness and productivity via the introduction of innovations in the production
process that will improve the quality, the value added and the extroversion of the products
To upgrade human capital and enhance entrepreneurship through young farmers and their organization
into agricultural cooperatives
The protection of the environment and confrontation of the climate change (30 per cent of the budget)
The reinforcement of the population in rural areas via the creation of sustainable job opportunities
Summing up, in light of the expected further reductions of direct payment allocations per area under the
convergence process, the sector could be forced to become more competitive and gradually less dependent
on direct subsidies to be profitable (subsidies cover about ⅕ of the value of agricultural output in Greece,
compared with 12 per cent on average in the Mediterranean). Against this background, the opportunities
offered by the new CAP for further investments, R&D, and attracting young farmers should be exploited in
order to achieve a more professional attitude regarding agricultural activity.
10%
15%
20%
25%
30%
2000
2001
2002
2003
2004
2005
2006
2007
2008
2009
2010
2011
2012
2013
2014
Subsidies as % of agricultural output
Greece EU(27) Medit. countries
Source: Eurostat, NBG estimates

NATIONAL BANK OF GREECE Sectoral Report December 2015 33
Appendix C: Financial Performance of Agro-food companies
Agriculture - Aquaculture
During the past decade, Greek agricultural companies (i.e. farming and light manufacturing) posted an average
annual growth in turnover of about 8 per cent (compared with 2 per cent in Europe). The Greek sector operates
with a similar EBITDA margin as European companies (about 11 per cent) and a similar debt to equity ratio of 1.2.
However, the relatively low asset turnover (0.48 compared with 0.65 in Europe) makes the level of debt less
sustainable (debt to EBITDA ratio is 6, compared with 4.1 in Europe). Liquidity conditions are also more
problematic for the Greek agricultural sector, mainly due to a time gap of about 55 days between receipts from
customers and payment of suppliers (while payments for European companies are more balanced).
We note that the financial difficulties are more severe in the sector of aquaculture. Both the operating profit
margin (4.6 per cent) and net profit margin (-3.4 per cent) were on average lower than those in the Greek
agricultural sector as well as the European aquaculture sector. Due to structural characteristics of the sector
related to the long gestation period of the main fish types cultivated in Greece (i.e. sea-bass and sea-bream),
Greek aquaculture companies need to sustain high levels of stock (live fish) resulting in high working capital needs.
During the past decade those structural issues were magnified by inefficient strategies that led to oversupply in the
European market. The subsequent pressure on prices lowered the profitability of the sector to the point that its
debt level became unsustainable. Specifically, debt to EBITDA ratio was about 19, compared with 5 in Europe.
Greece EU
2004-2013 2004-2013
Annual sales growth 8,0% 2,0%
ROE (before taxes) -1,2% 5,2%
ROA (before taxes) -0,5% 2,3%
EBITDA margin 10,4% 11,3%
Net Profit margin -1,0% 2,6%
Debt/Equity 1,2 1,3
Debt/EBITDA 6,0 4,1
Interest Coverage ratio 0,7 2,7
Asset Turnover 0,48 0,65
Equity Turnover 1,08 1,50
Operating Cycle (days) 168 144
Days payables outstanding
161 120
Days receivables outstanding
215 113
Days stock outstanding
114 151
Agriculture (crops and livestock)
Source: ICAP data, Bach database, NBG
estimates
Greece EU
2004-2013 2004-2013
Annual sales growth 9,2% 0,2%
ROE (before taxes) -18,2% 3,1%
ROA (before taxes) -1,4% 1,3%
EBITDA margin 4,6% 12,5%
Net Profit margin -3,4% 1,0%
Debt/Equity 3,3 1,6
Debt/EBITDA 18,9 4,9
Interest Coverage ratio 2,0 1,9
Asset Turnover 0,49 0,64
Equity Turnover 2,18 1,69
Operating Cycle (days) 287 147
Days payables outstanding
220 124
Days receivables outstanding
195 120
Days stock outstanding
312 151
Source: ICAP data, Bach database, NBG
estimates
Aquaculture

NATIONAL BANK OF GREECE Sectoral Report December 2015 34
Food manufacturing
Food manufacturing covers 22 per cent of total manufacturing in Greece and 15 per cent of exports (excluding
fuel). The sector was more resilient to the economic crisis than the average manufacturing enterprise (since
demand for food products is quite inelastic), with increasing sales and profitable operations during 2008-2013.
Specifically, the operating profit margin posted a small decrease from 11 per cent during 2004-2007 to 7.8 per cent
during 2008-2013. This was, nevertheless, sufficient to lead to a positive net profit margin of 1.2 per cent and to
make the increased debt of the sector more sustainable, with a debt to EBITDA ratio of 6.3 (compared with 9 for
total manufacturing).
Compared with their European competitors, food manufacturing enterprises in Greece have a similar EBITDA
margin and debt to equity ratio. However, the lower net profit margin (1.2 per cent compared with 2.8 per cent)
and asset turnover (0.84 compared with 1.3) leads to a lower ROA (1.1 per cent compared with 5 per cent). In
terms of liquidity, the Greek sector is also at a disadvantage. Specifically, the operating cycle of about 140 days,
while similar to other manufacturers (as well as Greek agricultural companies), is much higher than the European
average of 47 days. The main reason is the long delays in payments from customers, close to 150 days (compared
with 50 days in Europe) which cannot be counterbalanced with equally long delays to suppliers. Specifically, while
European food companies collect payments about 20 days sooner than they have to pay their suppliers, Greek
companies face a 50 day liquidity gap.
2004-
2007
2008-
2013
2004-
2007
2008-
2013
Annual sales growth 6,6% 3,1% 13,5% -0,02%
ROE (before taxes) 9,6% 2,8% 12,2% -0,6%
ROA (before taxes) 3,9% 1,1% 5,5% -0,2%
EBITDA margin 10,9% 7,8% 11,2% 5,5%
Net Profit margin 3,0% 1,2% 4,4% -0,2%
Debt/Equity 1,4 1,6 1,2 1,6
Debt/EBITDA 3,8 6,3 3,1 9,0
Interest Coverage
ratio3,2 1,6 5,1 1,0
Asset Turnover 0,89 0,84 0,89 0,83
Equity Turnover 2,16 2,19 1,97 2,19
Operating Cycle
(days)138 138 150 135
Days payables
outstanding89 96 69 78
Days receivables
outstanding136 146 128 124
Days stock
outstanding91 88 91 89
Source: ICAP data, NBG estimates
Greece: Manufacturing
Food
manufacturing
Other
manufacturing
Food
manufacturing
Other
manufacturing
Annual sales growth 1,0% 1,6%
ROE (before taxes) 12,6% 12,6%
ROA (before taxes) 5,0% 4,5%
EBITDA margin 7,9% 8,5%
Net Profit margin 2,8% 2,8%
Debt/Equity 1,5 1,8
Debt/EBITDA 2,9 3,2
Interest Coverage ratio 4,7 4,3
Asset Turnover 1,30 1,10
Equity Turnover 3,24 3,09
Operating Cycle (days) 47 42
Days payables
outstanding73 100
Days receivables
outstanding52 58
Days stock outstanding68 84
Source: Bach database, NBG estimates
Europe: Manufacturing
2004-2013
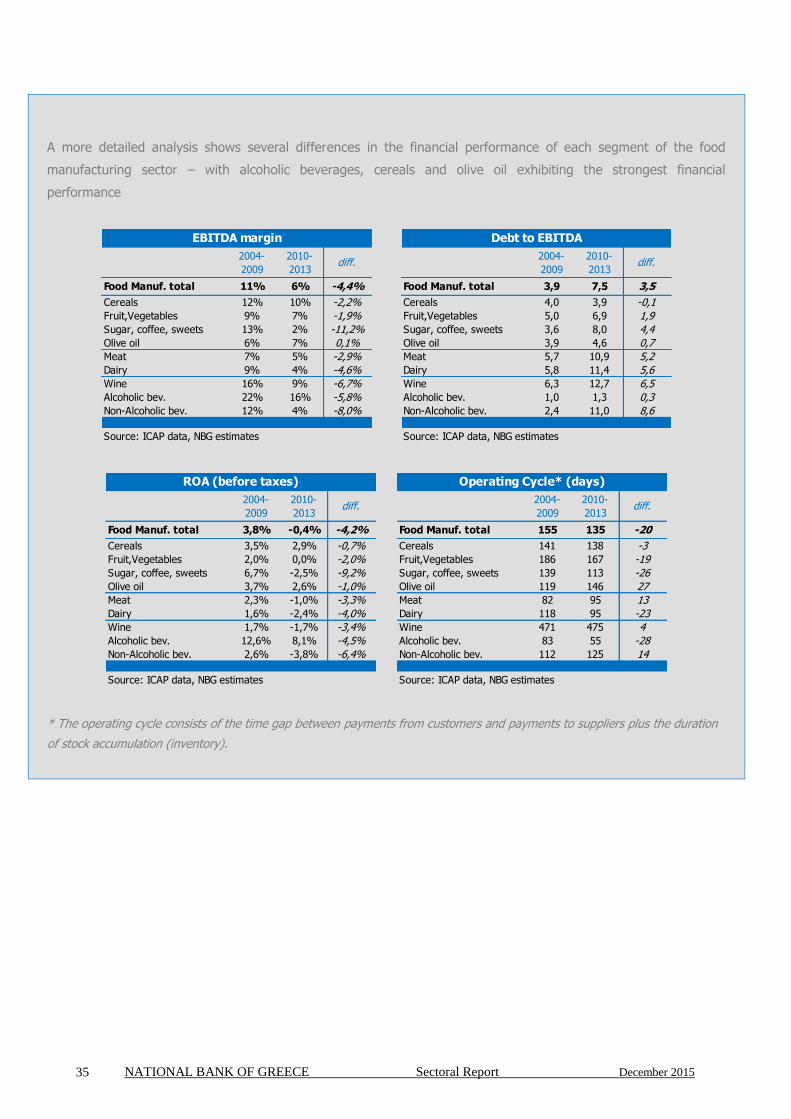
NATIONAL BANK OF GREECE Sectoral Report December 2015 35
A more detailed analysis shows several differences in the financial performance of each segment of the food
manufacturing sector – with alcoholic beverages, cereals and olive oil exhibiting the strongest financial
performance
2004-
2009
2010-
2013diff.
Food Manuf. total 11% 6% -4,4%
Cereals 12% 10% -2,2%
Fruit,Vegetables 9% 7% -1,9%
Sugar, coffee, sweets 13% 2% -11,2%
Olive oil 6% 7% 0,1%
Meat 7% 5% -2,9%
Dairy 9% 4% -4,6%
Wine 16% 9% -6,7%
Alcoholic bev. 22% 16% -5,8%
Non-Alcoholic bev. 12% 4% -8,0%
Source: ICAP data, NBG estimates
EBITDA margin
2004-
2009
2010-
2013diff.
Food Manuf. total 3,9 7,5 3,5
Cereals 4,0 3,9 -0,1
Fruit,Vegetables 5,0 6,9 1,9
Sugar, coffee, sweets 3,6 8,0 4,4
Olive oil 3,9 4,6 0,7
Meat 5,7 10,9 5,2
Dairy 5,8 11,4 5,6
Wine 6,3 12,7 6,5
Alcoholic bev. 1,0 1,3 0,3
Non-Alcoholic bev. 2,4 11,0 8,6
Source: ICAP data, NBG estimates
Debt to EBITDA
2004-
2009
2010-
2013diff.
Food Manuf. total 3,8% -0,4% -4,2%
Cereals 3,5% 2,9% -0,7%
Fruit,Vegetables 2,0% 0,0% -2,0%
Sugar, coffee, sweets 6,7% -2,5% -9,2%
Olive oil 3,7% 2,6% -1,0%
Meat 2,3% -1,0% -3,3%
Dairy 1,6% -2,4% -4,0%
Wine 1,7% -1,7% -3,4%
Alcoholic bev. 12,6% 8,1% -4,5%
Non-Alcoholic bev. 2,6% -3,8% -6,4%
Source: ICAP data, NBG estimates
ROA (before taxes)
2004-
2009
2010-
2013diff.
Food Manuf. total 155 135 -20
Cereals 141 138 -3
Fruit,Vegetables 186 167 -19
Sugar, coffee, sweets 139 113 -26
Olive oil 119 146 27
Meat 82 95 13
Dairy 118 95 -23
Wine 471 475 4
Alcoholic bev. 83 55 -28
Non-Alcoholic bev. 112 125 14
Source: ICAP data, NBG estimates
Operating Cycle* (days)
* The operating cycle consists of the time gap between payments from customers and payments to suppliers plus the duration
of stock accumulation (inventory).

NATIONAL BANK OF GREECE Sectoral Report December 2015 36
Appendix D: Econometric models
A. Agricultural model
NBG Research estimated a global land productivity model to assess the underlying potential of Greece’s
agricultural value added. The model is based on cross-section data for the world’s main agricultural producers.
Our sample consists of 167 countries, accounting for more than 90 per cent of global agricultural production.
In order to take account for the effect of the different size of each country, we have expressed the variables
in terms of their level per unit (ha) of utilized agricultural area. The explanatory variables are the following:
First we examine the land productivity based solely on the inputs of agricultural production. The Inputs Index
consists of three main variables:
Materials index, concerning i) value of seeds purchased (€/ha), ii) value of net imports of forage
(€/ha), iii) agricultural water withdrawal (m3/ha) and iv) fertilizers (tonnes/ha)),
Labour used in agricultural production (employees/ha).
Capital investment concerning agricultural land development and machinery (€/ha).
Against this background, we calculate a Cobb-Douglas production function:
agriVAi = 0.19 materialsi + 0.28 labouri + 0.63 capli + 0.28 capei
(2.87) (5.70) (14.08) (6.31)
R2 =0.65, DW=2.23
where:
agriVAi: the natural logarithm of agricultural value added over the period 2010-2012 for the country i (in
USD/ha)
materialsi: the natural logarithm of materials index as described above, for country i (index: world
average=100)
labouri : the natural logarithm of employees per ha of land for country i (index: world average=100)
capli: the natural logarithm of investment in land (gross capital stock 2000-2010) for country i (index: world
average=100)
capei: the natural logarithm of investment in equipment (gross capital stock 2000-2010) for country i (index:
world average=100)
Second, we examine the factors determining TFP (as measured by the residual of the previous equation:
Natural attributes Index: It consists of four (equally weighted) variables measuring landscape and
climate conditions: (i) length of coastline per area, (ii) annual sunshine hours, (iii) annual volume of
rainfall and (iv) quality of the soil. The quality of the soil (fourth component) is measured through three
variables: carbon content in the topsoil, degree of land degradation (negative effect) and the degree of
land erosion (negative effect).
Technology: As a proxy for technology used in production we considered agricultural R&D expenditure
(€/ha), based on evidence that the two variables are highly correlated.

NATIONAL BANK OF GREECE Sectoral Report December 2015 37
Brand Index: The degree of branding is approached using relative export prices per agricultural
product. It affects TFP negatively as a higher value index suggests a lower quality brand.
Cooperative Index: This index describes the degree of agricultural cooperatives development as shown
by their share in agricultural products sales. Wherever data was not available, values were estimated
based on the evaluation of cluster development (WEF/global competitiveness report).
Based on our model, these five variables determine 92 per cent of the global agricultural value added per area
of utilized land.
TFPi = 1.41 naturali + 0.64 technologyi – 0.58 brandi + 5.55 cooperativei + 0.55 dummyi - 2.27
(3.07) (3.41) (4.97) (3.01) (3.03) (-3.14)
R2 =0.67, DW=2.05
where:
TFPi: TFP for the country i
naturali: natural attributes index, for country i (index: world average=100)
technologyi: agricultural R&D (in USD/ha) for country i
brandi: brand index for country i (rank from 1 (best) to 122 (worst))
cooperativei: cooperative index for country i (index: world average=100)
dummyi: country size
i: Albania, Argentina, Australia, Azerbaijan, Afghanistan, Angola, Antigua, Armenia, Bahrain, Barbados,
Botswana, Brazil, Bangladesh, Belarus, Belize, Benin, Bhutan, Bolivia, Bosnia, Brunei, Burkina Faso, Burundi,
Cambodia, Cameroon, Canada, Central Africa, Chad, Comoros, Congo, Cote d’Ivoire, Cuba, Djibouti, Chile,
China, Colombia, Costa Rica, Cabo Verde, Dominican Republic, Ecuador, El Salvador, Georgia, Guatemala,
Guinea, Eritrea, Ethiopia, Fiji, Gabon, Gambia, Ghana, Grenada, Honduras, Iceland, Iraq, Haiti, Hong Kong
SAR, India, Indonesia, Iran, Jamaica, Japan, Jordan, Kazakhstan, Kenya, Kyrgyz Republic, Korea, Kuwait,
Laos, Lesotho, Liberia, Libya, FYROM, Madagascar, Malawi, Mali, Mauritania, Moldova, Mongolia, Myanmar,
Namibia, Lebanon, Malaysia, Mauritius, Mexico, Serbia, Mozambique, New Zealand, Nicaragua, Nepal, Niger,
Nigeria, Pakistan, Panama, Papua New Guinea, Paraguay, Puerto Rico, Rwanda, Sierra Leone, Somalia, Sri
Lanka, Suriname, Swaziland, Tajikistan, Tanzania, Timor-Leste, Togo, Trinidad-Tobago, Turkmenistan,
Uzbekistan, Venezuela, Yemen, Zambia, Oman, Peru, Philippines, Qatar, Russian Federation, Saudi Arabia,
Senegal, South Africa, Thailand, Uganda, Ukraine, United Arab Emirates, United States, Uruguay, Vietnam,
Zimbabwe, Belgium, Bulgaria, Czech Republic, Denmark, Germany, Estonia, Ireland, Greece, Spain, France,
Croatia, Italy, Cyprus, Latvia, Lithuania, Luxembourg, Hungary, Malta, The Netherlands, Austria, Poland,
Portugal, Romania, Slovenia, Slovakia, Finland, Sweden, United Kingdom, Norway, Switzerland, Turkey,
Algeria, Egypt, Israel, Morocco, Syria, Tunisia.

NATIONAL BANK OF GREECE Sectoral Report December 2015 38
B. Food manufacturing model
NBG Research estimated a food manufacturing value added model in order to assess the Greek sector’s
potential. The model is based on cross-section data, with a global sample of 96 countries. The explanatory
variables are:
Product mix: The structure of agricultural production and specifically the ratio of Crops/Livestock
Technology: As a proxy for technology used in production we considered agricultural R&D expenditure
(€/ha), based on evidence that the two variables are highly correlated. One of the main objectives of
agricultural research is to improve the stability of both the quantity and the quality of agricultural
production. This supports the development of standardized products with unique characteristics.
Brand Index: The degree of branding is approached using relative export prices per agricultural
product.
Business Environment Index, consisting of 3 sub-indices (equally weighted), concerning (i) business
impact of rules on FDI, (ii) local suppliers’ attention to quality and (iii) local suppliers’ attention to
quantity (source: Global Competitiveness report 2014-2015)
Based on our model, these variables determine 59 per cent of the global manufacturing value added as a
share of agricultural output.
manVAi = -3.21 cli + 0.15 technologyi -0.28 brandi +0.40 bei + 5.29 dummyi
(-2.94) (5.72) (-4.10) (4.82) (2.24)
R2 =0.59, DW=2.04
where:
manVAi: food manufacturing value added as % of agricultural output for country i
cli: ratio of crops vs. livestock agricultural production value for country i
technologyi: agricultural R&D for country i (in USD/ha)
brandi: brand index for country i (rank from 1 (best) to 122 (worst))
bei: business environment index as described above for country i (index, world average=100)
dummyi: 5 regions (from less likely (1) to most likely (5) to develop food manufacturing activities): 1=Africa
and Asia (excl. South-East Asia), 2=South-East Asia, 3=Europe (excl. Medit.) and South America,
4=Mediterranean (in EU), 5=North America
i: Albania, Australia, Azerbaijan, Armenia, Botswana, Brazil, Cameroon, Canada, Chile, China, Colombia,
Ecuador, Georgia, Ethiopia, Iceland, Hong Kong SAR, India, Indonesia, Iran, Japan, Jordan, Kazakhstan,
Kenya, Kyrgyz Republic, Korea, Kuwait, FYROM, Madagascar, Malawi, Moldova, Mongolia, Lebanon, Malaysia,
Mauritius, Mexico, Serbia, New Zealand, Nepal, Pakistan, Sri Lanka, Tanzania, Trinidad-Tobago, Yemen,
Oman, Peru, Philippines, Qatar, Russian Federation, Senegal, South Africa, Thailand, Ukraine, United States,
Uruguay, Vietnam, Belgium, Bulgaria, Czech Republic, Denmark, Germany, Estonia, Ireland, Greece, Spain,
France, Italy, Cyprus, Latvia, Lithuania, Luxembourg, Hungary, Malta, The Netherlands, Austria, Poland,
Portugal, Romania, Slovenia, Slovakia, Finland, Sweden, United Kingdom, Norway, Switzerland, Turkey, Egypt,
Israel, Morocco, Tunisia.
NATIONAL BANK OF GREECE Sectoral Report December 2015 39
NATIONAL BANK OF GREECE
This report is provided solely for the information of professional investors who are expected to make their own investment decisions without undue reliance on its contents. Under no circumstances is it to be used or considered as an offer to sell, or a solicitation of any offer to buy. Any data provided in this bulletin has been obtained from sources believed to be reliable. Because of the possibility of error on the part of such sources, National Bank of Greece does not guarantee the accuracy, timeliness or usefulness of any information. The National Bank of Greece and its affiliate companies accept no liability for any direct or consequential loss arising from any use of this report.
SECTORAL REPORT
December 2015