of streptomyces griseus bacteriophages jindanuch maneekul
TRANSCRIPT

APPROVED: Lee Hughes, Major Professor Robert Benjamin, Committee Member Rajeev Azad, Committee Member Jyoti Shah, Chair of the Department of
Biological Sciences Su Gao, Dean of the College of Science Victor Prybutok, Dean of the Toulouse
Graduate School
EXPLORATION OF GENOME LENGTH, BURST TIME, AND BURST SIZE
OF Streptomyces griseus BACTERIOPHAGES
Jindanuch Maneekul
Thesis Prepared for the Degree of
MASTER OF SCIENCE
UNIVERSITY OF NORTH TEXAS
May 2019
Maneekul, Jindanuch. Exploration of Genome Length, Burst Time, and Burst Size of
Streptomyces griseus Bacteriophages. Master of Science (Biochemistry and Molecular
Biology), May 2019, 65 pp., 7 tables, 28 figures, 1 appendix, references, 42 titles.
Since phages use the host resources to replicate themselves after infection, the
different sizes of the phage genome should influence the replication rate. We, therefore,
hypothesized that the smaller genomes should burst the cell faster than the larger ones. As
well, the shorter genomes would have greater burst sizes because they should replicate faster.
Here, we obtained 16 phages of various genome length. All phages were isolated on
Streptomyces griseus and available in our phage bank at the University of North Texas. We
performed one-step growth studies for the 16 phages, as well as determined the host doubling
time from its growth curve. The results show that S. griseus grown in nutrient broth has a
doubling time of 5 hours and 22 minutes. This doubling time is used as a guideline for the
phage growth studies. Because the filamentous nature of the host caused several difficulties
during the experiment, we isolated single cells by sonication and centrifugation. After the cell
number was determined by viable cell count, the cells were infected with each type of phage
using a multiplicity of infection (MOI) of 0.5. The results show that phages’ burst times
range between 45 (±0, standard error) and 420 (±30) minutes and burst sizes from 12 (±0) to
1500 (±60) The statistical analyses show that there is no correlation between either genome
size and burst time (R= -0.01800, P=0.97894) or genome size and burst size (R= -0.32678,
P=0.21670). We further performed the comparative genomics studies to investigate whether
the phages with similar burst times and burst sizes show similar genome structures. The
studies show that Eddasa and Lorelei have similar burst times of 45 to 60 minutes and share
52 homologs. For burst size, only Tribute and Blueeyedbeauty that have similar burst sizes of
21-30, and they are genetically related because of the 48 shared homologs. Although this
study did not find any correlation between genome size and burst time/burst size, it provides
a foundation for further studies to determine what regulates these two traits.
ii
Copyright 2019
by
Jindanuch Maneekul

iii
ACKNOWLEDGMENTS
First, I would like to thank Dr. Lee Hughes who has always supported me since the
beginning of my study in the US. When I picked this project, he was the one who gave me
comments and directed me to the right track. I would like to thank my committee members,
Dr. Robert Benjamin and Dr. Rajeev Azad, for their supports and valuable comments.
In the lab, we have had so much fun together. We have helped each other overcome
many challenges throughout our experiments. I would like to thank all my lab mates, especially
my proofreaders. I am so lucky to be among such great people.
More importantly, I would like to thank Dr. Paul Hyman, a professor at Ashland
University and the author of “Practical Methods for Determining Phage Growth Parameters”.
The paper was and still is the phage-growth bible for me. He has always been there for me
whenever I had difficulties understanding the concepts of one-step growth. I started from
scratch two years ago, and now I have improved my phage knowledge so much. This could
have not happened without the insightful explanations from Dr. Hyman.
Finally, I would like to thank Long Tran, a Ph.D. student from the Mathematics
department, and a supportive boyfriend. He deserves my thanks for all the statistic parts. He is
the only one who stays beside me, emotionally and physically supports me, and has even
helped me understand some biological concepts. Also, I would like to express my deepest
thanks to Thailand, the place where my warm family lives. The thoughts of them have always
pushed me forward and prevented me from ever giving up.

iv
TABLE OF CONTENTS
Page
ACKNOWLEDGMENTS ....................................................................................................iii
LIST OF TABLES ............................................................................................................... vi
LIST OF FIGURES ............................................................................................................ vii
CHAPTER 1. INTRODUCTION .......................................................................................... 1
1.1 Bacteriophage ...................................................................................................... 1
1.1.1 Classification, Morphology, and Structure ................................................... 1
1.1.2 Phage Life Cycle ........................................................................................ 2
1.1.3 Phage Growth Terminology ....................................................................... 6
1.1.4 One-Step Growth ....................................................................................... 7
1.1.5 Cell Lysis Mechanism ................................................................................ 9
1.2 Streptomycetes .................................................................................................. 10
1.2.1 Taxonomy and Cell Structure ................................................................... 11
1.2.2 Streptomycete Life Cycle ......................................................................... 11
1.3 Importance of this Study .................................................................................... 12
1.4 Hypotheses ........................................................................................................ 12
1.5 Research Objectives ........................................................................................... 13
1.6 Scope of Research.............................................................................................. 13
CHAPTER 2. METHODOLOGY ...................................................................................... 14
2.1 Bacterial Culture and Condition ........................................................................ 14
2.1.1 Bacterial Strain and Growth ..................................................................... 14
2.1.2 Single Cell Generation ............................................................................. 14
2.1.3 Cell Counting ........................................................................................... 15
2.2 Phage Selection and High-Titer Lysate ............................................................. 16
2.3 Preliminary Burst Time Determination ............................................................. 16
2.3.1 Freezing Cells .......................................................................................... 17
2.3.2 Thawing Frozen Cells .............................................................................. 17
2.3.3 Burst Time Determination ........................................................................ 17
2.4 One-Step Growth Studies .................................................................................. 18
2.5 Statistical Analyses ............................................................................................ 20
2.6 Bioinformatic Studies ........................................................................................ 20

v
CHAPTER 3. RESULTS ................................................................................................... 21
3.1 Streptomyces griseus Growth and Doubling Time ................................................. 21
3.2 Burst Times and Burst Sizes for the 16 Phages .................................................. 22
3.3 Bioinformatics: The Comparative Genomics ..................................................... 29
CHAPTER 4. DISCUSSION ............................................................................................. 43
4.1 Streptomyces griseus Growth and Doubling Time ............................................. 43
4.2 Phage Growth Protocol ..................................................................................... 44
4.3 Burst Times and Burst Sizes for the 16 Phages .................................................. 49
4.4 Conclusion ........................................................................................................ 51
APPENDIX: SUPPLEMENTAL DATA ............................................................................ 52
REFERENCES .................................................................................................................. 61

vi
LIST OF TABLES
Page
Table 1.1 Phage classification ............................................................................................. 1
Table 1.2 Gathered data from several hosts regarding burst time and burst size ................ 10
Table 2.1 Bacteriophages used in this research ................................................................. 16
Table 2.2 Sample collection at each time point. ................................................................ 19
Table 3.1 Burst times and burst sizes for 16 phages sorted by genome size. ...................... 23
Table 3.2 Statistical analysis ............................................................................................. 24
Table 4.1 Burst sizes from various host organisms ........................................................... 50

vii
LIST OF FIGURES
Page
Figure 1.1. Structure of mature phage T4 ........................................................................... 2
Figure 1.2. Lytic phage cycle .............................................................................................. 4
Figure 1.3. Stages of infection for lytic and temperate phage ............................................. 5
Figure 1.4. Phage growth terminology ............................................................................... 6
Figure 1.5. Eclipse and latent period for RB69 (WT) and RB69 sta5 (mutant) phages ........ 8
Figure 1.6. Phage P1 endolysin activation in the periplasm of E. coli ................................ 9
Figure 1.7. Streptomycete cell structure .......................................................................... 11
Figure 1.8. Streptomyces coelicolor life cycle ................................................................. 12
Figure 2.1. Gridlines in hemocytometer chamber .............................................................. 15
Figure 3.1. S. griseus growth curve determined by using dry weight ................................ 21
Figure 3.2 Burst times and burst sizes for the 16 phages ................................................ 25
Figure 3.3 16 phages growth curves. ................................................................................ 27
Figure 3.4 Phage groups based on their burst times. ......................................................... 29
Figure 3.5 Phage groups based on their burst sizes. .......................................................... 30
Figure 3.6 Comparison of Eddasa and Lorelei genome maps (41-60 minutes burst time) . 32
Figure 3.7 Comparison of Tribute and Gibson genome maps (101-120 minutes burst time)
........................................................................................................................................... 33
Figure 3.8 Comparison of Tribute, Romero, and Gibson genome maps (101-120 minutes
burst time) .......................................................................................................................... 34
Figure 3.9 Comparison of Raleigh and Karimac genome maps (161-180 minutes burst
time) ................................................................................................................................... 35
Figure 3.10 Comparison of Blueeyedbeauty and Wentworth genome maps (281-300 minutes
burst time) ........................................................................................................................... 36
Figure 3.11 Comparison of Lorelei, Karimac, and Romero genome maps (11-20 burst size)
........................................................................................................................................... 37
Figure 3.12 Comparison of Lorelei and Romero genome maps (11-20 burst size) ............. 38
Figure 3.13 Comparison of Izzy, Tribute, Blueeyedbeauty, and Wentworth genome maps
(21-30 burst size) ............................................................................................................... 39
Figure 3.14 Comparison of Blueeyedbeauty, Izzy, Wentworth genome maps (21-30 burst
size) ................................................................................................................................... 40
Figure 3.15 Comparison of Wentworth, and Tribute genome maps (21-30 burst size) ....... 41
Figure 3.16 Comparison of Eddasa and Comrade genome maps (31-40 burst size) ........... 42

viii
Figure 4.1 Progenies from a single-cell host in the diluted biological system ................... 45
Figure 4.2 Progenies from a filamentous host in the diluted biological system ................ 46
Figure 4.3 Inaccurate infected cell number. ..................................................................... 47

1
CHAPTER 1
INTRODUCTION
1.1 Bacteriophage
1.1.1 Classification, Morphology, and Structure
Bacteriophages (also known as phages) are prokaryote-specific viruses that were first
discovered in 1915 and 1917 by William Twort and Felix d’Herelle respectively (Ackermann,
2007; Brussow, 2005; Edwards et al., 2005). Phages are highly abundant and diverse on our
planet. There are 10 families with many different morphologies as shown in Table 1.1.
According to the Actinobacteriophage Database (retrieved from www.phagesDB.org), most of
the actinobacteriophages belong to the Siphoviridae family, while a small percentage of
bacteriophages are classified as Myoviridae, Podoviridae or Tectiviridae.
Table 1.1
Phage classification (adapted from Ackermann 2007).
Shape Order or family Nucleic acid Example Actinobacteriophage
example
Caudovirales dsDNA (L), no envelope
Myoviridae Tail contractile T4 Adlitam
Siphoviridae Tail long, noncontractile l Izzy
Podoviridae Tail short T7 Immanuel3
Microviridae ssDNA (C), 27 nm, 12
knoblike capsomers
f X174
Corticoviridae dsDNA (C), complex
capsid, lipids, 63 nm
PM2
Tectiviridae dsDNA (L), inner lipid
vesicle, pseudo-tail, 60 nm
PRD1 WheeHeim
Leviviridae ssRNA (L), 23 nm, like
poliovirus
MS2
(table continues)

2
Shape Order or family Nucleic acid Example Actinobacteriophage
example(s)
Cystoviridae dsRNA (L), segmented,
lipidic envelope, 70–80
nm
f 6
Inoviridae ssDNA (C), filaments or
rods, 85–1950 x 7 nm
fd
Plasmavirida dsDNA (C), lipidic
envelope, no capsid, 80
nm
MVL2
C; circular, L; linear
Phage T4 is the most well-studied and commonly used phage model for the
Caudovirales. According to Yap and Rossmann (2014), phage structures consist of protein
molecules including the head capsid proteins, that contain the nucleic acid, neck and collar
proteins, body proteins, base plate proteins, and tail fibers proteins as shown in Figure 1.1.
Figure 1.1. Structure of mature phage T4 (Yap and Rossmann 2014)
1.1.2 Phage Life Cycle
Study of phage growth is one of the crucial tools used to gain insight into the biological
system. Phages have two life cycles, lytic and lysogenic. Phages that enter the lytic cycle are
called lytic phage, whereas ones entering the lysogenic cycle are temperate phages (Martha et
al., 2011, Brussow, 2005, Nicastro et al., 2016). Most phages are lytic phage, which lyse the
bacterial cell wall of all successfully infected cells and release progeny phages into the
Head capsid
Neck and collar
Body
Baseplate
Tail fiber

3
environment. This final step leads to cell lysis and death of the host bacteria (Hyman et al.,
2009; Brussow, 2005). A smaller percent of phages is temperate and can undergo and maintain
the lysogenic state for thousands of generations (Brussow, 2005; Nicastro et al., 2016). One
unique feature of temperate phages is genome insertion. After the phage injects its nucleic acid
into the host cell, the phage genome is inserted into the host genome. This is one aspect of
importance for studying genetic diversity in phages.
In order to study phage life cycle in detailed, we need to take a closer look at the
molecular mechanisms occurring between a phage and its host which is shown below in terms
of stages of infection.
1.1.2.1 Stages of Infection for Lytic Phages (Nicastro et al., 2016; Hyman et al., 2009; Abedon,
2012)
As shown in Figure 1.2, after a lytic phage meets with its host, there are several
molecular events occurring inside the cell.
• Phage adsorption: single or multiple phages bind to receptors on the bacterial cell
surface, the phages then inject their genetic material into the host cytosol.
• DNA replication: by using the host resources and phage’s proteins, DNA is
replicated separately from the host genome.
• Protein synthesis: phages proteins are transcribed and translated into phage-specific
proteins such as major capsid protein, tail fiber, endolysin, peptidoglycan, RecA
DNA recombinase, etc. Genes expressed at the initial stage of infections are called
early genes. They usually encode proteins that regulate protein expression of other
molecules such as assembly-related genes and lysis genes. Some of the early genes
also regulate the host molecular mechanisms to take over it, for example, cI, cro,

4
N. On the other hand, genes encoding proteins that are regulated by early genes are
called late genes (Mioduser et al., 2017).
• Phage assembly: phage progenies are produced by an assembly of capsid proteins
and nucleic acid. The virions, as well as holin and endolysin proteins, are
accumulated in the host cytosol and membrane respectively.
• Cell lysis: when holin is making pores in the inner membrane, it causes proton
motive force which releases and activates endolysin. Afterward, activated
endolysin migrates from the cytosol to catalyze peptidoglycan. Once the cell wall
is lysed, progeny particles are liberated into the environment, ready to infect new
host cells (Xu et al., 2004; Hyman et al., 2009; Young, 2014).
Figure 1.2. Lytic phage cycle (Science Education Alliance Howard Hughes Medical Institute,
2013)

5
1.1.2.2 Stages of Infection for Lysogenic Phages (Nicastro et al., 2016; Hyman et al., 2009;
Abedon, 2012)
After the phage adsorbs to the cell and injects its nucleic acid to the cell cytosol, there
are several molecular events occurring during the lysogenic state as shown below.
• DNA recombination: the phage genome recombines to become a part of the host
genome. Integrase is required in this process. Once the integration is successful, the
phage genome is called prophage (Figure 1.3).
• Protein synthesis: there are some genes expressed during the lysogenic cycle such
as immunity repressor. The gene function is to prevent the phage from entering the
lytic cycle so that they can maintain the lysogenic state (Defais et al., 1983;
Lundqvist and Bertani, 1984).
• Host cell division: when the bacterial cell undergoes protein synthesis and binary
fission, the daughter cells inherit the phage genome. The cells having prophage are
called lysogeny.
Figure 1.3 Stages of infection for lytic and temperate phage: The lytic phage replicates itself
inside the host followed by assembly and lysis. The temperate phage does not replicate the
DNA but inserts the genome and becomes a prophage within the bacterial DNA (Science
Education Alliance Howard Hughes Medical Institute, 2013).

6
1.1.3 Phage Growth Terminology
When phage growth is taken into consideration, eclipse period, latent period (so-called
burst or lysis time), rise period, plateau period, and burst size are involved. Eclipse period
begins from infection to the time right before progeny particles are assembled. During this
time, the graph will show a stable level of phage particles (plaque-forming unit: pfu). At the
end of the eclipse period, the phage progenies begin to accumulate within the cell. If we
combine the eclipse period to the period before burst (or post-eclipse), the extended period is
now called “latent period” (Figure 1.4). In this study, the latent period is equivalent to burst
time or lysis time which means the time right before lysis begins.
Since all infected cells do not burst at the same time, the rise period is observed (Figure
1.4B). During this time, a significant increase in the number of phage particle can be detected.
The end of the rise period is when it reaches the plateau period which is involved in burst size
determination.
(A) (B)
Figure 1.4. Phage growth terminology: (A) Different stages before and after infection; eclipse
period starts after infection to phage assembly (Heineman and Bull, 2007). (B) Latent period,
rise period, plateau period, and burst size (Gwak et al., 2018)

7
Burst size is the number of progeny particles that are released from one bacterium. The
total number of liberated phage particles shown at the plateau period is used to determine burst
size.
Thus, burst size = 𝑁𝑢𝑚𝑏𝑒𝑟 𝑜𝑓 𝑙𝑖𝑏𝑒𝑟𝑎𝑡𝑒𝑑 𝑝ℎ𝑎𝑔𝑒 𝑝𝑎𝑟𝑡𝑖𝑐𝑙𝑒𝑠
𝑁𝑢𝑚𝑏𝑒𝑟 𝑜𝑓 𝑖𝑛𝑓𝑒𝑐𝑡𝑒𝑑 𝑏𝑎𝑐𝑡𝑒𝑟𝑖𝑎𝑙 𝑐𝑒𝑙𝑙𝑠 Generally, burst size is reported
without a unit (Hyman et al., 2009).
1.1.4 One-Step Growth
One-step growth experiment was first proposed by Ellis and Delbruck in 1939. It is an
important method used to study phage growth and its parameters are recently mentioned in
1.1.3. Basically, this method is designed to avoid multiple cycles of phage growth.
The protocol described by Hyman et al. (2009) is comprised of adsorption and
synchronization, post-adsorption dilution, eclipse and latent period determination, and stand-
alone burst size.
The first step of this experiment is to infect the host cells with phage particles (or phage
adsorption). An appropriate phage-to-host ratio, or multiplicity of infection (MOI), is
employed. When using MOI of 0.1 (1 phage to 10 bacterial cells), 95% of infected cells will
be infected by only one phage particle. This is important to determine unadsorbed cell number,
and also to control the number of phage particles that infect the cell. After phages are added to
host bacteria, the suspension will be incubated for a short period of time to allow the phages
to adsorb and inject their genetic material into the cell.
After a quick incubation (10-15 minutes), the suspension will be diluted to reduce the
chance of multiple adsorptions. This is very crucial because (1) it is a synchronization meaning
that phages failing to adsorb during the short incubation will be prevented from further
infections and (2) it prevents the system from multiple adsorptions as the progeny phages fail
to meet new hosts. In addition to the dilution, free phage removal will be performed, if needed.

8
The diluted suspension is then incubated for a long period of time. Samples will be
taken at each time interval. A released phage titer will be determined subsequently to observe
the phage growth over time. In this step, if a sudden rise of the phage titer is detected, it will
be called either “end of constant period” or “minimum latent period”. Individual cell lysis time
can be varied, this is a reason why there is a “rise period” shown in the one-step growth curve
(Figure 1.5).
For burst size determination, the ratio of phage titer at the end of the rise period to the
number of infected cells will be computed as described previously.
Nevertheless, we have to be aware that one-step growth is best employed to study
phages and their single cell hosts and this process is complicated when studying a host such as
Streptomyces which grows through production of hyphae or mycelia.
Figure 1.5. Eclipse and latent period for RB69 (WT) and RB69 sta5 (mutant) phages
(Hyman et al., 2009)

9
1.1.5 Cell Lysis Mechanism
Many previous studies have shown that phage lysis time is triggered by the holin-
endolysin system. The two proteins are encoded by the phage genome. The endolysin is a small
muralytic enzyme with an approximate molecular mass of 18 kDa (for gram-negative bacteria
phages) (Xu et al., 2005) and 25-40 kDa (for gram-positive bacteria phages) (Fischetti, 2010).
It is produced in an inactive form such that the N-terminus, so-called signal arrest and release
(SAR) domain, is embedded in the inner membrane (Figure 1.6).
Figure 1.6. Phage P1 endolysin activation in the periplasm of E. coli (Xu et al., 2005)
At the genetically scheduled time, holin, a membrane protein, makes holes in the inner
membrane. The proton motive force from this process activates the endolysin by releasing it
from the membrane. Once the protein is free, it migrates to and catalyzes the peptidoglycan
layer resulting in cell lysis (Young, 2014).

10
1.2 Streptomycetes
In this study, we are interested in Streptomyces phages because the University of North
Texas is one of the Howard Hughes Medical Institute’s Science Education Alliance-Phage
Hunters Advancing Genomics and Evolutionary Science (SEA-PHAGES) institutions and
through this program has developed a large Streptomyces phage bank. From this project, more
than 400 phages available for Streptomyces phages have been isolated (retrieved from
http://phagesdb.org/institutions/UNTD). Additionally, we found no reports regarding a
correlation between Streptomyces phages’ genome length and their burst time and burst size
(Table 1.2).
Table 1.2
Gathered data from several hosts regarding burst time and burst size
Phage Host Phage genome
length (kb)
Burst time
(min) Burst size References
HWPB-1
P. aeruginosa N/A
100 392.8 ±
220.1
Lindberg,
McKean, and
Wang (2014)
HWPB-2 50 260.0 ±
101.9
HWPB-3 93±7 36.8 ± 15.1
HWNPB-1 70±6 589.4 ± 12.6
HWNPB-2 47±3 246.1 ± 55.3
HWNPB-3 47±3 116.5 ± 42.5
P1 L. plantarum
IMAU10120 73.8 90
132.88 ±
2.37
Chen, et al.
(2016)
φX174 E.coli 5.4 12.2 N/A Baker, et al.
(2016)
T7 E. coli IJ1133 40 13.3 266 to 327 Heineman and
Bull (2007)
PHq0 Pseudoalteromonas
BQ0 33.4 15 363
Wang et al.
(2016)
Kampy M. smegmatis 51.4 95-100 N/A Halleran, et al.
(2015)
ΦStp1 Salmonella N/A 30 37 Sritha and
Bhat (2018)
514-3 S. griseus
N/A
120 75-100 Gilmour, et al.
(1959)
VP11 S. coelicolor 40 40 Dowding
(1973)

11
1.2.1 Taxonomy and Cell Structure
The Genus Streptomyces are gram-positive bacteria classified in the family
Streptomycetaceae, phylum Actinobacteria (Stackebrandt et al., 1997). Streptomycetes are
unusual bacteria because they are not a single cell prokaryote but produce 0.5-2 µm mycelium
(Figure 1.7A) and have moldlike growth habits. There are two types of mycelia: substrate and
aerial. Substrate mycelia grow from a germinating spore on the agar surface and produce
pigments, while aerial mycelia grow into the air and develop hyphae that can produce spores
(Wink et al., 2017).
Figure 1.7. Streptomycete cell structure: (A) Cryoscanning electron micrograph of S.
coelicolor M145 aerial hyphae (Zhang et al., 2016). (B) The gram-positive cell wall structure
(Brooks et al., 2012).
1.2.2 Streptomycete Life Cycle
According to Figure 1.8, when a mature spore is in the appropriate conditions, such as
optimum temperature, humidity, and nutrients, it will germinate and develop substrate
mycelium by branch extension. It has been reported that when spores are inoculated, RNA and
protein syntheses occur within 5 minutes (Mikulík et al., 1984). After 30 hours of inoculation,
the aerial mycelia have developed and produced several bioactive agents known as secondary
metabolites. When the morphological differentiation has begun, the aerial mycelia grow into
A B

12
the air and after 2 days, they stop growing branches. At this point, prespores are produced from
the septation of the mycelia. The prespores will then differentiate into mature spores.
Figure 1.8. Streptomyces coelicolor life cycle (Angert, 2005)
1.3 Importance of this Study
As described earlier, we found no prior reports regarding a relationship between
Streptomyces phages’ genome length and their burst time or burst size (Table 1.2). In this
study, we would like to get insights into Streptomyces phage biology by providing a one-step
growth protocol for the filamentous hosts.
1.4 Hypotheses
During the lytic cycle, genome length should affect the replication and protein synthesis
rate because the longer genomes would take longer to replicate as well as use more resources
from the host cells. As the longer genomes would take longer, their burst size would be smaller.
We, therefore, developed hypotheses as shown below.

13
1.4.1 Shorter phage genomes will burst the host faster than larger phage genomes, and vice
versa.
1.4.2 Shorter phage genomes will have greater burst size than larger phage genomes, and
vice versa.
1.5 Research Objectives
1.5.1 To determine the infected cell incubation period by using S. griseus doubling time.
1.5.2 To determine burst time and burst size for 16 phages isolated on Streptomyces griseus
(ATCC 10137).
1.5.3 To evaluate the relationship between burst time and phage genome length.
1.5.4 To evaluate the relationship between burst size and phage genome length.
1.5.5 To perform comparative genomics within the same phage group of burst time and burst
size.
1.6 Scope of Research
1.6.1 Determine S. griseus growth curve and doubling time.
1.6.2 Make high-titer lysate of 16 phages isolated on S. griseus ATCC 10137 (phage list
shown in Table 2.1).
1.6.3 Perform a one-step growth method for lysis time and burst size determination using 16
phages.
1.6.4 Perform the comparative genomics between groups of burst time and burst size.

14
CHAPTER 2
METHODOLOGY
2.1 Bacterial Culture and Condition
2.1.1 Bacterial Strain and Growth
Streptomyces griseus (ATCC 10137) was used as the bacterial host for the entire study.
The bacterial culture was grown in nutrient broth and agar (Difco™ Nutrient Broth and
Difco™ Agar, Granulated; Becton, Dickinson and Company) supplemented with media
supplement (3 mM MgCl2, 2 mM Ca(No3)2, and 24 mM glucose). The liquid culture was
incubated for 24 hours in the 30°C New Brunswick Scientific G-25 incubator shaker with a
speed of 210 rpm, while the bacteria on agar was incubated for 24-36 hours in the 30°C
Thermo Scientific™ HeraTherm incubator.
Doubling time and growth curve of this strain were determined by using dry weight
method. 15 mL of log-phase culture was inoculated into 1.5 L of nutrient broth. 50- mL
samples were taken every 4 hours up to 72 hours. The samples were then processed
immediately after each collection, otherwise, it was held at 4°C. Each sample was filtered
through a pre-weighed 0.45 µm filter membrane which was dried at 35°C for 120 hours. The
membrane was weighed afterward to compute bacterial dry weight at each time point. The data
was gathered to create a growth curve and determine bacterial doubling time.
2.1.2 Single Cell Generation
S. griseus single cells were used for the one-step growth experiment. They were
generated by using sonication and centrifugation. 350 µl cultures were diluted with 6 mL
nutrient broth (supplemented with media supplement). The diluted suspension was
subsequently sonicated for 3 minutes. Since the sonication generates heat, the suspension was
sonicated only 1 minute at a time with 3-4 minutes breaks. The power output used was 4 Watts
(RMS). The sonicated cell suspension was then spun at 300 x g for 3 minutes to separate
remaining clumps. The supernatant was collected, and cell counting was performed.

15
2.1.3 Cell Counting
Cell number was determined by microscopy. The sonicated cell suspension was diluted
10 times using phage buffer then dyed with 0.1% methylene blue with a 1:1 ratio. The stained
suspension was loaded into both hemocytometer chambers, and the cells were counted under
a light microscope with a 400X magnification. See Figure 2.1 for the counting areas.
Figure 2.1. Gridlines in hemocytometer chamber. The blue squares are the counting areas.
(Retrieved from http://dictybase.org/techniques/media/dicty_growth.html)
After counting the cells in the corresponding areas, a cell number was determined as
shown below.
𝐶𝑒𝑙𝑙 𝑛𝑢𝑚𝑏𝑒𝑟 = 𝐴𝑣𝑒𝑟𝑎𝑔𝑒 𝑐𝑒𝑙𝑙 𝑐𝑜𝑢𝑛𝑡 × 5 × 2 × 10 × 104 cell/mL
Note that x5 to obtain the total count from 25 squares, x2 because the cells were stained
with 0.1% methylene blue with 1:1 ratio, x10 because the cell suspension was diluted 10 times,
and x104 to convert 0.1 cu.mm. to 1 mL.

16
2.2 Phage Selection and High-Titer Lysate
16 S. griseus phages were selected for one-step growth studies (Table 2.1). Before
testing, all phage titers were determined by using the plaque assay. High-titer lysates were
made if needed. The protocol for lysate harvesting is described in the STREPTOMYCES
PHAGE: Laboratory Manual. (Science Education Alliance Howard Hughes Medical Institute,
2013). Lysates containing phage buffer (0.01 M pH 7.5 Tris-HCl, 0.01 M MgSO4, 4 g of NaCl,
0.01 M CaCl2, and 980 mL of distilled water) were stored at 4°C.
Table 2.1
Bacteriophages used in this research
Phage name Genome length (kbp) Cluster
Raleigh 40.7 BC2
Percastrophe 46.0 BF
ToriToki 46.1 BF
Romero 46.1 BF
Immanuel3 46.1 BF
BryanRecycles 50.1 BD1
Izzy 50.1 BD1
Lorelei 50.6 BD1
Eddasa 50.6 BD1
Wentworth 68.3 BN
Gibson 69.4 BN
Comrade 129.0 BK1
Blueeyedbeauty 130.5 BK1
NootNoot 131.1 BE1
Karimac 131.9 BE2
Tribute 133.5 BE1
2.3 Preliminary Burst Time Determination
In this experiment, a certain number of cells was infected using an unknown MOI. In
order to use the same number of cells, we froze equal aliquots of culture (1 mL) in
microcentrifuge tubes.

17
2.3.1 Freezing Cells
Log-phase of S. griseus culture, grown in nutrient broth, was frozen in glycerol. It was
started from spinning 2 tubes of 47 mL culture at 1,800 x g for 10 minutes. The pellet in each
tube was resuspended in 15.7 mL phage buffer after the supernatant was removed. Afterward,
the cell suspension in both tubes was resuspended and 18.75 mL of 80% glycerol was added
to produce the final concentration of 25-30% glycerol (Shepherd et al., 2010). 1 mL of the cell-
glycerol suspension was then transferred to each microcentrifuge tube and frozen at -20°C.
The frozen suspension will be expired within a year.
2.3.2 Thawing Frozen Cells
The frozen cell suspension was thawed at 37°C for 1-2 minutes. Thawed suspensions
were spun at 10,000 x g for 5 min to remove glycerol. The pellet was resuspended in nutrient
broth (with media supplement) for experimentation.
2.3.3 Burst Time Determination
This experiment was performed with 3 replicates for each phage studied.
Adsorption: Thawed S. griseus was infected by phage with a titer of 108 to 109 pfu. The
mixture was incubated in a rotary shaking incubator at 30°C for 15 minutes to allow phage
adsorption.
Removing unadsorbed phages: Immediately after 15-minute adsorption, the cell-phage
mixture was centrifuged for 10 minutes at 1800 x g. Unadsorbed phages in the supernatant
were discarded. The pellet was washed (resuspended and centrifuged) with 5 mL of phage
buffer for 3 times.
Phage growth and sample collection: Washed pellets were then transferred to 25 mL
of nutrient broth (with media supplement) and incubated at 30°C for a long period of time. 1-
mL samples were collected every 30 minutes from 0 hours (T0) to 6 hours (T6).

18
Sample processing: The collected samples were filtered through 0.2 µm syringe filters
immediately after collection. The phage titer was determined by the spot test.
2.4 One-Step Growth Studies (Adapted from Gilmour et al., 1959)
As mentioned above, this experiment and the preliminary burst time study are similar
to each other. In this experiment, single cells were generated; they were infected with an MOI
of 0.5. Furthermore, we controlled the temperature during spinning after adsorption to halt the
intracellular activities by changing two steps. (1) The cell-phage suspension was spun down
for 5 minutes at 3,500 x g, 4°C. (2) The pellet was washed 3 times with refrigerated phage
buffer. Afterward, the pellet was resuspended in 1 mL nutrient broth and diluted to prevent
multiple infections as shown below.
One-step growth: 1 mL of the washed pellets were transferred to a tube containing 9
mL of nutrient broth. The tube is labelled as 100. It is then diluted down to another tube labelled
as 10-1. Before incubation, a 0.3-0.5-mL aliquot was removed from each tube for phage titer
determination at T=0 and infected cell number assay. The infected cell suspensions were
subsequently incubated in the shaker at 30°C for several hours, depending on the preliminary
burst time results. The samples were collected every 15 minutes (Table 2.2).

19
Table 2.2
Sample collection at each time point: 4 groups of phages divided based on the approximate
burst time resulted from the preliminary study. The first group’s samples were collected every
15 minutes from T=0, while other groups have a gap of about 1-2 hours. All samples include
the sample for the infected cell assay, and the volume for all samples is 300-500 µl.
Group Phages
Approximate
burst time
(minutes)
Duration of sample
collection (minutes)
Infected
cell*
Sample
volume (µl)
1
Izzy,
BryanRecycles,
Lorelei, and Eddasa
60 0-300
300-500
2 Romero, Tribute,
and NootNoot 90-120 0, 60-360
3
Raleigh, Wentworth,
Gibson, Immanuel3,
Blueeyedbeauty,
Karimac, and
Comrade
150-210 0, 60-420
4 Percastrophe and
ToriToki 300-330 0, 150-540
*Samples for infected cell assay were non-filtered and collected at T=0.
Sample processing and phage titer determination: All the samples, except ones for
infected cell assay, were filtered through a 0.2 µm syringe filter immediately after collection.
At least 2 plates of a standard plaque assay were done to determine phage titer for infected cell
assay, while a spot test (Science Education Alliance Howard Hughes Medical Institute, 2013)
was used to determine phage titer at each time point. Samples for infected cell assay were
plated immediately after collection. Computation for phage titer is shown below.
Phage titer (pfu) = 𝐴𝑣𝑒𝑟𝑎𝑔𝑒 𝑛𝑢𝑚𝑏𝑒𝑟 𝑜𝑓 𝑝𝑙𝑎𝑞𝑢𝑒 ×𝑑𝑖𝑙𝑢𝑡𝑖𝑜𝑛 𝑓𝑎𝑐𝑡𝑜𝑟 ×104 µ𝑙
𝑣𝑜𝑙𝑢𝑚𝑒 𝑜𝑓 𝑠𝑎𝑚𝑝𝑙𝑒 µ𝑙
Note that 5 and 50 µl are the volumes of sample used in spot test and plaque assay,
respectively, and 104 µl is the total volume in the culture tube (10 mL).

20
Burst size determination:
As mentioned in 1.1.3, 𝐵𝑢𝑟𝑠𝑡 𝑠𝑖𝑧𝑒 =𝑁𝑢𝑚𝑏𝑒𝑟 𝑜𝑓 𝑙𝑖𝑏𝑒𝑟𝑎𝑡𝑒𝑑 𝑝ℎ𝑎𝑔𝑒 𝑝𝑎𝑟𝑡𝑖𝑐𝑙𝑒𝑠
𝑁𝑢𝑚𝑏𝑒𝑟 𝑜𝑓 𝑖𝑛𝑓𝑒𝑐𝑡𝑒𝑑 𝑐𝑒𝑙𝑙𝑠
In this experiment,
𝑁𝑢𝑚𝑏𝑒𝑟 𝑜𝑓 𝑙𝑖𝑏𝑒𝑟𝑎𝑡𝑒𝑑 𝑝ℎ𝑎𝑔𝑒 𝑝𝑎𝑟𝑡𝑖𝑐𝑙𝑒 = 𝑝ℎ𝑎𝑔𝑒 𝑡𝑖𝑡𝑒𝑟 𝑎𝑓𝑡𝑒𝑟 𝑏𝑢𝑟𝑠𝑡 − 𝑓𝑟𝑒𝑒 𝑝ℎ𝑎𝑔𝑒 𝑎𝑡 𝑇 = 0
Similarly,
𝑁𝑢𝑚𝑏𝑒𝑟 𝑜𝑓 𝑖𝑛𝑓𝑒𝑐𝑡𝑒𝑑 𝑐𝑒𝑙𝑙𝑠 = 𝑝ℎ𝑎𝑔𝑒 𝑡𝑖𝑡𝑒𝑟 𝑓𝑟𝑜𝑚 𝑖𝑛𝑓𝑒𝑐𝑡𝑒𝑑 𝑐𝑒𝑙𝑙 𝑝𝑙𝑎𝑡𝑒𝑠 − 𝑓𝑟𝑒𝑒 𝑝ℎ𝑎𝑔𝑒 𝑎𝑡 𝑇 = 0
2.5 Statistical Analyses
Coefficient correlation (R-value) and ANOVA (P-value) were used in the pairwise
analysis between genome size-burst size and genome size-burst time. Additionally, GC
content-burst size, GC content-burst time, genome size-GC content, and burst time-burst size
were tested. Microsoft Excel is the software we used to compute the two values.
2.6 Bioinformatic Studies
16 phages were grouped based on their burst times and burst sizes, with the range of
20 minutes, and 10 in relation to burst size. The phage genome maps are generated by
Phamerator. The pairwise analysis of the two genomes that show similar burst time or burst
size was performed. Purple shade on the maps shows the most nucleotide similarity while the
white indicates no similarity. Furthermore, all the homologs shared between the two genomes
were numbered.

21
CHAPTER 3
RESULTS
3.1 Streptomyces griseus Growth and Doubling Time
S. griseus (ATCC 10137) is the host of all phages used in this study. The results show
that the strain has an approximate doubling time of 5 hours and 22 minutes for the media and
culture conditions used in this study.
According to Figure 3.1, the lag phase occurs in the first 4 hours of incubation,
followed by the log phase. The bacteria tend to be in the stationary phase after 12-20 hours of
inoculation, although there is an increase in the dry weight during this phase. This could be
because there are some cells continue growing while a slightly smaller number of cells starts
to die.
Figure 3.1. S. griseus growth curve determined by using dry weight
0
0.2
0.4
0.6
0.8
1
1.2
1.4
1.6
1.8
0 4 8 12 16 20 24 28 32 36 40 44 48 52 57 60 64 68
Log
of
dry
wei
gh
t
Time (h)
S. griseus growth curve
22
Importantly, the results show a doubling time of 5.36 hours. Dry weights at T=0 and
12 were computed by using a growth equation described as:
𝑋 = 2𝑛𝑋0
In the above equation, X is the dry weight (mg) at T=12, n is the number of generations,
and X0 is the dry weight (mg) at T=0. X and X0 are 16.1 and 3.4 mg, respectively. Therefore,
the number of generations over 12 hours is 2.24. This results in a doubling time of 12
hours/2.24 generations which is 5.36 hours/generation or 5 hours and 22 minutes as mentioned
above.
Due to the host’s approximate doubling time, the phages used in this study were
incubated for at least 5 hours to determine burst time and burst size.
3.2 Burst Times and Burst Size for the 16 Phages
There were 16 phages used in this study. All of them were isolated on S. griseus by
several scientists and students at the University of North Texas from 2012 to 2017. After DNA
sequencing, they were grouped into 7 different clusters and subclusters including BC2, BF,
BD1, BN, BK1, BE1, and BE2. Their genome sizes varied from 40.7 to 133.5 kbp. (Table 3.1).
According to Table 3.1, burst times and burst sizes for the 16 phages range from 45
(±0, standard error) to 420 (±30) minutes and 12 (±0) to 1500 (±60), respectively. Interestingly,
the two largest burst sizes belong to the smallest phages (Raleigh and Percastrophe), and they
have burst times of 185 (±9) and 420 (±30) minutes.

23
Table 3.1
Burst times and burst sizes for 16 phages sorted by genome size.
No. Phage name Genome size
(kbp)
Cluster GC content
(%)
Burst time
(minutes)
Burst size
1 Raleigh 40.7 BC2 71.8 185±9 1000±577
2 Percastrophe 46.0 BF 59.7 420±30 1500±60
3 Immanuel3 46.1 BF 59.6 145±8 240±49
4 Romero 46.1 BF 59.7 120±0 12±0
5 ToriToki 46.1 BF 59.7 345±0 190±62
6 BryanRecycles 50.1 BD1 65.9 210±0 190±97
7 Izzy 50.1 BD1 65.9 80±17 22±5
8 Eddasa 50.6 BD1 65.9 45±0 32±0
9 Lorelei 50.6 BD1 65.8 80±17 20±10
10 Wentworth 68.3 BN 64.1 275±31 30±7
11 Gibson 69.4 BN 64.4 120±0 55±0
12 Comrade 129.0 BK1 47.1 150±0 32±0
13 Blueeyedbeauty 130.5 BK1 47.9 285±15 21±7
14 NootNoot 131.1 BE1 50.2 245±9 270±173
15 Karimac 131.9 BE2 49.4 180±0 20±3
16 Tribute 133.5 BE1 50 105±0 26±0
However, the data for the entire population shows that burst time and burst size do not
correlate with genome size with the scores of -0.01800 and -0.32678, respectively. When GC
content was compared to burst time and to burst size, the results also showed no correlation
with scores of -0.15391 and 0.22644, respectively. Nonetheless, burst time does show a weak
correlation with burst size with a score of 0.56341 (see Table 3.2).
Furthermore, when the correlations within a group (groups of 40, 50, and 130 kbp
genome size) were tested, the results showed that the genome size of 50 kbp is correlated to
burst time and burst size with the scores of -0.70353 and -0.55760, respectively. Also, burst
time and bust size do show correlation in the groups of 40 and 50 kbp as shown in Table 3.2.
The group of 60 kbp was not statistically tested due to population insufficiency.

24
Table 3.2
Statistical analysis: *only one pair shows a correlation (R) with P < 0.05. For the entire
population, genome size-burst time and genome size-burst size do not show any correlation.
In the group of 50 kbp, there is a correlation between genome size-burst time and burst time-
burst size. Generally, correlation must be close to 1 or -1. The group of 60 kbp is not shown
here due to population insufficiency.
Pairwise analysis R-value P-value
Entire population
Genome size – Burst time -0.01800 0.97894
Genome size – Burst size -0.32678 0.21670
GC content- Burst time -0.15391 0.56929
GC content – Burst size 0.22644 0.39904
Burst time – Burst size* 0.56341 0.02305
Genome size of 40 kbp
Genome size – Burst time 0.23256 0.70658
Genome size – Burst size -0.37891 0.52935
GC content- Burst time -0.24146 0.69558
GC content – Burst size 0.36413 0.54683
Burst time – Burst size 0.60158 0.28315
Genome size of 50 kbp
Genome size – Burst time -0.70353 0.29647
Genome size – Burst size -0.55760 0.44340
GC content- Burst time 0.24371 0.75630
GC content – Burst size 0.37022 0.62980
Burst time – Burst size 0.94542 0.05459
Genome size of 130 kbp
Genome size – Burst time -0.38658 0.52034
Genome size – Burst size -0.05231 0.93343
GC content- Burst time -0.12791 0.83758
GC content – Burst size 0.50875 0.38138
Burst time – Burst size 0.37929 0.52892

25
The majority of phages (44%) has burst times between 100 and 199 minutes. There is
only one phage (Percastrophe) that has a very long burst time of 420 (±30) minutes. For burst
size, the majority of phages (62%) has a burst size of less than 100 (Figure 3.2).
Figure 3.2 Burst times and burst sizes for the 16 phages: 44% of burst times are between 100
and 199 minutes, while 62% of burst sizes are less than 100.
Raleigh, Percastrophe, Immanuel3, Romero, and ToriToki all belong to a group of
phages with a small genome size of approximately 40-46 kbp. Their burst times are at least
120 minutes. The longest burst time belongs to Percastrophe which also has the largest burst
size, as mentioned before. However, Romero showed the smallest burst size of 12 (±0). Raleigh
had a burst time of 185 (±9) minutes and the second largest burst size of 1000 (±577).
The second group (genome size of 50 kbp) of phages consisted of BryanRecycles, Izzy,
Eddasa, and Lorelei. All of them are clustered in BD1. The phages burst times range between
45 and 210 minutes, while burst size is between 20 and 190. Again, the largest burst size is
observed from BryanRecycles which has the longest burst time of 210 (±0) minutes. However,
the smallest burst size (20±10) for Lorelei does not show the shortest burst time.
The third group consisted of Wentworth and Gibson, both members of the BN cluster.
Even though the two phages are very similar to each other in terms of genome size and GC
0%
10%
20%
30%
40%
50%
60%
70%
<100 100-199 200-299 300-399 >400
Per
cen
t popula
tion
Burst times and burst size for the 16 phages
Burst size Burst time (min)

26
content, they show different burst times and burst sizes. Wentworth has a longer burst time of
275 (±31) minutes but has a smaller burst size of about 30 (±7).
The last group consists of phage belonging to the BK1, BE1, and BE2 subclusters. This
group contains the largest genome size (129-133.5 kbp) and consists of Comrade,
Blueeyedbeauty, NootNoot, Karimac, and Tribute. Interestingly, Blueeyedbeauty has the
longest burst time of 285 (±15) minutes but its burst size of 21 (±7) is not as large.
Nevertheless, Tribute has a shortest burst time of 105 (±0) minutes and it also shows almost
the same burst size (26±0) as Blueeyedbeauty’s.
During the one-step growth experiment, the number of released progenies were
observed over time. The data was used to compute burst size as mentioned in 2.4. The burst
sizes measured over time were plotted in the graphs shown in Figure 3.3A to P. All the graphs
have a baseline of zero resulting from no burst during the latent period. Once the graphs start
the rise period, red dots were labeled as burst time or the very beginning of the rise. However,
the yellow dots were labeled as burst size as they are the greatest burst size, or “the peak”,
observed after the lysis. Most of the graphs show the decreases in burst size after the peak.
This reflects the unwanted second adsorption occurring in the biological system.

27
0
200
400
600
800
1000
0 30 60 90 120 150 180 210 240 270
Bu
rst
siz
e
Time (minute)
Raleigh 40.7 kbp (BC2)
0
5
10
15
20
25
0 30 60 75 90 105 120 180 240
Bu
rst
siz
e
Time (minute)
Izzy 50.1 kbp (BD1)
0
5
10
15
20
25
30
35
0 30 45 60 120 180 240
Bu
rst
siz
e
Time (minute)
Eddasa 50.6 kbp (BD1)
0
10
20
30
40
50
60
0 60 120 180 240
Bu
rst
siz
e
Time (minute)
Lorelei 50.6 kbp (BD1)
0
100
200
300
400
500
600
0 30 60 90 120 150 180 210 240 270 300
Bu
rst
siz
e
Time (minute)
BryanRecycles 50.1 kbp (BD1)
0
5
10
15
20
0 120 135 150 165 180 240 300
Bu
rst
siz
e
Time (minute)
Karimac 131.9 kbp (BE2)
0
50
100
150
200
250
300
0
60
90
120
150
180
195
210
225
240
255
270
285
300
315
Bu
rst
siz
e
Time (minute)
NootNoot 131.1 kbp (BE1)
0
5
10
15
20
25
30
0 120 135 150 165 180 240 300
Bu
rst
siz
e
Time (minute)
Tribute 133.5 kbp (BE1)
A B
C D
E F
G H

28
Figure 3.3 (A to P) 16 phages growth curves. Red and yellow dots represent burst time and
burst size, respectively.
-50
0
50
100
150
200
250
300
0 60 120 135 150 165 180 240 300
Bu
rst
siz
e
Time (minute)
Immanuel3 46.1 kbp (BF)
0
500
1000
1500
2000
0 210 285 315 345 375 405 435 465 495 525
Bu
rst
siz
e
Time (minute)
Percastrophe 46 kbp, BF
0
2
4
6
8
10
12
14
0 120 135 150 165 180 240 300
Bu
rst
siz
e
Time (minute)
Romero 46.1 kbp (BF)
0
50
100
150
200
0 150 270 300 315 330 345 360 420
Bu
rst
siz
e
Time (minute)
ToriToki 46.1 kbp (BF)
0
5
10
15
20
25
0
60
120
150
180
195
210
225
240
255
270
285
300
315
330
345
360
Bu
rst
siz
e
Time (minute)
Blueeyedbeauty 130.5 kbp (BK1)
0
5
10
15
20
25
30
35
0 120 135 150 165 180 240 300
Bu
rst
siz
e
Time (minute)
Comrade 129.0 kbp (BK)
0
10
20
30
40
50
60
0 120 180 240 300
Bu
rst
siz
e
Time (minute)
Gibson 69.4 kbp (BN)
-5
0
5
10
15
20
25
30
35
0
120
135
150
165
180
195
210
225
240
255
270
285
300
315
330
Bu
rst
siz
e
Time (minute)
Wentworth 68.3 kbp (BN)
I J
K L
M N
O P

29
3.3 Bioinformatics: The Comparative Genomics
Computational studies have been done to further investigate what could be regulating
burst time and burst size since genome size and GC content were not correlated. Genetic
properties of the bacteriophage were the next part of the project that needed to be investigated.
We grouped the 16 phages into categories based on their burst times and burst sizes.
With the burst time range of 20 minutes, the phages can be divided to 4 groups; with a burst
size range of 10, the phages can be divided into 3 groups as shown in Figure 3.4 and 3.5. Any
grouping in the diagrams below had one member could not be compared genetically.
Figure 3.4 Phage groups based on their burst times. There are 2, 3, 2, and 2 phages in the
groups of 41-60 minutes, 101-120 minutes, 161-180 minutes, and 281-300 minutes,
respectively. 1 indicates that there is only one member; cannot form a group.
41-60, 2 phages
1
101-120, 3 phages
11
161-180, 2 phages
1
1
281-300, 2 phages 11
Burst Time Group
41-60 81-100 101-120 121-140 141-160 161-180
201-220 221-240 281-300 341-360 401-420 (minutes)

30
Within the same burst time group, we compared the genome structure of the phages in
the same group. The first group (41-60 minutes) consists of Eddasa and Lorelei. The second
group (101-120 minutes) consists of Tribute, Romero, and Gibson. The third group of 121-140
minutes of burst time includes Karimac and Immanuel3. Lastly, Blueeyedbeauty and
Wentworth are grouped together with burst times between 281-300 minutes.
Their genome maps shown in Figure 3.6 to 3.10 suggest that only the first group shows
similarities. There are 52 shared homologs out of 76 and 75 genes for Eddasa and Lorelei,
respectively (Figure 3.6). The other groups have no nucleotide similarity (Figure 3.7 to 3.10)
Figure 3.5 Phage groups based on their burst sizes. There are 3, 4, and 2 phages in the
burst size groups of 11-20, 21-30, and 31-40, respectively. 1 indicates that there is only
one member; cannot form a group.
11-20, 3 phages
21-30, 4 phages
31-40, 2 phages
1
1
1
1
1
11
Burst Size Group
11-20 21-30 31-40 51-60 181-190 191-200 231-240 261-270 881-890 1511-1520
31
We classified the burst size into 3 groups: 11-20 (Romero, Karimac, and Lorelei), 21-
30 (Blueeyedbeauty, Izzy, Tribute, Wentworth), and 31-40 (Eddasa, Comrade). The results
show that Tribute (BE) and Blueeyedbeauty (BK1) having shared homologs as shown in Figure
3.13. Examples of those homologs include LysM-like endolysin (pham 8091), unknown
function protein (pham 6800), DNA primase (pham 6755), etc. The total number of shared
homologs is 48 genes out of 284 and 277 genes in Tribute and Blueeyedbeauty, respectively.
The other 2 groups do not have any similarity (Figure 3.11, 3.13, 3.14, 3.15, and 3.16).

Figure 3.6 Comparison of Eddasa and Lorelei genome maps (41-60 minutes burst time): The two phages are in the same cluster, BD1 so they are
closely related. Both phages share 52 homologs accounting to 68% and 69% similarities for Eddasa and Lorelei, respectively. There are 24 genes
from Eddasa that do not appear in Lorelei genome (i.e. pham 12342 and 61065), and 23 genes from Lorelei that are not shared with Eddasa (i.e.
pham 32605 and 30630). Purple shade indicates the most likely that the two genes are homolog (lowest E-value), while the red indicates the least
likelihood (highest E-value). White area means no nucleotide similarity.

Figure 3.7 Comparison of Tribute and Gibson genome maps (101-120 minutes burst time): It is obvious that Tribute has a longer genome size
(133.5 kbp) than Gibson’s (69.4 kbp). They both come from the different clusters, BE1 for Tribute and BN for Gibson. They, therefore, do not
have any shared homologs or purple regions.

34
Figure 3.8 Comparison of Tribute, Romero, and Gibson genome maps (101-120 minutes burst time): Tribute has the longest genome size, followed
by Gibson and Romero (46.1 kbp). There is no colored shading between Tribute and Romero, as well as Romero and Gibson. This means that
there is no similarity between the two pairs.

35
Figure 3.9 Comparison of Raleigh and Karimac genome maps (161-180 minutes burst time): Raleigh is the smallest phage (40.7 kbp) and Karimac
is one of the largest phages (131.9 kbp) in this study. The genome map does not show any similarity.

36
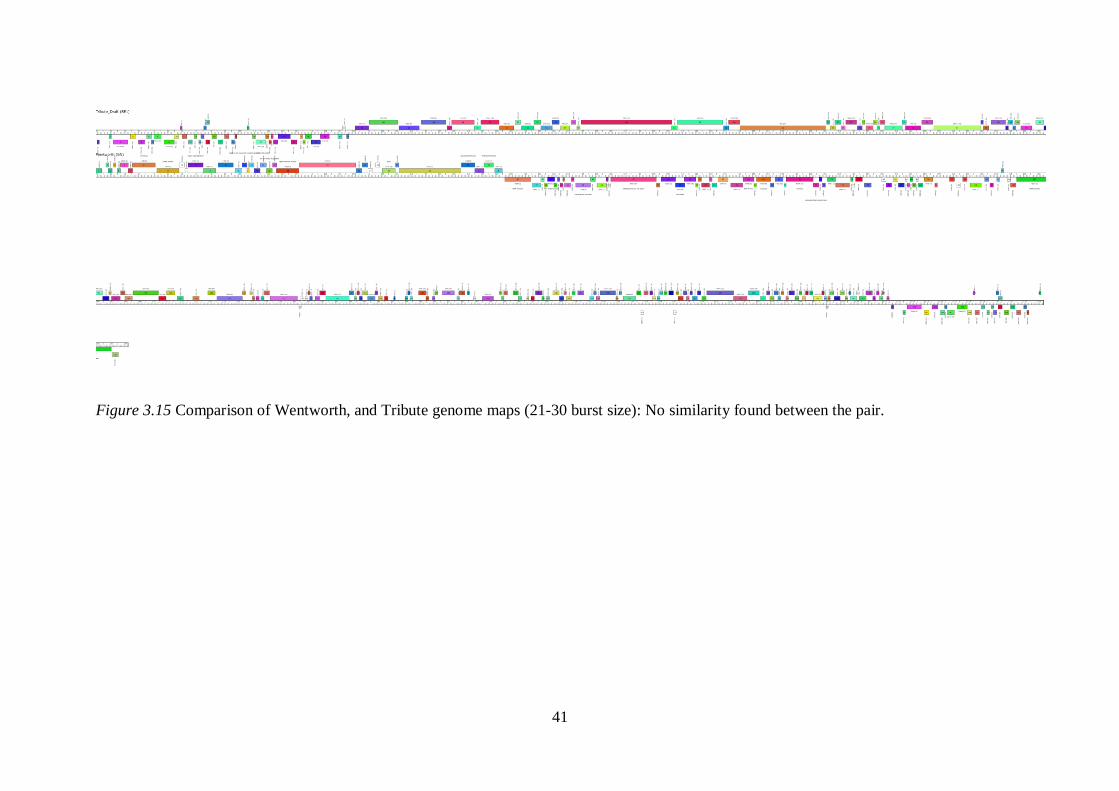
Figure 3.10 Comparison of Blueeyedbeauty and Wentworth genome maps (281-300 minutes burst time): Blueeyedbeauty has a larger genome
size of 130.5 kbp, while Wentworth has a shorter genome size of 68.3 kbp. Both phages do not show any similarity according to the genome
map.

37
Figure 3.11 Comparison of Lorelei, Karimac, and Romero genome maps (11-20 burst size): Lorelei and Romero genome sizes are about the
same, while Karimac has the longest one. Genome maps for Lorelei and Karimac, as well as ones for Karimac and Romero, do not show any
similarity.

38
Figure 3.12 Comparison of Lorelei and Romero genome maps (11-20 burst size): No similarity has been found from the pair.

39
Figure 3.13 Comparison of Izzy, Tribute, Blueeyedbeauty, and Wentworth genome maps (21-30 burst size): There is no similarity found between
Izzy and Tribute genomes or Blueeyedbeauty and Wentworth genomes. However, there are some homologs shared between Tribute (BE) and
Blueeyedbeauty (BK1).

40
Figure 3.14 Comparison of Blueeyedbeauty, Izzy, Wentworth genome maps (21-30 burst size): No similarity is found between Blueeyedbeauty-
Izzy and Izzy-Wentworth.
41
Figure 3.15 Comparison of Wentworth, and Tribute genome maps (21-30 burst size): No similarity found between the pair.

42
Figure 3.16 Comparison of Eddasa and Comrade genome maps (31-40 burst size): No similarity is found between the pair.

CHAPTER 4
DISCUSSION
4.1 Streptomyces griseus Growth and Doubling Time
It has been observed that bacterial growth rate influences phage growth rate (Nabergoj
et al., 2017). In this study, we determined the host doubling time to estimate the minimum
duration of phage growth. However, the problem of doubling time determination is that the
host used in this study is filamentous.
Using a bacterial culture or spore to determine the cell number by spectrophotometry,
the spread plating method, or viable cell count, are inaccurate. First, the cell number
determined by the spectrophotometry could be inaccurate because the bacterial clumps are
absorbing various wavelength, depending on the size of each clump. Second, one colony is not
formed from one cell in the plating method, therefore, one colony-forming unit is not equal to
one cell. Lastly, viable cell count is impossible because we cannot see an individual cell when
they are clumpy. Nonetheless, Gilmour (1959) used S. griseus germinating spores to determine
the cell number by using an electron microscope, which is prohibitive in time and resources
for this study. This issue also leads to difficulty in the cell count for the one-step growth studies,
because the number of infected cells must be used to determine burst size.
For this reason, we used the dry weight method to determine bacterial growth. The
protocol was adapted from a doctoral dissertation (Hughes, L.E., 1998). Our results show a
doubling time of 5 hours and 22 minutes which is approximately 3 hours faster than the same
strain inoculated in the minimal liquid medium (Hughes, L.E., 1998). Surprisingly, this
doubling time is very close to a growth result determined by plating method which showed a
doubling time of 5 hours and 10 minutes (data not shown). However, the doubling time of 5

44
hours and 22 minutes was used as a guideline for the incubation period during the one-step
growth studies of the 16 phages.
4.2 Phage Growth Protocol: A Filamentous Host Poses the Most Difficult Challenge
As mentioned above, one important challenge of this study is the filamentous host
which leads to several complications. (1) It is difficult to determine the cell number used to
infect with phages. (2) It is very likely that multiple infections can occur throughout the time
course; free phages would come from the unwashed phages at T=0 as well as the released
progenies after the burst time. (3) Phages could be hidden in the hyphae/mycelia resulting in
an inaccurate infected cell determination. (4) When multiple infections occur, it is difficult to
conclude an accurate burst size. (5) We successfully killed all the cells by using extremely high
MOI (data not shown); however, it was only one time in about 50 times of infection. Moreover,
using the high MOI is not a good idea because the higher the MOI, the bigger the burst size
(Gadagkar et al., 1980). It is also possible that the phages would enter the lysogenic cycle when
using higher MOI (Thakkar et al., 2018).
(1) It would be impossible to get an accurate number of the filamentous host cells
by colony count, spectrophotometry, or viable cell count. We also cannot apply the idea of
bacterial dry weight because we need to use the living cells for the phage growth study. In
order to overcome this problem, we broke down the hyphae and mycelia in a diluted bacterial
culture by a low-power sonication (4 Watts); then the single cells and short branches were
isolated and collected by low-speed centrifugation (300 x g, 3 minutes). The method is
modified from one of Dowding’s publications (1973). Although there were some short hyphae
mixed with the single cells, we accepted it if we were able to count the living cells under a
microscope.

45
(2) Multiple infections are another difficulty for one-step growth. According to
Hyman et al. (2009), the multiple infections for single-cell hosts (i.e. E.coli) can be prevented
by dilution because the free phages (or liberated progenies) would not be able to meet and
infect the new host cells (Figure 4.1). However, when a filamentous host is used, the free
phages can infect the adjacent cells easily, leading to multiple infections (Figure 4.2). This also
took place in this study, even if we already broke the hyphae. Furthermore, during the
experiment, we always observed free phages at T=0 (Table S2) which were not washed away.
It is possible that they infected the cells later and/or were hidden in the remaining hyphae.
Figure 4.1 Progenies from a single-cell host in the diluted biological system: The liberated
phages cannot meet the host cell. This prevent the phages from entering the second cycle.

46
Figure 4.2 Progenies from a filamentous host in the diluted biological system: In filamentous
cell-phage sample, progenies immediately adsorb to the adjacent cells after they successfully
lyse the former cell. This could happen even though the suspension is diluted.
(3) If the free phages were hidden in the hyphae, the infected cell number might
not be accurate because when we measure the free phages at T=0, we filter the cells out. If
there are some phages hidden in the hyphae and get filtered out, together with the cells, the
number of infected cells would be higher (Figure 4.3). The more infected cells determined, the
less burst size observed.

47
Figure 4.3 Inaccurate infected cell number: Infected cell number could be inaccurate if there
are some phages hidden in the hyphae of the host. (A) and (B) represent the same sample at
T=0. The system shows only 1 infected cell. (A) Collected sample without filtering shows 4
phages and 1 infected cell creating 5 plaques (N=5) on agar. (B) The red circles show the cells
and phage that are filtered away. Therefore, there will be only 3 phages that can form 3 plaques
(N=3). This leads to the inaccurate infected cell number of 2 cells (N=2).
A
B

48
(4) It is also tricky to determine burst size when multiple infections occur.
According to the graphs in Figure 3.3, burst sizes are reduced after reaching the summit. This
is because some released progenies adsorb or infect the new cells. It could be possible that if
we were able to avoid the later cycles completely, the burst size would be bigger than what we
observed. However, the best way we could do this is to pick the peak as a representative of the
burst size.
Other than the filamentous host problems, the idea of using a low MOI of 0.1 does not
seem to fit with this study. According to Hyman (2009), using the low MOI of 0.1 is beneficial
to limit one phage particle to infect one cell. This can be explained by Poisson’s model shown
below:
- fm is the probability of adsorption by the m number of phages.
- fm>1 is the probability of multiple phages/cell.
- fm>0 represents the probability of infection.
- M is MOI
Thus, the ratio reflects the proportion of cells infected by more than one phage. The
lower the ratio is, the higher the number of cells infected by one phage. If we plug in M=0.1,
the probability that the cells will be infected by more than one phage particle is 5%, meaning
that 95% of the cell population is infected by one phage particle (one phage/cell). The reason
why we focus on phage number infecting one cell is that burst size could be larger when the
higher MOI is employed.
As mentioned earlier, we failed to obtain phages reasonable burst size with an MOI of
0.1 after more than 10 infections of BryanRecycles, Izzy, and Lorelei. We, therefore, increased
and maintained the MOI of 0.5 for the entire study.

49
4.3 Burst Times and Burst Sizes for the 16 Phages
Gilmour (1979) has reported a burst time of 120 minutes for S. griseus phage 514-3.
This burst time correlates with the ones reported in this study which vary from 45-405 minutes
(see Table 3.1). The burst times for S. griseus phages are quite long compared to phages
infecting other species (Table 1.2). The shortest burst time of 12.2 minutes, for the gathered
data in Table 1.2, belongs to E. coli phage φX174, while the longest one (120 minutes) belongs
to phage 514-3. This indicates that our phages (i.e. Percastrophe, ToriToki, Wentworth) have
even longer burst times than the reported ones. Only two of them, Romero and Gibson, show
the same burst time as phage 514-3.
Nevertheless, the burst times for the entire population (shown in Table 3.1) are not
correlated with either genome size or GC content. It is understandable for genome size to not
be correlated with burst times because the replication rate would not depend solely on the
length of the genome. There would be many factors such as holin and lysin gene expression
levels, phage assembly rate, etc. Once the phage infects its host, there would be many different
intracellular activities occurring at different times. According to the lytic-lysogenic decision
of phage λ, the phage makes a decision to enter the lysogenic cycle when CII protein
accumulation reaches the threshold. However, before the cII is expressed, there are several
proteins, such as CRO, N, Q, CI, and CIII, working in a cascade sequence (Court et al., 2007).
Although these proteins are found in lambda phage, they are not necessarily found in the
phages in this study. Among the 16 phages in this study, there are numerous genes with no
known function that could have activities that may affect burst time.

50
Table 4.1
Burst sizes from various host organisms (retrieved from http://book.bionumbers.org/how-
many-virions-result-from-a-single-viral-infection/).
As shown in Table 4.1, bacteriophage burst sizes can be varied from 40 to 10,000, while
Table 1.2 shows that burst sizes could be as small as 21.7, data obtained from P. aeruginosa
phage HWPB-2 (Lindberg et al., 2014). In this study, the smallest burst size we observed is 12
(Romero) and the greatest is 1500 (±60) (Percastrophe); the large burst size indicates higher
lytic activity. Additionally, the large one seems reasonable for the very long burst time of 420
(±30) minutes. However, the smallest burst size may seem too small. There could be at least
two explanations. First, there might be several phages hidden in the hyphae and they get filtered
away. This results in a falsely high infected cells number causing a falsely small burst size
since they are inversely proportional. Second, Romero actually has a small burst size, meaning
that it does not have a high level of lytic activity. This could be confirmed by performing

51
technical replicates and further investigation. Another possible explanation for the small burst
size could be the non-original host. It is possible that Romero has a different original host, so
it cannot exploit resources from S. griseus effectively.
Although burst size is not correlated with genome length, cluster, and GC content, it is
interesting that burst time and burst size do show a positive correlation for the entire
population, the group of 40, and 50 kbp (Table 3.2).
Moreover, it is highly interesting that phages from the same cluster or subcluster do not
have the same burst time and/or burst size. If we compare those genomes and explore the
differences between them, it would be beneficial to study what regulates the two traits.
4.4 Conclusion
All 16 phages with genome sizes between 40.7 and 133.5 kbp show burst times of 45
to 405 minutes and burst sizes of 12 to 1500. There is no correlation between genome size and
burst time (R= - 0.00718, P=0.97894) or genome size and burst size (R= -0.32677, P=0.21670).
However, these results are based on only the 16 Streptomyces phages. In order to obtain the
clearer results, we would need to increase the sample size to increase the number and variation
of phages. When we group the phages that have similar burst time/burst size and explored their
genome maps, we found that Eddasa and Lorelei, from the same burst time group, share 52
homologs. The other groups do not show similarity. Moreover, Tribute and Blueeyedbeauty
are the representatives of a burst size group that show similarity. They share 48 homologs with
each other. Similar to burst time, the other groups of burst size do not show any similarity.

52
APPENDIX
SUPPLEMENTAL DATA

53
Table S1
Streptomyces griseus dry weight
Time (hour) Pre weight (g) Post weight (g) S. griseus dry weight (mg)
0 0.0824 0.0858 3.4
4 0.0825 0.0859 3.4
8 0.0822 0.0912 9
12 0.0825 0.0986 16.1
16 0.0827 0.1005 17.8
20 0.0826 0.1044 21.8
24 0.0825 0.1062 23.7
28 0.0825 0.1087 26.2
32 0.0825 0.1102 27.7
36 0.0826 0.1127 30.1
40 0.0825 0.1153 32.8
44 0.0826 0.1158 33.2
48 0.0826 0.1194 36.8
52 0.0825 0.1204 37.9
57 0.0822 0.1205 38.3
60 0.0822 0.121 38.8
64 0.0823 0.1216 39.3
68 0.0824 0.122 39.6

Table S2
Data obtained from the 16 phages growth studies. FP indicates number of free phages.
(table continues)
No. Phage name Time points (minutes)
Infected cells +FP (pfu/10 mL)
Actual number of infected cells
(cell/10mL)
FP at each time point
(pfu/10 mL)
Number of progenies
(pfu/10mL)
Burst time (minutes)
Burst size
1 BryanRecycles 0 4.067E+03 2.067E+03 2.000E+03 0.000E+00 210.00±0.00 192.58±96.77
15 2.000E+03 0.000E+00
30 2.000E+03 0.000E+00
45 2.667E+03 6.670E+02
60 5.333E+03 3.330E+03
75 4.667E+03 2.670E+03
90 7.333E+03 5.330E+03
105 8.000E+03 6.000E+03
120 1.333E+04 1.130E+04
135 1.333E+04 1.130E+04
150 4.000E+04 3.800E+04
165 2.667E+04 2.470E+04
180 4.667E+04 4.470E+04
195 6.667E+04 6.470E+04
210 6.667E+04 6.470E+04
225 4.000E+05 3.980E+05
240 2.000E+05 1.980E+05
255 5.333E+05 5.310E+05
270 4.000E+05 3.980E+05
285 4.000E+05 3.980E+05
300 1.133E+06 1.130E+06

55
(table continues)
No. Phage name Time points
(minutes)
Infected cells +FP
(pfu/10 mL)
Actual number of
infected cells
(cell/10mL)
FP at each
time point
(pfu/10 mL)
Number of
progenies
(pfu/10mL)
Burst time
(minutes)
Burst size
2 Izzy 0 2.600E+04 6.000E+03 2.000E+04 0.000E+00 80.00±17.32 22.18±5.50
30 2.000E+04 0.000E+00
60 4.000E+04 2.000E+04
75 4.000E+04 2.000E+04
90 4.000E+04 2.000E+04
105 1.500E+05 1.300E+05
120 1.200E+05 1.000E+05
180 1.600E+05 1.400E+05
240 1.600E+05 1.400E+05
3 Blueeyedbeauty 0 1.933E+04 1.867E+04 6.667E+02 0.000E+00 285.00±15.00 21.39±7.58
60 6.667E+02 0.000E+00
120 4.000E+03 3.330E+03
150 6.667E+03 6.000E+03
180 4.000E+04 3.930E+04
195 4.000E+04 3.930E+04
210 6.000E+04 5.930E+04
225 8.667E+04 8.600E+04
240 5.333E+04 5.270E+04
255 1.267E+05 1.260E+05
270 9.333E+04 9.270E+04
285 8.000E+04 7.930E+04
300 2.000E+05 1.990E+05
315 4.000E+05 3.990E+05
330 4.000E+05 3.990E+05
345 4.000E+05 3.990E+05
360 3.333E+05 3.330E+05
4 Comrade 0 2.500E+03 1.833E+03 6.667E+02 0.000E+00 150.00±0.00 32.36±0.00
120 6.000E+03 5.333E+03

56
(table continues)
No. Phage name Time points
(minutes)
Infected cells +FP
(pfu/10 mL)
Actual number of
infected cells
(cell/10mL)
FP at each
time point
(pfu/10 mL)
Number of
progenies
(pfu/10mL)
Burst time
(minutes)
Burst size
Comrade 135 2.500E+03 1.833E+03 4.000E+03 3.333E+03
(continues) 150 5.333E+03 4.667E+03
165 2.667E+04 2.600E+04
180 6.000E+04 5.933E+04
240 2.667E+04 2.600E+04
300 4.000E+04 3.933E+04
5 Gibson 0 1.707E+05 7.067E+04 1.000E+05 0.000E+00 120.00±0.00 55.19±0.00
120 2.000E+05 1.000E+05
180 2.000E+06 1.900E+06
240 4.000E+06 3.900E+06
300 4.000E+06 3.900E+06
6 Eddasa 0 6.300E+03 6.300E+03 0.000E+00 0.000E+00 45.00±0.00 31.75±0.00
30 0.000E+00 0.000E+00
45 0.000E+00 0.000E+00
60 4.000E+04 4.000E+04
120 2.000E+05 2.000E+05
180 2.000E+05 2.000E+05
240 2.000E+05 2.000E+05
7 Immanuel3 0 2.470E+04 4.700E+03 2.000E+04 0.000E+00 145.00±8.66 236.88±49.14
60 3.333E+04 1.333E+04
120 2.000E+04 0.000E+00
135 1.333E+04 -6.667E+03
150 2.000E+05 1.800E+05
165 2.000E+05 1.800E+05
180 1.133E+06 1.113E+06
240 4.667E+05 4.467E+05
300 1.267E+06 1.247E+06
8 Karimac 0 2.333E+04 2.133E+04 2.000E+03 0.000E+00 180.00±0.00 17.09±3.34
120 1.333E+04 1.133E+04
135 2.667E+04 2.467E+04
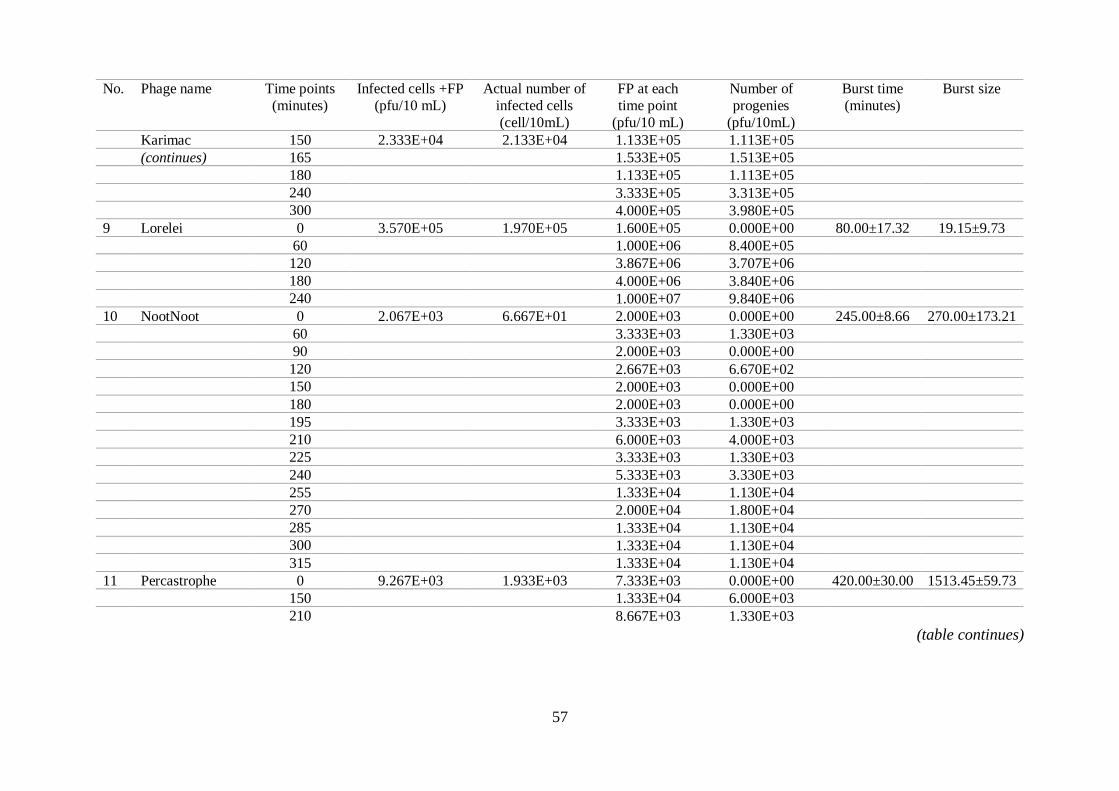
57
(table continues)
No. Phage name Time points
(minutes)
Infected cells +FP
(pfu/10 mL)
Actual number of
infected cells
(cell/10mL)
FP at each
time point
(pfu/10 mL)
Number of
progenies
(pfu/10mL)
Burst time
(minutes)
Burst size
Karimac 150 2.333E+04 2.133E+04 1.133E+05 1.113E+05
(continues) 165 1.533E+05 1.513E+05
180 1.133E+05 1.113E+05
240 3.333E+05 3.313E+05
300 4.000E+05 3.980E+05
9 Lorelei 0 3.570E+05 1.970E+05 1.600E+05 0.000E+00 80.00±17.32 19.15±9.73
60 1.000E+06 8.400E+05
120 3.867E+06 3.707E+06
180 4.000E+06 3.840E+06
240 1.000E+07 9.840E+06
10 NootNoot 0 2.067E+03 6.667E+01 2.000E+03 0.000E+00 245.00±8.66 270.00±173.21
60 3.333E+03 1.330E+03
90 2.000E+03 0.000E+00
120 2.667E+03 6.670E+02
150 2.000E+03 0.000E+00
180 2.000E+03 0.000E+00
195 3.333E+03 1.330E+03
210 6.000E+03 4.000E+03
225 3.333E+03 1.330E+03
240 5.333E+03 3.330E+03
255 1.333E+04 1.130E+04
270 2.000E+04 1.800E+04
285 1.333E+04 1.130E+04
300 1.333E+04 1.130E+04
315 1.333E+04 1.130E+04
11 Percastrophe 0 9.267E+03 1.933E+03 7.333E+03 0.000E+00 420.00±30.00 1513.45±59.73
150 1.333E+04 6.000E+03
210 8.667E+03 1.330E+03

58
(table continues)
No. Phage name Time points
(minutes)
Infected cells +FP
(pfu/10 mL)
Actual number of
infected cells
(cell/10mL)
FP at each
time point
(pfu/10 mL)
Number of
progenies
(pfu/10mL)
Burst time
(minutes)
Burst size
Percastrophe 270 9.267E+03 1.933E+03 1.467E+04 7.330E+03
(continues) 285 6.000E+04 5.270E+04
300 5.333E+04 4.600E+04
315 4.667E+04 3.930E+04
330 3.333E+04 2.600E+04
345 4.667E+04 3.930E+04
360 8.000E+04 7.270E+04
375 1.067E+05 9.930E+04
390 2.067E+05 1.990E+05
405 3.333E+05 3.260E+05
420 5.333E+05 5.260E+05
435 8.667E+05 8.590E+05
450 1.267E+06 1.260E+06
465 2.933E+06 2.930E+06
480 2.800E+06 2.790E+06
495 1.067E+06 1.060E+06
510 1.400E+06 1.390E+06
525 1.733E+06 1.730E+06
540 2.133E+06 2.130E+06
12 Raleigh 0 2.600E+03 6.000E+02 2.000E+03 0.000E+00 185.00±8.66 996.67±577.35
15 2.667E+03 6.670E+02
30 3.333E+03 1.330E+03
45 4.000E+03 2.000E+03
60 4.000E+03 2.000E+03
75 7.333E+03 5.330E+03
90 5.333E+03 3.330E+03
105 2.000E+04 1.800E+04
120 1.333E+04 1.130E+04

59
(table continues)
No. Phage name Time points
(minutes)
Infected cells +FP
(pfu/10 mL)
Actual number of
infected cells
(cell/10mL)
FP at each
time point
(pfu/10 mL)
Number of
progenies
(pfu/10mL)
Burst time
(minutes)
Burst size
Raleigh 135 2.600E+03 6.000E+02 1.333E+04 1.130E+04
(continues) 150 2.000E+04 1.800E+04
165 2.000E+04 1.800E+04
180 2.000E+04 1.800E+04
195 2.667E+05 2.650E+05
210 5.333E+05 5.310E+05
225 1.333E+05 1.310E+05
240 1.333E+05 1.310E+05
255 6.667E+04 6.470E+04
270 6.667E+04 6.470E+04
285 1.333E+05 1.310E+05
13 Romero 0 3.500E+03 1.500E+03 2.000E+03 0.000E+00 120.00±0.00 12.00±0.00
120 6.000E+03 4.000E+03
135 2.000E+04 1.800E+04
150 2.000E+04 1.800E+04
165 2.000E+04 1.800E+04
180 2.000E+04 1.800E+04
240 2.000E+04 1.800E+04
300 2.000E+04 1.800E+04
14 ToriToki 0 6.667E+02 6.667E+02 0.000E+00 0.000E+00 345.00±0.00 190.00±62.45
150 0.000E+00 0.000E+00
270 0.000E+00 0.000E+00
300 0.000E+00 0.000E+00
315 0.000E+00 0.000E+00
330 0.000E+00 0.000E+00
345 0.000E+00 0.000E+00
360 1.267E+05 1.267E+05
420 1.067E+05 1.067E+05

60
No. Phage name Time points
(minutes)
Infected cells +FP
(pfu/10 mL)
Actual number of
infected cells
(cell/10mL)
FP at each
time point
(pfu/10 mL)
Number of
progenies
(pfu/10mL)
Burst time
(minutes)
Burst size
15 Tribute 0 1.740E+04 1.540E+04 2.000E+03 0.000E+00 105.00±0.00 25.84±0.00
120 6.000E+03 4.000E+03
135 2.000E+03 0.000E+00
150 2.000E+03 0.000E+00
165 2.000E+04 1.800E+04
180 1.000E+05 9.800E+04
240 4.000E+05 3.980E+05
300 1.400E+05 1.380E+05
16 Wentworth 0 6.667E+04 5.067E+04 1.600E+04 0.000E+00 275.00±31.22 29.95±7.44
120 9.333E+03 -6.670E+03
135 1.333E+04 -2.670E+03
150 2.200E+04 6.000E+03
165 1.000E+05 8.400E+04
180 6.000E+04 4.400E+04
195 1.800E+05 1.640E+05
210 2.333E+05 2.170E+05
225 2.267E+05 2.110E+05
240 4.000E+05 3.840E+05

REFERENCES
Abedon, S. T. (1989). Selection for Bacteriophage Latent Period Length by Bacterial Density:
A Theoretical Examination. Microbial Ecology, 18(2): 79.
Abedon, S. T. (2012), Phages. In S. T. Abedon & P. Hyman (Eds.), Bacteriophages in health
and disease. London: Advances in Molecular and Cellular Microbiology, pp. 1.
Ackermann, H.-W. (2007). 5500 Phages examined in the electron microscope. Archives of
Virology, 152: 227.
Baker C.W., Miller C.R., Thaweethai T., Yuan J., Baker M.H., Joyce P., and Weinreich D.M.
(2016). Genetically Determined Variation in Lysis Time Variance in the Bacteriophage
ϕX174. G3: GENES, GENOMES, GENETICS, 6(4): 939-955.
Bernhardt, T.G. Wang I-N., Struck D.K., and Young R. (2002). Breaking free: “Protein
antibiotics” and phage lysis. Research in Microbiology, 153: 493–501.
Brooks G.F., Carroll K.C., Butel J.S., Morse S.A., and Mietzner T.A. (2012). Jawetz, Melnick
& Adelbergs Medical Microbiology. New York City, NY: McGraw-Hill Professional
Publishing.
Brussow H. and Kutter E. (2005). Phage ecology. In: Kutter E, Sulakvelidze A (eds)
Bacteriophages: biology and applications, CRC Press, Boca Raton, pp 129–163.
Chamakura, K.R., Edwards G.B., and Young R. (2017). Mutational analysis of the MS2 lysis
protein L. Microbiology, 163(7): 961–969.
Chen, X., Xi Y., Zhang H., Wang Z., Fan M., Liu Y., and Wu W. (2016). Characterization and
adsorption of Lactobacillus virulent phage P1. Journal of Dairy Science, 99:
6995–7001.

62
Clokie M.R.J., Millard A.D., Letarov A.V., and Heaphy S. (2011). Phages in nature.
Bacteriophage, 1(1): 31.
Court D.L. Oppenheim A.B., and Adhya S.L. (2007). Minireview: A New Look at
Bacteriophage Genetic Networks. Journal of Bacteriology, 189(2): 298-304.
doi:10.1128/JB.01215-06.
Defais M.J., Hanawalt P.C., Sarasin A.R. (1983). Viral Probes for DNA Repair. Advances in
Radiation Biology, 10: 1-37.
Dowding J.E. (1973). Characterization of a Bacteriophage Virulent for Streptomyces
coelicolor A3(2). Journal of General Microbiology, 76, 163-176.
Edgar, R., and Qimron, U. (2010). The Escherichia coli CRISPR System Protects from λ
Lysogenization, Lysogens, and Prophage Induction. Journal of Bacteriology, 192(23),
6291–6294. http://doi.org/10.1128/JB.00644-10.
Edwards, R.A. and Rohwer, F. (2005). Viral metagenomics. Nature Rev Microbiol 3:
504–510.
Fischetti, V.A. (2010). Bacteriophage endolysins: A novel anti-infective to control Gram-
positive pathogens. International Journal of Medical Microbiology. 300(6): 357–362.
doi:10.1016/j.ijmm.2010.04.002.
Gadagkar R. and Gopinathan K.P. (1980). Bacteriophage burst size during multiple infections.
Journal of Biosciences, 2(3): 253-259.
Gilmour, C.M., Noller E. C., and Watkins B. (1959). Studies on Streptomyces Phage: I. Growth
Characteristics of The Streptomyces griseus Host-Phage System. Journal of
Bacteriology, 78: 186.

63
Goldberg, G.W., Jiang W., Bikard D., and Marraffini L.A. (2014). Conditional tolerance of
temperate phages via transcription-dependent CRISPR-Cas targeting. Nature,
514(7524): 633.
Gwak, K.M. Choi I.Y., Lee J., Oh J.H., Park M.K. (2018). Isolation and Characterization of a
Lytic and Highly Specific Phage against Yersinia enterocolitica as a Novel Biocontrol
Agent. Journal of Microbiology and Biotechnology, 28(11): 1946.
Halleran A., Clamons S., and Saha M. (2015). Transcriptomic Characterization of an Infection
of Mycobacterium smegmatis by the Cluster A4 Mycobacteriophage Kampy. PLOS
ONE, 10(10): e0141100.
Heineman, R.H. and Bull, J.J. (2007). Testing Optimality with Experimental Evolution:Lysis
Time in a Bacteriophage. Evolution, 61(7): 1695.
Hughes, L.E. (1998). Pyrimidine Biosynthesis in the Genus Streptomyces: Characterization of
Aspartate Transcarbamoylase and Its Interaction with Other Pyrimidine Enzymes.
Doctoral dissertation, University of North Texas.
Hyman, P. and Abedon, S.T. (2009). Practical methods for determining phage growth
parameters. Methods in molecular biology, 501: 175.
Hyman, P. and Abedon, S.T. (2010). Chapter 7 - Bacteriophage Host Range and Bacterial
Resistance. Advances in Applied Microbiology, 70: 217.
Lindberg H.M., McKean K.A., Wang I. (2014). Phage fitness may help predict phage therapy
efficacy. Bacteriophage, 4(4).
Lundqvist B. and Bertani G. (1984). Immunity repressor of bacteriophage P2. Identification
and DNA-binding activity. Journal of Molecular Biology, 178(3):629-651.

64
Manteca, A. and Sanchez J. (2009). Streptomyces Development in Colonies and Soils. Applied
and Environmental Microbiology, 75(9): 2920.
Muniesa, M. Serra-Moreno, R., and Jofre, J. (2009). Prophage within the Bacterial Genomes:
Contribution to Bacterial Variability, Contemporary Trends in Bacteriophage
Research, pp. 47.
Nabergoj, D., Modic, P., and Podgornik, A., (2017). Effect of Bacterial Growth Rate on
Bacteriophage Population Growth Rate. MicrobiologyOpen, pp. 558. DOI:
10.1002/mbo3.558
Nicastro, J., Wong S., Khazaei Z., Lam P., Blay J., and Slavcev R.A. (2016). Bacteriophage
Applications - Historical Perspective and Future Potential. Cham: Springer, pp. 1.
Science Education Alliance Howard Hughes Medical Institute (2013). Streptomyces Phage:
Laboratory manual. Chevy Chase, Maryland.
Shepherd M.D., Kharel M.K., Bosserman M.A., and Rohr J. (2010). Laboratory Maintenance
of Streptomyces species. Current Protocol Microbiology, CHAPTER: Unit–10E.1.
Sonenshein, A.L. (2006). Bacteriophages: How Bacterial Spores Capture and Protect Phage
DNA. Current Biology, 16(1): R14-R16.
Sritha K.S. and Bhat S.G. (2018). Genomics of Salmonella phage ΦStp1: candidate
bacteriophage for biocontrol. Virus Genes, 54(2):311-318.
Stackebrandt, E., Rainey, F. A. and Ward-Rainey, N. L. (1997). Proposal for a new hierarchic
classification system, Actinobacteria classis nov. Int J Syst Bacteriol, 47: 479–491.
Thakkar D. and Saini S. (2018). Estimating Optimal Lysogenic Propensity for Viruses in
Stressed Environments. bioRxiv, 321372; doi: https://doi.org/10.1101/321372

65
Wang D.B., Li Y., Sun M.Q., Huang J.P., Shoa H.B., Xin Q.L., and Wang M. (2016). Complete
Genome of a Novel Pseudoalteromonas Phage PHq0. Current Microbiology, 72(1):
81-7.
Xu, M. and Arulandu, A., et al. (2004). Disulfide Isomerization After Membrane Release of
Its SAR Domain Activates P1 Lysozyme. SCIENCE, 307: 113.
Yap, M.L. and Rossmann, M.G. (2014). Structure and function of bacteriophage T4. Future
Microbiology, 9(12): 1319.
Young R., Wang I-N, Roof W.D. (2000). Phages will out: strategies of host cell lysis. Trends
Microbiology, 8: 120–128.
Young, R. (2014). Phage lysis: three steps, three choices, one outcome. Journal of
Microbiology, 52(3): 243.