of sussex dphil thesissro.sussex.ac.uk/7089/1/mishra,_ruchir.pdfunfortunately the spodoptera litura...
TRANSCRIPT
A University of Sussex DPhil thesis
Available online via Sussex Research Online:
http://sro.sussex.ac.uk/
This thesis is protected by copyright which belongs to the author.
This thesis cannot be reproduced or quoted extensively from without first obtaining permission in writing from the Author
The content must not be changed in any way or sold commercially in any format or medium without the formal permission of the Author
When referring to this work, full bibliographic details including the author, title, awarding institution and date of the thesis must be given
Please visit Sussex Research Online for more information and further details
CHARACTERISATION OF INSECTICIDE RESISTANCE
IN Plutella xylostella (THE DIAMONDBACK MOTH).
RUCHIR
REGISTRATION NUMBER: 20913714
SUBMITTED FOR THE DEGREE OF MASTER OF PHILOSOPHY
SUPERVISOR: DR. NEIL CRICKMORE
UNIVERSITY OF SUSSEX
SCHOOL OF LIFE SCIENCES

WORK NOT SUBMITTED ELSEWHERE FOR EXAMINATION
I hereby declare that this thesis has not been submitted, either in the same or
different form, to this or any other University for a degree
Signature

Acknowledgements
I would like to thank Dr. Neil Crickmore for his supervision throughout my project.
Your help has been phenomenal. I have learned a lot under your tutelage.
I would also like to thank all the lab members for their valuable support.
Finally I would like to thank my family for their encouragement and support given
throughout the project.

Abbreviations
APS: Ammonium persulphate
bp: base pairs
cAMP: Cyclic adenosine monophosphate
Cry: Crystal toxin
Cyt: Cytolytic toxin
DNA: Deoxyribonucleic acid
DTT: Dithiothreitol
E.coli: Escherichia coli
EDTA: Ethylene-diamine-tetraacetic acid
Kb: Kilobase
kDa:kilodalton
nAChR: Nicotinic acetylcholine receptor
PAGE: Polyacrylamide gel electrophoresis
PCR: Polymerase chain reaction
Px: Plutella xylostella
RGB: Resolving gel buffer
rRNA: Ribosomal ribonucleic acid
SDS: Sodium dodecyl sulphate
SGB: Stacking gel buffer
TEMED: N, N, N’, N’- tetramethylethylenediamine
Tris: Tris(hydroxymethyl)aminomethane
APN: Aminopeptidase-N

GPI: Glycosylphosphatidyl-inositol
ALP: Alkaline phosphate

Abstract
Cry toxins are δ- endotoxins produced by Bacillus thuringiensis. They are toxic against
different insect orders and are highly specific. However some of the insects have
developed resistance to Cry toxins. Resistance to Cry1Ac in Heliothis virescens,
Pectinophora gossypiella and Helicoverpa armigera has been linked to mutations in the
cadherin gene. Plutella xylostella has also developed resistance to Cry1Ac but
resistance to Cry1Ac in Plutella xylostella has not been linked to the cadherin gene.
Previous studies have shown that a modified Cry1Ac toxin lacking helix-α1 of domain I
is effective against insects which have developed resistance due to mutations in their
cadherin gene. So it was decided to make modified Cry1Ac toxin lacking helix-α1 of
domain I and check its effectiveness against the Cry1Ac resistant NOQA strain of
Plutella xylostella. A modified cry1Ac toxin gene was created and expressed in E.coli.
Bioassays conducted on the NOQA strain with modified and non-modified Cry1Ac
showed that modified Cry1Ac was in fact the less effective toxin. This supports the
hypothesis that the mechanism of resistance in NOQA population is not cadherin based.
A previous study has shown that field based resistance to spinosad in a Plutella
xylostella strain collected from Pearl City, Hawaii is due to a point mutation in the ninth
intron splice junction of nAChR Pxα6. Hence it was decided to check whether or not
other spinosad resistant lepidopteran insects have similar mechanisms of resistance (i.e.
splice-site mutation) as this population. PCR was performed to amplify nAChR intron 9
(including the splice junction) from a spinosad resistant Spodoptera litura population
collected from the fields of Pakistan, but we were unable to amplify this region.
Unfortunately the Spodoptera litura population was lost, so we could not carry on the
experiments further. It was also decided to check whether Plutella xylostella NOQA
population has the same splice site mutation as Plutella xylostella Pearl City population.
Whether NOQA population is resistant to spinosad is not known. Sequencing showed
that there was no splice site mutation present in NOQA.
LIST OF FIGURES, TABLES AND DIAGRAMS
Page
CHAPTER 1: INTRODUCTION
Figure 1: Cry toxin branches are colour coded according to insect order
specificity of the toxin............................................................................................... 6
Figure 2 a: Diagrammatic representation of Cry1A toxins mode of action
according to the pore formation model ..................................................................... 13
Figure 2 b: Diagrammatic representation of mode of action of Cry1Ab
according to the signal transduction model ............................................................... 13
Figure 3: Suggested model for binding of Cry toxins to the brush
border membrane of mid gut cells of susceptible Plutella xylostella larvae............. 15
Figure 4: Diagrammatic representation of mode of action of
modified Cry1A toxins .............................................................................................. 19
CHAPTER 2: MATERIALS AND METHODS
Table 1: Pfu ultra 6kb program .................................................................................. 26
Table 2: New High Fidelity Program ......................................................................... 34
CHAPTER 3: CREATING MODIFIED Cry1Ac AND CHECKING ITS
EFFECTIVENESS AGAINST Plutella xylostella NOQA POPULATION.
Figure 5: Amino acid sequence alignment of Cry1Aa and Cry1Ac .......... 38
Figure 6: PCR products of Pfu ultra 6kb program ..................................................... 39

Figure 7: Purified PCR product.................................................................................. 40
Figure 8: HaeIII restriction digest of pGEM 1Ac and pGEM 1AcD ......................... 41
Figure 9: Expression of Cry1AcD (1-56) in JM109, BL21 and DH5α strains
of E.coli. at 250C ....................................................................................................... 42
Figure 10: Expression of Cry1AcD (2-50) in JM109, BL21 and DH5α strains
of E.coli. at 250C ........................................................................................................ 43
Figure 11: Expression of Cry1AcD (1-56) in JM109, BL21 and DH5α strains
of E.coli. at 300C ....................................................................................................... 43
Figure 12: Expression of Cry1AcD (2-50) in JM109, BL21 and DH5α strains
of E.coli. at 300C ........................................................................................................ 44
Figure 13: Comparison of solubilisation of Cry1Ac wild type with
Cry1AcD (1-56) from JM109, BL21& DH5α (grown at 250C) ............................... 44
Figure 14: Comparison of solubilisation of Cry1Ac wild type with
Cry1AcD (2-50) from JM109, BL21& DH5α (grown at 250C) ................................ 45
Figure 15: Comparison of trypsin digest of Cry1Ac wild type with
Cry1AcD (1-56) from JM109, BL21& DH5α (grown at 250C) ................................ 46
Figure 16: Comparison of trypsin digest of Cry1Ac wild type with
Cry1AcD (2-50) from JM109, BL21& DH5α (grown at 250C) ................................ 47
Figure 17: Protein concentration determination of Cry1AcD (1-56)
and Cry1AcD (2-50) ................................................................................................. 48
Table 3: Toxicity assays of Cry1AcD (1-56), Cry1AcD (2-50) and
Cry1Ac wild type against resistant, NOQA, population of P.xylostella .................... 49
Figure 18: SalI + SphI digested pGEM 1AcD (1-56) and pGEM 1AcD (2-50) ........ 50

Figure 19: Gel purified 4 Kb products (Cry1AcD (1-56)) and (Cry1AcD (2-50)) .... 51
Figure 20: Sal I + Sph I digested pSV2 and pSVP27A plasmid ................................ 52
Figure 21: Gel purified pSV2 and pSVP27A ............................................................. 52
Diagram 1: Construction of recombinant plasmid pSV2 1AcD ................................ 53
Diagram 2: Construction of recombinant plasmid pSVP27A 1AcD ......................... 53
Fig 22 a: Rapid Size Screen of JM 109 colonies supposed to possess
pSV2 1AcD (1-56) and pSV2 1AcD (2-50) ............................................................... 54
Fig 22 b: Rapid Size Screen of JM 109 colonies supposed to possess
pSVP27A 1AcD (2-50) and pSV2 1AcD (2-50) ....................................................... 54
Fig 22 c: Rapid Size Screen of JM 109 colonies supposed to possess
pSVP27A 1AcD (1-56) ............................................................................................. 54
Figure 23: SalI+SphI restriction digest of recombinant plasmids supposed
to be pSV2 1AcD (2-50) and pSV2 1AcD (1-56) ..................................................... 56
Figure 24: SalI + SphI restriction digest of recombinant plasmids supposed
to be pSVP27A 1AcD (2-50) and pSVP27A 1AcD (1-56)....................................... 57
Figure 25: SalI and SphI digested constructs pSV2 1AcD (2-50) and
pSVP27A 1AcD (2-50) ............................................................................................. 59
Figure 26: Gel to show the expression of Cry1AcD (2-50) harvested
from Bacillus thuringiensis 78/11 .............................................................................. 60
Table 4: Expression, solubility and trypsin activation of Cry1AcD (1-56) and
Cry1AcD (2-50) from three different strains of E.coli (DH5α, JM109 and BL21) ... 63

CHAPTER 4: MECHANISM OF RESISTANCE TO SPINOSAD IN
LEPIDOPTERAN INSECTS
Figure 27: PCR product of New High Fidelity Program ........................................... 68
Figure 28: Gel purified PCR product ......................................................................... 68
Figure 29: Rapid Size Screen of subcultured colonies............................................... 69
Figure 30: Restriction digest of plasmids eluted from
E.coli JM109 colonies 6, 20, 23 ................................................................................. 70
Figure 31: Genomic DNA of NOQA ......................................................................... 71
Figure 32: PCR product of NOQA............................................................................. 72

TABLE OF CONTENTS
Page
CHAPTER 1: INTRODUCTION .............................................................................. 1
1. 1.Bacillus thuringiensis .......................................................................................... 1
1. 2. B.thuringiensis Genome ..................................................................................... 2
1. 3. Expression of Cry Genes .................................................................................... 2
1. 3. 1. Sporulation Independent Cry Gene Expression ..................................... 3
1. 3. 2. Cry mRNA Stability ............................................................................... 4
1. 4. Crystallization of δ- endotoxins ......................................................................... 5
1. 5. Cry toxin Nomenclature and specificity of Cry toxins towards different
Insects ........................................................................................................................ 6
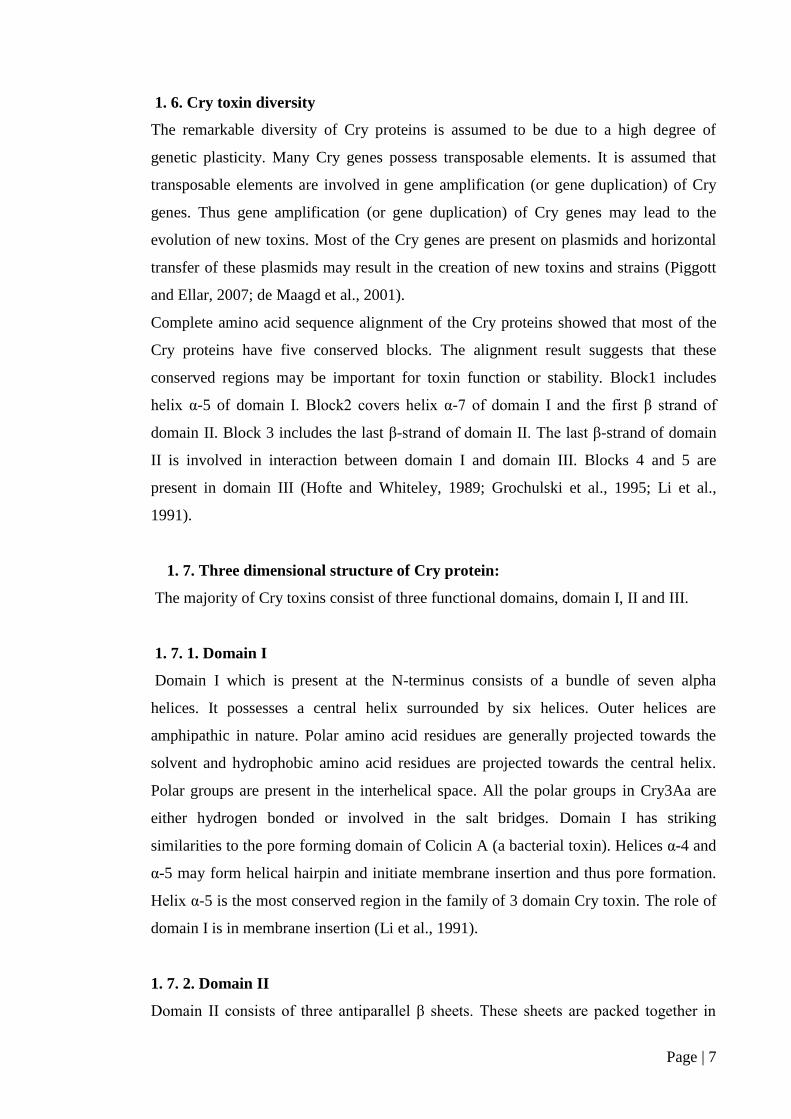
1. 6. Cry toxin diversity ........................................................................................................ 7
1. 7. Three dimensional structure of Cry protein ....................................................... 7
1. 7. 1. Domain I ................................................................................................ 7
1. 7. 2. Domain II ............................................................................................... 8
1. 7. 3. Domain III .............................................................................................. 8
1. 8. Mode of action of Cry toxin ............................................................................... 8
1. 8. 1. Ingestion ................................................................................................. 8
1. 8. 2. Solubilization and Proteolytic activation ............................................... 8
1. 8. 3. Receptor binding .................................................................................... 9
1. 8. 3. 1. Cadherin ................................................................................ 9
1. 8. 3. 2. APN ....................................................................................... 11
1. 8. 3. 3. ALP ....................................................................................... 11
1. 8. 4. Pore formation model ............................................................................ 12
1. 8. 5. Signal transduction model ..................................................................... 12
1. 9. Mechanism of resistance to Bt ........................................................................... 13
1. 9. 1. Binding disruption .................................................................................. 14
1. 9. 2. Altered Proteolytic Activation ............................................................... 16
1. 10. Strategies to improve the efficacy of Cry toxin ............................................... 17
1. 10. 1. Serine protease inhibitors ................................................................... 17
1. 10. 2. Chitinase ............................................................................................. 18
1. 10. 3. 23.3 KDa CR12-MPED (membrane – proximal
extracellular domain) ......................................................................... 18
1. 10. 4. Mutations to increase the toxicity of Cry proteins ............................. 18
1. 10. 5. Domain swapping to increase the toxicity of Cry toxin ..................... 18
1. 10. 6. Cry1A modified toxins ....................................................................... 19
1. 11. Esterases and Resistance .................................................................................. 19
1. 12. Glutathione-s-transferase (GST) and resistance............................................... 20
1. 13. General structure of GST ................................................................................. 20
1. 14. Mixed Fuction Oxidases (MFOs) and resistance ............................................. 21
1. 15. Plutella xylostella ............................................................................................. 21
1. 16. Spinosad resistance in insects .......................................................................... 22
1. 17. Aims ................................................................................................................. 24
CHAPTER 2: MATERIALS AND METHODS ..................................................... 25
2. 1. Bacterial strains .................................................................................................. 25
2. 1.1. E.coli ....................................................................................................... 25
2. 1. 1. 1. JM 109 .................................................................................... 25
2. 1. 1. 2. DH5α ...................................................................................... 25
2. 1. 1. 3. BL21 ....................................................................................... 25
2. 1. 2. B.thuringiensis ........................................................................................ 25
2. 1. 2. 1. 78/11 ........................................................................................ 25
2. 2. Plasmids ............................................................................................................. 25
2. 2. 1. Recombinant Plasmids ........................................................................... 25
2. 3. Plutella xylostella strain ..................................................................................... 25
2. 3. 1. NOQA .................................................................................................... 25
2. 4. Culture media ..................................................................................................... 26
2. 4. 1. LB (Luria-Bertani) media ...................................................................... 26
2. 4. 2. LB- agarose plates .................................................................................. 26
2. 5. Polymerase chain reaction to create modified Cry1Ac toxin............................. 26
2. 6. Purification of PCR product from the gel .......................................................... 27
2. 7. Ligation of Purified PCR product ...................................................................... 27
2. 8. Transformation in E.coli .................................................................................... 27
2. 9. Miniprep of transformed E.coli cells ................................................................. 28
2. 10. Ligation of pSV2 and pSVP27A with Cry1AcD (1-56)
and Cry1AcD (2-50) .................................................................................................. 28

2. 11. Transformation in Bacillus thuringiensis (Bt) ................................................. 29
2. 12. Miniprep of transformed Bacillus thuringiensis cells ...................................... 29
2. 13. Rapid size screen .............................................................................................. 29
2. 14. Restriction digest .............................................................................................. 29
2. 15. Harvesting of protein from E.coli ................................................................... 30
2. 16. Harvesting of protein from Bacillus thuringiensis ........................................... 30
2. 17. Preparation of SDS gel ..................................................................................... 30
2. 17. 1. Sample preparation for SDS-PAGE ..................................................... 31
2. 17. 2. Running and developing of gel ............................................................ 32
2. 18. Solubilisation and Trypsin activation............................................................... 32
2. 19. Gel comparison of Cry1AcD (1-56) and Cry1AcD (2-50)
with Cry1Ac wild type ............................................................................................... 33
2. 20. Leaf dip Bioassay ............................................................................................. 33
2. 21. Extraction of genomic DNA from Plutella xylostella NOQA population ....... 33
2. 22. Extraction of genomic DNA from Spodoptera litura ...................................... 34
2. 23. PCR to amplify ninth intron splice junction of nAChR ................................... 34
2. 24. Ligation of purified PCR product with pGEM-T easy vector ......................... 35
CHAPTER 3: CREATING MODIFIED Cry1Ac AND CHECKING
ITS EFFECTIVENESS AGAINST Plutella xylostella NOQA POPULATION ....... 36
3. 1. Introduction ........................................................................................................ 36
3. 2. Use of Polymerase chain reaction to create Cry1Ac modified toxin ................. 38
3. 3. Purification of PCR product ............................................................................... 39
3. 4. Ligation of purified PCR product ...................................................................... 40
3. 5. Transformation of E.coli JM109 with pGEM 1AcD
and mini-prep of pGEM 1AcD .................................................................................. 40
3. 6. Restriction digest to verify whether deletion has taken place or not ................. 40
3. 7. Expression of Cry1AcD protein ......................................................................... 42
3. 8. Solubilisation of Cry1AcD (1-56) and Cry1AcD (2-50) ................................... 44
3. 9. Trypsin digest of Cry1AcD (1-56) and Cry1AcD (2-50)................................... 45
3. 10. Protein concentration determination of Cry1AcD (1-56) and
Cry1AcD (2-50) from DH5α grown at 250C ............................................................. 47
3. 11. Leaf dip bioassays using Cry1AcD (1-56) and Cry1AcD (2-50)
from DH5α grown at 250C ........................................................................................ 48
3. 12. Restriction digest to separate Cry1AcD (1-56) and Cry1AcD (2-50)
from pGEM vectors.................................................................................................... 50
3. 13. Extraction of 4 kb band .................................................................................... 51
3. 14. Double digestion of pSV2 and pSVP27A plasmid
with Sal I and Sph I enzyme ...................................................................................... 51
3. 15. Ligation of Cry1AcD (1-56) and Cry1AcD (2-50) with pSV2
and pSVP27A ............................................................................................................. 53
3. 16. Transformation of E.coli JM109 strain with ligation mixes ............................ 53
3. 17. Rapid Size Screen of the subcultured colonies ................................................ 53
3. 18. Miniprep of colonies whose bands were above the control band .................... 55
3. 19. Restriction digests of recombinant plasmids ................................................... 55
3. 20. Transformation of Bt 78/11 with pSV2 1AcD (2-50) and
pSVP27A 1AcD (2-50) ........................................................................................... 57
3. 21. Transformation of JM109 with constructs ....................................................... 58
3. 22. Restriction digests of the Constructs ................................................................ 58
3. 23. Discussion ........................................................................................................ 61
CHAPTER 4: MECHANISM OF RESISTANCE TO
SPINOSAD IN LEPIDOPTERAN INSECTS .......................................................... 66
4. 1. Introduction ........................................................................................................ 66
4. 2. Genomic DNA extraction from Spodoptera litura ............................................ 67
4. 3. PCR to amplify the region supposed to possess the mutation ........................... 67
4. 4. Purification of PCR product ............................................................................... 68
4. 5. Ligation of purified PCR product with pGEM-T easy vector ........................... 69
4. 6. Transformation of E.coli JM 109 strain with ligation mix................................. 69
4. 7. Rapid Size Screen of subcultured colonies ........................................................ 69
4. 8. Restriction digest on the plasmids eluted from colonies 6, 20 and 23 ............... 69
4. 9. Discussion .......................................................................................................... 73
REFRENCES ............................................................................................................. 76

Page | 1
Chapter 1
Introduction
1.1. Bacillus thuringiensis
Bacillus thuringiensis (Bt) is a gram positive spore forming bacteria. It forms a spore
when it is in an adverse condition i.e. when nutrients become limiting. Bt produces
protein crystals in the cytoplasm of the mother cell during sporulation (Schnepf et al.,
1998). The protein crystals are insoluble protoxins when they are synthesized. Protoxins
dissolve and become active in the insect gut. Protoxins require extremes of pH for
dissolving, which is present in the insect gut. Protoxins are activated by insect gut
protease (Knowles and Dow, 1993).
The δ- endotoxins consist of two multigenic families, Cry and Cyt. Cry proteins are
toxic to different insect orders. They are toxic to Lepidoptera, Coleoptera,
Hymenoptera, Diptera and also to nematodes. But Cyt proteins are toxic mostly against
Diptera (Gomez et al., 2007). Bacillus thuringiensis is the most commonly used
biopesticide to control insects which cause damage to the crops (Crickmore, 2005).
Bt based biopesticides are used as spray, granular or solid form to control insects. These
biopesticides are commercially available under different names. Bacillus thuringiensis
kurstaki strains are available in the name of Biobit, Dipel, Thuricide etc. and Bacillus
thuringiensis israelensis strains are available in the name of Vectobac, Bactimos etc.
(Cranshaw,2008).
Another method to control insects is to express the Cry genes in plants and these types
of plants are known as transgenic Bt plants (Bravo and Soberon, 2008).
Prolonged and continuous use of Bt toxin has led to the development of resistance in
three species of Lepidoptera in granary, open field and greenhouse. Plutella xylostella
has developed Bt toxin resistance in the open field, Trichoplusia ni has developed Bt
toxin resistance in the greenhouse and Plodia interpunctella has developed Bt toxin
resistance in the granary (Heckel et al., 2007). Many other species of insects have
developed resistance to Bt toxin by selection under laboratory conditions (Heckel et al.,
2007; Griffiths and Aroian, 2005).
Bacillus thuringiensis strains have been isolated from different habitats such as soil,
leaves, insects, freshwater, grain dust, mills, annelids and insectivorous mammals
(Meadows et al., 1992; Espinasse et al., 2003; Martinez and Caballero, 2002; DeLucca

Page | 2
et al., 1984; Hendriksen and Hansen, 2002; Swiecicka et al., 2002).
Bacillus thuringiensis and Bacillus cereus are closely related. There is ample evidence
which suggests that Bacillus thuringiensis and Bacillus cereus should be considered a
single species. Biochemical and morphological methods of classifying bacteria could
not differentiate B.thuringiensis from B.cereus. Molecular methods such as
chromosomal DNA hybridization, 16S rRNA sequence comparison, amplified fragment
length polymorphism analysis, genomic restriction digest analysis suggest that they are
single species. The only notable phenotypic difference between B.cereus and
B.thuringiensis is that most of the B.thuringiensis strains produce parasporal crystals
(Carlson et al., 1994; Carlson et al., 1996; Keim et al., 1997; Schnepf et al., 1998;
Prieto-Samsonov et al., 1997).
Flagellar (H) serotype method is the most preferred method for classifying the
B.thuringiensis strains. Till now B.thuringiensis strains have been classified into more
than 69 H serotype (Xu and Cote, 2008).
1. 2. B.thuringiensis Genome
Genome size of B.thuringiensis strains range from 2.4 to 5.7 million base pairs. Most of
the B.thuringiensis strains have many extrachromosomal elements. Some of these
extrachromosomal elements are circular and others are apparently linear (Carlson et al.,
1994; Carlson et al., 1996).
Most of the Cry genes are present on large plasmids. B.thuringiensis possesses a large
variety of transposable elements. These transposable elements include insertion
sequences and transposons. The study of Cry1A genes showed that these genes were
flanked by two sets of inverted repeated sequences. Nucleotide sequence analysis
analysis of these repetitive elements showed that they were insertion sequence. They
have been given the name IS231 and IS232. The IS231 and IS232 belong to IS4 and
IS21 family of insertion sequence respectively. The first transposable element to be
discovered in B.thuringiensis was Tn4430. It was isolated serendipitously from
B.thuringiensis when it got inserted into a conjugative plasmid pAMβ1 transferred from
Enterococcus faecalis (Mahillon et al., 1994; Kronstad and Whiteley, 1984; Lereclus et
al., 1984; Lereclus et al., 1983).
1. 3. Expression of Cry Genes
Expression of Cry genes are either sporulation dependent or sporulation independent.

Page | 3
Most of the Cry genes are sporulation-specific genes i.e. they are expressed during
sporulation. Mechanism of sporulation has been studied extensively in Bacillus subtilis.
Sporulation is controlled by sigma factors. Each sigma factor recognizes a specific
promoter and directs the transcription of that specific gene. These sigma factors are σA
(primary sigma factor of vegetative cell) and five factors σH, σ
F, σ
E, σ
G and σ
K which
become activated during sporulation. These five factors have been written in order of
their appearance during sporulation. σ A
and σH factors are active before the septum
formation i.e. in predivisional cell, σF and σ
G are active in forespore and σ
E and σ
K are
active in mother cell (Losick and Stragier, 1992; Errington, 1993; Schnepf et al., 1998).
Cry1Aa, Cry1Ab, Cry1Ac, Cry1Ba, Cry2Aa, Cry4Aa, Cry4Ba, Cry11Aa, Cry15Aa etc
shows sporulation dependent expression and are expressed only in the mother cell
compartment (Schnepf et al., 1998).
Cry1Aa gene possesses two overlapping promoters BtI and BtII. Brown and Whiteley
isolated two sigma factors σ35
and σ28
from B.thuringiensis. σ35
directs transcription of
Cry1Aa from BtI and σ28
directs transcription of Cry1Aa from BtII. BtI promoter is
active from early to mid sporulation and BtII is active from mid sporulation to end of
spore formation (Brown and Whiteley, 1988; Brown and Whiteley, 1990).
Amino acid sequence comparison of σ35
with σE and σ
28 with σ
K shows that they are
nearly identical. These comparison results suggest that σ35
of B.thuringiensis is a
homolog of σE of B.subtilis and σ
28 of B.thuringiensis is a homolog of σ
K of B.subtilis
(Brown and Whiteley, 1988; Brown and Whiteley, 1990; Schnepf et al., 1998).
Adams and his colleagues showed that σ35
and σ28
can restore sporulation in σE and σ
K
defective strains of B.subtilis. Their in vitro transcription assays showed that σ35
and σ28
can recognize the B.subtilis promoters recognized by σE and σ
K containing polymerase
(Adams et al., 1991).
All the sporulation specific Cry genes such as Cry1Aa, Cry1Ab, Cry1Ac, Cry1Ba,
Cry2Aa, Cry4Aa, Cry4Ba, Cry11Aa, Cry15Aa etc. are transcribed by either or both of
the σE or σ
K forms of RNA polymerase (Baum and Malvar, 1995; Schnepf et al., 1998).
1. 3. 1. Sporulation Independent Cry Gene Expression
The Cry3Aa gene is an example of sporulation independent Cry gene expression.
Several studies have shown that Cry3Aa gene is expressed during vegetative growth.
The Cry3Aa promoter is similar to the promoter recognized by σA
(the primary sigma
factor of vegetative cells). Expression of Cry3Aa was increased and prolonged in

Page | 4
mutant strains of B.subtilis and B.thuringiensis which were unable to initiate
sporulation. These results indicate that Cry3Aa gene expression is not dependent on
sporulation. Cry3Aa gene is activated by genes regulating the transition from
exponential growth to the stationary phase (Agaisse and Lereclus, 1995).
1. 3. 2. Cry mRNA Stability
The high level of toxin production in B.thuringiensis is due to the stable Cry mRNA.
Production of stable mRNA maximizes gene expression. The half-life of Cry mRNA is
about 10 minutes. The half-life of Cry mRNA is at least five times greater than the
average half-life of bacterial mRNA (Agaisse and Lereclus, 1995).
Wong and Chang showed that fusion of Cry1Aa terminator fragment to the distal ends
of either penicillinase (PenP) gene of B.licheniformis or the interleukin2 cDNA from
human jurkat cell line increased the half lives of the mRNAs transcribed from these
fusion genes in E.coli and B.subtilis. The half-lives of these fusion gene transcripts
increased almost three times. The results suggest that Cry1Aa gene termination
sequence acts as a positive retroregulator (Wong and Chang, 1986).
The Cry1Aa terminator sequence possesses an inverted repeat sequence. The inverted
repeat sequence has the potential to form stable stem-loop structure. It has been proved
that processive activities of 3’-5
’ exoribonucleases are disrupted by 3
’stem-loop
structure. Therefore it is possible that Cry1Aa terminator may be involved in Cry
mRNA stability by protecting it from exonucleolytic degradation from the 3’. Similar
terminator sequence has been found downstream of various Cry genes (Agaisse and
Lereclus, 1995).
Cry3Aa gene promoter region is composed of at least three domains: an upstream
region from -635 nucleotide position to -553 nucleotide position, an internal region
from -553 nucleotide position to -367 nucleotide position and a downstream region
from -367 nucleotide position to +18 nucleotide position. Full expression of Cry3Aa
gene requires the upstream region and the downstream region. The downstream region
is involved in post-transcriptional event. Cry3Aa gene produces a stable mRNA whose
5’end corresponds to nucleotide position -129. Deletion of nucleotides from positions
-189 to -129 (60bp) showed no detectable effect on Cry3Aa expression level or on the
position of 5’end of transcript. Therefore Aggaise and Lereclus proposed that
transcription of Cry 3Aa gene initiated at nucleotide position -558. This transcript is
then processed from nucleotide -558 position to nucleotide -130 position generating a

Page | 5
stable mRNA whose 5’ end corresponds to nucleotide position-129 (Agaisse and
Lereclus, 1994; Agaisse and Lereclus, 1995).
Fusion of the Cry3Aa 5’untranslated region (from -129 nucleotide position to -12
nucleotide position) to the 5’region of lacZ reporter gene which is transcribed by the
B.subtilis xylA promoter increased the stability of the lacZ fusion mRNA and also
increased the production of β galactosidase by about 10 times. Deletion and mutation
analysis suggest that a Shine-Dalgarno related sequence (GAAAGGAGG) from
nucleotide positions -125 to -117 is the determinant of Cry3Aa stability. This Shine-
Dalgarno sequence has been given the name STAB-SD. The interaction between the
3’end of 16S rRNA and STAB-SD could be the reason for the stability of Cry3Aa
mRNA. Thus the binding of 30S ribosomal subunit to STAB-SD may protect Cry3Aa
mRNA from 5’-3
’ ribonuclease activity. Therefore giving rise to a stable Cry3Aa
mRNA with the 5’ end at -129 position (i.e. the extent of 30S subunit protection)
(Agaisse and Lereclus, 1996).
1. 4. Crystallization of δ- endotoxins
Cry proteins generally form crystal inclusions in the mother cell compartment of
B.thuringiensis. Crystals have different shapes. The shapes of the crystals depend on
their protoxin composition. Cry1 crystal has bi-pyramidal shape. Cry2, Cry3A and
Cry3B crystals have cuboidal, flat rectangular and irregular shapes respectively.
Cry11A crystal has rhomboidal shape and Cry4A and Cry4B crystals have spherical
shapes (Schnepf et al., 1998).
Several Cry1 genes have been expressed in E.coli and B.subtilis. These Cry1 genes
were able to direct the synthesis of biologically active inclusions in E.coli and
B.subtilis. Thus suggesting that 130 to 140 kDa Cry1 proteins can spontaneously form
crystals independent of the host bacteria. It is assumed that cysteine rich C-terminal
halves of the Cry1 protoxins play an important role in maintenance of the parasporal
inclusion structure. Cry3Aa (73kDa) protoxin does not possess cysteine rich C-terminal
region. But the three dimensional structure of Cry3Aa protein shows the presence of
four intramolecular salt bridges. These intramolecular salt bridges might be involved in
providing stability to the crystal inclusion (Ge et al., 1990; Shivakumar et al., 1986;
Bietlot et al., 1990; Li et al., 1991; Gill et al., 1992).
Page | 6
1. 5. Cry toxin Nomenclature and specificity of Cry toxins towards different insects
All the Cry genes whose sequences are available have been assigned to 218 holotypes
by percent amino acid sequence identity. Each holotype is given a primary (Arabic
number), secondary (uppercase letter), tertiary (a lowercase letter) and quaternary
(another Arabic number) rank. Toxins with less than 45% amino acid sequence identity
differ in primary rank. If the toxins have less than 78% and 95% amino acid identity
they differ in secondary and tertiary rank respectively. Quaternary ranks have been
given to those toxins which are more than 95% identical or identical but the sequences
have been obtained independently. Quatneray rank is optional and is used only for the
sake of clarity (Crickmore et al., 2011; Crickmore et al., 1998; de Maagd et al., 2001).
Fig 1: Cry toxins branches are colour coded according to insect order specificity of the toxin.
Red: Coleoptera specific; Green: Lepidoptera specific; Blue: Diptera specific; Magenta:
Nematode specific; Yellow: Hymenoptera specific (de Maagd et al., 2003).
Page | 7
1. 6. Cry toxin diversity
The remarkable diversity of Cry proteins is assumed to be due to a high degree of
genetic plasticity. Many Cry genes possess transposable elements. It is assumed that
transposable elements are involved in gene amplification (or gene duplication) of Cry
genes. Thus gene amplification (or gene duplication) of Cry genes may lead to the
evolution of new toxins. Most of the Cry genes are present on plasmids and horizontal
transfer of these plasmids may result in the creation of new toxins and strains (Piggott
and Ellar, 2007; de Maagd et al., 2001).
Complete amino acid sequence alignment of the Cry proteins showed that most of the
Cry proteins have five conserved blocks. The alignment result suggests that these
conserved regions may be important for toxin function or stability. Block1 includes
helix α-5 of domain I. Block2 covers helix α-7 of domain I and the first β strand of
domain II. Block 3 includes the last β-strand of domain II. The last β-strand of domain
II is involved in interaction between domain I and domain III. Blocks 4 and 5 are
present in domain III (Hofte and Whiteley, 1989; Grochulski et al., 1995; Li et al.,
1991).
1. 7. Three dimensional structure of Cry protein:
The majority of Cry toxins consist of three functional domains, domain I, II and III.
1. 7. 1. Domain I
Domain I which is present at the N-terminus consists of a bundle of seven alpha
helices. It possesses a central helix surrounded by six helices. Outer helices are
amphipathic in nature. Polar amino acid residues are generally projected towards the
solvent and hydrophobic amino acid residues are projected towards the central helix.
Polar groups are present in the interhelical space. All the polar groups in Cry3Aa are
either hydrogen bonded or involved in the salt bridges. Domain I has striking
similarities to the pore forming domain of Colicin A (a bacterial toxin). Helices α-4 and
α-5 may form helical hairpin and initiate membrane insertion and thus pore formation.
Helix α-5 is the most conserved region in the family of 3 domain Cry toxin. The role of
domain I is in membrane insertion (Li et al., 1991).
1. 7. 2. Domain II
Domain II consists of three antiparallel β sheets. These sheets are packed together in

Page | 8
such a way that they form a β-prism with pseudo three fold symmetry. Two sheets are
exposed to the solvent and the third sheet packs against domain I. Surface loop of the β
sheets show similarities to immunoglobin antigen binding sites thus suggesting a role in
receptor binding (Li et al., 1991; Boonserm et al., 2005; Pigott and Ellar, 2007).
Site directed mutagenesis studies of Cry1A toxins have shown that loop α-8 (present in
the junction of domain I and domain II) and loop2 and loop3 regions of domain II are
involved in receptor binding and toxicity (Rajamohan et al., 1996a; Rajamohan et al.,
1995; Lee et al., 2000; Lee et al., 2001; Gomez et al., 2002b).
1. 7. 3. Domain III
Domain III forms a β sandwich structure. In the β-sandwich arrangement two
antiparallel β-sheets pack together and resembles that of a “Jelly roll”. The outer sheet
is exposed to the solvent and the inner sheet pack against domain II (Li et al., 1991;
Boonserm et al., 2005).
It is suggested that domain III possibly plays an important role in initial binding to the
receptor and domain II may be responsible for the secondary, irreversible binding (Lee
et al., 1999).
Domain swapping experiments have suggested that Cry1Ab domain III is involved in
binding to midgut receptor in Spodoptera exigua (de Maagd et al., 1996).
1. 8. Mode of action of Cry toxin:
Until now two models have been proposed for the mode of action of the Cry1A toxins.
1. Pore formation model
2. Signal transduction model
In both the models initial steps are identical. These initial steps include ingestion,
solubilization and proteolytic activation and primary receptor binding (Soberon et al.,
2009; Knowles and Dow, 1993; Bravo et al., 2002).
1. 8. 1. Ingestion: Cry toxins are gut poisons so they must be first eaten by the
susceptible larvae (Knowles and Dow, 1993).
1. 8. 2. Solubilization and Proteolytic activation: Cry1A toxins are synthesized as
inactive protoxins of around 130-140 kDa. In most of the lepidopterans, protoxins are
solubilized by alkaline conditions present in the midgut. Solubility of the crystals
depends on the composition of the crystals (Knowles and Dow, 1993; Aronson et al.,
Page | 9
1991; Soberon et al., 2009).
After solubilization protoxins are activated by gut proteases. Trypsin-like or
chymotrypsin-like enzymes are the major gut proteases. Gut protease typically removes
some 500 amino acids from the C- terminus and 25-30 amino acids from the N-
terminus of Cry1A. The active forms of toxins are of 65-55 kDa and are protease
resistant (Knowles and Dow, 1993; Bravo et al., 2002; Schnepf et al., 1998).
Seven specific proteolytic cleavages occur at C-terminus end in a sequential manner.
Each proteolytic cleavage produces a 10 kDa fragment which is rapidly proteolyzed
further to small peptides (Gill et al., 1992).
Activated Cry1Ac comprises of amino acids from 29th
position (N-terminus) to 623rd
position (C-terminus). The 29th
position and 623rd
position residues are isoleucine and
lysine respectively (Rukmini et al., 2000).
1. 8. 3. Receptor binding: The binding of Cry toxin to insect midgut epithelial
receptors determines the specificity and toxicity of the Cry toxin. The relation between
binding and toxicity was first shown by using brush border membrane vesicles (BBMV)
from microvilli. The technique used to show the correlation between binding and
toxicity was developed by Wolfersberger (Pigott and Ellar, 2007). Later Liang et al.
showed that the rate constant of irreversible binding had a better correlation with
toxicity than maximum extent of binding (Liang et al., 1995).
There are at least four different protein receptors that interact with Cry1A toxins. These
are: a cadherin- like protein (CADR), a glycosylphosphatidyl-inositol (GPI)-anchored
aminopeptidase-N (APN), a GPI-anchored alkaline phosphatase (ALP) and a 270 kDa
glycoconjugate (Gomez et al., 2007).
1. 8. 3. 1. Cadherin
Cadherin proteins represent a diverse family of glycoprotein. Cadherin proteins have a
variety of functions which includes cell adhesion, migration, cytoskeletal organization
and morphogenesis. These proteins are transmembrane proteins. These proteins have
two domains: cytoplasmic domain and extracellular ectodomain. Ectodomain contains
several cadherin repeats. Classical cadherins are present primarily within adherens
junctions which are involved in cell-cell adhesion. Cadherin like protein in lepidopteran
species have been found on the apical membrane of midgut columnar epithelial cells
which is the target site for Cry toxins. Much research has been done on lepidopteran

Page | 10
cadherin- like proteins as Cry1A receptors and there is good evidence which suggest
that cadherin-like proteins play a very important role in toxin susceptibility. BT-R1 a
210- kDa glycoprotein was the first cadherin-like protein shown to interact with Cry
toxins. BT-R1 was identified in Manduca sexta BBMV (Angst et al., 2001; Gumbiner,
1996; Vadlamudi et al., 1993; Gomez et al., 2007).
BT-R1 contains a signal peptide, an extracellular ectodomain containing 11 cadherin
repeats, a cadherin repeat 12- membrane proximal extracellular domain (CR12-MPED),
a transmembrane domain and a small cytoplasmic domain (Vadlamudi et al., 1995;
Chen et al., 2007). Francis and Bulla carried out ligand blot assays to show that Cry1Aa,
Cry1Ab and Cry1Ac bind to BT-R1 (Francis and Bulla, 1997).
Drosch et al. showed that Cry1Ab was cytotoxic to COS-7 and Human Embryonic
Kidney (HEK) 293 cells expressing BT-R1. Thus suggesting that BT-R1 mediates cell
death upon Cry toxin binding (Drosch et al., 2002).
Gomez et al. suggested that BT-R1 promotes the conformational change in Cry1Ab
when Cry1Ab binds to BT-R1. The conformational change exposes helix α1 for
proteolytic degradation and allows the formation of pre pore toxin oligomer (Gomez et
al., 2002 a, Gomez et al., 2002 b).
A cadherin like protein BtR175 acts as a Cry1Aa receptor in Bombyx mori (Nagamatsu
et al., 1998). Nagamatsu et al. showed that Spodoptera frugiperda 9 (Sf 9) cells
expressing BtR175 swell when exposed to Cry1Aa.They suggested that swelling may
be due to the formation of ion channels in cell membrane (Nagamatsu et al., 1999).
COS 7 cells expressing BtR175 showed susceptibility to Cry1Aa (Tsuda et al., 2003).
Genetic studies carried by Gahan et al. showed that a single major gene is responsible
for resistance in Heliothis virescens YHD2 strain which has developed resistance in the
lab. This gene was assigned to Linkage Group 9 (LG9). They tested whether gene
encoding APNs and Cadherin like proteins in Heliothis virescens mapped to LG9. The
gene encoding APNs were rejected because they did not map to LG9. Cadherin like
proteins were not isolated from Heliothis virescens so they searched for and found a
gene homologous to BtR175 and named it BtR4. The protein from BtR4 was 70%
identical to BtR175 and was named HevCaLP. Subsequently BtR4 gene was mapped in
YHD2 strain and it was found to be located on LG9. BtR4 gene disruption by a long
terminal repeat-type retrotransposon is suggested as the reason for resistance in YHD2
strain (Gahan et al., 2001).
Jurat-Fuentes et al. showed that expression of HevCaLP was necessary for Cry1Aa

Page | 11
toxin binding to BBMV in Heliothis virescens (Jurat-Fuentes et al., 2004).
Xie et al. showed that Cry1Ac and Cry1Ab could also bind to Heliothis virescens
cadherin (Xie et al., 2005).
1. 8. 3. 2. APN: APN is a GPI anchored exopeptidase. Lepidopteran APNs have been
divided into five different classes. They have a number of functions in a wide range of
species. In lepidopteran larval midgut they work together with endopeptidases and
carboxypeptidases to digest proteins present in the insect diet (Herrero et al., 2005;
Gomez et al., 2007; Wang et al., 2005).
Out of nine known class1 APNs five of them have been checked for their ability to bind
to the Cry toxins. A 120 kDa Class1 APN from M.sexta was shown to bind to Cry1Ac,
Cry1Ab and Cry1Aa. Cry1Ac binds to two different sites in Class1 APN. Out of these
two sites one of the site is shared by all the three Cry1A toxins (Masson et al., 1995;
Pigott and Ellar, 2007).
A 170 kDa class1 APN from H.virescens was shown to bind to Cry1Ac, Cry1Ab and
Cry1Aa. All the three Cry1A toxins bind to two sites of APN from H.virescens (Luo et
al., 1997; Pigott and Ellar, 2007).
Class 3 APN from Lymantria dispar binds to Cry1Ac but not to Cry1Aa or Cry1Ab
(Valaitis et al., 1995; Pigott and Ellar, 2007).
Class 3 APN from H.armigera was expressed exogenously in T.ni cells. The expressed
protein was highly glycosylated and enzymatically active and was of 120 kDa in size.
The ligand blot analysis showed that Cry1Ac reacted with the expressed protein i.e.
class 3 APN but Cry1Aa and Cry1Ab did not react with class 3 APN (Rajagopal et al.,
2003; Pigott and Ellar, 2007).
So it can be summarized that Cry1Aa and Cry1Ab binds to class1 APN. Cry1Ac binds
to class1 and class 3 APN. Cry1Ac has broader specificity than Cry1Aa and Cry1Ab.
Cry1Ac binds to class1 APNs at two sites. It shares one site with Cry1Aa and Cry1Ab.
Binding to other site is dependent on Gal NAC(N-acetylgalactosamine) and this region
is threonine rich and predicted to be highly glycosylated.Cry1Ac also binds to class3
APN at this region (Pigott and Ellar, 2007; Gomez et al., 2007).
1. 8. 3. 3. ALP: ALPs also act as Cry toxin receptors but the researches on ALPs are
very limited as compared to APNs and Cadherin-like protein. Recent researches suggest
that ALP may act as Cry1Ac receptor in Maduca sexta and Heliothis virescens. In

Page | 12
Heliothis virescens ALP is a 68 kDa GPI-anchored membrane glycoprotein and in
Manduca sexta it is a 65-kDa BBMV protein (Jurat-Fuentes and Adang, 2004; McNall
and Adang, 2003).
1. 8. 4. Pore formation model:
According to this model (fig 1) activated Cry1A toxins bind to the primary receptor (i.e.
cadherin receptor). Binding of toxin to cadherin facilitates further proteolytic cleavage
of toxin at its N terminal end, thereby eliminating helix alpha1 of domain I. This
cleavage leads to the oligomerisation of monomeric toxin. Oligomerisation of toxin
increases the binding affinity of toxin to the secondary receptor which is a
glycosylphosphatidyl-inositol (GPI)-anchored aminopeptidase-N (APN) in Manduca
sexta and a GPI-anchored alkaline phosphatase (ALP) in Heliothis virescens. After
binding to the secondary receptor, oligomerised toxin inserts into lipid micro domain
where these secondary receptors are localised and creates pore in apical membrane of
midgut cells. This induces osmotic shock, bursting of midgut cells and finally leads to
the insect death (Soberon et al., 2009).
1. 8. 5. Signal transduction model:
According to this model (fig 2) toxicity of Cry1Ab protein is due to the activation of a
Mg2+ dependent signal cascade pathway. Cry1Ab toxin binds to the primary receptor
(i.e. cadherin receptor) and triggers the pathway. Cry1Ab toxin and primary receptor
interaction activates a guanine nucleotide-binding protein (G protein) which in turn
leads to the activation of an adenylyl cyclase. Activated adenylyl cyclase promotes the
production of intracellular cAMP. Increased levels of cAMP activate protein kinase A
which in turn activates an intracellular pathway resulting in cell death (Zhang et al.,
2006; Soberon et al., 2009).

Page | 13
Fig 2 a: Diagrammatic representation of Cry1A toxins mode of action according to the pore
formation model (Soberon et al., 2009).
Fig 2 b: Diagrammatic representation of mode of action of Cry1Ab according to the signal
transduction model (Zhang et al., 2006).
1. 9. Mechanism of resistance to Bt:
Changes in the biochemical and physiological processes of the insect gut and its content
Page | 14
can alter the mode of action of Bt and reduces the effectiveness of the Bt toxin
considerably leading to insect resistance. Development of resistance involves various
mechanisms. The mechanism of resistance depends on the type of insect, toxin and Bt
strain. Defective solubilization, insufficient proteolytic activation, over proteolysis (i.e.
toxin degradation), binding of toxin molecules to non-functional binding sites, defects
in functional binding sites, defect in pore formation and increased cellular repair have
been reported as mechanisms of resistance. But there is also a possibility of
involvement of other mechanisms as well (Bruce et al., 2007; Griffitts and Aroian,
2005).
Many different resistance mechanisms have been proposed but the best characterized
resistance mechanisms to date involve receptor inactivation at the midgut membrane or
solubilization-activation of the crystal proteins. Receptor mediated mechanism may
include loss of Cry toxin binding sites or binding of toxin molecules to non-functional
binding sites. Resistance mechanisms based on solubilization and proteolysis may
involve changes in the gut pH or changes in proteinases involved in protoxin activation
(Bruce et al., 2007; Griffitts and Aroian, 2005; Ma et al., 2005).
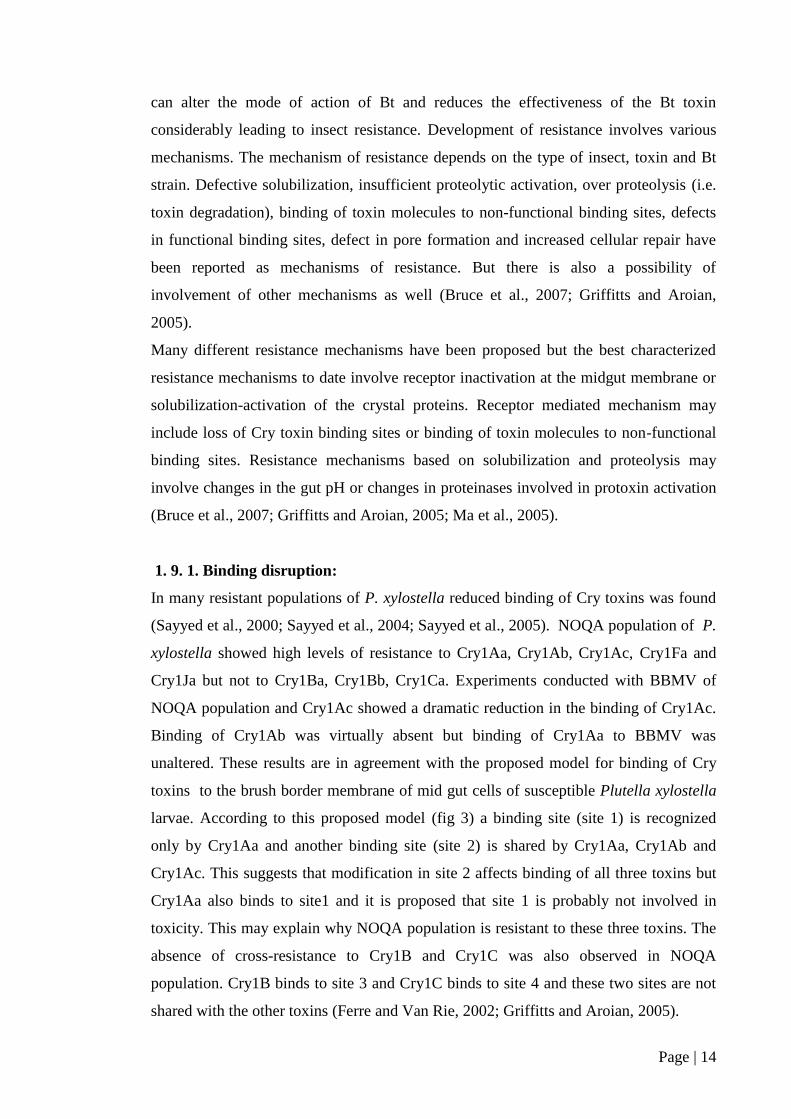
1. 9. 1. Binding disruption:
In many resistant populations of P. xylostella reduced binding of Cry toxins was found
(Sayyed et al., 2000; Sayyed et al., 2004; Sayyed et al., 2005). NOQA population of P.
xylostella showed high levels of resistance to Cry1Aa, Cry1Ab, Cry1Ac, Cry1Fa and
Cry1Ja but not to Cry1Ba, Cry1Bb, Cry1Ca. Experiments conducted with BBMV of
NOQA population and Cry1Ac showed a dramatic reduction in the binding of Cry1Ac.
Binding of Cry1Ab was virtually absent but binding of Cry1Aa to BBMV was
unaltered. These results are in agreement with the proposed model for binding of Cry
toxins to the brush border membrane of mid gut cells of susceptible Plutella xylostella
larvae. According to this proposed model (fig 3) a binding site (site 1) is recognized
only by Cry1Aa and another binding site (site 2) is shared by Cry1Aa, Cry1Ab and
Cry1Ac. This suggests that modification in site 2 affects binding of all three toxins but
Cry1Aa also binds to site1 and it is proposed that site 1 is probably not involved in
toxicity. This may explain why NOQA population is resistant to these three toxins. The
absence of cross-resistance to Cry1B and Cry1C was also observed in NOQA
population. Cry1B binds to site 3 and Cry1C binds to site 4 and these two sites are not
shared with the other toxins (Ferre and Van Rie, 2002; Griffitts and Aroian, 2005).

Page | 15
Fig 3: Suggested model for binding of Cry toxins to the brush border membrane of mid gut cells
of susceptible Plutella xylostella larvae (Ferre and Van Rie, 2002).
Similar results were obtained with a P.xylostella colony from Pennsylvania (PEN). The
population showed reduced binding to Cry1Ac and Cry1Ab but binding to Cry1Aa was
unaltered. P.xylostella Loxa colony also showed similar results. These results showed
that there is relationship between reduced binding and resistance. This was named as
type I binding-site alteration by the researchers (Tabashnik et al., 1997; Ferre and Van
Rie, 2002).
A P.xylostella colony (PHI) from the Philippines showed resistance to Cry1Aa, Cry1Ab
and Cry1Ac but was susceptible to Cry1Ca, Cry1Fa and Cry1Ja. This population
showed reduced binding of Cry1Ab but binding to Cry1Aa and Cry1Ac was unaltered.
Similar results were obtained from P.xylostella SERD-3 population from Malaysia. This
population showed reduced binding to Cry1Ab but not to Cry1Aa, Cry1Ac and Cry1Ca.
These results were explained by type II binding site alteration. According to type II
binding site alteration hypothesis alteration of site2 affects only one Cry protein which
normally binds to this site. This explains that there is only a partial overlap of the
binding epitopes of the different toxins (Tabashnik et al., 1997; Wright et al., 1997;
Ferre and Van Rie, 2002).
In P. xylostella major Cry1A resistance gene has been mapped to AFLP (Amplified
Fragment Length Polymorphism) linkage group22 (LG22) (Baxter et al., 2005; Heckel
et al., 1999; Heckel et al., 2007).
Linkage analysis showed that none of the eight aminopeptidases, one alkaline
phosphatase, one intestinal mucin, one glycosyltransferase and a homologue of a Cry1A
binding protein from B.mori genes map to LG22. Till now genetic approach has failed
to identify the resistance gene in NOQA and other P.xylostella population but it has
conclusively removed 13 known genes including cadherin as candidates for resistance

Page | 16
genes (Baxter et al., 2005; Jurat-Fuentes and Adang, 2004; Sarauer et al., 2003; Griffitts
et al., 2003; Hossain et al., 2005).
Xu and Wu showed that BBMV of Cry1Ac resistant Helicoverpa armigera strain
GYBT had lower binding affinity to Cry1Ac as compared to the BBMV of Cry1Ac
susceptible Helicoverpa armigera strain GY (Xu and Wu, 2008).
Wang et.al showed that BBMVs from Cry1Ac resistant strain of T.ni lack specific
affinity for binding to Cry1Ab and Cry1Ac (Wang et al., 2007).
Reduced binding was also observed in resistant strains of H.virescens and S.exigua (Lee
et al., 1995; Moar et al., 1995).
1. 9. 2. Altered Proteolytic Activation:
Altered proteolytic activation has been reported as mechanism of resistance in many
insects including: Spodoptera littoralis, Pieris brassicae, Heliothis virescens, Plodia
interpunctella, Choristoneura occidentalis, Melolontha melolontha, Ostrinia nubialis
and Leptinotarsa decemlineata (Lecadet and Martouret, 1987; Jaquet et al., 1987;
Oppert et al., 1997; Valaitis et al., 1999; Wagner et al., 2002; Li et al., 2004; Loseva et
al., 2002).
Some insects resistant to Bt were found to have higher proteolytic activity or a relative
higher concentration of proteases in the gut. Toxin sensitivity may be affected by types
and or by the activity levels of gut proteases. Research was conducted on P. brassicae,
Mamestra brassicae and S. littoralis. It was found that there was a direct correlation
between the toxicity of Bt subsp.thuringiensis, gut protein concentration and protease
activity (Oppert, 1999).
In Helicoverpa armigera toxin degradation was suggested as the mechanism of
resistance. The excessive degradation was caused by chymotrypsin like proteases (Shao
et al., 1998).
Excessive toxin degradation was also the suggested cause for resistance to Bt in
Choristoneura fumiferana (Pang and Gringorten, 1998).
Another possible mechanism of resistance is sequestration of toxin by gut proteases and
this mechanism has been reported in C.fumiferana (Milne et al., 1995).
The toxic effect of 14 different Bt strains were studied on P.brassicae, H.virescens,
S.littoralis. There was a large variation in relative toxicities. These variation in relative
toxicities depended on what the insects were fed i.e. they were fed crystals or
solubilized crystals or invitro-activated toxins (Jacquet et al., 1987).

Page | 17
In Bt subsp. entomocidus resistant population of Plodia interpunctella significantly
lower soluble gut proteinase activities were found. When phenotypic expression of gut
proteinases was compared between susceptible and resistant population to Bt subsp
entomocidus the absence of a major serine proteinase activity was observed in the
resistant population. This proteinase is involved in Bt protoxin activation .Loss of
proteinase could lead to toxin resistance. Bt resistance and loss of proteinase is
genetically linked (Oppert et al., 1997).
In a resistant colony of H.virescens (CP73-3) slower activation of Cry1Ab protoxin and
faster degradation of Cry1Ab toxin was observed when compared with susceptible
population (Ferre and Van Rie, 2002).
Several resistant populations were reported to have more susceptibility towards
activated toxin than protoxin. Resistant population of P.xylostella showed more
susceptibility towards activated Cry1Ac and Cry1Ca toxin than Cry1Ac and Cry1Ca
protoxin. Similarly resistant population of P. interpunctella and O. nubialis showed
more susceptibility towards activated Cry1Ab toxin than Cry1Ab protoxin. The results
from these populations suggest that only protoxin is affected by the resistance
mechanism but not the activated toxin. The reason for this might be that resistant insects
are able to reduce the rate of toxin activation or causes over-proteolysis of protoxin
which leads to toxin degradation (Sayyed et al., 2001; Sayyed et al., 2005; Bruce et al. ,
2007; Herrero et al., 2001; Li et al., 2005).
1. 10. Strategies to improve the efficacy of Cry toxin
1. 10. 1. Serine protease inhibitors:
Serine protease inhibitors have been shown to increase the efficacy of insecticidal
activity of Cry toxin in three different insect orders (Coleoptera, Lepidoptera and
Diptera). Serine protease inhibitors are present in legume seeds. At higher concentration
serine protease inhibitors kill insects. Serine protease inhibitors when used at a
concentration 105
times below their insecticidal level with Cry toxins enhance the
insecticidal activity of the Cry toxins. Genetically modified tobacco plant expressing
Cucurbita maxima trypsin protease inhibitor with Cry toxin showed six times increase
in insecticidal activity of Cry toxin when compared with genetic modified tobacco plant
expressing only Cry toxin against H.virescens. It is suggested that protease inhibitor
enhances Cry toxin efficacy by inhibiting gut proteases or by preventing the degradation
of membrane bound receptors (MacIntosh et al., 1990; Pardo-Lopez et al., 2008).

Page | 18
1. 10. 2. Chitinase:
It has been shown that chitinase when used with Cry toxin has a synergistic effect.
Chitinase increases the potency of Cry toxin by ten times. It is suggested that chitinase
increases the larvicidal effect of Cry toxin by forming holes in the peritrophic
membrane there by making it easy for the Cry toxin to bind to the receptors (Ding et al.,
2008; Regev et al., 1996; Pardo-Lopez et al., 2008).
1. 10. 3. 23.3 kDa CR12-MPED (membrane – proximal extracellular domain)
CR12-MPED is the functional receptor region of cadherin for Cry1Ab binding and
cytotoxicity. This 23.3kDa peptide fragment was fed with Cry1Ab to M.sexta larvae.
CR12-MPED peptide fragment increased the toxicity of Cry1Ab. CR12-MPED peptide
was also shown to enhance the toxicity of Cry1Ac in other lepidopteran insects. It was
suggested that when CR12-MPED is fed with Cry1A toxin, CR12-MPED increases the
number of binding sites in the microvilli of the insects by binding to the microvilli
thereby increasing the probability of Cry1A interaction with receptor thus increasing the
Cry1A toxicity (Chen et al., 2007).
1. 10. 4. Mutations to increase the toxicity of Cry proteins:
Rajamohan et al. showed that asparagine which is present at 372nd
position of Cry1Ab
amino acid sequence, lies in loop 2 of domain II, when substituted with alanine or
glycine increased the toxicity of Cry1Ab by 8-fold against Lymantria dispar (
Rajamohan et al., 1996 b).
A triple mutation in Cry1Ab was shown to increase the toxicity by 36 times against
L.dispar. Substitutions were made at 282nd
(located in α-helix 8), 283rd
(located in α-
helix8) and 372nd
(located in loop 2) positions. At 372nd
position asparagine was
substituted by alanine. At 282nd
position alanine was substituted by glycine and at 283rd
position leucine was replaced by serine (Rajamohan et al., 1996 b).
1. 10. 5. Domain swapping to increase the toxicity of Cry toxin:
Cry1Ab is moderately toxic to Spodoptera exigua. Domain III of Cry1Ab when
swapped with domain III of Cry1Ca increased the toxicity of Cry1Ab hybrid (Cry1Ab
having domain III of Cry1Ca) toxin against S.exigua (de Maagd et al., 1996).

Page | 19
1. 10. 6. Cry1A modified toxins:
Cry1A modified toxins have been created by removing the helix1 of domain I. Cry
modified toxins do not require interaction with cadherin to form oligomers. So they
bypass the cadherin receptor and bind directly to the GPI-anchored receptor and insert
into lipid micro domain where these GPI-anchored receptors are localised and pores in
the apical membrane of midgut cells are created (fig 4). This induces osmotic shock,
bursting of midgut cells and finally leads to the insect death. Cry1A modified toxins are
effective against those insects which are resistant to native Cry1A toxins and whose
mechanism of resistance is linked to mutation in cadherin gene (Bravo and Soberon,
2008; Soberon et al., 2009).
Fig 4: Diagrammatic representation of mode of action of modified Cry1A toxins (Soberon et al.,
2009).
1. 11. Esterases and Resistance:
Esterase has recently been proposed to be involved in Cry1Ac resistance in silver
selected strain of H. armigera. Cry1Ac-resistant H.armigera larvae showed higher
esterase activity than Cry1Ac susceptible larvae. Overproduced nonspecific esterases
which belong to a class of serine hydrolases and found in insect gut were proposed to
bind to and sequester Cry1Ac toxin (Gunning et al., 2005).
Nonspecific esterases have been involved in insecticide resistance in many insects
because these enzymes have the ability to hydrolyze insecticidal esters and have the
ability to sequester xenobiotics (Gunning et al., 2005).
Schizaphis graminum has developed resistance to organophosphate insecticides. The
resistance to organophosphate insecticide is associated with elevated esterase activity.

Page | 20
Two types of esterases TypeI and TypeII were involved in resistance mechanism in
S.graminum. Resistance is due to the increased levels of esterase because presence of
more esterase can bind to more insecticide molecules and sequester them (Ono et al.,
1999).
Overproduction of esterase is a common mechanism of resistance to organophosphate
insecticides in Culex pipiens. Esterase overproduction in Culex pipiens is either due to
gene regulation or due to gene amplification (Qiao et al., 1998; Rooker et al., 1996;
Guillemaud et al., 1996).
1. 12. Glutathione-s-transferase (GST) and resistance:
The glutathione-s-transferases are a large group of multifunctional enzyme involved in
the metabolism of wide range of xenobiotics including insecticides (Enayati et al.,
2005). Xenobiotic metabolism is the set of metabolic pathways which detoxify
xenobiotics (xenobiotic metabolism, wikipedia, online accessed on 24th
May2010).
GST catalyses the conjugation of reduced GSH and xenobiotics. It is a nucleophilic
addition reaction. Conjugation makes the product more water soluble and therefore it
can be readily excreted (Enayati et al., 2005).
Increased GST activity in insects has been associated with insecticide resistance. The
role of GST has been proved in many cases of organophosphate insecticide resistance.
GST detoxifies organophosphate via two distinct pathway: a) O-dealkylation b) O-
dearylation e.g. Plutella xylostella resistance to parathion and methyl parathion (Enayati
et al., 2005).
1. 13. General structure of GST:
GSTs are non allosteric enzymes. They are dimeric and have a molecular mass around
26 kDa.Each monomer has one active site and active sites function independently. Each
monomer has two distinct domains (domain I and domain II) linked by short hexamer
(Salinas and Wong, 1999).
Domain I consists of four stranded pleated sheet flanked by -helices. It has
“” motif. N-terminal end is present in this domain. The glutathione binding
site is also present in this domain. Domain II is larger than domain I. It contains five
amphipathic -helices. These helices are arranged in right handed spiral. C-terminus
and hydrophobic site (H-site) is present in this domain (Salinas and Wong, 1999).

Page | 21
1. 14. Mixed Fuction Oxidases (MFOs) and resistance:
MFOs are also known as P450 enzymes or Cytochrome P450 monooxygenases. P450s
are multifunctional enzymes. They play an important role in growth, development,
feeding, resistance to pesticide and tolerance to plant toxins in insects (Scott and Wen,
2001; Feyereisen, 1999).
P450- mediated detoxification is one of the most important mechanisms of resistance to
insecticides in many insects (Scott and Wen, 2001).
P450 enzymes modify the xenobiotics by incorporating an oxygen atom into a variety of
functional groups of xenobiotics which helps them prepare for rapid excretion (Terriere,
1984).
1. 15. Plutella xylostella:
Plutella xylostella is the most destructive pest of crucifers throughout the world
(excluding Europe).It is present from temperate to tropical region. It is generally
thought to have originated in the Mediterranean region but more recently it has been
suggested that Plutella xylostella originated in South Africa because of rich and diverse
fauna of Plutella xylostella parasitoids (Sayyed et al., 2002). Its extent of damage is
such that it sometimes causes more than 90% crop loss. It causes a loss of more than
one billion US dollars per year. In tropical and sub-tropical climate Plutella xylostella
can cause damage throughout the year except during the rainy season. Its larvae feed on
the plant parts which are above the ground thereby reducing the yield and quality of the
produce. Thus the marketability of the produce is significantly reduced (Sayyed et al.,
2002; Talekar and Shelton, 1993).
An absence of natural enemies especially parasitoids in many non indigenous areas, its
ability to migrate long distance and its ability to produce large numbers of offspring are
considered to be the major causes of the high pest status of Plutella xylostella in most
parts of the world(Sayyed et al., 2002).
Diamondback moths (Plutella xylostella) have become resistant to every insecticide
used extensively against them. Factors which help in the development of resistance in
Plutella xylostella are rapid turnover of insect generation, high fecundity and
reproductive potential, a long and continuous growing season, large area under crucifer
cultivation and frequent insecticide application. These are the reasons for widespread
insecticide resistance in South East Asia (Talekar and Shelton, 1993; Sayyed et al.,
Page | 22
2002).
Plutella xylostella has developed high levels of resistance to Bacillus thuingiensis (Bt)
in the open field. The first case of field resistance to Bt in Plutella xylostella was
reported from Hawaii. Populations from areas where Dipel (a product of Bt) was used at
higher levels showed less susceptibility to Bt than populations that had been treated at
lower levels. The highest level of resistance obtained from a population from a heavily
treated area was 30-fold. When laboratory selection of this population was done using
Dipel resistance increased rapidly to over 1000-fold. A diamondback moth colony (BL)
from Philippines which was exposed regularly to Dipel in field condition showed more
than 200-fold resistance to Cry1Ab. A Plutella xylostella colony (Loxa A) from Florida
showed more than 1500-fold resistance to Javelin (a commercial formulation of Btk
NRD12) in the second generation after the colony was collected from the field. Another
Plutella xylostella colony (SERD3) from Malaysia showed considerable levels of
resistance to Btk and Bta. This SERD3 population was reared for seven generations
without selection. It showed 330-fold resistance to Btk and 160-fold resistance to Bta.
Another Plutella xylostella colony (UNSEL-MEL) from Malaysia's Melaka region
showed field resistance to Btk products. It also showed resistance to Cry1Ac, Cry1Ab
and Bta. When they were Cry1Ac selected (1Ac SEL-MEL) it showed more than 95-
fold increase in resistance to this toxin during five generations but when they were
selected with Cry1Ab(1Ab SEL-MEL), Btk (Btk SEL-MEL) or Bta(Bta SEL-MEL)
they showed only tenfold or less increase in resistance to these toxins (Ferre and Van
Rie, 2002).
1. 16. Spinosad resistance in insects:
Plutella xylostella has developed resistance to spinosad (a biopesticide) at a very rapid
rate. Six of twelve field population of Plutella xylostella collected from Hawaii
showed high level of resistance towards spinosad (Baxter et al., 2010). Spinosad
resistance in Plutella xylostella has also been reported in the US, Thailand and Malaysia
(Sayyed et al., 2004 b; Baxter et al., 2010).
High level of resistance to spinosad has also been reported in field population of
Spodoptera exigua, Heliothis virescens and Musca domestica (Perry et al., 2007).
The active compounds of spinosad are macrocyclic lactones, spinosyn A and spinosyn
D. These compounds are produced by the actinomycetes Saccharopolyspora spinosa
during fermentation (Thompson et al., 2000; Baxter et al., 2010).
Page | 23
Spinosad affects the central nervous system of the insects. It primarily targets the
nicotinic acetylcholine receptor (nAChR) causing neuromuscular fatigue. Insects
experience tremors and paralysis and finally die (Salgado, 1998; Thompson et al., 2000;
Baxter et al., 2010).
nAChR consists of five subunits. These five subunits are arranged around a central
cation -permeable channel. Each subunit consists of four transmembrane regions (TM1-
TM4) and one extracellular N-terminal domain. TM2 region is located in the ion
channel and a large intracellular loop is present between TM3 and TM4 region.The
extra cellular N-terminal domain contains the Cys-loop and acetylcholine (ACh)
binding site. Cys-loop consists of two cysteine residues and 13 amino acid residues in
between the two cysteines. The ACh binding site has several distinct regions (loops A-
F) at subunit interfaces. Subunits that are essential for ACh binding are called alpha
subunits. Alpha subunits have two adjacent cysteines in loop C which is required for
ACh binding. The subunits which do not have two adjacent cysteine residues are known
as non alpha or beta, delta, epsilon or gamma subunits. For receptor function at least
two alpha subunits are required. Acetylcholine binds to the extracellular N-terminal
domain (Rinkevic and Scott, 2009; Baxter et al., 2010; Sattelle et al., 2005).
Twelve subunits of nAChR have been identified in Bombyx mori (Shao et al., 2007) and
Tribolium castaneum (Rinkevic and Scott, 2009). Eleven subunits have been identified
in Apis mellifera (Rinkevic and Scott, 2009) and 10 in Drosophila melanogaster
(Sattelle et al., 2005). Subunit diversity of nAChR in insects is due to alternate exon
splicing, exon exclusion or A-to-I pre-mRNA editing (Baxter et al., 2010; Grauso et al.,
2002).
Baxter et al. showed that field based resistance to spinopsad in a Plutella xylostella (Px)
strain collected from Pearl city, Hawaii is due to a point mutation in the ninth intron
splice junction of nAChR Px alpha6 gene ( Baxter et al., 2010).
Perry and his colleagues showed that deletion of D alpha 6 subunit of nAChR causes
high level of resistance to spinosad in Drosophila melanogaster without being lethal. D
alpha 6 strain of Drosophila melanogaster showed 1181 fold resistance to spinosad
(Perry et al., 2007).

Page | 24
1. 17. Aims
1. Mutations in the cadherin gene have been linked to Cry1Ac resistance in Heliothis
virescens, Pectinophora gossypiella and Helicoverpa armigera (Morin et al., 2003;
Gahan et al., 2001; Xu et al., 2005).
According to Soberon et al. deletion of helix α1 of domain I from Cry1A toxins leads
to the formation of oligomers without binding to the cadherin receptors. Thus these
modified toxins overcome resistance by bypassing the cadherin receptor binding. So the
Cry1A modified toxins are effective against those insects which are resistant to native
Cry1A toxins and whose mechanism of resistance is linked to mutation in the cadherin
gene (Soberon et al., 2007; Bravo and Soberon, 2008).
According to Baxter et al. resistance to Cry1A toxins in two strains of Plutella
xylostella, SC1 and NOQA, were not linked to mutations in the cadherin gene (Baxter et
al., 2005; Baxter et al., 2008).
So it was decided to make Cry1Ac modified toxin and check whether it is effective or
not against Plutella xylostella NOQA population whose resistance mechanism has not
been linked to the Cadherin gene.
2. Baxter and his colleagues showed that field based resistance to spinosad in a Plutella
xylostella strain collected from Pearl city, Hawaii is due to the point mutation in the
ninth intron splice junction of nAChR Pxα6 ( Baxter et al., 2010).
Hence it was decided to check whether or not other spinosad resistant lepidopteran
insects have similar mechanism of resistance (i.e. splice-site mutation) as Plutella
xylostella Pearl population.
For this reason it was decided to work on spinosad resistant Spodoptera litura
population collected from the fields of Pakistan.
It was also decided to check whether Plutella xylostella NOQA population has the same
mechanism of resistance as Plutella xylostella Pearl City population. NOQA population
is resistant to Cry1Ac but whether this population is resistant to spinosad is not known.
Page | 25
Chapter 2
Materials and methods
2. 1. Bacterial strains
2. 1.1. E.coli
2. 1. 1. 1. JM 109
Genotype: endA1 glnV44 thi-1 relA1 gyrA96 recA1 mcrB+ Δ(lac-proAB) e14- [F'
traD36 proAB+ lacI
q lacZΔM15] hsdR17(rK
-mK
+).
2. 1. 1. 2. DH5α
Genotype: F- endA1 glnV44 thi-1 recA1 relA1 gyrA96 deoR nupG Φ80dlacZΔM15
Δ(lacZYA-argF)U169, hsdR17(rK- mK
+), λ– .
2. 1. 1. 3. BL21
Genotype: E. coli B F- dcm ompT hsdS(rB- mB-) gal [malB+]K-12(λ
S).
2. 1. 2. B.thuringiensis
2. 1. 2. 1. 78/11
Acrystalliferous strain of Bacillus thuringiensis subsp israelensis.
2. 2. Plasmids
pSV2: E.coli-Bt shuttle vector, pSVP27A: E.coli-Bt expression vector, pGEM-T easy
vector by Promega.
2. 2. 1. Recombinant Plasmids
pGEM 1Ac, pGEM 1AcD(2-50): given to me by Dr.Neil Crickmore.
2. 3. Plutella xylostella strain
2. 3. 1. NOQA: Cry 1Ac resistant population.

Page | 26
2. 4. Culture media
2. 4. 1. LB (Luria-Bertani) media:
Tryptone: 10 g; Yeast Extract: 5 g; NaCl: 10 g; Water: to 1 L.
The pH was adjusted to 7.5 with 5M NaOH.
2. 4. 2. LB- agarose plates: 15 g/l agar added to Luria-Bertani media
2. 5. Polymerase chain reaction to create modified Cry1Ac toxin:
PCR was used to create modified Cry1Ac toxin using Pfu Ultra 6 Kb program (table 1).
Cycle Number of Cycles Temperature Time
Initial Denaturation 1 950C
2 minutes
Denaturation+
Annealing+Extension
30 950C
550C
720C
30 seconds
30 seconds
6 minutes
Final extension 1 720C
10 minutes
Table 1: Pfu ultra 6kb program
The forward primer was designed to anneal from 57th
amino acid residue position and
reverse primer was designed to anneal from start codon.
Forward Primer: 5’GTGTTAGGACTAGTTGATATAATATGGG 3
’
Reverse Primer: 5’ CATAAGTTACCTCCATCTCTTTTATTAAG 3
’
The reaction mixture was introduced into the PCR machine which included Primers
(forward primer 0.5 µl of 100 pmol/µl, reverse primer 0.5 µl of 100 pmol/µl), pGEM
1Ac as template DNA 5 µl, water 19 µl and Agilent’s Pfu ultra II hotstart 2X master
mix 25µl.
After the PCR, PCR product was run on 1% agarose gel (0.3 g of agarose in 30 ml of
TBE buffer). The mixture was heated until the agarose dissolved. The solution was
allowed to cool but not allowed to set. 0.5 µl of gel-red (fluorescent nucleic acid gel
stain) was added to the solution and allowed to solidify, with gel comb inserted to create
wells.

Page | 27
10 X TBE contains Tris 108 g, Boric acid 55 g, EDTA 7.44 g and Water up to 1 L.
2. 6. Purification of PCR product from the gel
Purification of PCR product from the gel was performed using Qiagen kit. The PCR
product was run on 1% agarose gel and the required band was excised from the gel and
added to eppendorf tube. Then, 600 µl of solubilisation buffer, QG was added into the
eppendorf to dissolve the excised agarose gel. The tube was incubated at 600C until the
excised agarose gel was completely dissolved, occasionally mixing the tube by
inverting it. 200 µl of isopropanol was added to the tube and mixed by inverting the
tube several times. The solution was then transferred to the column and centrifuged at
14 k for 1 minute in eppendorf centrifuge 5418. The flow-through was discarded and
500 µl of solubilisation buffer was added to the column and was centrifuged for 1
minute. The flow-through was discarded and after that 750 µl of wash buffer PE was
added to the column and centrifuged for 1 minute. The flow-through was discarded and
another 1 min spin was given to the column. The column was placed into a clean
eppendorf tube. 15 µl of elution buffer EB was added to the column and was left to
stand for 1 min and then centrifuged for 1 min. 5 µl of sample was run on 1% agarose
gel.
2. 7. Ligation of Purified PCR product
For ligation to occur purified PCR product- 4 µl, ligation buffer- 5µl, ligase enzyme (T4
DNA ligase)- 1µl was added to a tube and kept at room temperature for 4 hours and
then at 40C for overnight.
2. 8. Transformation in E.coli
The ligated product was to be introduced into E.coli JM 109, BL21 and DH5α strain. So
JM 109, BL21 and DH5α were inoculated in 100 ml of LB- broth separately and grown
till optical density of 0.4-0.8. The broth containing JM 109, BL21 and DH5α were
poured into three different centrifuge tubes under sterile conditions and centrifuged
using rotor SLA 1500 (10k for 10 min). Pellets obtained were washed in 100 ml of cold
sterile water and again centrifuged using the same program. Supernatants were poured
off and pellets obtained were washed in 1 ml of cold sterile water. The JM109, BL21
and DH5α cells were then transferred to three different eppendorf tubes and were
centrifuged at 14k for 1 minute in eppendorf centrifuge 5418. Pellets were resuspended
Page | 28
in 200 µl of cold sterile water. 2 mm cuvettes were cooled on ice before use. 50 µl of
cells were transferred to small eppendorf tubes and 1 µl of ligated PCR product were
added to these tubes and were mixed. The following settings were applied to the
genepulser (Biorad): 1.8 KV, 200 Ohms, 25 µF. The cuvette containing the cells and
ligated PCR product (DNA) was placed in the genepulser and the two red buttons on
genepulser were simultaneously pressed until a beep was heard. A sterile Pasture pipette
was used to wash the cells out of the cuvette with 0.5-1 ml LB. The cells were
incubated at 370C for 1 hour and plated on the agar plates containing ampicillin
(100µg/ml). Plates were incubated overnight at 370C. Some of the colonies were picked
up and streaked onto another agar plate containing ampicillin.
2. 9. Miniprep of transformed E.coli cells
Miniprep is performed to elute the plasmid from the bacteria.
Miniprep was performed using Qiagen’s QIAprep spin miniprep kit. The colonies were
scraped off from the plate and suspended in 250 µl of Buffer P1 in eppendorf tubes.
Then they were vortexed. After that 250 µl of Buffer P2 was added to each eppendorf
tube and was mixed throroughly by inverting the tube 8-10 times without vortexing. A
volume of 350 µl of Buffer N3 was added to each tube and was mixed thoroughly
without vortexing. The tubes were centrifuged at 14k rpm for 10 minutes; the
supernatants obtained were taken into Q1Aprep spin columns and centrifuged for 1
minute. The flow-throughs were discarded. Spin columns were washed with 0.5 ml of
Buffer PB and centrifuged for 1 min. The flow-throughs were discarded. After that spin
columns were washed with 0.75 ml of Buffer PE and centrifuged for 1 minute. The
flow-throughs were discarded and columns were centrifuged for additional 1 minute to
remove any residual wash buffer. The spin columns were then placed in clean 1.5 ml
eppendorf tubes and 50 µl of elution buffer EB was added to the each column. The
tubes were left to stand for 1 minute and centrifuged for 1 minute at 14k rpm.
2. 10. Ligation of pSV2 and pSVP27A with Cry1AcD (1-56) and Cry1AcD (2-50)
For ligation to occur Cry1AcD (1-56)- 3 µl,SV2- 2 µl Ligation Buffer- 4µl, Ligase
enzyme (T4 DNA ligase)- 1µl ; Cry1AcD(2-50)- 3 µl,SV2- 2 µl Ligation Buffer- 4µl,
Ligase enzyme (T4 DNA ligase)- 1µl; Cry1AcD (1-56)- 3 µl, pSVP27A- 2 µl Ligation
Buffer- 4µl, Ligase enzyme (T4 DNA ligase)- 1µl; Cry1AcD (2-50)- 3 µl, pSVP27A- 2
µl Ligation Buffer- 4µl, Ligase enzyme (T4 DNA ligase)- 1µl were added to the tubes

Page | 29
and kept at room temperature for 4 hours and then at 40C for overnight.
2. 11. Transformation in Bacillus thuringiensis (Bt)
The ligated product was to be introduced into Bt 78/11 and HD73 strain. So 78/11 and
HD73 were inoculated in 100 ml of LB- broth separately and grown at 300C till optical
density of 0.4-0.8. The rest of the steps followed were similar to the transformation in
E.coli.
2. 12. Miniprep of transformed Bacillus thuringiensis cells
Colonies were scraped off from the chloramphenicol containing agar plates and
resuspended in 250 µl of P1 buffer containing 10 mg/ml lysozyme and were incubated
in water bath at 370C for 30 minutes to 1 hour and the rest of the procedures were
similar to the E.coli miniprep.
2. 13. Rapid size screen
30 µl of the rapid size screen solution (pre-warm) was added to each of the eppendorf
tube. Individual bacterial colonies were picked by sterile toothpicks and were
resuspended in the solution. The tubes were incubated in water bath at 370C for 5
minutes followed by incubation on ice for 5 minutes. The samples were spun at 14k rpm
for 5 minutes. 15 µl was loaded onto a 1% agarose gel.
Rapid size screen solution consists of:
Water 6.5 ml
EDTA 100 µl (500 mM)
Sucrose 1 g (30%)
SDS 150 µl (10%)
NaOH 2.5 ml (0.5 M)
KCl 600 µl (1.4 M)
Bromophenol Blue to colour the solution.
2. 14. Restriction digest
Restriction digest was done to digest the DNA obtained after miniprep. Restriction
digests were performed by using different restriction enzymes according to the
requirement of the experiments. The constituents of restriction digest included water,
DNA to be digested, digest buffer and required restriction enzymes. The volume of

Page | 30
buffer and restriction enzymes used were 1 µl and 0.2 to 0.5 µl respectively. Water
volume depended on volume of DNA used and number and volume of enzymes used.
Buffer 1-4 to be used depended on the activity of the enzyme in that particular buffer
(as described by NEB). The total digest volume was made up to 10 µl and incubated at
described temperature for 1 hour. After incubation the total volume was run on 1%
agarose gel.
2. 15. Harvesting of protein from E.coli
500 ml of LB media containing ampicillin was inoculated with transformed colonies of
JM109, BL21 and DH5α i.e. all the transformed strains of E.coli were inoculated
separately in 500 ml of LB media containing ampicillin were incubated in incubator
shaker at desired temperatures for 2-3 days. After that they were transferred to
centrifuge bottles of 1 L. The volumes were made up to 1 L by adding sterile water. The
tubes were centrifuged at 6.5k for 10 minutes at 40C in a JLA 8.100 rotor. The
supernatants were removed and 30 ml of sterile water was added to each centrifuge
flask to resuspend the pellets. The samples were transferred to tubes of 100 ml volume
for sonication. Sonication was done to cells for 4 minutes (with a gap of 1 minute after
every 1 minute of sonication). After sonication the samples were transferred to 100 ml
centrifuge tubes and centrifuged at 12k for 15 minutes in a SS34 rotor. The supernatants
were removed and 5-10 ml of sterile water was added to each tube to resuspend the
pellet. The protein harvested was stored in cold room.
2. 16. Harvesting of protein from Bacillus thuringiensis
Transformed colonies of Bacillus thuringiensis (78/11) were plated on chloramphenicol
containing agar plates and incubated at 300C for 2-3 days. After that colonies were
scraped off from the plates and resuspended in 30 ml sterile water. Sonication was done
to the cells for 4 minutes (with a gap of 1 minute after every 1 minute of sonication) rest
of the steps was similar to harvesting of protein from E.coli.
2. 17. Preparation of SDS gel
All the protein studies were done using SDS-PAGE. Two glass plates and comb were
cleaned with ethanol and dried thoroughly before assembly. 1% agarose solution was
used to seal the bottom of the plates to prevent any leakage. The gels were made up of a
resolving gel (7.5% acrylamide) and a stacking gel. The resolving gel solution consists

Page | 31
of:
Water 2 ml
RGB 1 ml
Acrylamide (30%) 1 ml
400mg/ml APS 8 µl
TEMED 4 µl
TEMED and APS were added last because they are the polymerisation agent. The
resolving gel solution was poured between the plates. 120 µl of water saturated butanol
was added on top of the resolving to prevent oxygen from reaching the solution. The gel
was left to set for 20-25 minutes. After the gel was set butanol was washed off and the
stacking gel was poured on top of the resolving gel and the comb was inserted
immediately.
Stacking gel solution consists of:
Water 1 ml
SGB 500 µl
Acrylamide (30%) 333 µl
400mg/ml APS 4 µl
TEMED 2 µl
The gel was left to set for 30 minutes.
RGB: Tris 18.18g
SDS 0.4 g
Water up to 100 ml
pH 8.8
SGB: Tris 6.06 g
SDS 0.4 g
Water up to 100 ml
pH 6.8
2. 17. 1. Sample preparation for SDS-PAGE
Sample 5 µl
Loading buffer
+ 2 mercaptoethanol 5 µl
The samples were boiled for 5 minutes and a quick spin was given to the samples and
the samples were loaded on the gel.
Page | 32
Loading Buffer: SDS 2 g
EDTA 6 mg
BPB dye 20 mg
RGB 5 ml
Glycerol 50 ml
Water up to 100 ml
2. 17. 2. Running and developing of gel
The gel was run at 200 V for 30 minutes. After that gel was stained for 25 minutes and
then destained for 25 minutes.
SDS running buffer (10 X): Tris 7.6 g
Glycine 36 g
SDS 2.5 g
Water up to 250 ml
Stain: Methanol 250 ml
Water 225 ml
Acetic acid 25 ml
Coomassie blue 1.25 g
Destain: Methanol 250 ml
Water 225 ml
Acetic acid 25 ml
2. 18. Solubilisation and Trypsin activation
Solubilisation was done using Na2CO3 buffer of pH 10.9 and 10 mM DTT. A desired
volume of Cry1AcD (1-56) and Cry1AcD (2-50) and Cry1Ac wild type were
centrifuged for 5 minutes. The supernatant was removed and same amount of carbonate
buffer with DTT was added on to the pellet. The tubes were incubated in water bath for
1 hour at 370C. After incubation 5 µl of samples were taken out (total solubilised
sample) and the rest of the samples were centrifuged for 10 minutes at 14k. After that 5
µl of supernatants were taken out (supernatant solubilised sample). The total solubilised
samples (5µl) and supernatant solubilised samples (5µl) along with loading buffer (5µl)
were loaded on 7.5% SDS gel.
For trypsin activation Na2CO3 buffer pH 9.5 and 2 mg/ml trypsin was used. A desired
volume of Cry1AcD (1-56) and Cry1AcD (2-50) and Cry1Ac wild type were

Page | 33
centrifuged for 5 minutes. The supernatant was removed and same amount of carbonate
buffer with trypsin was added on to the pellet. The tubes were incubated in water bath
for 1 hour at 370C. After incubation 5 µl of samples were taken out (total trypsinised
sample) and the rest of the samples were centrifuged for 10 minutes at 14k. After that 5
µl of supernatants were taken out (supernatant trypsinised sample). The total trypsinised
samples (5µl) and supernatant trypsinised samples (5µl) along with loading buffer (5µl)
were loaded on 7.5% SDS gel.
2. 19. Gel comparison of Cry1AcD (1-56) and Cry1AcD (2-50) with Cry1Ac wild
type.
4 mg/ml concentration of Cry1Ac wild type was diluted to the concentrations of 0.2
mg/ml and 0.1 mg/ml. These two concentrations of Cry1Ac wild type along with
Cry1AcD (1-56) and Cry1AcD (2-50) whose concentrations were unknown, were run
on 7.5% SDS gel. This was done to estimate the concentration of Cry1AcD (1-56) and
Cry1AcD (2-50).
2. 20. Leaf dip Bioassay
Leaf dip bioassay was performed according to the Sayyed et al. paper (Sayyed et al.,
2000). The leaf discs were cut out from the Chinese cabbage leaves and were dipped in
120 µg/ml of Cry1Ac wild type (positive control), 120 µg/ml of Cry1AcD (1-56), 120
µg/ml of Cry1AcD (2-50) and control ( water+ triton).The leaf discs were allowed to
dry at ambient temperature. Leaf discs were then placed in petri dishes containing filter
paper moistened with water. Ten late second instar larvae were put in each petri dish
and they were kept at 250C. In total five replications were used. Mortality was
calculated after 5 days.
2. 21. Extraction of genomic DNA from Plutella xylostella NOQA population
Genomic DNA of NOQA was extracted using extraction buffer (50 mM Tris-HCl, pH
8, containing 2% SDS, 0.75M NaCl, 10 mM EDTA and 100 µg/ml proteinase K. Each
larva was mashed up in the extraction buffer. The samples were incubated at 650C for
30 minutes. Larval homogenates were then deproteinised with phenol: chloroform:
isoamyl alcohol (25:24:1). The deproteinisation step was repeated twice. After
deproteinisation the samples were centrifuged at 10k for 5 minutes. Nucleic acid was
precipitated by adding cold isopropanol and incubated at -200C for 2 hours. Extraction

Page | 34
buffer, phenol: chloroform: isoamyl alcohol (25:24:1) and isopropanol were used in
same amount. After incubation at -200C for 2 hours the samples were centrifuged at 14k
for 30 minutes. The supernatants were removed and the pellets were vaccum dried for
for 15 minutes. The pellets were resuspended in 200 µl TE (10 mM Tris-HCl, pH 8,
1mM EDTA) and incubated with RNAseA (100µg/ml) for 30 min in water bath at
370C. The integrity and purity of DNA samples were checked on 1% agarose gel
(Waldschmidt et al., 1997).
2. 22. Extraction of genomic DNA from Spodoptera litura
Extraction of genomic DNA from Spodoptera litura was done using Qiagen’s DNeasy
Blood and Tissue kit. Extraction of genomic DNA was performed as per the instruction
of manufacturer’s handbook (DNeasy Blood and Tissue handbook).
2. 23. PCR to amplify ninth intron splice junction of nAChR
PCR was performed using new high fidelity program (table 2) to amplify ninth intron
splice junction of nAChR.
Cycle Number of cycles Temperature Time
Initial denaturation 1 940C 2 min
Denaturation+Annealing
+ Extension
10
20
940C
500- 55
0 C
680 C
940 C
500- 55
0 C
680 C
10 sec
1 min 10 sec
2 min 30 sec
15 sec
30 sec
2 min 30 sec
Final extension 1 720 C 7 min
Table 2: New High Fidelity Program.
Forward Primer Exon 9: 5’ GCATCATGTTCATGGTGGCG 3’
Reverse Primer Intron 9: 5’ CCCGATAATCGTCGGAATTTG 3’
The reaction mixture was introduced into the PCR machine which included Primers
(forward primer 0.5 µl of 100 pmol/µl, reverse primer 0.5 µl of 100 pmol/µl), genomic
DNA as template DNA 5 µl, water 19 µl and Roche’s new high fidelity master mix 25

Page | 35
µl.
2. 24. Ligation of purified PCR product with pGEM-T easy vector
For ligation to occur Purified PCR product- 3 µl, pGEM-T easy vector- 1 µl, Ligation
Buffer- 5µl and Ligase enzyme (T4 DNA ligase)- 1µl was added to a tube and kept at
room temperature for 4 hours and then at 40C for overnight.
Page | 36
Chapter 3
Creating modified Cry1Ac and checking its effectiveness against Plutella xylostella
NOQA population.
3. 1. Introduction
Mutation in cadherin gene has been linked to Cry1Ac resistance in Heliothis virescens,
Pectinophora gossypiella and Helicoverpa armigera (Morin et al., 2003; Gahan et al.,
2001; Xu et al., 2005).
According to Soberon et.al, deletion of helix α1 of domain I from Cry1A toxins leads
to the formation of oligomers without binding to the cadherin receptors. Thus these
modified toxins overcome resistance by bypassing the cadherin receptor binding. So the
Cry1A modified toxins are effective against those insects which are resistant to native
Cry1A toxins and whose mechanism of resistance is linked to mutation in cadherin gene
(Soberon et al., 2007; Bravo and Soberon, 2008).
According to Baxter et.al resistance to Cry1A toxins in two strains of Plutella xylostella
SC1 and NOQA were not linked to mutation in the cadherin gene (Baxter et al., 2005;
Baxter et al., 2008).
So it was decided to make Cry1Ac modified toxin and check whether it is effective or
not against Plutella xylostella NOQA population whose resistance mechanism has not
been linked to the cadherin gene.
Three dimensional structure of Cry1Ac has not yet been determined by X-ray
crystallography. Cry1Ac amino acid sequence is very similar to the Cry1Aa amino acid
sequence. Three dimensional structure of activated Cry1Aa toxin has been determined
by X-ray crystallography (Grochulski et al., 1995). Domain I of Cry1Aa and Cry1Ac
are identical except at 148th
(Cry1Aa and Cry1Ac alignment result) and 248th
(Masson et
al., 1994; Cry1Aa and Cry1Ac alignment result) position.
So it was decided to align Cry1Aa and Cry1Ac (fig 5) to predict the α-helices of domain
I and β strands of domain II and domain III of Cry1Ac.
α1 α2a
Cry1Aa MDNNPNINECIPYNCLSNPEVEVLGGERIETGYTPIDISLSLTQFLLSEFVPGAGFVLGL 60
Cry1Ac MDNNPNINECIPYNCLSNPEVEVLGGERIETGYTPIDISLSLTQFLLSEFVPGAGFVLGL 60
************************************************************
α2b α3
Cry1Aa VDIIWGIFGPSQWDAFLVQIEQLINQRIEEFARNQAISRLEGLSNLYQIYAESFREWEAD 120
Cry1Ac VDIIWGIFGPSQWDAFLVQIEQLINQRIEEFARNQAISRLEGLSNLYQIYAESFREWEAD 120
************************************************************
α4 α5
Cry1Aa PTNPALREEMRIQFNDMNSALTTAIPLLAVQNYQVPLLSVYVQAANLHLSVLRDVSVFGQ 180
Cry1Ac PTNPALREEMRIQFNDMNSALTTAIPLFAVQNYQVPLLSVYVQAANLHLSVLRDVSVFGQ 180
Page | 37
***************************:********************************
α6 α7
Cry1Aa RWGFDAATINSRYNDLTRLIGNYTDYAVRWYNTGLERVWGPDSRDWVRYNQFRRELTLTV 240
Cry1Ac RWGFDAATINSRYNDLTRLIGNYTDYAVRWYNTGLERVWGPDSRDWVRYNQFRRELTLTV 240
************************************************************
β1a β1b α8a α8 β2
Cry1Aa LDIVALFSNYDSRRYPIRTVSQLTREIYTNPVLENFDGSFRGMAQRIEQNIRQPHLMDIL 300
Cry1Ac LDIVALFPNYDSRRYPIRTVSQLTREIYTNPVLENFDGSFRGSAQGIERSIRSPHLMDIL 300
*******.********************************** ** **:.**.*******
β3r β3 β4 β5 β6
Cry1Aa NSITIYTDVHRGFNYWSGHQITASPVGFSGPEFAFPLFGNAGNAAPP-VLVSLTGLGIFR 359
Cry1Ac NSITIYTDAHRGYYYWSGHQIMASPVGFSGPEFTFPLYGTMGNAAPQQRIVAQLGQGVYR 360
********.***: ******* ***********:***:*. ***** :*: * *::*
β7r β7 β8 β9
Cry1Aa TLSSPLYRRIILGSGPNNQELFVLDGTEFSFASLTTNLPSTIYRQRGTVDSLDVIPPQDN 419
Cry1Ac TLSSTLYRRPFN-IGINNQQLSVLDGTEFAYG-TSSNLPSAVYRKSGTVDSLDEIPPQNN 418
****.**** : * ***:* *******::. ::****::**: ******* ****:*
β10 β11 β12 β13
Cry1Aa SVPPRAGFSHRLSHVTMLSQAAG--AVYTLRAPTFSWQHRSAEFNNIIPSSQVTQIPLTK 477
Cry1Ac NVPPRQGFSHRLSHVSMFRSGFSNSSVSIIRAPMFSWIHRSAEFNNIIASDSITQIPAVK 478
.**** *********:*: .. . :* :*** *** **********.*..:**** .*
β13b β14 β15 β16 β17
Cry1Aa STNLGSGTSVVKGPGFTGGDILRRTSPGQISTLRVNITAPL-----SQRYRVRIRYASTT 532
Cry1Ac GNFLFNG-SVISGPGFTGGDLVRLNSSGNNIQNRGYIEVPIHFPSTSTRYRVRVRYASVT 537
.. * .* **:.********::* .*.*: * * .*: * *****:****.*
β18 β19 β20 β21 β22
Cry1Aa NLQFHTSIDGRPINQGNFSATMCSGSNLQSGSFRTVGFTTPFNFPNGSSVFTLSAHVFNS 592
Cry1Ac PIHLNVNWGNSSIFSNTVPATATSLDNLQSSDFGYFESANAFTSSLGN---IVGVRNFSG 594
::::.. .. .* .....** * .****..* . :..*. . *. :..: *..
β23
Cry1Aa GNEVYIDRIEFVPAEVTFEAEYDLERAQKAVNELFTSSNQIGLKTDVTDYHIDQVSNLVE 652
Cry1Ac TAGVIIDRFEFIPVTATLEAEYNLERAQKAVNALFTSTNQLGLKTNVTDYHIDQVSNLVT 654
* ***:**:*. .*:****:********* ****:**:****:*************
Cry1Aa CLSDEFCLDEKQELSEKVKHAKRLSDERNLLQDPNFRGINRQLDRGWRGSTDITIQGGDD 712
Cry1Ac YLSDEFCLDEKRELSEKVKHAKRLSDERNLLQDSNFKDINRQPERGWGGSTGITIQGGDD 714
**********:*********************.**:.**** :*** ***.********
Cry1Aa VFKENYVTLLGTFDECYPTYLYQKIDESKLKAYTRYQLRGYIEDSQDLEIYLIRYNAKHE 772
Cry1Ac VFKENYVTLSGTFDECYPTYLYQKIDESKLKAFTRYQLRGYIEDSQDLEIYLIRYNAKHE 774
********* **********************:***************************
Cry1Aa TVNVPGTGSLWPLSAQSPIGKCGEPNRCAPHLEWNPDLDCSCRDEGKCAHHSHHFSLDID 832
Cry1Ac TVNVPGTGSLWPLSAQSPIGKCGEPNRCAPHLEWNPDLDCSCRDGEKCAHHSHHFSLDID 834
******************************************** **************
Cry1Aa VGCTDLNEDLGVWVIFKIKTQDGHARLGNLEFLEEKPLVGEALARVKRAEKKWRDKREKL 892
Cry1Ac VGCTDLNEDLGVWVIFKIKTQDGHARLGNLEFLEEKPLVGEALARVKRAEKKWRDKREKL 894
************************************************************
Cry1Aa EWETNIVYKEAKESVDALFVNSQYDRLQADTNIAMIHAADKRVHSIREAYLPELSVIPGV 952
Cry1Ac EWETNIVYKEAKESVDALFVNSQYDQLQADTNIAMIHAADKRVHSIREAYLPELSVIPGV 954
*************************:**********************************
Cry1Aa NAAIFEELEGRIFTAFSLYDARNVIKNGDFNNGLSCWNVKGHVDVEEQNNHRSVLVVPEW 1012
Cry1Ac NAAIFEELEGRIFTAFSLYDARNVIKNGDFNNGLSCWNVKGHVDVEEQNNQRSVLVVPEW 1014
**************************************************:*********
Cry1Aa EAEVSQEVRVCPGRGYILRVTAYKEGYGEGCVTIHEIENNTDELKFSNCVEEEVYPNNTV 1072
Cry1Ac EAEVSQEVRVCPGRGYILRVTAYKEGYGEGCVTIHEIENNTDELKFSNCVEEEIYPNNTV 1074
*****************************************************:******
Page | 38
Cry1Aa TCNDYTATQEEYEGTYTSRNRGYDGAYESNSSVPADYASAYEEKAYTDGRRDNPCESNRG 1132
Cry1Ac TCNDYTVNQEEYGGAYTSRNRGYN----EAPSVPADYASVYEEKSYTDGRRENPCEFNRG 1130
******..**** *:********: . .********.****:******:**** ***
Cry1Aa YGDYTPLPAGYVTKELEYFPETDKVWIEIGETEGTFIVDSVELLLMEE 1180
Cry1Ac YRDYTPLPVGYVTKELEYFPETDKVWIEIGETEGTFIVDSVELLLMEE 1178
* ******.***************************************
Fig 5: Amino acid sequence alignment of Cry1Aa and Cry1Ac. Amino acid residues highlighted
in yellow represent α helices of domain I; amino acid residues highlighted in bright green
represent α8a, α8 and β-strands of domain II; amino acid residues highlighted in turquoise
represent β-strands of domain III.
A previous student had made deletion from 2nd
amino acid position to 50th
(phenylalanine) amino acid position from Cry1Ac gene removing the helix-α1.
But we later found out that modified Cry1Ac toxin made by Soberon et al. lacked 56
amino acid residues from N-terminus i.e. from 1st to 56
th (phenylalanine) position
(Franklin et al., 2009; Soberon et al., 2007).
So it was decided to delete the amino acid residues from 2nd
to 56th
position.
Around 60 amino acid residues, which include helix-α1, from the amino terminus of
Cry1Ac are protease susceptible i.e. they are cleaved by protease (Aronson et al., 1999).
3. 2. Use of Polymerase chain reaction to create Cry1Ac modified toxin
The primers were designed by keeping the above criteria in mind. The forward primer
was designed to anneal from 57th
amino acid residue position and reverse primer was
designed to bind from start codon. This was done to obtain the desired deletion.
Forward Primer: 5’GTGTTAGGACTAGTTGATATAATATGGG 3
’
Reverse Primer: 5’ CATAAGTTACCTCCATCTCTTTTATTAAG 3
’
Polymerase chain reaction was performed to obtain the desired deletion. The reaction
mixture which included designed primers, template DNA, master mix and water was
introduced into the PCR machine and amplified using Pfu ultra 6kb program (as
described in methods 2. 5). pGEM1Ac was used as template.
The size of pGEM1Ac is 7103 base pairs (bp). Following the deletion of amino acid
residues from 2nd
to 56th
position, the estimated size of the PCR product should be 6938
bp. 1µl of PCR product was run on 1% agarose gel. A very prominent band was
observed around 8Kb (fig 6) and two very faint bands were observed at 4Kb and 3Kb.

Page | 39
L1 L2
Fig 6: PCR products of Pfu ultra 6kb program. L1= 1kb Marker (sizes of 1 kb Marker bands are
0.5 kb, 1 kb, 1.5 kb, 2 kb, 3 kb (brightest band), 4 kb, 5 kb, 6 kb, 8 kb and 10 kb respectively
from bottom to top on agarose gel); L2= PCR products. Arrow is showing PCR product of
around 8 kb which was excised from the gel and purified.
3. 3. Purification of PCR product
As the PCR product obtained was not clean so it was decided to run the PCR product on
1% agarose gel. The band around 8Kb was excised from the gel and purified (as
described in methods 2. 6). 5µl of purified product was run on 1% agarose gel along
with 1Kb marker. A band of around 8Kb was observed (fig 7).
3 kb
Page | 40
L1 L2
Fig 7: Purified PCR product. L1= 1 kb Marker(sizes of 1 kb Marker bands are 0.5 kb, 1 kb, 1.5
kb, 2 kb, 3 kb (brightest band), 4 kb, 5 kb, 6 kb, 8 kb and 10 kb respectively from bottom to top
on agarose gel); L2= PCR product purified from the gel.
3. 4. Ligation of purified PCR product
Ligation (as described in methods 2. 7) was performed to ligate the ends of purified
PCR product. This purified PCR product (pGEM 1Ac) should contain deletion so it was
named pGEM 1AcD.
3. 5. Transformation of E.coli JM109 with pGEM 1AcD and mini-prep of pGEM
1AcD
E.coli JM109 strain was transformed with ligation mix which contained pGEM 1AcD
(as described in methods 2. 8) and grown on agar plate containing ampicillin. Only 4
colonies grew on the plate. 3 colonies were picked up from the plate and miniprep was
performed (as described in methods 2. 9) to elute pGEM 1AcD from E.coli JM109
strain.
3. 6. Restriction digest to verify whether deletion has taken place or not
To check whether deletion has taken place or not restriction digest was performed on
minipreped colonies 1, 2, 3 and pGEM 1Ac using HaeIII enzyme. HaeIII restriction
enzyme cuts pGEM1Ac and pGEM1AcD 19 times. There is only one difference. In
Cry1Ac one of the fragments is 1193 bp while it is 1028 bp in Cry1AcD. Rest of the
8 kb
3 kb
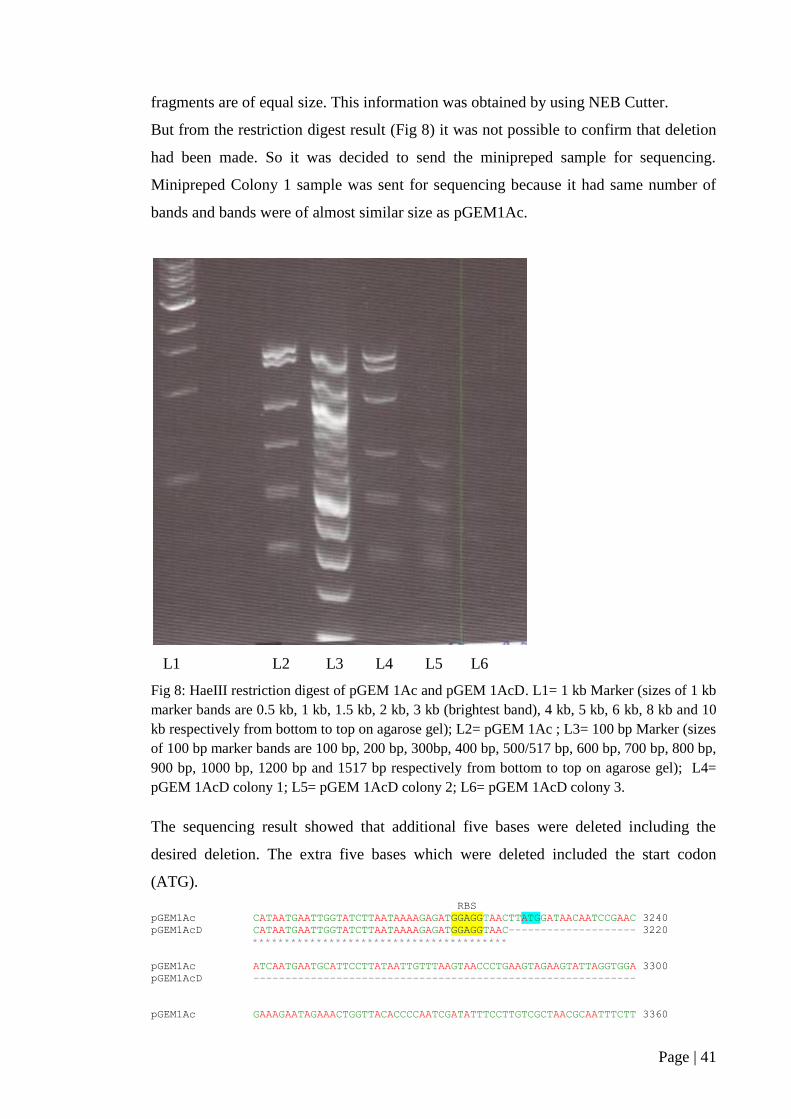
Page | 41
fragments are of equal size. This information was obtained by using NEB Cutter.
But from the restriction digest result (Fig 8) it was not possible to confirm that deletion
had been made. So it was decided to send the minipreped sample for sequencing.
Minipreped Colony 1 sample was sent for sequencing because it had same number of
bands and bands were of almost similar size as pGEM1Ac.
L1 L2 L3 L4 L5 L6
Fig 8: HaeIII restriction digest of pGEM 1Ac and pGEM 1AcD. L1= 1 kb Marker (sizes of 1 kb
marker bands are 0.5 kb, 1 kb, 1.5 kb, 2 kb, 3 kb (brightest band), 4 kb, 5 kb, 6 kb, 8 kb and 10
kb respectively from bottom to top on agarose gel); L2= pGEM 1Ac ; L3= 100 bp Marker (sizes
of 100 bp marker bands are 100 bp, 200 bp, 300bp, 400 bp, 500/517 bp, 600 bp, 700 bp, 800 bp,
900 bp, 1000 bp, 1200 bp and 1517 bp respectively from bottom to top on agarose gel); L4=
pGEM 1AcD colony 1; L5= pGEM 1AcD colony 2; L6= pGEM 1AcD colony 3.
The sequencing result showed that additional five bases were deleted including the
desired deletion. The extra five bases which were deleted included the start codon
(ATG).
RBS
pGEM1Ac CATAATGAATTGGTATCTTAATAAAAGAGATGGAGGTAACTTATGGATAACAATCCGAAC 3240
pGEM1AcD CATAATGAATTGGTATCTTAATAAAAGAGATGGAGGTAAC-------------------- 3220
****************************************
pGEM1Ac ATCAATGAATGCATTCCTTATAATTGTTTAAGTAACCCTGAAGTAGAAGTATTAGGTGGA 3300
pGEM1AcD ------------------------------------------------------------
pGEM1Ac GAAAGAATAGAAACTGGTTACACCCCAATCGATATTTCCTTGTCGCTAACGCAATTTCTT 3360

Page | 42
pGEM1AcD ------------------------------------------------------------
pGEM1Ac TTGAGTGAATTTGTTCCCGGTGCTGGATTTGTGTTAGGACTAGTTGATATAATATGGGGA 3420
pGEM1AcD ------------------------------GTGTTAGGACTAGTTGATATAATATGGGGA 3250
******************************
A small part of the alignment result of pGEM 1Ac and pGEM 1AcD which shows the deleted
nucleotides from the pGEM 1AcD. Nucleotides highlighted in yellow represent ribosomal
binding site (RBS). Nucleotides highlighted in turquoise represent start codon of Cry1Ac.
GTG could act as start codon in bacteria.
In the Cry1Ac deleted sequence GTG is near to the ribosome binding site (only 4 bases
apart). So this protein could be expressed in bacteria.
3. 7. Expression of Cry1AcD protein
The Cry1AcD (1-56) and Cry1AcD (2-50) proteins were expressed in three different
E.coli strains JM 109, BL21 and DH5α. These three E.coli strains were incubated at
300C and 25
0C and proteins were harvested from them after two days (as described in
methods 2.15) and were run in SDS-PAGE (figs 9, 10, 11, 12).
The expression of Cry1AcD (1-56) and Cry1AcD (2-50) proteins harvested from E.coli
strains incubated at 250C were higher when compared with the expression of Cry1AcD
(1-56) and Cry1AcD (2-50) proteins harvested from E.coli strains incubated at 300C.
Difference in expression of Cry1AcD (1-56) was observed when harvested from three
different strains (JM109, BL21 and DH5α) at same temperature i.e. at 250C. Cry1AcD
(1-56) harvested from DH5α showed slightly higher expression as compared to
Cry1AcD (1-56) harvested from JM109 and BL21.
Difference in expression of Cry1AcD (2-50) was also observed when harvested from
three different strains (JM109, BL21 and DH5α) at same temperature i.e. at 250C.
Cry1AcD (2-50) harvested from DH5α showed slightly higher expression as compared
to Cry1AcD (2-50) harvested from JM109 and BL21.
L1 L2 L3 L4
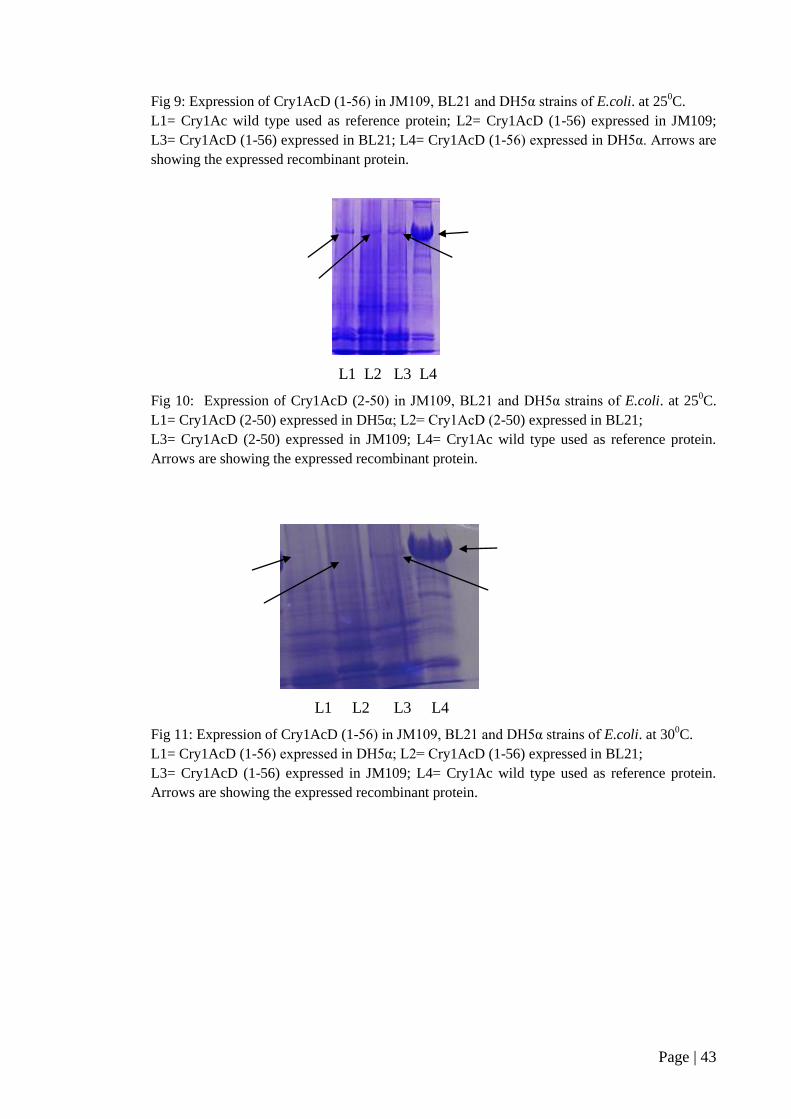
Page | 43
Fig 9: Expression of Cry1AcD (1-56) in JM109, BL21 and DH5α strains of E.coli. at 250C.
L1= Cry1Ac wild type used as reference protein; L2= Cry1AcD (1-56) expressed in JM109;
L3= Cry1AcD (1-56) expressed in BL21; L4= Cry1AcD (1-56) expressed in DH5α. Arrows are
showing the expressed recombinant protein.
L1 L2 L3 L4
Fig 10: Expression of Cry1AcD (2-50) in JM109, BL21 and DH5α strains of E.coli. at 250C.
L1= Cry1AcD (2-50) expressed in DH5α; L2= Cry1AcD (2-50) expressed in BL21;
L3= Cry1AcD (2-50) expressed in JM109; L4= Cry1Ac wild type used as reference protein.
Arrows are showing the expressed recombinant protein.
L1 L2 L3 L4
Fig 11: Expression of Cry1AcD (1-56) in JM109, BL21 and DH5α strains of E.coli. at 300C.
L1= Cry1AcD (1-56) expressed in DH5α; L2= Cry1AcD (1-56) expressed in BL21;
L3= Cry1AcD (1-56) expressed in JM109; L4= Cry1Ac wild type used as reference protein.
Arrows are showing the expressed recombinant protein.
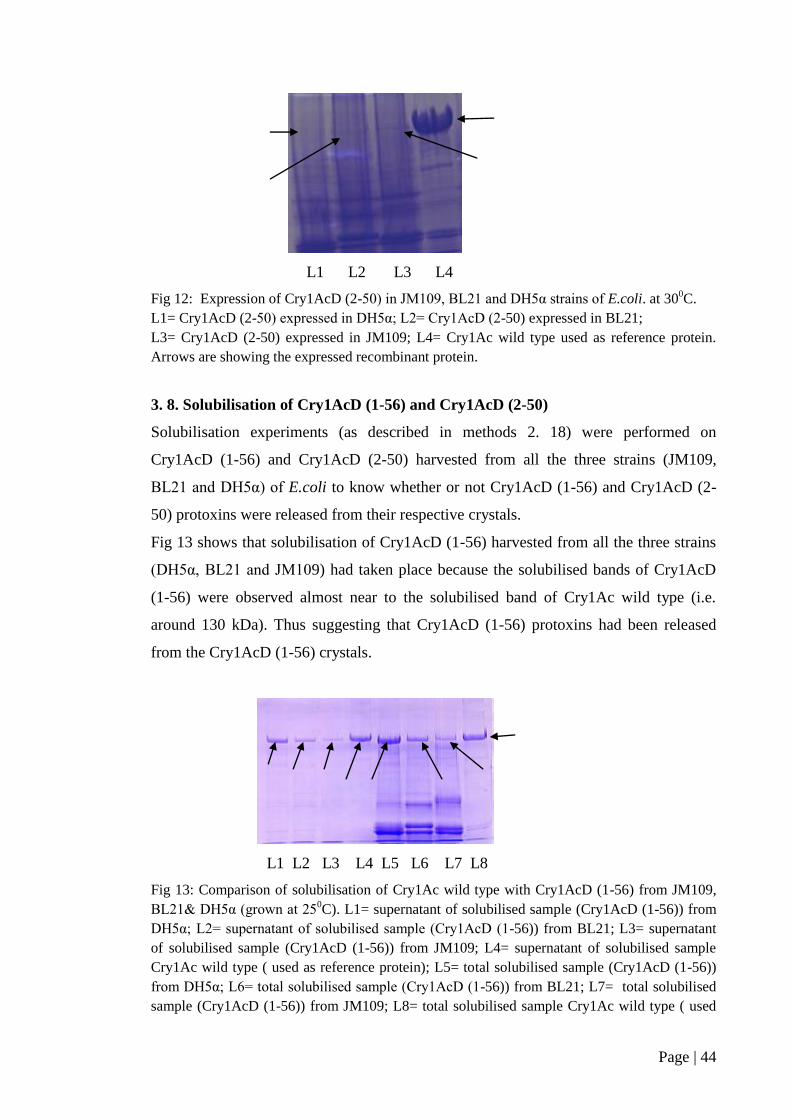
Page | 44
L1 L2 L3 L4
Fig 12: Expression of Cry1AcD (2-50) in JM109, BL21 and DH5α strains of E.coli. at 300C.
L1= Cry1AcD (2-50) expressed in DH5α; L2= Cry1AcD (2-50) expressed in BL21;
L3= Cry1AcD (2-50) expressed in JM109; L4= Cry1Ac wild type used as reference protein.
Arrows are showing the expressed recombinant protein.
3. 8. Solubilisation of Cry1AcD (1-56) and Cry1AcD (2-50)
Solubilisation experiments (as described in methods 2. 18) were performed on
Cry1AcD (1-56) and Cry1AcD (2-50) harvested from all the three strains (JM109,
BL21 and DH5α) of E.coli to know whether or not Cry1AcD (1-56) and Cry1AcD (2-
50) protoxins were released from their respective crystals.
Fig 13 shows that solubilisation of Cry1AcD (1-56) harvested from all the three strains
(DH5α, BL21 and JM109) had taken place because the solubilised bands of Cry1AcD
(1-56) were observed almost near to the solubilised band of Cry1Ac wild type (i.e.
around 130 kDa). Thus suggesting that Cry1AcD (1-56) protoxins had been released
from the Cry1AcD (1-56) crystals.
L1 L2 L3 L4 L5 L6 L7 L8
Fig 13: Comparison of solubilisation of Cry1Ac wild type with Cry1AcD (1-56) from JM109,
BL21& DH5α (grown at 250C). L1= supernatant of solubilised sample (Cry1AcD (1-56)) from
DH5α; L2= supernatant of solubilised sample (Cry1AcD (1-56)) from BL21; L3= supernatant
of solubilised sample (Cry1AcD (1-56)) from JM109; L4= supernatant of solubilised sample
Cry1Ac wild type ( used as reference protein); L5= total solubilised sample (Cry1AcD (1-56))
from DH5α; L6= total solubilised sample (Cry1AcD (1-56)) from BL21; L7= total solubilised
sample (Cry1AcD (1-56)) from JM109; L8= total solubilised sample Cry1Ac wild type ( used

Page | 45
as reference protein). Arrows are showing the solubilised recombinant protein.
Fig 14 shows that solubilisation of Cry1AcD (2-50) harvested from DH5α and JM109
has taken place because the solubilised bands of Cry1AcD (2-50) were observed almost
near to the solubilised band of Cry1Ac wild type (i.e. around 130 kDa) but Cry1AcD (2-
50) harvested from BL21 did not solubilise because no band was observed near to the
solubilised band of Cry1Ac wild type. Thus suggesting that Cry1AcD (2-50) protoxins
(from DH5α and JM109) have been released from the Cry1AcD (2-50) crystals but
Cry1AcD (2-50) protoxin (from BL21) had not been released from the crystal.
L1 L2 L3 L4 L5 L6 L7 L8
Fig 14: Comparison of solubilisation of Cry1Ac wild type with Cry1AcD (2-50) from JM109,
BL21& DH5α (grown at 250C). L1= total solubilised sample Cry1Ac wild type (used as
reference protein); L2= total solubilised sample (Cry1AcD (2-50)) from JM109; L3= total
solubilised sample (Cry1AcD (2-50)) from BL21; L4= total solubilised sample (Cry1AcD (2-
50)) from DH5α; L5= supernatant of solubilised sample Cry1Ac wild type (used as reference
protein); L6= supernatant of solubilised sample (Cry1AcD (2-50)) from JM109; L7=
supernatant of solubilised sample (Cry1AcD (2-50) from BL21; L8= supernatant of solubilised
sample (Cry1AcD (2-50) from DH5α. Arrows are showing the solubilised recombinant protein.
3. 9. Trypsin digest of Cry1AcD (1-56) and Cry1AcD (2-50)
Trypsin digest experiment (as described in methods 2. 18) is performed to activate the
protein in vitro. This experiment helps us to know whether the activated toxin is stable
or not stable.

Page | 46
Fig 15 shows that trypsin activated Cry1AcD (1-56) (from DH5α and JM109) was
stable because the bands were observed near the trypsin activated Cry1Ac (wild type)
band (i.e. around 65 kDa) but trypsin activated Cry1AcD (1-56) (from BL21) was not
stable because no band was observed in that lane near the trypsin activated Cry1Ac
(wild type) band (i.e. around 65 kDa).
L1 L2 L3 L4 L5 L6 L7 L8
Fig 15: Comparison of trypsin digest of Cry1Ac wild type with Cry1AcD (1-56) from JM109,
BL21& DH5α (grown at 250C). L1= supernatant of trypsinised sample (Cry1AcD (1-56)) from
DH5α; L2= supernatant of trypsinised sample (Cry1AcD (1-56)) from JM109; L3= supernatant
of trypsinised sample (Cry1AcD (1-56)) from BL21; L4= supernatant of trypsinised sample
Cry1Ac wild type (used as reference protein); L5= total trypsinised sample (Cry1AcD (1-56))
from DH5α; L6= total trypsinised sample (Cry1AcD (1-56)) from JM109; L7= total trypsinised
sample (Cry1AcD (1-56)) from BL21; L8= total trypsinised sample Cry1Ac wild type (used as
reference protein). Arrows are showing the trypsin activated recombinant protein.
Fig 16 shows no bands near the total trypsinised band of Cry1Ac wild type (i.e. around
65 kDa) in total trypsinised lanes of Cry1AcD (2-50) (from DH5α, JM109) but the
bands were observed in supernatant of typsinised Cry1AcD (2-50) (from DH5α and
JM109) lanes and the bands were near to the supernatant of trypsinised Cry1Ac (wild
type) band. The absence of band in total trypsinised lanes of Cry1AcD (2-50) (from
DH5α and JM109) may be due to some technical error. Fig 16 suggest that trypsin
activated Cry1AcD (2-50) (from DH5α and JM109) was stable but trypsin activated
Cry1AcD (2-50) (from BL21) was not stable as no band was observed, in lanes L3 and
L7, near the trypsinised band of Cry1Ac wild type.

Page | 47
L1 L2 L3 L4 L5 L6 L7 L8
Fig 16: Comparison of trypsin digest of Cry1Ac wild type with Cry1AcD (2-50) from JM109,
BL21& DH5α (grown at 250C). L1= supernatant of trypsinised sample (Cry1AcD (2-50)) from
DH5α; L2= supernatant of trypsinised sample (Cry1AcD (2-50)) from JM109; L3= supernatant
of trypsinised sample (Cry1AcD (2-50)) from BL21; L4= supernatant of trypsinised sample
Cry1Ac wild type (used as reference protein); L5= total trypsinised sample (Cry1AcD (2-50))
from DH5α; L6= total trypsinised sample (Cry1AcD (2-50)) from JM109; L7= total trypsinised
sample (Cry1AcD (2-50)) from BL21; L8= total trypsinised sample Cry1Ac wild type (used as
reference protein). Arrows are showing the trypsin activated recombinant protein.
For leaf dip bioassay (as described in methods 2. 20) it was decided to use Cry1AcD (1-
56) and Cry1AcD (2-50) which were harvested from DH5α (grown at 250C) because
Cry1AcD (1-56) and Cry1AcD (2-50) from DH5α were slightly better expressed,
solubilised and stable than Cry1AcD (1-56) and Cry1AcD (2-50) harvested from
JM109. Cry1AcD (1-56) from BL21 was expressed and solubilised but not stable when
activated with trypsin. Cry1AcD (2-50) from BL21 was expressed but did not
solubilise.
3. 10. Protein concentration determination of Cry1AcD (1-56) and Cry1AcD (2-50)
from DH5α grown at 250C.
The mutant proteins, Cry1AcD (1-56) and Cry1AcD (2-50) were run along with varying
concentrations of Cry1Ac (as described in methods 2. 19). By observing the gel (fig 17),
Cry1AcD (1-56) and Cry1AcD (2-50) concentrations were estimated as 0.1mg/ml
because the band intensity of these two mutant proteins matched with band intensity of
Cry1Ac (wild type) of 0.1 mg/ml concentration.

Page | 48
L1 L2 L3 L4
Fig 17: Protein concentration determination of Cry1AcD (1-56) and Cry1AcD (2-50). L1=
Cry1Ac wild type 0.1 mg/ml; L2= Cry 1Ac wild type 0.2 mg/ml; L3= Cry1AcD (1-56); L4=
Cry1AcD (2-50).
3. 11. Leaf dip bioassays using Cry1AcD (1-56) and Cry1AcD (2-50) from DH5α
grown at 250C.
Toxicity assays with mutant recombinant proteins Cry1AcD (1-56) and Cry1AcD (2-
50) and with Cry1Ac (wild type) were performed against the resistant (NOQA)
population of Plutella xylostella. The toxicity results are summarised in table 3.
The toxicity results showed that mutant toxins Cry1AcD (1-56) and Cry1AcD (2-50)
were less toxic when compared with Cry1Ac (wild type) at a similar toxin concentration
(i.e. 120µg/ml) against NOQA (resistant population of P.xylostella).16% and 8%
mortality were observed after feeding NOQA with 120µg/ml of Cry1AcD (1-56) and
Cry1AcD (2-50) respectively. When fed with 120µg/ml of Cry1Ac (wild type) 56%
mortality was observed.
Page | 49
Population Toxin Concentration
of
toxin
(µg/ml)
Total
number
of
insects
used
Total
number
of
insects
alive
Total
number
of
insects
dead
%
mortality
NOQA Cry1Ac
(wild
type)
120
50
22
28
56%
NOQA Cry1AcD
(1-56)
120
50
42
8
16%
NOQA Cry1AcD
(2-50)
120
50
46
4
8%
NOQA No toxin
used
No toxin
used
50
48
2
4%
Table 3: Toxicity assays of Cry1AcD (1-56), Cry1AcD (2-50) and Cry1Ac wild type against
resistant, NOQA, population of P.xylostella.
Even though Cry1AcD (1-56) and Cry1AcD (2-50) from DH5α showed proper
solubilisation and activated Cry1AcD (1-56) and Cry1AcD (2-50) were stable but still
they showed very less toxicity towards NOQA. So it was decided to change the
expression system for Cry1AcD (1-56) and Cry1AcD (2-50) and see if there were any
changes in toxicity of these two mutant toxins. Therefore it was decided to express
Cry1AcD (1-56) and Cry1AcD (2-50) in Bacillus thuringiensis (Bt) 78/11 strain.
For expressing Cry1AcD (1-56) and Cry1AcD (2-50) in Bt they have to be cloned in a
shuttle vector. So it was decided to use pSV2 and pSVP27A vectors. Both of them are
E.coli-Bt shuttle vectors. pSVP27A also possesses Cyt1A promoter.
For cloning Cry1AcD (1-56) and Cry1AcD (2-50) into pSV2 and pSVP27A they have
to be first excised from pGEM vector. The scheme for the construction of these vectors
are shown in diagrams 1 and 2.

Page | 50
3. 12. Restriction digest to separate Cry1AcD (1-56) and Cry1AcD (2-50) from
pGEM vectors
For excising Cry1AcD (1-56) and Cry1AcD (2-50) from pGEM plasmid SalI and SphI
enzymes were used. SalI and SphI enzymes were used because these enzymes do not
cut in between the Cry 1AcD (1-56) and Cry1AcD (2-50) genes. SalI and SphI excises
pGEM 1AcD (1-56) and pGEM 1AcD (2-50) at three positions. The sizes of pGEM
1AcD (2-50) fragments when digested with SalI and SphI should be 3961 bp, 2943 bp
and 52 bp (information obtained using NEB cutter). Similarly the sizes of pGEM 1AcD
(1-56) fragments when digested with SalI and SphI should be 3938 bp, 2943 bp and 52
bp (information obtained using NEB cutter).
It was decided to excise 3961 bp band from pGEM 1AcD (2-50) and 3938 bp from
pGEM 1AcD (1-56) because these bands possess Cry1Ac promoter, RBS and Cry1AcD
gene (information obtained using NEB cutter).
In fig 18 three bands were observed in lane 2 (L2) and lane 3 (L3). Bands near 4Kb and
3Kb, were double (SalI + SphI) digested products of pGEM 1AcD (1-56) and pGEM
1AcD (2-50). Bands near 4 Kb were excised from the agarose gel. Bands in between
6Kb and 8Kb were observed because pGEM 1AcD (1-56) and pGEM 1AcD (2-50)
were partially digested.
L1 L2 L3
Fig 18: SalI + SphI digested pGEM 1AcD (1-56) and pGEM 1AcD (2-50). L1= 1Kb marker
(sizes of 1 kb marker bands are 0.5 kb, 1 kb, 1.5 kb, 2 kb, 3 kb (brightest band), 4 kb, 5 kb, 6 kb,
8 kb and 10 kb respectively from bottom to top on agarose gel); L2= SalI+SphI digested pGEM
1AcD (1-56); L3= SalI+SphI digested pGEM 1AcD (2-50). Arrows showing the bands excised
3kb
4 kb
Page | 51
from the gel.
3. 13. Extraction of 4 kb band
Double (SalI + SphI) digested products pGEM 1AcD (1-56) and pGEM 1AcD (2-50)
were run on 0.8% agarose gel. The bands near 4 Kb were cut out and purified (as
described in methods 2. 6). 5µl of purified products were run on 1% agarose gel (fig
19).
L1 L2 M
Fig 19: Gel purified 4 Kb products (Cry1AcD (1-56)) and (Cry1AcD (2-50)). L1= Gel purified
4Kb product (Cry1AcD (1-56)); L2= Gel purified 4Kb product (Cry1AcD (2-50)); M= 1Kb
marker (sizes of 1 kb marker bands are 0.5 kb, 1 kb, 1.5 kb, 2 kb, 3 kb (brightest band), 4 kb, 5
kb, 6 kb, 8 kb and 10 kb respectively from bottom to top on agarose gel).
3. 14. Double digestion of pSV2 and pSVP27A plasmid with Sal I and Sph I
enzyme
pSV2 when digested with Sal I and Sph I produces fragments of 4925 bp and 16 bp and
Sal I and Sph I digested pSVP27A produces fragments of 5572 bp and 16 bp
(information obtained using NEB cutter).
It was decided to excise pSV2 band near 5 Kb (fig 20) and pSVP27A band near 6Kb
(fig 20). Sal I and Sph I digested pSV2 and pSVP27A were run on 1% agarose gel. The
pSV2 band near 5 Kb and pSVP27A band near 6 Kb were cut out and purified. 5 µl of
purified products were run on 1% agarose gel (fig 21).
Page | 52
L1 L2 L3
Fig 20: Sal I + Sph I digested pSV2 and pSVP27A plasmid. L1= Sal I + Sph I digested pSV2;
L2= Sal I + Sph I digested pSVP27A; L3= 1Kb marker (sizes of 1 kb marker bands are 0.5 kb, 1
kb, 1.5 kb, 2 kb, 3 kb (brightest band), 4 kb, 5 kb, 6 kb, 8 kb and 10 kb respectively from
bottom to top on agarose gel). Arrows showing the bands to be excised from the gel.
L1 L2 L3
Fig 21: gel purified pSV2 and pSVP27A. L1= Gel purified pSV2; L2= 1 Kb marker (sizes of 1
kb marker bands are 0.5 kb, 1 kb, 1.5 kb, 2 kb, 3 kb (brightest band), 4 kb, 5 kb, 6 kb, 8 kb and
10 kb respectively from bottom to top on agarose gel); L3= Gel purified pSVP27A.
Page | 53
3. 15. Ligation of Cry1AcD (1-56) and Cry1AcD (2-50) with pSV2 and pSVP27A
Ligations (as described in methods 2. 10) were performed to ligate gel purified
Cry1AcD (1-56) and Cry1AcD (2-50) with gel purified pSV2 and pSVP27A plasmids.
3. 16. Transformation of E.coli JM109 strain with ligation mixes
E.coli JM109 strain cells were transformed (as described in methods 2. 8) with ligation
mixes containing pSV2 1AcD (1-56), pSV2 1AcD (2-50), pSVP27A 1AcD (1-56),
pSVP27A 1AcD (2-50) and were grown on agar plates containing ampicillin.
The transformed JM109 possessing pSV2 1AcD (2-50), pSV2 1AcD (1-56), pSVP27A
1AcD (2-50), pSVP27A 1AcD (1-56) were plated on agar plates containing ampicillin,
only 8, 1, 4 and 7 colonies grew on them respectively.
All of these colonies were picked up and subcultured on ampicillin containing agar
plates.
3. 17. Rapid Size Screen of the subcultured colonies
Rapid Size Screen (as described in methods 2.13) was performed on all these colonies
to know whether these colonies might possess the constructs i.e. recombinant plasmids (
pSV2 1AcD (2-50), pSV2 1AcD (1-56), pSVP27A 1AcD (2-50), pSVP27A 1AcD (1-
56) or not (fig 22 a, b, c).
Fig 22 a showed that colony 1(L2) might possess pSV2 1AcD (1-56) and colony 1 (L3),
2 (L4) and 5 (L7) might possess pSV2 1AcD (2-50) because the bands in the lanes of
these colonies were above the control band (pSV2) (L1).
Fig 22 b showed that JM 109 colony 2 (L3) and JM 109 colony 3 (L4) might possess
pSVP27A 1AcD (2-50) because the bands in the lanes of these two colonies were above
the band in control lane (pSVP27A) (L1). Colony 7 (L7) and 8 (L8) might possess
pSV2 1AcD (2-50) because the bands in the lanes of these two colonies were above the
band in control lane (pSV2) (L6).
Fig 22 c showed that JM 109 colony 4 (L5) and JM 109 colony 7 (L8) might possess
pSVP27A 1AcD (1-56) because the bands in the lanes of these two colonies were above
the band in control lane (pSVP27A) (L1).

pGEM 1AcD
pSV2
SalI+SphI
Ligation
pSV2 1AcD
Cry1AcD
SalI SphI
SalI SphI
SalI SalI
SalI SphI
SphI SalI
SalI SphI
SalI SphI
Restriction
digest
SalI SphI
Diagram 1: Construction of recombinant plasmid pSV2 1AcD
pGEM 1AcD
pSVP27A
SalI+SphI
Ligation
pSVP27A 1AcD
Cry1AcD
SalI SphI
SalI SphI
SalI SalI
SalI SphI
SphI SalI
SalI SphI
SalI SphI
Restriction
digest
SalI SphI
Diagram 2: Construction of recombinant plasmid pSVP27A 1AcD
Cyt1A
promoter
Cyt1A
promoter

Page | 54
22 a.
L1 L2 L3 L4 L5 L6 L7 L8
22 b.
L1 L2 L3 L4 L5 L6 L7 L8
22 c.
L1 L2 L3 L4 L5 L6 L7 L8
Fig 22 a: Rapid Size Screen of JM 109 colonies supposed to possess pSV2 1AcD (1-56) and
pSV2 1AcD (2-50). L1= JM 109 possessing pSV2 ( used as control); L2= JM 109 colony1
supposed to possess pSV2 1AcD (1-56); L3= JM 109 colony 1 supposed to possess pSV2 1AcD
(2-50); L4= JM 109 colony 2 supposed to possess pSV2 1AcD (2-50); L 5= JM 109 colony 3
supposed to possess pSV2 1AcD (2-50); L6= JM 109 colony 4 supposed to possess pSV2
1AcD (2-50); L7= JM 109 colony 5 supposed to possess pSV2 1AcD (2-50); L8= JM 109
colony 6 supposed to possess pSV2 1AcD (2-50).
Fig 22 b: Rapid Size Screen of JM 109 colonies supposed to possess pSVP27A 1AcD (2-50)
and pSV2 1AcD (2-50). L1= JM 109 possessing pSVP27A (as control); L2= JM 109 colony1
supposed to possess pSVP27A 1AcD (2-50); L3= JM 109 colony 2 supposed to possess
pSVP27A 1AcD (2-50); L4= JM 109 colony 3 supposed to possess pSVP27A 1AcD (2-50);
L5= JM 109 colony 4 supposed to possess pSVP27A 1AcD (2-50); L6= JM 109 possessing
pSV2 ( used as control); L7= JM 109 colony 7 supposed to possess pSV2 1AcD (2-50); L8=
JM 109 colony 8 supposed to possess pSV2 1AcD (2-50).
Fig 22 c: Rapid Size Screen of JM 109 colonies supposed to possess pSVP27A 1AcD (1-56).
L1= JM 109 possessing pSVP27A (used as control); L2= JM 109 colony 1 supposed to possess
pSVP27A 1AcD (1-56); L3= JM 109 colony 2 supposed to possess pSVP27A 1AcD (1-56);
L4= JM 109 colony 3 supposed to possess pSVP27A 1AcD (1-56); L5= JM 109 colony 4
supposed to possess pSVP27A 1AcD(1-56); L6= JM 109 colony 5 supposed to possess
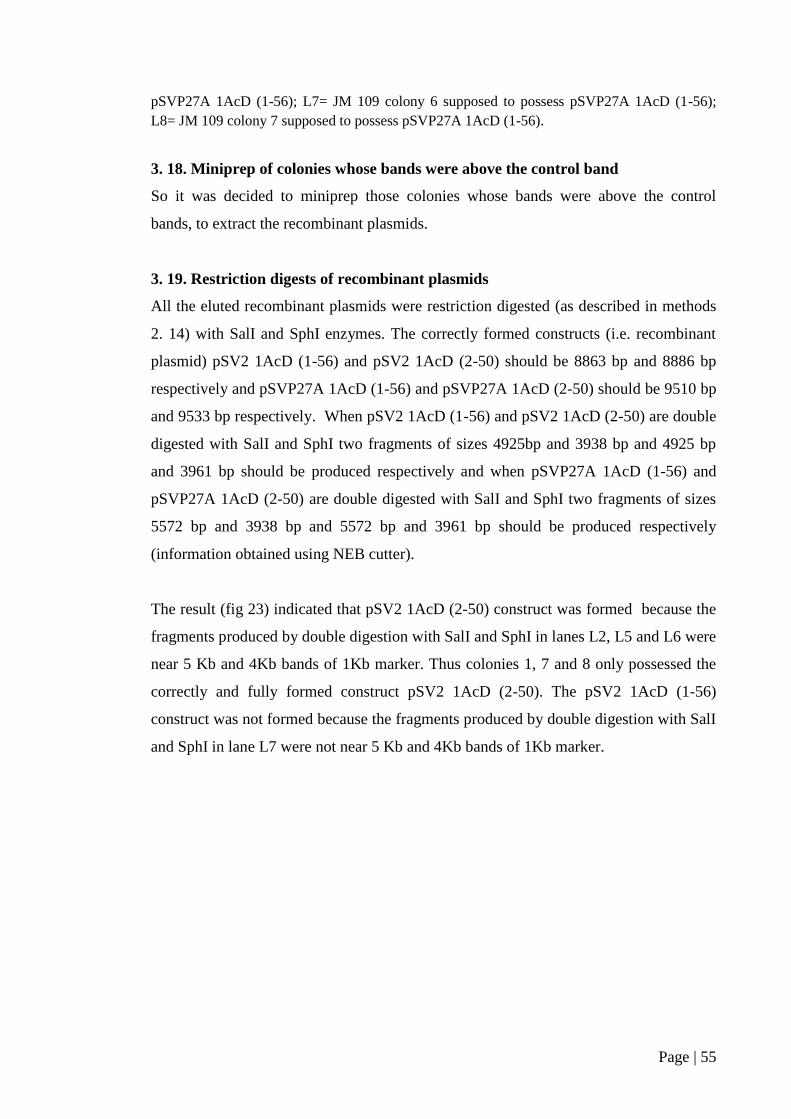
Page | 55
pSVP27A 1AcD (1-56); L7= JM 109 colony 6 supposed to possess pSVP27A 1AcD (1-56);
L8= JM 109 colony 7 supposed to possess pSVP27A 1AcD (1-56).
3. 18. Miniprep of colonies whose bands were above the control band
So it was decided to miniprep those colonies whose bands were above the control
bands, to extract the recombinant plasmids.
3. 19. Restriction digests of recombinant plasmids
All the eluted recombinant plasmids were restriction digested (as described in methods
2. 14) with SalI and SphI enzymes. The correctly formed constructs (i.e. recombinant
plasmid) pSV2 1AcD (1-56) and pSV2 1AcD (2-50) should be 8863 bp and 8886 bp
respectively and pSVP27A 1AcD (1-56) and pSVP27A 1AcD (2-50) should be 9510 bp
and 9533 bp respectively. When pSV2 1AcD (1-56) and pSV2 1AcD (2-50) are double
digested with SalI and SphI two fragments of sizes 4925bp and 3938 bp and 4925 bp
and 3961 bp should be produced respectively and when pSVP27A 1AcD (1-56) and
pSVP27A 1AcD (2-50) are double digested with SalI and SphI two fragments of sizes
5572 bp and 3938 bp and 5572 bp and 3961 bp should be produced respectively
(information obtained using NEB cutter).
The result (fig 23) indicated that pSV2 1AcD (2-50) construct was formed because the
fragments produced by double digestion with SalI and SphI in lanes L2, L5 and L6 were
near 5 Kb and 4Kb bands of 1Kb marker. Thus colonies 1, 7 and 8 only possessed the
correctly and fully formed construct pSV2 1AcD (2-50). The pSV2 1AcD (1-56)
construct was not formed because the fragments produced by double digestion with SalI
and SphI in lane L7 were not near 5 Kb and 4Kb bands of 1Kb marker.
Page | 56
L1 L2 L3 L4 L5 L6 L7
Fig 23: SalI + SphI restriction digest of recombinant plasmids supposed to be pSV2 1AcD (2-
50) and pSV2 1AcD (1-56). L1= 1Kb marker (sizes of 1 kb marker bands are 0.5 kb, 1 kb, 1.5
kb, 2 kb, 3 kb (brightest band), 4 kb, 5 kb, 6 kb, 8 kb and 10 kb respectively from bottom to top
on agarose gel); L2= SalI+SphI digested recombinant plasmid supposed to be pSV2 1AcD (2-
50) eluted from JM 109 colony 1; L3= SalI+SphI digested recombinant plasmid supposed to be
pSV2 1AcD (2-50) eluted from JM 109 colony 2; L4= SalI+SphI digested recombinant plasmid
supposed to be pSV2 1AcD (2-50) eluted from JM 109 colony 5; L5= SalI+SphI digested
recombinant plasmid supposed to be pSV2 1AcD (2-50) eluted from JM 109 colony 7; L6=
SalI+SphI digested recombinant plasmid supposed to be pSV2 1AcD (2-50) eluted from JM 109
colony 8; L7= SalI+SphI digested recombinant plasmid supposed to be pSV2 1AcD (1-56)
eluted from JM 109 colony1.
Fig 24 shows that only colony 3 possessed the fully and correctly formed construct
pSVP27A 1AcD (2-50) because the fragments produced by double digestion with SalI
and SphI were near 6 Kb and 4Kb. The pSVP27A 1AcD (1-56) construct was not
formed.

Page | 57
L1 L2 L3 L4 L5
Fig 24: SalI + SphI restriction digest of recombinant plasmids supposed to be pSVP27A 1AcD
(2-50) and pSVP27A 1AcD (1-56). L1= 1Kb marker (sizes of 1 kb marker bands are 0.5 kb, 1
kb, 1.5 kb, 2 kb, 3 kb (brightest band), 4 kb, 5 kb, 6 kb, 8 kb and 10 kb respectively from
bottom to top on agarose gel); L2= SalI+SphI digested recombinant plasmid supposed to be
pSVP27A 1AcD (2-50) eluted from JM 109 colony 2; L3= SalI+SphI digested recombinant
plasmid supposed to be pSVP27A 1AcD (2-50) eluted from JM 109 colony 3; L4= SalI+SphI
digested recombinant plasmid supposed to be pSVP27A 1AcD (1-56) eluted from JM 109
colony 4; L5= SalI+SphI digested recombinant plasmid supposed to be pSVP27A 1AcD (1-56)
eluted from JM 109 colony 7.
So it was decided to transform Bacillus thuringiensis 78/11 strain with only the fully
and correctly formed constructs i.e. pSV2 1AcD (2-50) and pSVP27A 1AcD (2-50).
3. 20. Transformation of Bt 78/11 with pSV2 1AcD (2-50) and pSVP27A 1AcD (2-
50)
Bacillus thuringiensis 78/11 strain were transformed (as described in methods 2. 11)
with pSV2 1AcD (2-50) and pSVP27A 1AcD (2-50) and the transformed cells were
grown on agar plate containing chloramphenicol.
In 78/11(pSV2 1AcD (2-50)) plate 15 colonies grew and in 78/11 (pSVP27A 1AcD (2-
50)) plate 20 colonies grew.
To confirm transformed Bacillus thuringiensis 78/11 strain possessed the correctly
formed constructs (i.e. recombinant plasmid) pSV2 1AcD (2-50) and pSVP27A 1AcD
(2-50), it was decided to elute these constructs from 78/11 and transform them back into
E.coli JM109 strain.
For that one colony each from 78/11 (pSV2 1AcD (2-50)) and78/11 (pSVP27A 1AcD
(2-50)) plates were picked up and were subcultured on another agar plate containing
Page | 58
chloramphenicol.
Minipreps (as described in methods 2. 12) were performed to elute these constructs
from Bacillus thuringiensis 78/11 strain.
3. 21. Transformation of JM109 with constructs
Both the constructs were eluted from Bacillus thuringiensis 78/11 strain. After that
E.coli JM109 were transformed (as described in methods 2. 8) with these eluted
constructs and were grown on agar plates containing ampicillin. Around 100 colonies
grew on both plates. One colony from each plate was picked up and was subcultured on
another plate containing ampicillin. These two subcultured colonies were minipreped to
elute the constructs.
3. 22. Restriction digests of the Constructs
Double digest of the constructs were performed using SalI and SphI enzymes.
The result (fig 25) showed that the construct (L2) when digested with SalI and SphI
enzymes produced fragments of around 5 Kb and 4 Kb thus the result confirmed that
Bacillus thuringiensis 78/11 possessed the fully and correctly formed construct pSV2
1AcD (2-50). Similarly the construct (L3) when digested with SalI and SphI enzymes
produced fragments of around 6Kb and 4Kb thus the result confirmed that Bacillus
thuringiensis 78/11 possessed the fully and correctly formed construct pSVP27A 1AcD
(2-50).
Page | 59
L1 L2 L3
Fig 25: SalI and SphI digested constructs pSV2 1AcD (2-50) and pSVP27A 1AcD (2-50). L1=
1Kb Marker (sizes of 1 kb marker bands are 0.5 kb, 1 kb, 1.5 kb, 2 kb, 3 kb (brightest band), 4
kb, 5 kb, 6 kb, 8 kb and 10 kb respectively from bottom to top on agarose gel); L2= Construct
(pSV2 1AcD (2-50)) digested with SalI and SphI; L3= Construct (pSVP27A 1AcD (2-50))
digested with SalI and SphI.
So it was decided to grow these two colonies, one colony possessing pSV2 1AcD (2-50)
and another colony possessing pSVP27A 1AcD (2-50), on agar plates containing
chloramphenicol at 300C for two days. After two days colonies were scrapped off from
the plates to harvest (as described in methods 2. 16).
The result (fig 26) showed that Cry1AcD (2-50) was not expressed in Bacillus
thuringiensis 78/11 strain because no bands were observed near Cry1Ac (wild type)
band in lanes L2 and L3 and also no crystals were observed when viewed under a
microscope.

Page | 60
L1 L2 L3
Fig 26: Gel to show the expression of Cry1AcD (2-50) harvested from Bacillus thuringiensis
78/11. L1= Cry1Ac (wild type) used as reference protein; L2= Cry1AcD (2-50) harvested from
Bacillus thuringiensis 78/11 possesing pSV2 1AcD (2-50) recombinant plasmid; L3= Cry1AcD
(2-50) harvested from Bacillus thuringiensis 78/11 strain possesing pSVP27A 1AcD (2-50)
recombinant plasmid. Arrow is showing Cry1Ac (wild type).
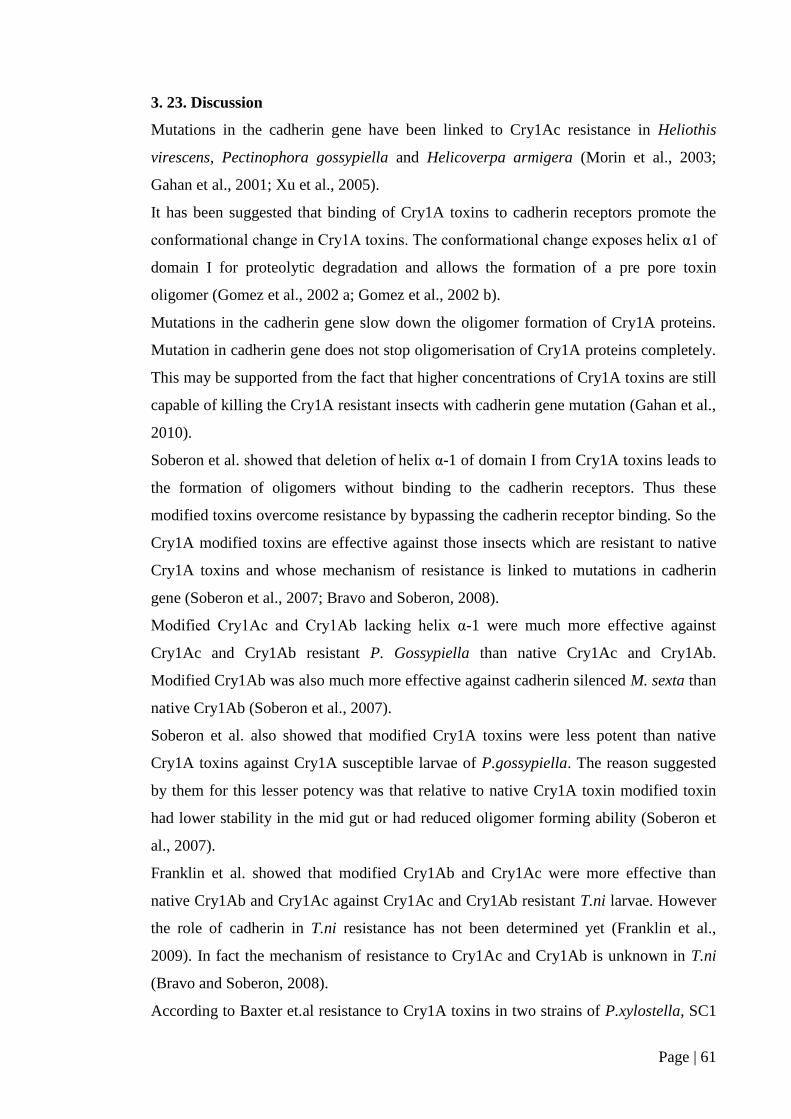
Page | 61
3. 23. Discussion
Mutations in the cadherin gene have been linked to Cry1Ac resistance in Heliothis
virescens, Pectinophora gossypiella and Helicoverpa armigera (Morin et al., 2003;
Gahan et al., 2001; Xu et al., 2005).
It has been suggested that binding of Cry1A toxins to cadherin receptors promote the
conformational change in Cry1A toxins. The conformational change exposes helix α1 of
domain I for proteolytic degradation and allows the formation of a pre pore toxin
oligomer (Gomez et al., 2002 a; Gomez et al., 2002 b).
Mutations in the cadherin gene slow down the oligomer formation of Cry1A proteins.
Mutation in cadherin gene does not stop oligomerisation of Cry1A proteins completely.
This may be supported from the fact that higher concentrations of Cry1A toxins are still
capable of killing the Cry1A resistant insects with cadherin gene mutation (Gahan et al.,
2010).
Soberon et al. showed that deletion of helix α-1 of domain I from Cry1A toxins leads to
the formation of oligomers without binding to the cadherin receptors. Thus these
modified toxins overcome resistance by bypassing the cadherin receptor binding. So the
Cry1A modified toxins are effective against those insects which are resistant to native
Cry1A toxins and whose mechanism of resistance is linked to mutations in cadherin
gene (Soberon et al., 2007; Bravo and Soberon, 2008).
Modified Cry1Ac and Cry1Ab lacking helix α-1 were much more effective against
Cry1Ac and Cry1Ab resistant P. Gossypiella than native Cry1Ac and Cry1Ab.
Modified Cry1Ab was also much more effective against cadherin silenced M. sexta than
native Cry1Ab (Soberon et al., 2007).
Soberon et al. also showed that modified Cry1A toxins were less potent than native
Cry1A toxins against Cry1A susceptible larvae of P.gossypiella. The reason suggested
by them for this lesser potency was that relative to native Cry1A toxin modified toxin
had lower stability in the mid gut or had reduced oligomer forming ability (Soberon et
al., 2007).
Franklin et al. showed that modified Cry1Ab and Cry1Ac were more effective than
native Cry1Ab and Cry1Ac against Cry1Ac and Cry1Ab resistant T.ni larvae. However
the role of cadherin in T.ni resistance has not been determined yet (Franklin et al.,
2009). In fact the mechanism of resistance to Cry1Ac and Cry1Ab is unknown in T.ni
(Bravo and Soberon, 2008).
According to Baxter et.al resistance to Cry1A toxins in two strains of P.xylostella, SC1
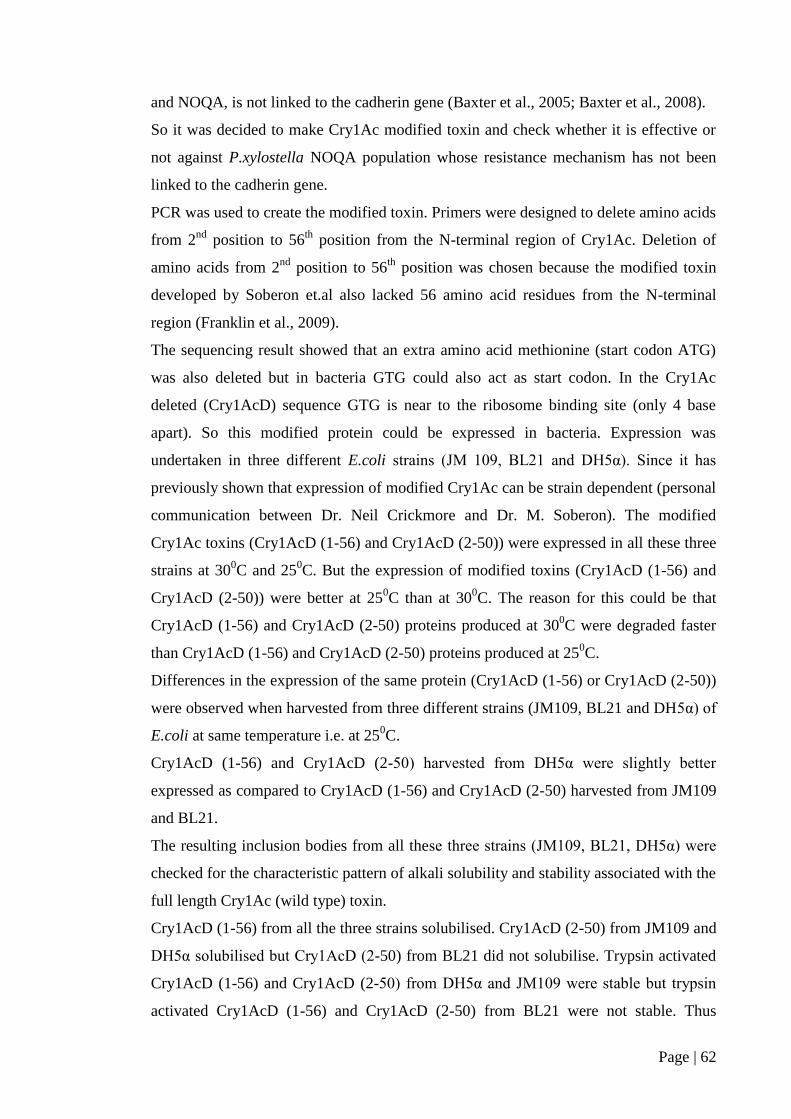
Page | 62
and NOQA, is not linked to the cadherin gene (Baxter et al., 2005; Baxter et al., 2008).
So it was decided to make Cry1Ac modified toxin and check whether it is effective or
not against P.xylostella NOQA population whose resistance mechanism has not been
linked to the cadherin gene.
PCR was used to create the modified toxin. Primers were designed to delete amino acids
from 2nd
position to 56th
position from the N-terminal region of Cry1Ac. Deletion of
amino acids from 2nd
position to 56th
position was chosen because the modified toxin
developed by Soberon et.al also lacked 56 amino acid residues from the N-terminal
region (Franklin et al., 2009).
The sequencing result showed that an extra amino acid methionine (start codon ATG)
was also deleted but in bacteria GTG could also act as start codon. In the Cry1Ac
deleted (Cry1AcD) sequence GTG is near to the ribosome binding site (only 4 base
apart). So this modified protein could be expressed in bacteria. Expression was
undertaken in three different E.coli strains (JM 109, BL21 and DH5α). Since it has
previously shown that expression of modified Cry1Ac can be strain dependent (personal
communication between Dr. Neil Crickmore and Dr. M. Soberon). The modified
Cry1Ac toxins (Cry1AcD (1-56) and Cry1AcD (2-50)) were expressed in all these three
strains at 300C and 25
0C. But the expression of modified toxins (Cry1AcD (1-56) and
Cry1AcD (2-50)) were better at 250C than at 30
0C. The reason for this could be that
Cry1AcD (1-56) and Cry1AcD (2-50) proteins produced at 300C were degraded faster
than Cry1AcD (1-56) and Cry1AcD (2-50) proteins produced at 250C.
Differences in the expression of the same protein (Cry1AcD (1-56) or Cry1AcD (2-50))
were observed when harvested from three different strains (JM109, BL21 and DH5α) of
E.coli at same temperature i.e. at 250C.
Cry1AcD (1-56) and Cry1AcD (2-50) harvested from DH5α were slightly better
expressed as compared to Cry1AcD (1-56) and Cry1AcD (2-50) harvested from JM109
and BL21.
The resulting inclusion bodies from all these three strains (JM109, BL21, DH5α) were
checked for the characteristic pattern of alkali solubility and stability associated with the
full length Cry1Ac (wild type) toxin.
Cry1AcD (1-56) from all the three strains solubilised. Cry1AcD (2-50) from JM109 and
DH5α solubilised but Cry1AcD (2-50) from BL21 did not solubilise. Trypsin activated
Cry1AcD (1-56) and Cry1AcD (2-50) from DH5α and JM109 were stable but trypsin
activated Cry1AcD (1-56) and Cry1AcD (2-50) from BL21 were not stable. Thus

Page | 63
suggesting that Cry1AcD (1-56) and Cry1AcD (2-50) from DH5α and JM109 strains
may be properly folded.
The results of Cry1AcD (1-56) and Cry1AcD (2-50) expression, solubilisation and
trypsin activation from all the three strains have been summarised in the table 4 given
below.
Strain Cry1AcD(1-56)
Expression
Cry1AcD(1-56)
Solubility
Cry1AcD(1-56)
Trypsin activation
DH5α ++ + +++ +++
JM109 ++ ++ ++
BL21 ++ ++ _ _
Strain Cry1AcD(2-50)
Expression
Cry1AcD(2-50)
Solubility
Cry1AcD(2-50)
Trypsin activation
DH5α +++ +++ +++
JM109 ++ ++ ++
BL21 ++ _ _ _ _
Table 4: Expression, solubility and trypsin activation of Cry1AcD (1-56) and Cry1AcD (2-50)
from three different strains of E.coli (DH5α, JM109 and BL21). + = shows that protein has been
expressed, solubilised or stable upon trypsin activation. _ = shows that protein has not been
expressed, solubilised or stable upon trypsin activation.
So by looking at the results it was decided to use Cry1AcD (1-56) and Cry1AcD (2-50)
from DH5α for leaf dip bioassay.
Toxicity assays with Cry1AcD (1-56), Cry1AcD (2-50) and Cry1Ac (wild type) were
performed against the resistant (NOQA) population of P.xylostella.
The toxicity results showed that modified toxins Cry1AcD (1-56) and Cry1AcD (2-50)
were very less toxic when compared with Cry1Ac (wild type) at similar toxin
concentration (i.e. 120µg/ml).
The reason for less effectiveness of Cry1AcD (1-56) and Cry1AcD (2-50) against
resistant NOQA population, whose mechanism of resistance has not been linked to
mutation in cadherin gene, may be due to their lower stability in the midgut or may be
due to their decreased oligomer forming ability.
Even though Cry1AcD (1-56) and Cry1AcD (2-50) from DH5α showed proper
solubilisation and activated Cry1AcD (1-56) and Cry1AcD (2-50) were stable they still
showed less toxicity towards NOQA. So it was decided to change the expression system

Page | 64
for Cry1AcD (1-56) and Cry1AcD (2-50) and see if there were any changes in toxicity
of these two mutant toxins. Therefore it was decided to express Cry1AcD (1-56) and
Cry1AcD (2-50) in Bacillus thuringiensis (Bt) 78/11 strain.
For expressing Cry1AcD (1-56) and Cry1AcD (2-50) in Bt strains Cry1AcD (1-56) and
Cry1AcD (2-50) genes were first excised from pGEM vector and then cloned into
E.coli-Bt shuttle vectors pSV2 and pSVP27A. pSVP27A possesses Cyt1A promoter. So
it was also decided to be used to see whether or not it creates any difference in
Cry1AcD (1-56) and Cry1AcD (2-50) expression.
The result showed that only two constructs pSV2 1AcD (2-50) and pSVP27A 1AcD (2-
50) were fully and correctly created. These two constructs were then introduced into Bt
78/11.
To confirm 78/11 strains possessed the correctly and fully formed constructs, the
constructs were eluted from 78/11 strain and introduced into E.coli JM109 strain.
The result confirmed that Bt 78/11 strain possessed the fully and correctly formed
constructs pSV2 1AcD (2-50) and pSVP27A 1AcD (2-50).
But the modified proteins Cry1AcD (1-56) and Cry1AcD (2-50) were not expressed in
Bt 78/11 strain.
The results showed that modified Cry1Ac i.e. Cry1AcD (1-56) and Cry1AcD (2-50) are
not effective against NOQA population. According to Baxter et al. resistance to Cry1Ac
in NOQA population is not linked to mutation in cadherin gene (Baxter et al., 2005;
Baxter et al., 2008). So the result strengthens the hypothesis that the mechanism of
resistance in NOQA population is not cadherin based.
Future work:
Franklin et.al showed that modified Cry1Ac was more effective than native Cry1Ac
against Cry1Ac resistant T.ni larvae. However the role of cadherin in T.ni resistance has
not been determined yet (Franklin et.al, 2009).
So the modified Cry1Ac should be used against other resistant lepidopteran insects
whose resistance mechanism has been linked and has not been linked to mutation in
cadherin gene. If it is effective then modified Cry1Ac toxin would counter or delay
insect resistance to Cry1Ac.
Modification could also be made in other Cry toxins which have similar structure as
Cry1A toxins, form oligomers and induce pores. It would be interesting to see whether
these other modified Cry toxins lacking helix α-1 can kill resistant insects that have

Page | 65
altered receptor or not (Soberon et al., 2007).
As modified Cry1Ac toxins were not expressed in Bt 78/11 strain, alternative Bt hosts
could be used. Perhaps expressing the modified toxin in a Bt strain that already
expresses a Bt toxin, for example HD73 that expresses Cry1Ac, may facilitate the stable
expression of the mutant.
Page | 66
Chapter 4
Mechanism of resistance to spinosad in lepidopteran insects
4. 1. Introduction
Baxter and his colleagues showed that field based resistance to spinosad in a Plutella
xylostella strain collected from Pearl city, Hawaii is due to the point mutation in the
ninth intron splice junction of nAChR Pxα6. A point mutation at the 5’ donor site of
intron 9 (GT changed to AT) causes mRNA mis-splicing which leads to the addition of
40 bases into the mRNA of the resistant population. This mutation causes a premature
termination codon between transmembrane domain 3 and 4 and is the likely functional
cause of resistance in Plutella xylostella strain collected from Pearl city, Hawaii (Baxter
et al., 2010).
Hence it was decided to check whether or not other spinosad resistant lepidopteran
insects have similar mechanism of resistance as Plutella xylostella Pearl population i.e.
whether this splice site region was a hot spot for mutation.
For this reason it was decided to work on a spinosad resistant Spodoptera litura
population collected from the fields of Pakistan.
So it was decided to amplify nAChR intron 9 (including the splice junction) of
Spodoptera litura.
The primers were designed by keeping this criterion in mind. Forward primer was
designed on exon 9 and reverse primer on intron 9.
As the nAChR sequence of Spodoptera litura was not available, BLAST (NCBI) was
performed using the nAChR exon 9 nucleotide sequence of Plutella xylostella G88
population. This was done because Plutella xylostella and Spodoptera litura belongs to
the order Lepidoptera. nAChR exon 9 sequence of those insects which showed
maximum score, identity and query coverage were selected and these sequences were
aligned with Plutella xylostella nAChR exon 9 sequence using Clustal W program. The
forward primer was designed from the region where the nucleotide sequences were
highly similar after alignment.
G88 CTGCATCATGTTCATGGTGGCGTCGTCGGTGGTGCTGACCGTGGTGGTGCTCAACTACCA 73
H.virescens CTGCATCATGTTCATGGTGGCTTCCTCCGTCGTCTCCACCATACTGATCCTCAACTACCA 1320
B.mori CTGTATTATGTTCATGGTGGCCTCGTCTGTGGTGCTCACCGTTGTGGTGTTGAACTACCA 964
Nucleotide sequences highlighted in yellow is the region from where nAChR exon 9
forward primer has been designed.
Page | 67
Forward Primer Exon 9: 5’ GCATCATGTTCATGGTGGCG 3’
The reverse primer was designed from the intron 9 sequence of Plutella xylostella
alone because the alignment scores of different insects were very low.
G88 AAAATTGCTAGCCTGGCTAAATCAATTATAATAGCACAAAGTTCTGTGCTCCGGAACAAA 596
T.castaneum -AAATTGCT----TGACCA------TTACAAC-------------GTACT--GGAACGG- 165
H.virescens -GCGTTGCT-----GGCGAA-----CTACAAC---------------ACCCTGGAGCGA- 211
G88 TTCCGACGATTATCGGGATTATTATAGGGAACTATTTTTATATCATACAGTATACTGGCT 656
T.castaneum ------------------------------------------------------CCGGTT 171
H.virescens ------------------------------------------------------CCGGTG 217
Nucleotide sequences highlighted in yellow is the region from where nAChR intron 9
reverse primer has been designed.
Reverse Primer Intron 9: 5’ CCCGATAATCGTCGGAATTTG 3’
4. 2. Genomic DNA extraction from Spodoptera litura
Genomic DNA of Spodoptera litura was extracted (as described in methods 2. 22) using
Qiagen Dneasy Kit.
4. 3. PCR to amplify the region supposed to possess the mutation
The reaction mixture which included designed primers (forward and reverse) template
DNA (genomic DNA Spodoptera litura) and master mix was introduced into PCR
machine and amplified using new high fidelity program (as described in methods 2. 23).
The best annealing temperature was obtained by repeating the experiment at six
different temperatures (from 500 to 55
0 C). Annealing temperature at 54
0 C showed the
best result (fig 27).
The PCR product was run on 1% agarose result. Fig 27 shows the presence of a
prominent band near 2 Kb and the other band was present below 500 bp but it was very
faint.

Page | 68
L1 L2
Fig 27: PCR product of New High Fidelity Program.L1 = 1 Kb Marker (sizes of 1 kb marker
bands are 0.5 kb, 1 kb, 1.5 kb, 2 kb, 3 kb (brightest band), 4 kb, 5 kb, 6 kb, 8 kb and 10 kb
respectively from bottom to top on agarose gel) ; L2 = PCR product.
As the intron 9 size of Spodoptera litura is not known so it was decided to purify the
band near 2 Kb from the gel.
4. 4. Purification of PCR product
As the PCR product obtained was not clean so it was decided to run the PCR product on
1% agarose gel. The band near 2 Kb was excised from the gel and purified (as described
in methods 2. 6). 2µl of purified product was run on 1% agarose gel along with 1Kb
marker. A band near 2 Kb was observed (fig 28).
L1 L2
Fig 28: Gel purified PCR product. L1 = 1 Kb Marker (sizes of 1 kb marker bands are 0.5 kb, 1
kb, 1.5 kb, 2 kb, 3 kb (brightest band), 4 kb, 5 kb, 6 kb, 8 kb and 10 kb respectively from
bottom to top on agarose gel); L2 = PCR product purified from the gel.

Page | 69
4. 5. Ligation of purified PCR product with pGEM-T easy vector
The purified PCR product was ligated (as described in methods 2. 24) with pGEM-T
easy vector.
4. 6. Transformation of E.coli JM 109 strain with ligation mix
E.coli JM 109 strain was transformed with the ligation mix and was grown on
ampicillin containing agar plate. Around 30 colonies grew on the plate. Eight colonies
were randomly picked up. These Eight colonies were subcultured on ampicillin
containing agar plate.
4. 7. Rapid Size Screen of subcultured colonies
Rapid Size Screen (as described in methods 2. 13) was performed on randomly picked 8
colonies. Rapid Size Screen was performed on all these colonies to know whether these
colonies might possess the construct i.e. recombinant plasmid or not.
Fig 29 shows that colonies 6, 20, 23 were slightly higher than the other colonies on the
1% agarose gel. So these three colonies 6, 20 and 23 were picked up and were then
grown in 1.5 ml LB for 3-4 hours in the incubator.
Miniprep (as described in methods 2. 9) was performed to elute the plasmids from these
three colonies.
L1 L2 L3 L4 L5 L6 L7 L8
Fig 29: Rapid Size Screen of subcultured colonies. L1 = E.coli JM109 colony 5; L2 = E.coli
JM109 colony 6; L3 = E.coli JM 109 colony 12; L4 = E.coli JM109 colony 15; L5 = E.coli
JM109 colony 20; L6= E.coli JM109 colony 23; L7= E.coli JM109 colony 27; L8 = E.coli
JM109 colony 30.
4. 8. Restriction digest on the plasmids eluted from colonies 6, 20 and 23
Restriction digest was performed on the eluted plasmids to confirm whether they
possess the insert (i.e. the purified PCR product) or not. From Promega technical
manual (pGEM-T and pGEM-T easy vector systems) EcoRI enzyme was chosen for
restriction digest. EcoRI cuts the pGEM-T easy vector two times. Restriction digest

Page | 70
samples were run on 1% agarose gel.
Fig 30 shows the presence of three bands in colony 6 and colony 20 lanes.
Thus the result confirmed that plasmids eluted from colonies 6 and 20 possessed an
insert (i.e. the purified PCR product).
L1 L2 L3 L4
Fig 30: Restriction digest of plasmids eluted from E.coli JM109 colonies 6, 20, 23.
L1= 1Kb marker (sizes of 1 kb marker bands are 0.5 kb, 1 kb, 1.5 kb, 2 kb, 3 kb (brightest
band), 4 kb, 5 kb, 6 kb, 8 kb and 10 kb respectively from bottom to top on agarose gel); L2=
Plasmid eluted from colony 6 and digested with EcoRI; L3= Plasmid eluted from colony 20 and
digested with EcoRI; L4= Plasmid eluted from colony 23 and digested with EcoRI.
So the plasmid eluted from colony 20 confirmed to possess the insert was sent for
sequencing.
NCBI, nucleotide blast was performed on the sequencing result but no match was
found. So EMBOSS Transeq (EMBL-EBI) program was used to translate nucleotide
sequence to a protein sequence. NCBI, protein blast was performed using all six frame
result. No desired match was found.
So it was decided to change the reverse primer. Reverse primer was designed on
nAChR exon 10. For that NCBI blast was performed using nAChR exon 10 nucleotide
sequence of Plutella xylostella G88 population. nAChR sequence of those insects were
selected which showed maximum score, identity and query coverage. nAChR exon 10
sequence of these insects were aligned with nAChR exon 10 sequence of Plutella
xylostella G88 population using clustal W program. The reverse primer was designed
from the region where the nucleotide sequences were highly similar after alignment.
B.mori AACAGGATGCGAGAGTTGGAGCTAAAAGAGCGTTCGTCTAAGTCGCTGTTAGCCAACGTG 1095
H.virescens ACGAGGATGAGGGAGCTGGAACTGAAGGAGAGGTCGTCGAAGTCCTTGCTGGCGAATGTT 1140
G88 AACCGCATGAGGGAGCTGGAGCTCAAGGAGAGGTCCTCAAAGTCTCTGCTGGCGAATGTG 150

Page | 71
Nucleotide sequences highlighted in yellow is the region from where nAChR exon10
reverse primer has been designed.
Reverse primer exon 10: 5’ ACATTCGCCAGCAGAGACTT 3’
Unfortunately further experiments could not be conducted due to the loss of the
Spodoptera litura population.
It was also decided to check whether Plutella xylostella NOQA population has same
mechanism of resistance as Plutella xylostella Pearl City population. Whether NOQA
population is resistant to spinosad is not known.
So it was decided to amplify the ninth intron splice junction of nAChR of NOQA. The
primers were designed by keeping this criterion in mind.
As the nAChR sequence of Plutella xylostella is available so the forward primer was
designed on exon 9 and reverse primer on intron 9.
Forward Primer Exon 9: 5’ GCATCATGTTCATGGTGGCG 3’
Reverse Primer Intron 9: 5’ CCCGATAATCGTCGGAATTTG 3’
Genomic DNA of NOQA was extracted (as described in methods 2. 21). The extracted
genomic DNA of NOQA was run on 1% agarose gel (fig 31).
Fig 31 shows the presence of a single clear band.
Fig 31: Genomic DNA of NOQA.
PCR was performed using New High Fidelity Program. The best annealing temperature
was obtained by repeating the experiment at five different temperatures (from 500 to
540C). Annealing temperature at 54
0C showed the best result (fig 32).
Fig 32 shows the presence of a very prominent band near 500bp and one other band that
was very faint and well below 500bp. As the primers were designed to amplify around
500 bp, the band around 500 bp was purified from the gel.
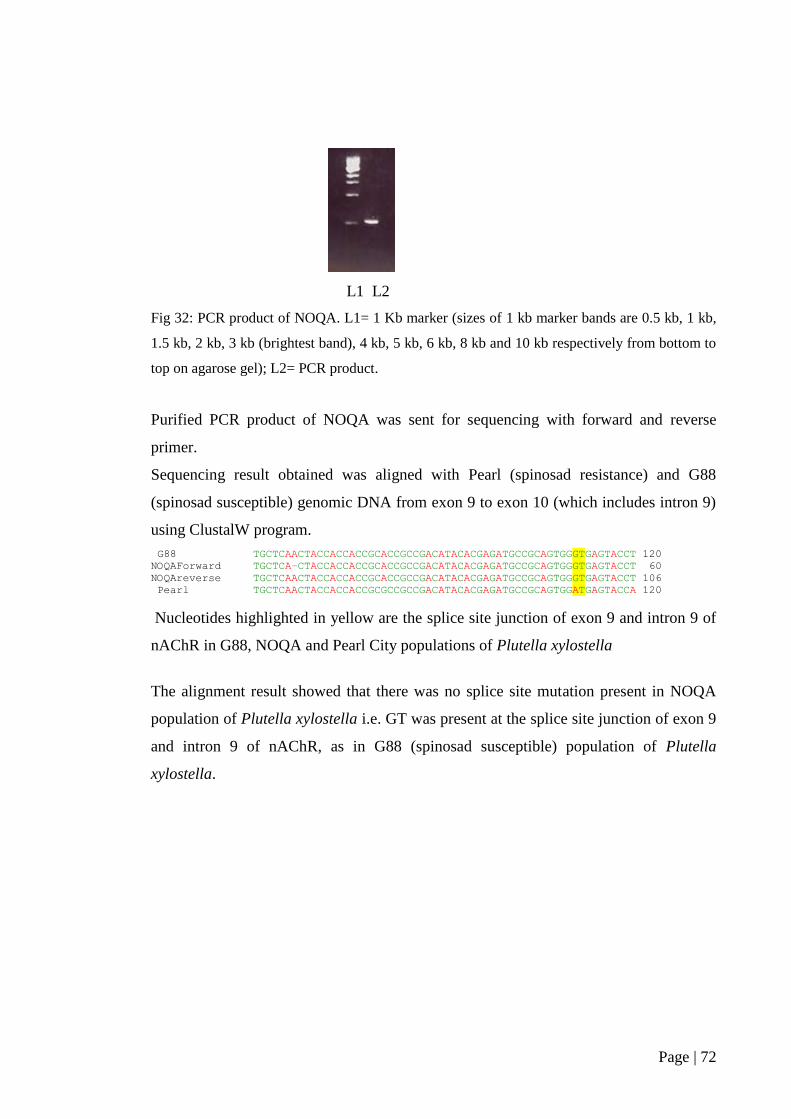
Page | 72
L1 L2
Fig 32: PCR product of NOQA. L1= 1 Kb marker (sizes of 1 kb marker bands are 0.5 kb, 1 kb,
1.5 kb, 2 kb, 3 kb (brightest band), 4 kb, 5 kb, 6 kb, 8 kb and 10 kb respectively from bottom to
top on agarose gel); L2= PCR product.
Purified PCR product of NOQA was sent for sequencing with forward and reverse
primer.
Sequencing result obtained was aligned with Pearl (spinosad resistance) and G88
(spinosad susceptible) genomic DNA from exon 9 to exon 10 (which includes intron 9)
using ClustalW program.
G88 TGCTCAACTACCACCACCGCACCGCCGACATACACGAGATGCCGCAGTGGGTGAGTACCT 120
NOQAForward TGCTCA–CTACCACCACCGCACCGCCGACATACACGAGATGCCGCAGTGGGTGAGTACCT 60
NOQAreverse TGCTCAACTACCACCACCGCACCGCCGACATACACGAGATGCCGCAGTGGGTGAGTACCT 106
Pearl TGCTCAACTACCACCACCGCGCCGCCGACATACACGAGATGCCGCAGTGGATGAGTACCA 120
Nucleotides highlighted in yellow are the splice site junction of exon 9 and intron 9 of
nAChR in G88, NOQA and Pearl City populations of Plutella xylostella
The alignment result showed that there was no splice site mutation present in NOQA
population of Plutella xylostella i.e. GT was present at the splice site junction of exon 9
and intron 9 of nAChR, as in G88 (spinosad susceptible) population of Plutella
xylostella.

Page | 73
4. 9. Discussion
Baxter and his colleagues showed that field based resistance to spinosad in a Plutella
xylostella strain collected from Pearl city, Hawaii is due to the point mutation in the
ninth intron splice junction of nAChR Pxα6. A point mutation at the 5’ donor site of
intron 9 (GT changed to AT) causes mRNA mis-splicing which leads to the addition of
40 bases into the mRNA of the resistant population. This mutation causes a premature
termination codon between transmembrane domain 3 and 4 and is the likely functional
cause of resistance in Plutella xylostella strain collected from Pearl city, Hawaii (Baxter
et al., 2010).
Perry and his collegues showed that deletion of D alpha 6 subunit of nAChR causes
high level of resistance to spinosad in Drosophila melanogaster without being lethal. D
alpha 6 strain of Drosophila melanogaster showed 1181 fold resistance to spinosad
(Perry et al., 2007).
Hence it was decided to check whether or not spinosad resistant Spodoptera litura
population collected from the fields of Pakistan has a similar mechanism of resistance
(i.e. splice-site mutation) as Plutella xylostella Pearl population.
So it was decided to amplify the nAChR intron 9 (including the splice junction) of
Spodoptera litura.
As the nAChR sequence of Spodoptera litura is not available so BLAST (NCBI) was
performed using the nAChR exon 9 nucleotide sequence of Plutella xylostella G88
population. This was done because Plutella xylostella and Spodoptera litura belong to
the order Lepidoptera. nAChR exon 9 sequence of those insects which showed
maximum score, identity and query coverage were selected and these sequences were
aligned with Plutella xylostella nAChR exon 9 sequence using Clustal W program. The
forward primer was designed from the region where the nucleotide sequences were
highly similar after alignment.
The reverse primer was designed from the intron 9 sequence of Plutella xylostella
because the alignment scores of different insects were very low.
PCR was performed to amplify the nAChR intron 9 (including the splice junction) of
Spodoptera litura.
The results showed the presence of a prominent band near 2 Kb and the other band
present was below 500 bp but it was very faint.
As the intron 9 size of Spodoptera litura is not known so it was decided to purify the
band near 2 Kb from the gel as it was the most prominent band.

Page | 74
The 2 Kb band was purified from the gel and cloned into pGEM-T easy vector and was
then transformed into E.coli JM109 strain. Rapid Size Screen was performed on
selected colonies. The result showed that colonies 6, 20 and 23 might possess the
recombinant plasmid.
Plasmids eluted from the colonies 6, 20 and 23 were restriction digested with EcoRI.
EcoRI cuts the pGEM-T easy vector two times.
The plasmids eluted from colonies 6, 20 when digested with EcoRI produced 3 bands.
Thus confirming that plasmids eluted from these two colonies possessed the insert (i.e
the purified PCR product).
So the plasmid eluted from colony 20 confirmed to possess the insert was sent for
sequencing.
NCBI, nucleotide blast was performed on the sequencing result but no match was
found. So EMBOSS Transeq (EMBL-EBI) program was used to translate nucleotide
sequence to a protein sequence. NCBI, protein blast was performed using all six frame
result. No desired match was found.
Thus PCR performed to amplify the nAChR intron 9 (including the splice junction) of
Spodoptera litura was unsuccessful.
So it was decided to change the reverse primer. Reverse primer was decided to be
designed on nAChR exon 10. For that NCBI, blast was performed using nAChR exon
10 nucleotide sequence of Plutella xylostella G88 population. nAChR sequence of
those insects were selected which showed maximum score, identity and query coverage.
nAChR exon 10 sequence of these insects were aligned with nAChR exon 10 sequence
of Plutella xylostella G88 population using clustal W program. The reverse primer was
designed from the region where the nucleotide sequences were highly similar after
alignment.
Unfortunately further experiments could not be conducted due to the loss of Spodoptera
litura population.
Future Work on Spodoptera litura:
Forward primer exon 9 and reverse primer exon 10 would be used to carry on the PCR
and rest of the experiments would be similar to the previous work and if it does not
work then total RNA would be extracted from spinosad resistant Spodoptera litura and
then cDNA would be generated from it. Then cDNA would be cloned and sequenced.
From cDNA sequence it would be looked for whether intron splicing occurred after 40
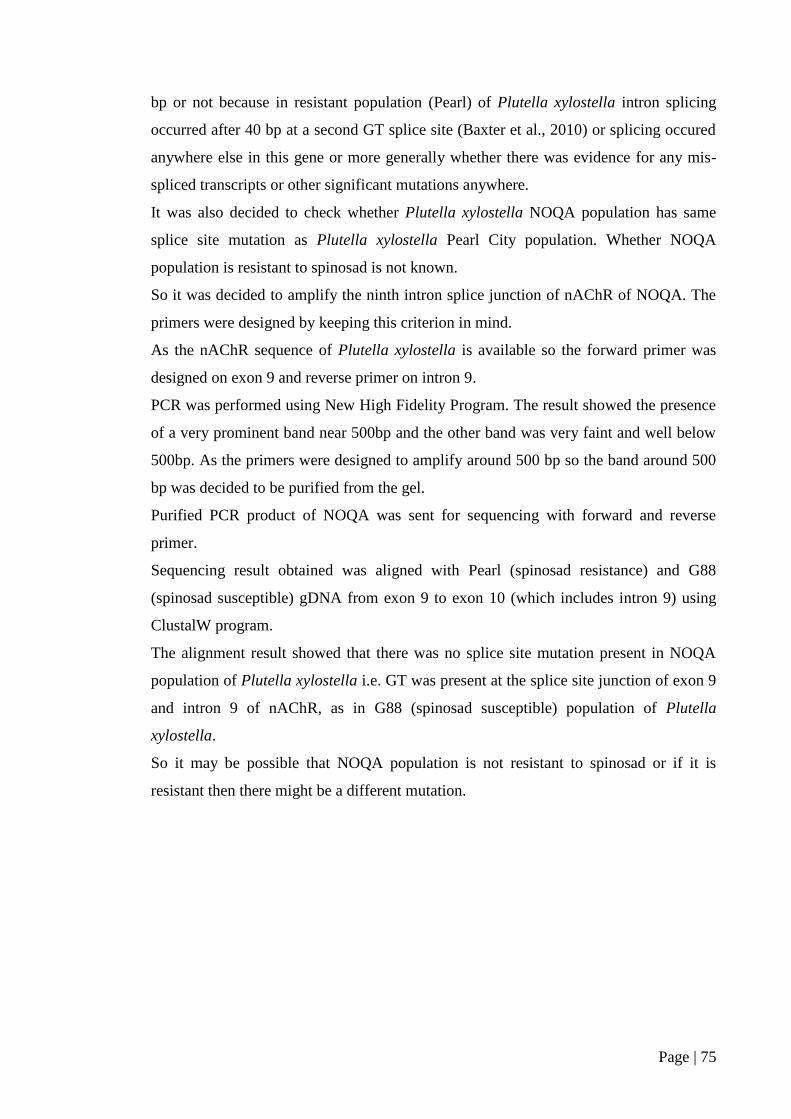
Page | 75
bp or not because in resistant population (Pearl) of Plutella xylostella intron splicing
occurred after 40 bp at a second GT splice site (Baxter et al., 2010) or splicing occured
anywhere else in this gene or more generally whether there was evidence for any mis-
spliced transcripts or other significant mutations anywhere.
It was also decided to check whether Plutella xylostella NOQA population has same
splice site mutation as Plutella xylostella Pearl City population. Whether NOQA
population is resistant to spinosad is not known.
So it was decided to amplify the ninth intron splice junction of nAChR of NOQA. The
primers were designed by keeping this criterion in mind.
As the nAChR sequence of Plutella xylostella is available so the forward primer was
designed on exon 9 and reverse primer on intron 9.
PCR was performed using New High Fidelity Program. The result showed the presence
of a very prominent band near 500bp and the other band was very faint and well below
500bp. As the primers were designed to amplify around 500 bp so the band around 500
bp was decided to be purified from the gel.
Purified PCR product of NOQA was sent for sequencing with forward and reverse
primer.
Sequencing result obtained was aligned with Pearl (spinosad resistance) and G88
(spinosad susceptible) gDNA from exon 9 to exon 10 (which includes intron 9) using
ClustalW program.
The alignment result showed that there was no splice site mutation present in NOQA
population of Plutella xylostella i.e. GT was present at the splice site junction of exon 9
and intron 9 of nAChR, as in G88 (spinosad susceptible) population of Plutella
xylostella.
So it may be possible that NOQA population is not resistant to spinosad or if it is
resistant then there might be a different mutation.

Page | 76
References
Adams, L.F., Brown, K.L. and Whiteley, H.R. (1991). Molecular cloning and
characterization of two genes encoding sigma factors that direct transcription from a
Bacillus thuringiensis crystal protein gene promoter. Journal of Bacteriology
173(12):3846-54.
Agaisse, H. and Lereclus, D. (1994). Structural and functional analysis of the
promoter region involved in full expression of the CryIII A toxin gene of Bacillus
thuringiensis. Molecular Microbiology 13(1):97-107.
Agaisse, H. and Lereclus, D. (1995). How does Bacillus thuringiensis produce so
much insecticidal crystal protein? Journal of Bacteriology 177(21):6027-32.
Agaisse, H. and Lereclus, D. (1996). STAB-SD: a Shine-Dalgarno sequence in the 5’
untranslated region is a determinant of mRNA stability. Molecular Microbiology
20(3):633-43.
Angst, B.D., Marcozzi, C., M. and Magee, A.I. (2001). The cadherin superfamily:
diversity in form and function. Journal of Cell Science 114: 629-41.
Aronson, A.I., Han, E.S., McGaughey, W. and Johnson, D. (1991). The solubility of
inclusion proteins from Bacillus thuringiensis is dependent upon protoxin composition
and is a factor in toxicity to insects. Applied and Environmental Microbiology 57(4):
981-86.
Aronson, A.I., Geng, C., Wu, L. (1999). Aggregation of Bacillus thuringiensis Cry1A
toxins upon binding to target insect larval midgut vesicles. Applied and Environmental
Microbiology 65(6):2503-7.
Baum, J.A. and Malvar, T. (1995). Regulation of insecticidal crystal protein
production in Bacillus thuringiensis. Molecular Microbiology 18(1):1-12.
Page | 77
Baxter, S.W., Zhao, J.Z., Gahan, L.J., Shelton, A.M., Tabashnik, B.E. and Heckel,
D.G. (2005). Novel genetic basis of field-evolved resistance to Bt toxins in Plutella
xylostella. Insect Molecular Biology 14(3):327-334.
Baxter, S.W., Zhao, J.Z., Shelton, A.M., Vogel, H. and Heckel, D.G. (2008). Genetic
mapping of Bt-toxin binding proteins in a Cry1A-toxin resistant strain of diamondback
moth Plutella xylostella. Insect Biochemistry and Molecular Biology 38:125-135.
Baxter, S.W., Chen, M., Dawson, A., Zhao, J-Z, Vogel, H., Shelton, A.M., Heckel,
D.G., Jiggins, C.D. (2010). Mis-spliced transcripts of nicotinic acetylcholine
receptor6 are associated with field evolved spinosad resistance in Plutella
xylostella(L.). PLoS Genet 6(1): e1000802.doi:10.1371/journal.pgen.
Bietlot, H.P., Vishnubhatla, I., Carey, P.R., Pozsgay, M. and Kaplan, H. (1990).
Characterization of the cysteine residues and disulphide linkages in the protein crystal
of Bacillus thuringiensis. Biochem J 260: 87-91.
Boonserm, P., Davis, P., Ellar, D.J., Li, J. (2005). Crystal structure of the mosquito-
larvicidal toxin Cry4Ba and its biological implications. Journal of Molecular Biology
348: 363-82
Bravo, A., Sanchez, J., Kouskoura, T. and Crickmore, N. (2002). N-terminal
activation is an essential early step in the mechanism of action of the Bacillus
thuringiensis Cry1Ac insecticidal toxin. The Journal of Biological Chemistry
277(27):23985-87.
Bravo, A. and Soberon, M. (2008). How to cope with insect resistance to Bt toxins?
Trends in biotechnology 26(10): 573-579.
Brown, K.L. and Whiteley, H.R. (1988). Isolation of a Bacillus thuringiensis RNA
polymerase capable of transcribing crystal protein genes. Proc. Natl. Acad.Sci USA
85:4166-4170.

Page | 78
Brown, K.L. and Whiteley, H.R. (1990). Isolation of the second Bacillus thuringiensis
RNA polymerase that transcribes from a crystal protein gene promoter. Journal of
Bacteriology 172(12):6682-88.
Bruce, M.J., Gatsi, R., Crickmore, N. and Sayyed, A.H. (2007). Mechanisms of
resistance to Bacillus thuringiensis in the diamondback moth. Biopestic.Int. 3(1): 1-12.
Carlson, C.R., Caugant, D.A. and Kolsto, A.B. (1994). Genotypic diversity among
Bacillus cereus and Bacillus thuringiensis strains. Applied and Environmental
Microbiology 60(6):1719-25.
Carlson, C.R., Johansen, T., Lecadate, M.M. and Kolsto, A.B. (1996). Genomic
organization of the entomopathogenic bacteri urn Bacillus thuringiensis subsp. berliner
171 5. Microbiology 142:1625-1634.
Chen, J., Hua, G., Jurat-Fuentes, J.L., Abdullah, M.A., Adang, M.J. (2007).
Synergism of Bacillus thuringiensis toxins by a fragment of a toxin-binding cadherin.
PNAS 104(35): 13901-13906.
Cranshaw, W.S. (2008). Bacillus thuringiensis.
http://www.ext.colostate.edu/pubs/insect/05556.html, excessed online on 26th
July 2011
Crickmore, N. (2005). Using worms to better understand how Bacillus thuringiensis
kills insects. Trends in Microbiology 13(8): 347-350.
Crickmore, N., Zeigler, D.R., Feitelson, J., Schnepf, E., Van Rie, J., Lereclus, D.,
Baum, J. and Dean, D.H. (1998). Revision of the nomenclature for the Bacillus
thuringiensis pesticidal crystal proteins. Microbiol Mol Biol Rev 62: 807-13.
Crickmore, N., Zeigler, D.R., Schnepf, E., Van Rie, J., Lereclus, D., Baum, J,
Bravo, A. and Dean, D.H. (2011) Bacillus thuringiensis toxin nomenclature
http://www.lifesci.sussex.ac.uk/Home/Neil_Crickmore/Bt/
De Lucca, A.J., 2nd, Palmgren, M.S. and De Barjac, H. (1984). A new serovar of

Page | 79
Bacillus thuringiensis from grain dust: Bacillus thuringiensis serovar colmeri (serovar
21). J.Invertebr.Pathol. 43: 437-38.
de Maagd, R.A., Kwa, M.S., van der Klei, H., Yamamoto, T., Schipper, B., Vlak,
J.M., Stiekema, W.J. and Bosch, D. (1996). Domain III substitution in Bacillus
thuringiensis delta-endotoxin CryIA(b) results in superior toxicity for Spodoptera
exigua and altered membrane protein recognition. Applied and Environmental
Microbiology 62(5):1537-1543.
de Maagd, R.A., Bravo, A. and Crickmore, N. (2001). How Bacillus thuringiensis
has evolved specific toxins to colonize the insect world. TRENDS in genetics 17(4):193-
199.
de Maagd, R.A., Bravo, A., Berry, C., Crickmore, N. and Schnepf, H.E.(2003).
Structure, diversity, and evolution of protein toxins from spore-forming
entomopathogenic bacteria. Annu. Rev. Genet.37:409-433.
Ding, X., Luo, Z., Xia, L., Gao, B., Sun, Y., Zhang, Y. (2008). Improving the
Insecticidal Activity by Expression of a Recombinant cry1Ac Gene with Chitinase-
Encoding Gene in Acrystalliferous Bacillus thuringiensis. Curr.Microbiol 56: 442-446.
Dorsch, J.A., Candas, M., Griko, N.B., Maaty, W.S.A, Midboe, E.G., Vadlamudi,
R.K., Bulla Jr., L.A. (2002). Cry1A toxins of Bacillus thuringiensis bind specifically
to a region adjacent to the membrane-proximal extracellular domain of BT-R1 in
Manduca sexta: involvement of a cadherin in the entomopathogenicity of Bacillus
thuringiensis. Insect Biochemistry and Molecular Biology 32: 1025-1036.
Enayati, A.A., Ranson, H. and Hemingway, J. (2005). Insect glutathione
transferases and insecticide resistance. Insect Molecular Biology 14(1):3-8.
Errington, J. (1993). Bacillus subtilis sporulation: regulation of gene expression and
control of morphogenesis. Microbiological Reviews 57(1):1-33.
Espinasse, S., Chaufaux, J., Buisson, C., Perchat, S., Gohar, M., Bourguet, D.,
Sanchis, V. (2003). Occurrence and linkage between secreted insecticidal toxins in
Page | 80
natural isolates of Bacillus thuringiensis. Current Microbiology 47:501-507.
Ferre, J. and Van Rie, J. (2002). Biochemistry and genetics of insect resistance to
Bacillus thuringiensis. Annu. Rev. Entomol. 47: 501-533.
Feyereisen, R. (1999). Insect P450 enzymes. Annu. Rev. Entomol. 44: 507-573.
Francis, B.R. and Bulla Jr., L.A. (1997). Further characterization of BT-R1, the
cadherin-like receptor for Cry lAb toxin in tobacco hornworm (Manduca sexta)
midguts. Insect Biochemistry and Molecular Biology 27(6):541-550.
Franklin, M.T., Nieman, C.L., Janmaat, A.F., Soberon, M., Bravo, A., Tabashnik,
B.E. and Myers, J.H. (2009). Modified Bacillus thuringiensis Toxins and a Hybrid
B.thuringiensis Strain Counter Greenhouse-Selected Resistance in Trichoplusia ni.
Applied and Environmental Microbiology 75(17):5739-5741.
Gahan, L.J., Gould, F. and Heckel, D.G. (2001). Identification of a gene associated
with Bt resistance in Heliothis virescens. Science 293: 857-860.
Gahan, L.J., Pauchet, Y., Vogel, H., Heckel, D.G. (2010). An ABC transporter
mutation is correlated with insect resistance to Bacillus thuringiensis Cry1Ac toxin.
PLOS Genetics 6(12): 1-11. e1001248.
Ge, A.Z., Pfister, R.M. and Dean, D.H. (1990). Hyperexpression of a Bacillus
thuringiensis delta-endotoxin-encoding gene in Escherichia coli: properties of the
product. Gene 93:49-54.
Gill, S.S., Cowles, E.A. and Pietrantonio, P.V. (1992). The mode of action of
Bacillus thuringiensis endotoxins. Annu. Rev.Entomol. 37:615-36.
Gomez, I., Sanchez, J., Miranda, R., Bravo, A. and Soberon, M. (2002a). Cadherin-
like receptor binding facilitates proteolytic cleavage of helix -1 in domain I and
oligomer pre-pore formation of Bacillus thuringiensis Cry 1Ab toxin. FEBS Letters
513: 242-246.

Page | 81
Gomez, I., Miranda-Rios, J., Rudino-Pinera, E., Oltean, D.I., Gill, S.S., Bravo, A.
and Soberon, M. (2002b). Hydropathic complementarity determines interaction of
epitope 869HITDTNNK876 in Manduca sexta Bt-R1 receptor with loop 2 of domain II
of Bacillus thuringiensis Cry1A toxins. The Journal of Biological Chemistry
277(33):30137-30143.
Gomez, I., Pardo-Lopez, L., Munoz-Garay, C., Fernandez, L.E., Perez, C.,
Sanchez, J., Soberon, M. and Bravo, A. (2007). Role of receptor interaction in the
mode of action of insecticidal Cry and Cyt toxins produced by Bacillus thuringiensis.
Peptides 28(1): 169-173.
Grauso, M., Reenan, R.A., Culetto, E. and Sattelle, D.B. (2002). Novel putative
nicotinic acetylcholine receptor subunit genes, Dalpha5, Dalpha6 and Dalpha7, in
Drosophila melanogaster identify a new and highly conserved target of adenosine
deaminase acting on RNA-mediated A-to-I pre-mRNA editing. Genetics 160:1519-
1533.
Griffitts, J.S. and Aroian, R.V. (2005). Many roads to resistance: how invertebrates
adapt to Bt toxins. BioEssays 27: 614-624.
Griffitts, J.S., Huffman, D.L., Whitacre, J.L., Barrows, B.D., Marroquin, L.D.,
Muller, R., Brown, J.R., Hennet, T., Esko, J.D. and Aroian, R.V. (2003). Resistance
to a bacterial toxin is mediated by removal of a conserved glycosylation pathway
required for toxin-host interactions. The Journal of Biological Chemistry
278(46):45594-45602.
Grochulski, P., Masson, L., Borisova, S., Pusztai-Carey, M., Schwartz, J-L,
Brousseau, R. and Cygler, M. (1995). Bacillus thuringiensis CrylA(a) insecticidal
toxin: crystal structure and channel formation. J.Mol.Biol.254:447-464.
Guillemaud, T., Rooker, S., Pasteur, N. and Raymond, M. (1996). Testing the
unique amplification event and the worldwide migration hypothesis of insecticide
resistance genes with sequence data. Heredity 77:535-543.

Page | 82
Gunning, R.V., Dang, H.T., Kemp, F.C., Nicholson, I.C. and Moores, G.D.(2005).
New resistance mechanism in Helicoverpa armigera threatens transgenic crops
expressing Bacillus thuringiensis Cry1Ac toxin. Appl.Environ.Microbiol.71(5):2558-
2563.
Gumbiner (1996). Cell adhesion: the molecular basis of tissue architecture and
morphogenesis. Cell 84:345-357.
Heckel, D.G., Gahan, L.J., Liu, Y-B and Tabashnik, B.E. (1999). Genetic mapping
of resistance to Bacillus thuringiensis toxins in diamondback moth using biphasic
linkage analysis. Proc.Natl.Acad.Sci USA 96:8373-8377.
Heckel, D.G., Gahan, L.J., Baxter, S.W., Zhao, J-Z, Shelton, A.M., Gould, F. and
Tabashnik, B.E. (2007). The diversity of Bt resistant genes in species of Lepidoptera.
Journal of Invertebrate Pathology 95(3):192-197.
Hendriksen, N.B. and Hansen, B.M. (2002). Long-term survival and germination of
Bacillus thuringiensis var. kurstaki in a field trial. Can.J.Microbiol. 48:256-261.
Herrero, S., Oppert, B. And Ferre, J. (2001). Different mechanisms of resistance to
Bacillus thuringiensis toxins in the Indianmeal moth. Applied and Environmental
Microbiology 67(3):1085-1089.
Herrero, S., Gechev, T., Bakker, P.L., Moar, W.J. and de Maagd, R.A. (2005).
Bacillus thuringiensis Cry1Ca-resistant Spodoptera exigua lacks expression of one of
four Aminopeptidase N genes. BMC Genomics 6:96.
Hofte, H. and Whiteley, H.R. (1989). Insecticidal crystal proteins of Bacillus
thuringiensis. Microbiological Reviews 53(2): 242-255.
Hossain, D.M., Shitomi, Y., Nanjo, Y., Takano, D., Nishiumi, T., Hayakawa, T.,
Mitsui, T., Sato, R. and Hori, H. (2005). Localization of a novel 252-kDa plasma
membrane protein that binds Cry1A toxins in the midgut epithelia of Bombyx mori.
Appl.Entomol.Zool. 40(1):125-135.
Page | 83
Jaquet, F., Hutter, R. and Luthy, P. (1987). Specificity of Bacillus thuringiensis
delta-endotoxin. Applied and Environmental Microbiology 53(3):500-504.
Jurat-Fuentes, J.L. and Adang, M.J. (2004). Characterization of a Cry1Ac-receptor
alkaline phosphatase in susceptible and resistant Heliothis virescens larvae.
Eur.J.Biochem 271:3127-3135.
Jurat-Fuentes, J.L., Gahan, L.G., Gould, F.L., Heckel, D.G. and Adang, M.J.
(2004). The HevCaLP Protein Mediates Binding Specificity of the Cry1A Class of
Bacillus thuringiensis Toxins in Heliothis Virescens. Biochemistry 43:14299-14305.
Keim, P., Kalif, A., Schupp, J, Hill, K., Travis, S.E., Richmond, K., Adair, D.M.,
Hugh-Jones, M., Kuske, C.R. and Jackson, P. (1997). Molecular evolution and
diversity in Bacillus anthracis as detected by amplified fragment length polymorphism
markers. Journal of Bacteriology 179(3):818-824.
Knowles, B.H. and Dow, J.A.T. (1993). The crystal -endotoxins of Bacillus
thuringiensis : models for their mechanism of action on the insect gut. BioEssays 15(7):
469-476.
Kronstad, J.W. and Whiteley, H.R. (1984). Inverted repeat sequences flank a
Bacillus thuringiensis crystal protein gene. Journal of Bacteriology 160(1):95-102.
Lecadet, M-M. and Martouret, D. (1987). Host specificity of the Bacillus
thuringiensis δ-endotoxin toward lepidopteran species: Spodoptera littoralis Bdv. and
Pieris brassicae L. Journal of Invertebrate Pathology 49:37-48.
Lee, M.K., Rajamohan, F., Gould, F., Dean, D.H. (1995). Resistance to Bacillus
thuringiensis CryIA δ-endotoxins in a laboratory-selected Heliothis virescens strain is
related to receptor alteration. Applied and Environmental Microbiology 61(11):3836-
3842.
Lee, M.K., You, T.H., Gould, F.L. and Dean, D.H. (1999). Identification of residues

Page | 84
in domain III of Bacillus thuringiensis Cry1Ac toxin that affect binding and toxicity.
Applied and Environmental Microbiology 65(10):4513-4520.
Lee, M.K., Rajamohan, F., Jenkins, J.L., Curtiss, A.S. and Dean, D.H. (2000). Role
of two arginine residues in domain II, loop 2 of Cry1Ab and Cry1Ac Bacillus
thuringiensis δ-endotoxin in toxicity and binding to Manduca sexta and Lymantria
dispar aminopeptidase N. Molecular Microbiology 38(2):289-298.
Lee, M.K., Jenkins, J.L., You, T.H., Curtiss, A., Son, J.J., Adang, M.J. and Dean,
D.H. (2001). Mutations at the arginine residues in α8 loop of Bacillus thuringiensis δ-
endotoxin Cry1Ac affect toxicity and binding to Manduca sexta and Lymantria dispar
aminopeptidase N. FEBS Letters 497: 108-112.
Lereclus, D., Menou, G. and Lecadet, M-M. (1983). Isolation of a DNA sequence
related to several plasmids from Bacillus thuringiensis after a mating involving the
Streptococcus faecalis plasmid pAMβ1. Mol.Gen.Genet.191:307-313.
Lereclus, D., Ribier, J., Klier, A., Menou, G. and Lecadet, M-M. (1984). A
transposon-like structure related to the δ-endotoxin gene of Bacillus thuringiensis. The
EMBO Journal 3(11):2561-2567.
Li, J., Carroll, J. and Ellar, D.J. (1991). Crystal structure of insecticidal δ-endotoxin
from Bacillus thuringiensis at 2.5 A0 resolution. Nature 353: 815-821.
Li, H., Oppert, B., Higgins, R.A., Huang, F., Zhu, K.Y. and Buschman, L.L.
(2004). Comparative analysis of proteinase activities of Bacillus thuringiensis-resistant
and -susceptible Ostrinia nubilalis (Lepidoptera: Crambidae). Insect Biochemistry and
Molecular Biology 34: 753-762.
Li, H., Oppert, B., Higgins, R.A., Huang, F., Buschman, L.L., Gao, J-R., Zhu, K.Y.
(2005). Characterization of cDNAs encoding three trypsin-like proteinases and mRNA
quantitative analysis in Bt-resistant and –susceptible strains of Ostrinia nubilalis. Insect
Biochemistry and Molecular Biology 35: 847-860.

Page | 85
Liang, Y., Patel, S.S. and Dean, D.H. (1995). Irreversible binding kinetics of Bacillus
thuringiensis CryIA δ-endotoxins to Gypsy moth brush border membrane vesicles is
directly correlated to toxicity. The Journal of Biological Chemistry 270(42):24719-
24724.
Loseva, O., Ibrahim, M., Candas, M., Koller, C.N., Bauer, L.S., Bulla Jr., L.A.
(2002). Changes in protease activity and Cry3Aa toxin binding in the Colorado potato
beetle: implications for insect resistance to Bacillus thuringiensis toxins. Insect
Biochemistry and Molecular Biology 32: 567-577.
Losick, R. and Stragier, P. (1992). Crisscross regulation of cell-type-specific gene
expression during development in B.Subtilis. Nature 355:601-604.
Luo, K., Sangadala, S., Masson, L., Mazza, A., Brousseau, R. and Adang, M.J.
(1997). The Heliothis virescens 170 kDa aminopeptidase functions as “Receptor A” by
mediating specific Bacillus thuringiensis Cry1A δ-endotoxin binding and pore
formation. Insect Biochemistry and Molecular Biology 27(8/9): 735-743.
Ma, G., Roberts, H., Sarjan, M., Featherstone, N., Lahnstein, J., Akhurst, R.,
Schmidt, O. (2005). Is the mature endotoxin Cry1Ac from Bacillus thuringiensis
inactivated by a coagulation reaction in the gut lumen of resistant Helicoverma
armigera larvae? Insect Biochemistry and Molecular Biology 35:729-739.
MacIntosh, S.C., Kishore, G.M., Perlak, F.J., Marrone, P.G., Stone, T.B., Sims,
S.R. and Fuchs, R.L. (1990). Potentiation of Bacillus thuringiensis insecticidal activity
by serine protease inhibitors. Journal of agricultural and food chemistry 38(4):1145-
1152.
Mahillon, J., Rezsohazy, R., Hallet, B. and Delcour, J. (1994). IS231 and other
Bacillus thuringiensis transposable elements: a review. Genetica 93:13-26.
Martinez, C. and Caballero, P. (2002). Contents of cry genes and insecticidal toxicity
of Bacillus thuringiensis strains from terrestrial and aquatic habitats. Journal of applied
microbiology 92: 745-752.

Page | 86
Masson, L., Lu, Y.J., Mazza, A., Brousseau, R. and Adang, M.J. (1995). The
CryIA(c) receptor purified from Manduca sexta displays multiple specificities. Journal
of biological chemistry 270(35): 20309-20315.
Masson, L., Mazza, A., Gringorten, J. L., Baines, D.,Anelunias, V. & Brousseau,
R. (1994). Specificity domain localization of Bacillus thuringiensis insecticidal CryIA
toxins is highly dependent on the bioassay system. Mol. Microbiol. 14: 851–860.
McNall, R.J. and Adang, M.J. (2003). Identification of novel Bacillus thuringiensis
Cry1Ac binding proteins in Manduca sexta midgut through proteomic analysis. Insect
biochemistry and molecular biology 33: 999-1010.
Meadows, M.P., Ellis, D.J., Butt, J., Jarrett, P. and Burges, H.D. (1992).
Distribution, frequency and diversity of Bacillus thuringiensis in an animal feed mill.
Appl. Environ. Microbiol. 58: 1344-1350.
Milne, R.E., Pang, A.S.D. and Kaplan, H. (1995). A protein complex from
Choristoneura fumiferana gut-juice involved in the precipitation of δ- endotoxin from
Bacillus thuringiensis subsp. sotto. Insect biochemistry and molecular biology 25(10):
1101-1114.
Moar, W.J., Pusztai-Carey, M., Faassen, H.V., Bosch, D., Frutos, R., Rang, C.,
Luo, K. and Adang, M.J. (1995). Development of Bacillus thuringiensis CryIC
Resistance by Spodoptera exigua (Hubner) (Lepidoptera: Noctuidae). Applied and
Environmental Microbiology 61(6): 2086-2092.
Morin, S., Biggs, R.W., Sisterson, M.S., Shriver, S., Ellers-Kirk, C., Higginson, D.,
Holley, D., Gahan, L.J., Heckle, D.G., Carriere, Y., Dennehy, T.J., Brown, J.K. and
Tabashnik, B.E. (2003). Three cadherin alleles associated with resistance to Bacillus
thuringiensis in pink bollworm. PNAS 100(9): 5004-5009.
Nagamatsu, Y., Toda, S., Yamaguchi, F., Ogo, M., Kogure, M., Nakamura, M.,
Shibata, Y. and Katsumoto, T (1998). Identification of Bombyx mori midgut receptor
for Bacillus thuringiensis insecticidal CryIA(a) toxin. Biosci. Biotechnol.Biochem
Page | 87
.62(4):718-726.
Ono, M., Swanson, J.J., Field, L.M., Devonshire, A.L. and Siegfried, B.D. (1999).
Amplification and methylation of an esterase gene associated with insecticide-resistance
in green bugs, Schizaphis graminum ( Rondani) (Homoptera: Aphididae). Insect
Biochemistry and Molecular Biology 29:1065-1073.
Oppert, B. (1999). Protease interactions with Bacillus thuringiensis insecticidal toxins.
Archives of Insect Biochemistry and Physiology 42 : 1-12.
Oppert, B., Kramer, K.J., Beeman, R.W., Johnson, D. and Mcgaughey, W.H.
(1997). Proteinase- mediated insect resistance to Bacillus thuringiensis toxins. The
Journal of biological chemistry 272(38):23473-23476.
Pang, A.S.D. and Gringorten, J.L. (1998). Degradation of Bacillus thuringiensis δ-
endotoxin in host insect gut juice. FEMS Microbiology Letters 167:281-285.
Pardo-Lopez, L., Munoz-Garay, C., Porta, H., Rodriguez-Almazan, C., Soberon,
M. and Bravo,A. (2009). Strategies to improve the insecticidal activity of Cry toxins
from Bacillus thuringiensis. Peptides 30: 589-595.
Perry, T., Mckenzie, J.A., Batterham, P. (2007). A D6 knockout strain of
Drosophila melanogaster confers a high level of resistance to spinosad. Insect
Biochemistry and Molecular Biology 37: 184-188.
Piggot, C.R. and Ellar, D.J. (2007). Role of receptors in Bacillus thuringiensis crystal
toxin activity. Microbiology and Molecular Biology Reviews 71(2):255-281.
Prieto-Samsonov, D.L., Vazquez-Padron, R.I., Ayra-Pardo, C., Gonzalez-Cabrera,
J. and de la Riva,G.A. (1997). Bacillus thuringiensis : from biodiversity to
biotechnology. Journal of industrial microbiology & biotechnology 19:202-219.
Qiao, C.-L., Marquine, M., Pasteur, N. and Raymond, M. (1998). A new esterase
gene amplification involved in OP resistance in Culex pipiens mosquitoes from China.

Page | 88
Biochemical Genetics 36(11/12):417-426.
Rajagopal, R., Agrawal, N., Selvapandiyan, A., Sivakumar, S., Ahmad, S. and
Bhatnagar, R.K. (2003). Recombinantly expressed isoenzymic aminopeptidases from
Helicoverpa armigera (American cotton bollworm) midgut display differential
interaction with closely related Bacillus thuringiensis insecticidal proteins. Biochem.
J.370: 971-978.
Rajamohan, F., Alcantara, E., Lee, MI.K., Chen, X.J., Curtiss, A. and Dean, D.H.
(1995). Single Amino Acid Changes in Domain II of Bacillus thuringiensis CryIAb δ-
Endotoxin Affect Irreversible Binding to Manduca sexta Midgut Membrane Vesicles.
Journal of Bacteriology 177(9):2276-2282.
Rajamohan, F., Hussain, S-R.A., Cotrill, J.A., Gould, F. and Dean, D.H. (1996a).
Mutations at Domain II, Loop 3, of Bacillus thuringiensis CryIAa and CryIAb δ-
Endotoxins Suggest Loop 3 Is Involved in Initial Binding to Lepidopteran Midguts. The
Journal of Biological Chemistry 271(41):25220-25226.
Rajamohan, F., Alzate, O., Cotrill, J.A., Gould, F. and Dean, D.H. (1996b). Protein
engineering of Bacillus thuringiensis δ-endotoxin: Mutations at domain II of CryIAb
enhance receptor affinity and toxicity toward gypsy moth larvae. Proc.Natl.Acad. Sci.
USA 93:14338-14343.
Regev, A., Keller, M., Strizhov, N., Sneh, B., Prudovsky, E., Chet, I., Ginzberg, I.,
Koncz-Kalman, Z., Koncz, C., Schell, J. and Zilberstein, A. (1996). Synergistic
activity of a Bacillus thuringiensis δ-endotoxin and a bacterial endochitinase against
Spodoptera littoralis larvae. Applied and Environmental Microbiology 62(10):3581-
3586.
Rinkevic, F.D. and Scott, J.G. (2009). Transcriptional diversity and allelic variation in
nicotinic acetylcholine receptor subunits of the red flour beetle, Tribolium castaneum.
Insect Molecular Biology 18(2): 233-242.
Rooker, S., Guillemaud, T., Berge, J., Pasteur, N. and Raymond, M. (1996).

Page | 89
Coamplification of esterase A and B genes as a single unit in Culex pipiens mosquitoes.
Heredity 77:555-561.
Rukmini, V., Reddy, C.Y. and Venkateshwerlu, G. (2000). Bacillus thuringiensis
crystal δ-endotoxin: Role of proteases in the conversion of protoxin to toxin. Biochimie
82: 109-116.
Salgado, V.L. (1998). Studies on the Mode of Action of Spinosad: Insect symptoms
and Physiological Correlates. Pesticide Biochemistry and Physiology 60:91-102.
Salinas, A.E. and Wong, M.G. (1999). Glutathione S- transferases- A review. Current
Med.Chem. 6: 279-309.
Sarauer, B.L., Gillot, C. and Hegedus, D (2003). Characterization of an intestinal
mucin from the peritrophic matrix of the diamondback moth, Plutella xylostella. Insect
Molecular Biology 12(4):333-343.
Sattelle, D.B., Jones, A.K., Sattelle, B.M., Matsuda, K., Reenan, R. and Biggin,
P.C. (2005). Edit, cut and paste in the nicotinic acetylcholine receptor gene family of
Drosophila melanogaster. BioEssays 27: 366-376.
Sayyed, A.H., Haward, R., Herrero, S., Ferre, J. and Wright, D.J. (2000). Genetic
and biochemical approach for characterization of resistance to Bacillus thuringiensis
toxin Cry1Ac in a field population of the diamondback moth, Plutella xylostella. Appl.
Environ. Microbiol. 66(4):1509-1516.
Sayyed, A.H., Rizvi, M.R. and Alvi, A.H (2002). Management of diamondback
moth, Plutella xylostella (Lepidoptera: Plutellidae) a lesson from South East Asia for
sustainable integrated pest management. Pakistan Journal of Biological Sciences
5(2):234-245.
Sayyed, A.H., Raymond, B., Ibiza-Palacios, M.S., Escriche, B. and Wright, D.J.
(2004 a). Genetic and Biochemical characterization of field evolved resistance to
Bacillus thuringiensis toxin Cry1Ac in the diamondback moth, Plutella xylostella. Appl.

Page | 90
Environ. Microbiol. 70(12): 7010-7017.
Sayyed, A.H., Omar, D. and Wright, D.J. (2004 b). Genetics of spinosad resistance
in a multi-resistant field-selected population of Plutella xylostella. Pest Management
Science 60(8):827-832.
Sayyed, A.H., Gatsi,R., Ibiza-Palacios, M.S., Escriche, B. , Wright, D.J. and
Crickmore, N. (2005). Common but complex mode of resistance of Plutella xylostella
to Bacillus thuringiensis toxins Cry1Ab and Cry1Ac. Appl. Environ.Microbiol. 71(11):
6863-6869.
Sayyed, A.H., Gatsi, R., Kouskoura, T., Wright, D.J. and Crickmore, N. (2001).
Susceptibility of a Field-Derived, Bacillus thuringiensis-Resistant Strain of
Diamondback Moth to In Vitro-Activated Cry1Ac Toxin. Appl. Environ. Microbiol.
67(9):4372-4373.
Schnepf, E., Crickmore, N., Rie, J.V., Lereclus, D., Baum, J., Feitelson, J., Zeigler,
D.R. and Dean, D.H. (1998). Bacillus thuringiensis and its pesticidal crystal proteins.
Microbiology and Molecular Biology Reviews 62(3):775-803.
Scott, J.G. and Wen, Z. (2001). Cytochromes P450 of insects: the tip of the iceberg.
Pest Manag Sci 57:958-967.
Shao, Y., Dong, K., Zhang, C. (2007). The nicotinic acetylcholine receptor gene
family of the silkworm, Bombyx mori. BMC Genomics 8:324
Shao, Z., Cui, Y., Yi, H., Ji, J. and Yu, Z. (1998). Processing of δ-endotoxin of
Bacillus thuringiensis HD-1 in Heliothis armigera midgut juice and the effects of
protease inhibitors. Journal of Invertebrate Pathology 72: 73-81.
Shivakumar, A.G., Gundling, G.J., Benson, T.A., Casuto, D., Miller and Spear,
B.B. (1986). Vegetative Expression of the δ-Endotoxin Genes of Bacillus thuringiensis
subsp. kurstaki in Bacillus subtilis. Journal of Bacteriology 166(1): 194-204.

Page | 91
Soberon, M., Lopez, L.P., Lopez, I., Gomez, I., Tabashnik, B.E. and Bravo, A.
(2007). Engineering modified Bt toxins to counter Insect resistance. Science 318: 1640-
1642.
Soberon, M., Gill, S.S. and Bravo, A. (2009). Signaling versus punching hole: How
do Bacillus thuringiensis toxins kill insect midgut cells? Cell.Mol.LifeSci. 66(2009):
1337-1349.
Swiecicka, I., Fiedoruk, K. and Bednarz, G. (2002). The occurrence and properties
of Bacillus thuringiensis isolated from free-living animals. Letters in Applied
Microbiology 34:194-198.
Tabashnik, B.E., Liu, Y.B., Malvar, T., Heckel, D.J., Masson, L., Ballester, V.,
Granero, F., Mensua, J.L. and Ferre, J. (1997). Global variation in the Genetic and
biochemical basis of diamondback moth resistance to Bacillus thuringiensis .
Proc.Natl.Acad.Sci USA 94: 12780-12785.
Talekar, N.S. and Shelton, A.M. (1993). Biology, ecology and management of the
diamondback moth. Annu.Rev.Entomol.38:275-301.
Terriere,L.C. (1984). Induction of Detoxification Enzymes in Insects. Annu. Rev.
Entomol. 29: 71-88.
Thompson, G.D., Dutton, R. and Sparks, T.C. (2000). Spinosad- a case study: an
example from a natural products discovery programme. Pest Manag. Sci. 56: 696-702.
Tusada, Y., Nakatani, F., Hasimoto, K., Ikawa, S., Matsuura, C. , Fukada, T.,
Sugimoto, K. and Himeno, M.(2003). Cytotoxic activity of Bacillus thuringiensis Cry
proteins on mammalian cells transfected with cadherin-like Cry receptor gene of
Bombyx mori (silkworm). Biochem.J. 369:697-703.
Vadlamudi, R.K., Ji, T.H. and Bulla Jr., L.A (1993). A Specific Binding Protein
from Manduca sexta for the Insecticidal Toxin of Bacillus thuringiensis subsp. berliner.
The Journal of Biological Chemistry 268(17): 12334-12340.

Page | 92
Vadlamudi, R. K., Weber, E., Ji, I., Ji, T. H. and Bulla Jr., L. A. (1995). Cloning
and expression of a receptor for an insecticidal toxin of Bacillus thuringiensis. The
Journal of Biological Chemistry 270(10):5490-5494.
Valaitis, A.P., Augustin, S. and Clancy, K.M. (1999). Purification and
characterization of the western spruce budworm larval midgut proteinases and
comparison of gut activities of laboratory-reared and field-collected insects. Insect
Biochemistry and Molecular Biology 29: 405-415.
Valaitis, A.P., Lee, M.K., Rajamohan, F. and Dean, D.H. (1995). Brush border
membrane aminopeptidase-N in the midgut of the gypsy moth serves as the receptor for
the CryIA(c) delta-endotoxin of Bacillus thuringiensis. Insect Biochemistry and
Molecular Biology 25: 1143-1151.
Wagner, W., Mohrlen, F. and Schnetter, W. (2002). Characterization of the
proteolytic enzymes in the midgut of the European Cockchafer, Melolontha melolontha
(Coleoptera: Scarabaeidae). Insect Biochemistry and Molecular Biology 32: 803-814.
Waldschmidt, A.M., Salomao, T.M.F., de Barros, E.G. and Campos, L.deA.O.
(1997). Extraction of genomic DNA from Melipona quadrifasciata (Hymenoptera:
Apidae, Meliponinae). Brazilian Journal of Genetics: Vol.20, No.3, 421-423.
Wang, P., Zhang, X. and Zhang, J. (2005). Molecular characterization of four
midgut aminopeptidase N isozymes from the cabbage looper, Trichoplusia ni . Insect
Biochemistry and Molecular Biology 35: 611-620.
Wang, P., Zhao, J-Z., Rodrigo-Simon, A., Kain, W., Janmaat, A.F., Shelton, A.M.,
Ferre, J. and Myers, J. (2007). Mechanism of Resistance to Bacillus thuringiensis
Toxin Cry1Ac in a Greenhouse Population of the Cabbage Looper, Trichoplusia ni.
Applied and Environmental Microbiology 73(4): 1199-1207.
Wong, H.C. and Chang, S. (1986). Identification of a positive retroregulator that
stabilizes mRNAs in bacteria. Proc. Natl.Acad.Sci USA 83:3233-3237.
Page | 93
Wright, D.J., Iqbal, M., Granero, F. and Ferre, J. (1997). A Change in a Single
Midgut Receptor in the Diamondback Moth (Plutella xylostella) Is Only in Part
Responsible for Field Resistance to Bacillus thuringiensis subsp. kurstaki and B.
thuringiensis subsp. aizawai. Applied and Environmental Microbiology 63(5):1814-
1819.
Xenobiotic metabolism, Wikipedia, Accessed online on 24th
May
2010.http://en.wikipedia.org/wiki/Xenobiotic_metabolism
Xie, R., Zhuang, M., Ross, L.S., Gomez, I., Oltean, D.I., Bravo, A., Soberon, M.
and Gill, S.S. (2005). Single Amino Acid Mutations in the Cadherin Receptor from
Heliothis virescens Affect Its Toxin Binding Ability to Cry1A Toxins. The Journal of
Biological Chemistry 280(9): 8416-8425.
Xu, D. and Cote, J-C. (2008). Sequence Diversity of Bacillus thuringiensis Flagellin
(H Antigen) Protein at the Intra-H Serotype Level. Applied and Environmental
Microbiology 74(17):5524-5532.
Xu, X. and Wu, Y. (2008). Disruption of Ha_BtR alters binding of Bacillus
thuringiensis δ-endotoxin Cry1Ac to midgut BBMVs of Helicoverpa armigera. Journal
of Invertebrate Pathology 97:27-32.
Xu, X., Yu, L. and Wu, Y. (2005). Disruption of a Cadherin Gene Associated with
Resistance to Cry1Ac δ-Endotoxin of Bacillus thuringiensis in Helicoverpa armigera.
Applied and Environmental Microbiology 71(2):948-954.
Zhang, X., Candas, M., Griko, N.B., Taussig, R. and Bulla Jr., L.A. (2006). A
mechanism of cell death involving an adenylyl cyclase_PKA signaling pathway is
induced by the Cry1Ab toxin of Bacillus thuringiensis. PNAS 103(26):9897-9902.