of the barbados accretionary prism
TRANSCRIPT
rib-on-gt. mntndepyall
rallore
nit-ro-
Shipley, T.H., Ogawa, Y., Blum, P., and Bahr, J.M. (Eds.), 1997Proceedings of the Ocean Drilling Program, Scientific Results, Vol. 156
22. STRUCTURAL GEOLOGY OF THE DÉCOLLEMENT AT THE TOEOF THE BARBADOS ACCRETIONARY PRISM 1
Alex Maltman,2 Pierre Labaume,3 and Bernard Housen4
ABSTRACT
The base of the Barbados accretionary prism is defined by a décollement, which separates material accreting to the Cabean Plate from underthrusting Atlantic Ocean sediment. A three-dimensional seismic survey has shown the structure to ctain intervals of negative polarity, interpreted as representing pockets of overpressured fluid. Consequently, Ocean DrillinProgram Leg 156 was designed specifically to investigate the hydrogeological and deformational behavior of the décollemen
Analysis of recovered cores shows the structure to comprise a zone of intensified but heterogeneous deformation, 31thick, but 39 m thick if suprajacent breccia and various physico-chemical anomalies are included. The top of the décollemeshows a pronounced change in the orientation of magnetic anisotropy, indicating efficient decoupling between the prism athe lower material. Core-scale deformation features consist principally of fracture networks, stratal disruption and, most esp-cially, zones of scaly fabric. On the basis of thin-section and scanning electron microscope/transmission electron microscoobservations, the scaly fabric is fractal-like, with zones of sheared clay wrapping around relatively undeformed lenses, at scales down to that of the individual particles. The scaly zones, consisting of a combination of a pervasive flattening fabric anddistributed slip surfaces, are viewed as S-C structures. These develop as shear strains supplant initial flattening microstructures,which is termed spaced foliation. Continuing shear strain progressively dissects the undeformed lenses to produce an ovezone that becomes more intensely sheared, better defined, and narrower—the difference between drilling Site 949 and the mlandward Site 948. Fabric-parallel color changes and mineralized veins testify to the structural influence on fluid migratioalong the décollement. This takes place in periodic pulses, judging by compound nature of the veins and the inferred intermtent collapse of pores during shear-zone formation. That is, the deformation and drainage of the décollement are highly hetegeneous, both spatially and through time.
t
r
ore-d aetwning
of-90).se of be-gh-
ter-(e.g.enthan-w re-ncileevi-5),
ic ofpli-ip-aldi-e in-es-e tod to theing
INTRODUCTION
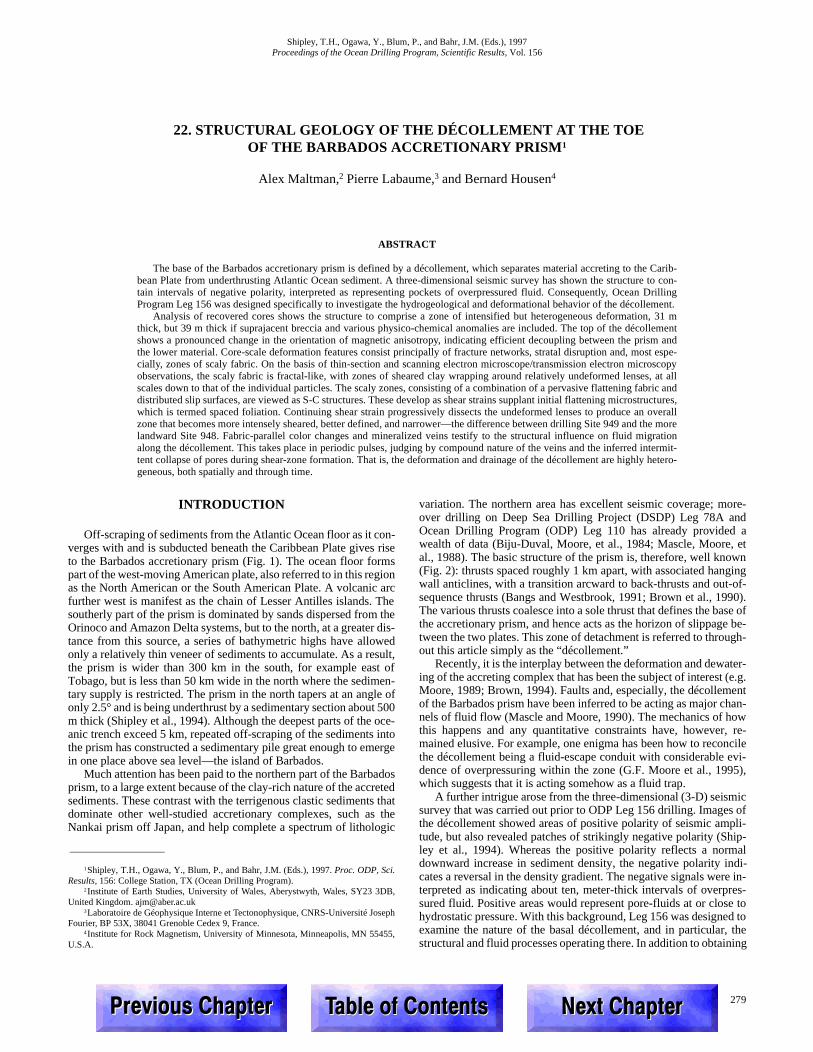
Off-scraping of sediments from the Atlantic Ocean floor as it con-verges with and is subducted beneath the Caribbean Plate gives riseto the Barbados accretionary prism (Fig. 1). The ocean floor formspart of the west-moving American plate, also referred to in this regionas the North American or the South American Plate. A volcanic arcfurther west is manifest as the chain of Lesser Antilles islands. Thesoutherly part of the prism is dominated by sands dispersed from theOrinoco and Amazon Delta systems, but to the north, at a greater dis-tance from this source, a series of bathymetric highs have allowedonly a relatively thin veneer of sediments to accumulate. As a result,the prism is wider than 300 km in the south, for example east ofTobago, but is less than 50 km wide in the north where the sedimen-tary supply is restricted. The prism in the north tapers at an angle ofonly 2.5° and is being underthrust by a sedimentary section aboum thick (Shipley et al., 1994). Although the deepest parts of the oanic trench exceed 5 km, repeated off-scraping of the sedimentsthe prism has constructed a sedimentary pile great enough to emin one place above sea level—the island of Barbados.
Much attention has been paid to the northern part of the Barbaprism, to a large extent because of the clay-rich nature of the accsediments. These contrast with the terrigenous clastic sedimentsdominate other well-studied accretionary complexes, such asNankai prism off Japan, and help complete a spectrum of litholo
1Shipley, T.H., Ogawa, Y., Blum, P., and Bahr, J.M. (Eds.), 1997. Proc. ODP, Sci.Results, 156: College Station, TX (Ocean Drilling Program).
2Institute of Earth Studies, University of Wales, Aberystwyth, Wales, SY23 3DB,United Kingdom. [email protected]
3Laboratoire de Géophysique Interne et Tectonophysique, CNRS-Université JoFourier, BP 53X, 38041 Grenoble Cedex 9, France.
4Institute for Rock Magnetism, University of Minnesota, Minneapolis, MN 5545U.S.A.
3UHYLRXV&KDSWHU3UHYLRXV&KDSWHU 7DEOHRI&7DEOHRI&
500ce- intoerge
doseted thatthegic
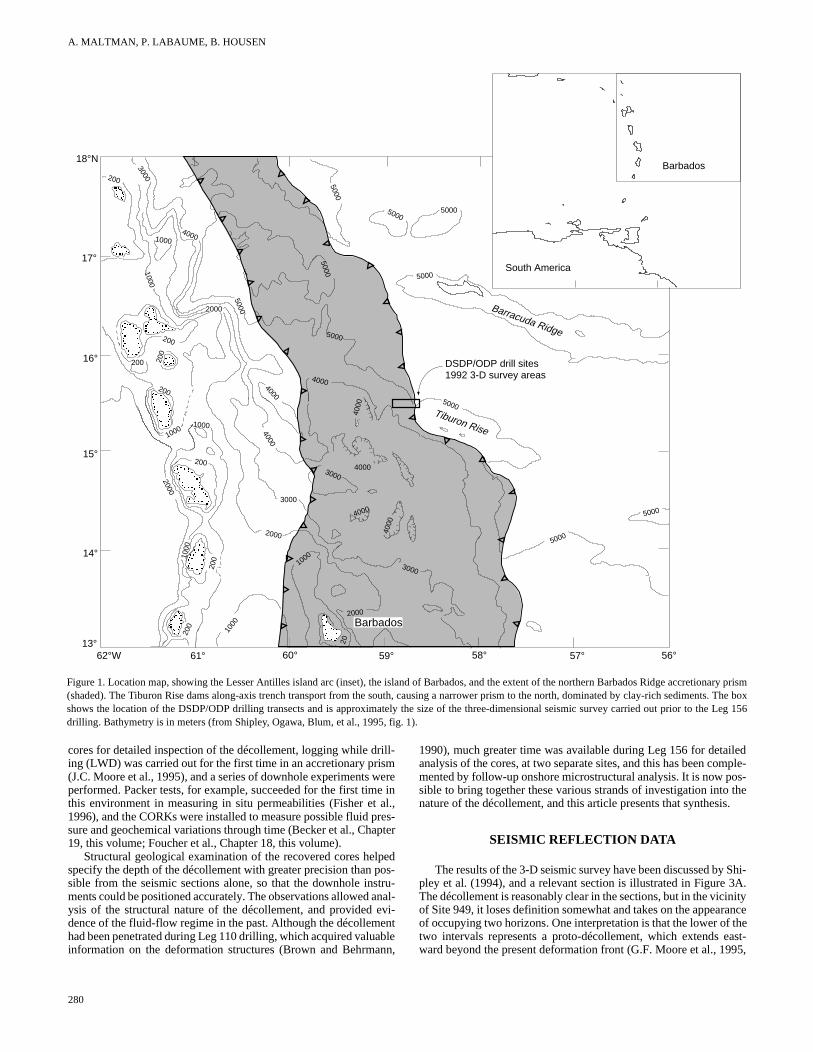
variation. The northern area has excellent seismic coverage; mover drilling on Deep Sea Drilling Project (DSDP) Leg 78A anOcean Drilling Program (ODP) Leg 110 has already providedwealth of data (Biju-Duval, Moore, et al., 1984; Mascle, Moore, al., 1988). The basic structure of the prism is, therefore, well kno(Fig. 2): thrusts spaced roughly 1 km apart, with associated hangwall anticlines, with a transition arcward to back-thrusts and out-sequence thrusts (Bangs and Westbrook, 1991; Brown et al., 19The various thrusts coalesce into a sole thrust that defines the bathe accretionary prism, and hence acts as the horizon of slippagetween the two plates. This zone of detachment is referred to throuout this article simply as the “décollement.”
Recently, it is the interplay between the deformation and dewaing of the accreting complex that has been the subject of interest Moore, 1989; Brown, 1994). Faults and, especially, the décollemof the Barbados prism have been inferred to be acting as major cnels of fluid flow (Mascle and Moore, 1990). The mechanics of hothis happens and any quantitative constraints have, however,mained elusive. For example, one enigma has been how to recothe décollement being a fluid-escape conduit with considerable dence of overpressuring within the zone (G.F. Moore et al., 199which suggests that it is acting somehow as a fluid trap.
A further intrigue arose from the three-dimensional (3-D) seismsurvey that was carried out prior to ODP Leg 156 drilling. Imagesthe décollement showed areas of positive polarity of seismic amtude, but also revealed patches of strikingly negative polarity (Shley et al., 1994). Whereas the positive polarity reflects a normdownward increase in sediment density, the negative polarity incates a reversal in the density gradient. The negative signals werterpreted as indicating about ten, meter-thick intervals of overprsured fluid. Positive areas would represent pore-fluids at or closhydrostatic pressure. With this background, Leg 156 was designeexamine the nature of the basal décollement, and in particular,structural and fluid processes operating there. In addition to obtain
seph
5,
279RQWHQWVRQWHQWV 1H[W&KDSWHU1H[W&KDSWHU
A. MALTMAN, P. LABAUME, B. HOUSEN
1000
200
50005000
5000
5000
5000
40004000
5000
3000
40001000
200
1000
50002000
200
200 200
1000
2000
3000
2000
3000
4000
1000
3000
4000
1000
20
Barbados
4000
5000
5000
4000
4000
200
200
2000
200
1000
5000
17°17°
18°N
Tiburon Rise
DSDP/ODP drill sites1992 3-D survey areas
Barracuda Ridge
57° 56°
South America
Barbados
61°62°W 60° 59° 58°13°
14°
15°
16°
Figure 1. Location map, showing the Lesser Antilles island arc (inset), the island of Barbados, and the extent of the northern Barbados Ridge accretionary prism(shaded). The Tiburon Rise dams along-axis trench transport from the south, causing a narrower prism to the north, dominated by clay-rich sediments. The boxshows the location of the DSDP/ODP drilling transects and is approximately the size of the three-dimensional seismic survey carried out prior to the Leg 156drilling. Bathymetry is in meters (from Shipley, Ogawa, Blum, et al., 1995, fig. 1).
ri
w
ar
lpp
aeean
iledmple-os- thes.
Shi-3A.inityancetheast-95,
cores for detailed inspection of the décollement, logging while ding (LWD) was carried out for the first time in an accretionary pris(J.C. Moore et al., 1995), and a series of downhole experiments performed. Packer tests, for example, succeeded for the first timthis environment in measuring in situ permeabilities (Fisher et 1996), and the CORKs were installed to measure possible fluid psure and geochemical variations through time (Becker et al., Cha19, this volume; Foucher et al., Chapter 18, this volume).
Structural geological examination of the recovered cores hespecify the depth of the décollement with greater precision than sible from the seismic sections alone, so that the downhole insments could be positioned accurately. The observations allowed ysis of the structural nature of the décollement, and provided dence of the fluid-flow regime in the past. Although the décollemhad been penetrated during Leg 110 drilling, which acquired valuinformation on the deformation structures (Brown and Behrma
280
ll-mere
e inl.,es-pter
edos-tru-nal-vi-ntblen,
1990), much greater time was available during Leg 156 for detaanalysis of the cores, at two separate sites, and this has been comented by follow-up onshore microstructural analysis. It is now psible to bring together these various strands of investigation intonature of the décollement, and this article presents that synthesi
SEISMIC REFLECTION DATA
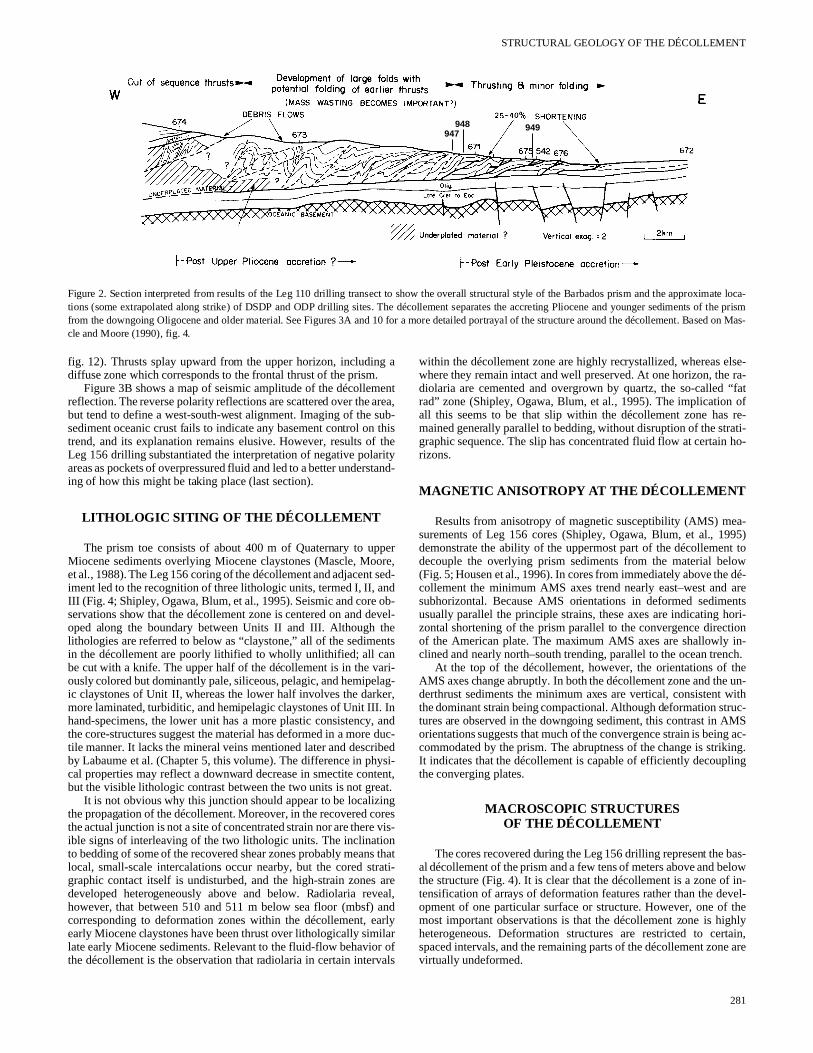
The results of the 3-D seismic survey have been discussed bypley et al. (1994), and a relevant section is illustrated in Figure The décollement is reasonably clear in the sections, but in the vicof Site 949, it loses definition somewhat and takes on the appearof occupying two horizons. One interpretation is that the lower of two intervals represents a proto-décollement, which extends eward beyond the present deformation front (G.F. Moore et al., 19
STRUCTURAL GEOLOGY OF THE DÉCOLLEMENT
ximate loca-s of the prismsed on Mas-
948 949947
Figure 2. Section interpreted from results of the Leg 110 drilling transect to show the overall structural style of the Barbados prism and the approtions (some extrapolated along strike) of DSDP and ODP drilling sites. The décollement separates the accreting Pliocene and younger sedimentfrom the downgoing Oligocene and older material. See Figures 3A and 10 for a more detailed portrayal of the structure around the décollement. Bacle and Moore (1990), fig. 4.
g.
a snf rs
pot a odteaal
k. ,
eriy
nei
coeos
trs v a
rrv
lse- ra-
“fat of re-ati- ho-
a-95)t to
low dé- areentsori-tion
in-ch.thee un-withruc-MSg ac-king.ling
bas-elowf in-vel- theghlytain,e are
fig. 12). Thrusts splay upward from the upper horizon, includindiffuse zone which corresponds to the frontal thrust of the prism
Figure 3B shows a map of seismic amplitude of the décollemreflection. The reverse polarity reflections are scattered over thebut tend to define a west-south-west alignment. Imaging of thesediment oceanic crust fails to indicate any basement control otrend, and its explanation remains elusive. However, results oLeg 156 drilling substantiated the interpretation of negative polaareas as pockets of overpressured fluid and led to a better undering of how this might be taking place (last section).
LITHOLOGIC SITING OF THE DÉCOLLEMENT
The prism toe consists of about 400 m of Quaternary to uMiocene sediments overlying Miocene claystones (Mascle, Moet al., 1988). The Leg 156 coring of the décollement and adjaceniment led to the recognition of three lithologic units, termed I, II, III (Fig. 4; Shipley, Ogawa, Blum, et al., 1995). Seismic and coreservations show that the décollement zone is centered on and oped along the boundary between Units II and III. Although lithologies are referred to below as “claystone,” all of the sedimin the décollement are poorly lithified to wholly unlithified; all cbe cut with a knife. The upper half of the décollement is in the vously colored but dominantly pale, siliceous, pelagic, and hemipeic claystones of Unit II, whereas the lower half involves the darmore laminated, turbiditic, and hemipelagic claystones of Unit IIIhand-specimens, the lower unit has a more plastic consistencythe core-structures suggest the material has deformed in a mortile manner. It lacks the mineral veins mentioned later and descby Labaume et al. (Chapter 5, this volume). The difference in phcal properties may reflect a downward decrease in smectite cobut the visible lithologic contrast between the two units is not gr
It is not obvious why this junction should appear to be localizthe propagation of the décollement. Moreover, in the recovered the actual junction is not a site of concentrated strain nor are therible signs of interleaving of the two lithologic units. The inclinatito bedding of some of the recovered shear zones probably meanlocal, small-scale intercalations occur nearby, but the cored sgraphic contact itself is undisturbed, and the high-strain zonedeveloped heterogeneously above and below. Radiolaria rehowever, that between 510 and 511 m below sea floor (mbsf)corresponding to deformation zones within the décollement, eearly Miocene claystones have been thrust over lithologically simlate early Miocene sediments. Relevant to the fluid-flow behaviothe décollement is the observation that radiolaria in certain inte
a
entrea,ub- thistheitytand-
perre,sed-ndb-
evel-hentsnri-ag-er,In and duc-bedsi-
tent,at.ngres
vis-n thatati-areeal,andrly
ilar ofals
within the décollement zone are highly recrystallized, whereas ewhere they remain intact and well preserved. At one horizon, thediolaria are cemented and overgrown by quartz, the so-calledrad” zone (Shipley, Ogawa, Blum, et al., 1995). The implicationall this seems to be that slip within the décollement zone hasmained generally parallel to bedding, without disruption of the strgraphic sequence. The slip has concentrated fluid flow at certainrizons.
MAGNETIC ANISOTROPY AT THE DÉCOLLEMENT
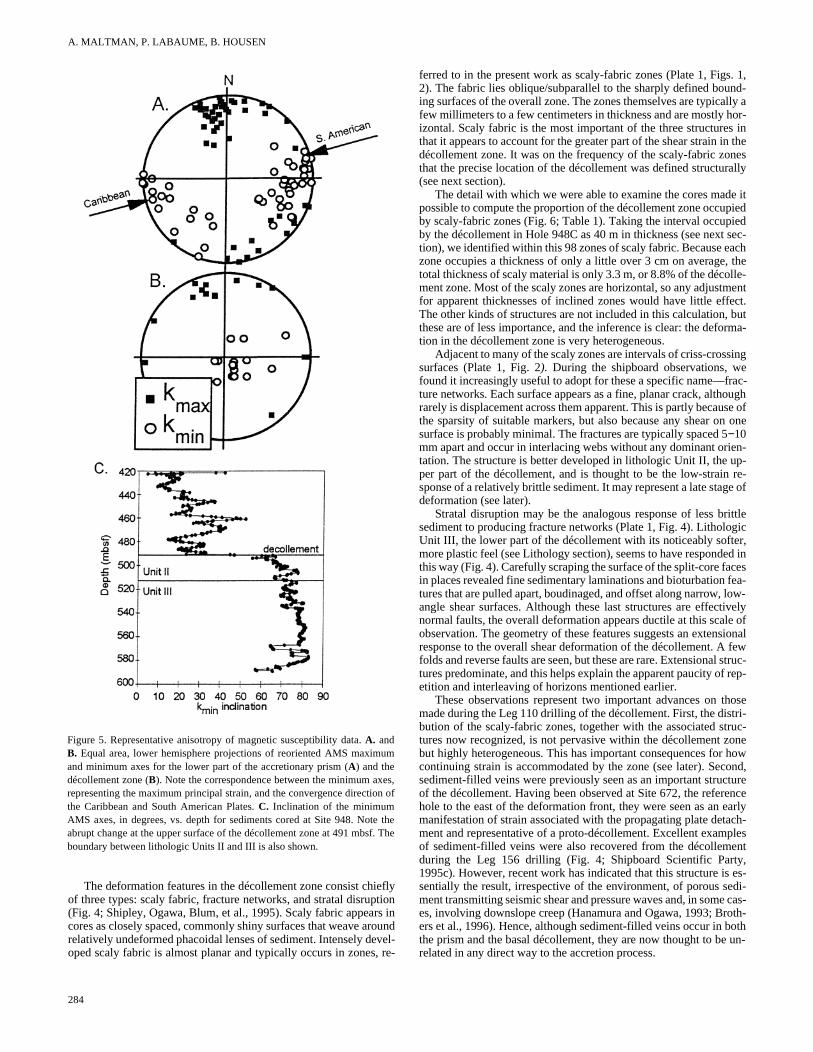
Results from anisotropy of magnetic susceptibility (AMS) mesurements of Leg 156 cores (Shipley, Ogawa, Blum, et al., 19demonstrate the ability of the uppermost part of the décollemendecouple the overlying prism sediments from the material be(Fig. 5; Housen et al., 1996). In cores from immediately above thecollement the minimum AMS axes trend nearly east–west andsubhorizontal. Because AMS orientations in deformed sedimusually parallel the principle strains, these axes are indicating hzontal shortening of the prism parallel to the convergence direcof the American plate. The maximum AMS axes are shallowlyclined and nearly north–south trending, parallel to the ocean tren
At the top of the décollement, however, the orientations of AMS axes change abruptly. In both the décollement zone and thderthrust sediments the minimum axes are vertical, consistent the dominant strain being compactional. Although deformation sttures are observed in the downgoing sediment, this contrast in Aorientations suggests that much of the convergence strain is beincommodated by the prism. The abruptness of the change is striIt indicates that the décollement is capable of efficiently decoupthe converging plates.
MACROSCOPIC STRUCTURESOF THE DÉCOLLEMENT
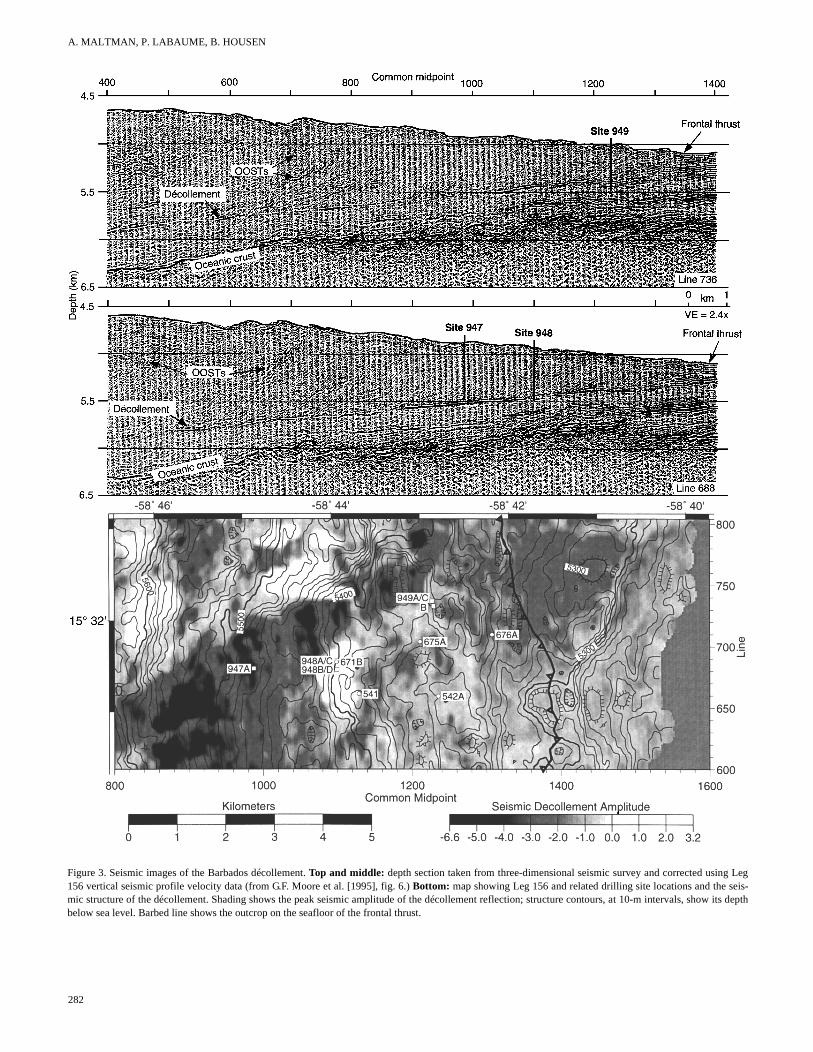
The cores recovered during the Leg 156 drilling represent the al décollement of the prism and a few tens of meters above and bthe structure (Fig. 4). It is clear that the décollement is a zone otensification of arrays of deformation features rather than the deopment of one particular surface or structure. However, one ofmost important observations is that the décollement zone is hiheterogeneous. Deformation structures are restricted to cerspaced intervals, and the remaining parts of the décollement zonvirtually undeformed.
281
A. MALTMAN, P. LABAUME, B. HOUSEN
Legis-
Figure 3. Seismic images of the Barbados décollement. Top and middle: depth section taken from three-dimensional seismic survey and corrected using156 vertical seismic profile velocity data (from G.F. Moore et al. [1995], fig. 6.) Bottom: map showing Leg 156 and related drilling site locations and the semic structure of the décollement. Shading shows the peak seismic amplitude of the décollement reflection; structure contours, at 10-m intervals, show its depthbelow sea level. Barbed line shows the outcrop on the seafloor of the frontal thrust.
282
STRUCTURAL GEOLOGY OF THE DÉCOLLEMENT
Déc
olle
men
t zon
e
Sca
lyfa
bri
c
Hole 948CStructuralsummaryF
eatu
res
Fau
lt z
on
es
v
v
v
v
Lith
olog
ic u
nit I
ILi
thol
ogic
uni
t III
v
v
v
b
b
s
v
Thrusts
s
s
Dom
ain
II: D
écol
lem
ent
Dom
ain
III: U
nder
thru
st s
ectio
nD
omai
n I:
Pris
m
Co
reR
eco
very Structural features
Beddingdip
0
440
460
480
520
540
560
580
10X
11X
12X
13X
14X
15X
16X
17X
18X
19X
2X
3X
4X
5X
6X
7X
8X
9X
500
Dep
th (
mbs
f)
420
Stratal disruption
v Veins: rhodochrositeor phillipsite
Core-scale fold
Minor reversed fault
Minor normal fault
s Sediment-filled vein
b Brecciated zone
90
260
280
300
340
360
380
9X
10X
11X
12X
14X
15X
17X
18X
1X
2X
3X
4X
5X
6X
7X
8X
320
13X
16X
420
440
460
19X
20X
21X
22X
23X
24X
25H
400
240
Inferredthrust
Lith
olog
ic u
nit I
ILi
thol
ogic
unit
III
Dom
ain
I: P
rism
Thrust
Thrust
Thrust
s
s
s
s
s
s
v
v
b
?
?
Dep
th (
mbs
f)
Dom
ain
II: D
écol
lem
ent
Dom
ain
III:
Und
erth
rust
30Co
re
Rec
ove
ry
Structural features
Bed
din
gd
ip
Sca
lyfa
bri
c Hole 949BStructuralsummary
Stratal disruption
v Veins: rhodochrositeor phillipsite
Core-scale fold
Minor reversed fault
Minor normal fault
s Sediment-filled vein
b Brecciated zone
Fea
ture
s
Fau
lt z
on
es
60
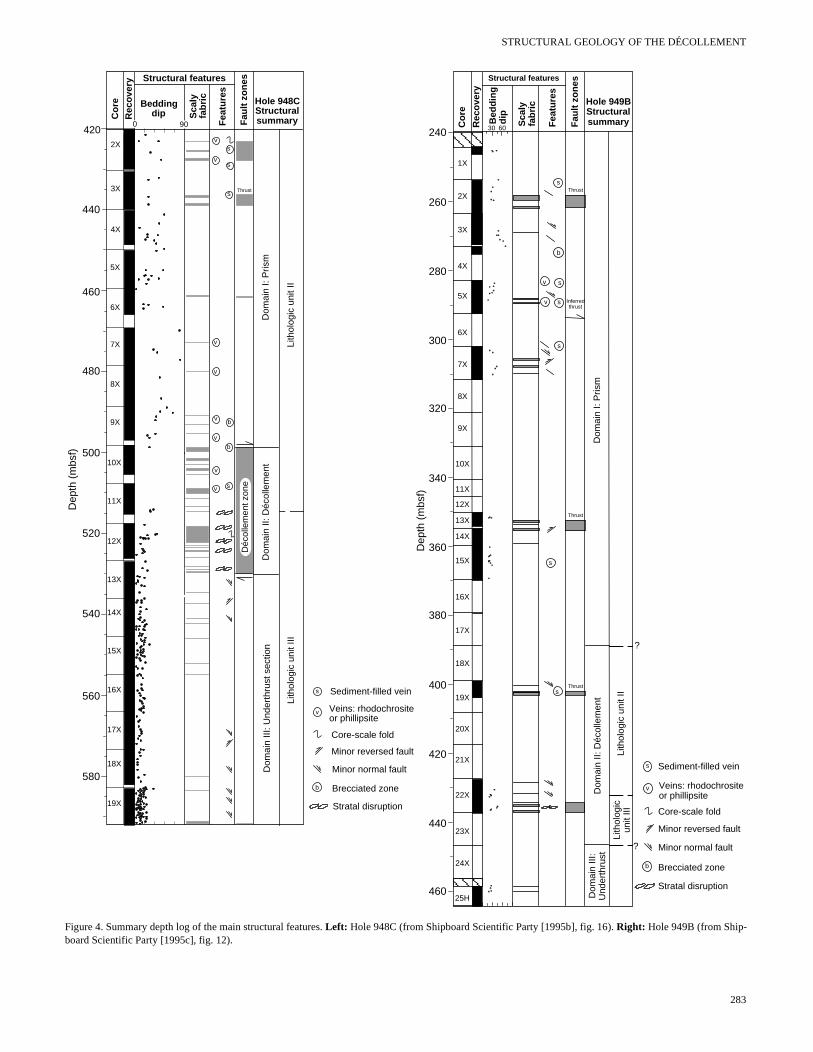
Figure 4. Summary depth log of the main structural features. Left: Hole 948C (from Shipboard Scientific Party [1995b], fig. 16). Right: Hole 949B (from Ship-board Scientific Party [1995c], fig. 12).
283
A. MALTMAN, P. LABAUME, B. HOUSEN
itsr
,
s. 1,nd-lly aor-
s inn thenesally
e itpiediedsec-ach, thelle-mentect. butrma-
singeac-oughse of one
en-p- re-e of
rittlegicr,
ed incesfea-low-ivelye ofional
fewstruc- rep-
hosetri-ruc-one howond,tureenceearlyach-plesenty, es-di- cas-
oth-oth un-
ef
The deformation features in the décollement zone consist chof three types: scaly fabric, fracture networks, and stratal disrup(Fig. 4; Shipley, Ogawa, Blum, et al., 1995). Scaly fabric appearcores as closely spaced, commonly shiny surfaces that weave arelatively undeformed phacoidal lenses of sediment. Intensely deoped scaly fabric is almost planar and typically occurs in zones
Figure 5. Representative anisotropy of magnetic susceptibility data. A. andB. Equal area, lower hemisphere projections of reoriented AMS maximumand minimum axes for the lower part of the accretionary prism (A) and thedécollement zone (B). Note the correspondence between the minimum axrepresenting the maximum principal strain, and the convergence directiothe Caribbean and South American Plates. C. Inclination of the minimumAMS axes, in degrees, vs. depth for sediments cored at Site 948. Notabrupt change at the upper surface of the décollement zone at 491 mbsboundary between lithologic Units II and III is also shown.
284
eflyion in
oundvel- re-
ferred to in the present work as scaly-fabric zones (Plate 1, Fig2). The fabric lies oblique/subparallel to the sharply defined bouing surfaces of the overall zone. The zones themselves are typicafew millimeters to a few centimeters in thickness and are mostly hizontal. Scaly fabric is the most important of the three structurethat it appears to account for the greater part of the shear strain idécollement zone. It was on the frequency of the scaly-fabric zothat the precise location of the décollement was defined structur(see next section).
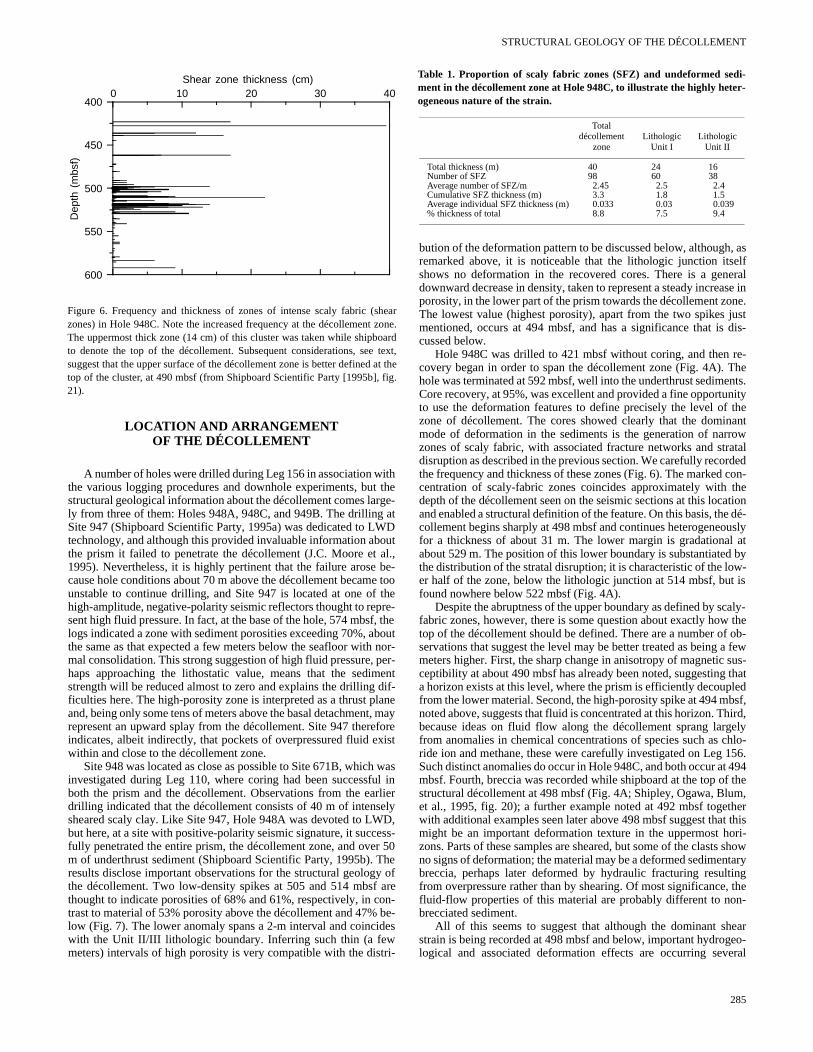
The detail with which we were able to examine the cores madpossible to compute the proportion of the décollement zone occuby scaly-fabric zones (Fig. 6; Table 1). Taking the interval occupby the décollement in Hole 948C as 40 m in thickness (see next tion), we identified within this 98 zones of scaly fabric. Because ezone occupies a thickness of only a little over 3 cm on averagetotal thickness of scaly material is only 3.3 m, or 8.8% of the décoment zone. Most of the scaly zones are horizontal, so any adjustfor apparent thicknesses of inclined zones would have little effThe other kinds of structures are not included in this calculation,these are of less importance, and the inference is clear: the defotion in the décollement zone is very heterogeneous.
Adjacent to many of the scaly zones are intervals of criss-crossurfaces (Plate 1, Fig. 2). During the shipboard observations, wfound it increasingly useful to adopt for these a specific name—frture networks. Each surface appears as a fine, planar crack, althrarely is displacement across them apparent. This is partly becauthe sparsity of suitable markers, but also because any shear onsurface is probably minimal. The fractures are typically spaced 5−10mm apart and occur in interlacing webs without any dominant oritation. The structure is better developed in lithologic Unit II, the uper part of the décollement, and is thought to be the low-strainsponse of a relatively brittle sediment. It may represent a late stagdeformation (see later).
Stratal disruption may be the analogous response of less bsediment to producing fracture networks (Plate 1, Fig. 4). LitholoUnit III, the lower part of the décollement with its noticeably softemore plastic feel (see Lithology section), seems to have respondthis way (Fig. 4). Carefully scraping the surface of the split-core fain places revealed fine sedimentary laminations and bioturbation tures that are pulled apart, boudinaged, and offset along narrow, angle shear surfaces. Although these last structures are effectnormal faults, the overall deformation appears ductile at this scalobservation. The geometry of these features suggests an extensresponse to the overall shear deformation of the décollement. Afolds and reverse faults are seen, but these are rare. Extensional tures predominate, and this helps explain the apparent paucity ofetition and interleaving of horizons mentioned earlier.
These observations represent two important advances on tmade during the Leg 110 drilling of the décollement. First, the disbution of the scaly-fabric zones, together with the associated sttures now recognized, is not pervasive within the décollement zbut highly heterogeneous. This has important consequences forcontinuing strain is accommodated by the zone (see later). Secsediment-filled veins were previously seen as an important strucof the décollement. Having been observed at Site 672, the referhole to the east of the deformation front, they were seen as an manifestation of strain associated with the propagating plate detment and representative of a proto-décollement. Excellent examof sediment-filled veins were also recovered from the décollemduring the Leg 156 drilling (Fig. 4; Shipboard Scientific Part1995c). However, recent work has indicated that this structure issentially the result, irrespective of the environment, of porous sement transmitting seismic shear and pressure waves and, in somees, involving downslope creep (Hanamura and Ogawa, 1993; Brers et al., 1996). Hence, although sediment-filled veins occur in bthe prism and the basal décollement, they are now thought to berelated in any direct way to the accretion process.
es,n of
the. The
STRUCTURAL GEOLOGY OF THE DÉCOLLEMENT
r W
f
pm dltex
u
e
Ty
f
id
t
h, aself
neralase inne.
just dis-
re-Thents.nity thenantrowratalrded con-theatione dé-ouslyl atd byw-t is
caly- the
f ob-a few sus- thatledbsf,hird,gelychlo-156. 494f them,thert thisori- showtary
ting, then-
eareo-eral
oe
LOCATION AND ARRANGEMENTOF THE DÉCOLLEMENT
A number of holes were drilled during Leg 156 in association withthe various logging procedures and downhole experiments, but thestructural geological information about the décollement comes laly from three of them: Holes 948A, 948C, and 949B. The drillingSite 947 (Shipboard Scientific Party, 1995a) was dedicated to Ltechnology, and although this provided invaluable information abthe prism it failed to penetrate the décollement (J.C. Moore et1995). Nevertheless, it is highly pertinent that the failure arosecause hole conditions about 70 m above the décollement becamunstable to continue drilling, and Site 947 is located at one ofhigh-amplitude, negative-polarity seismic reflectors thought to repsent high fluid pressure. In fact, at the base of the hole, 574 mbslogs indicated a zone with sediment porosities exceeding 70%, athe same as that expected a few meters below the seafloor withmal consolidation. This strong suggestion of high fluid pressure, haps approaching the lithostatic value, means that the sedistrength will be reduced almost to zero and explains the drillingficulties here. The high-porosity zone is interpreted as a thrust pand, being only some tens of meters above the basal detachmenrepresent an upward splay from the décollement. Site 947 therindicates, albeit indirectly, that pockets of overpressured fluid ewithin and close to the décollement zone.
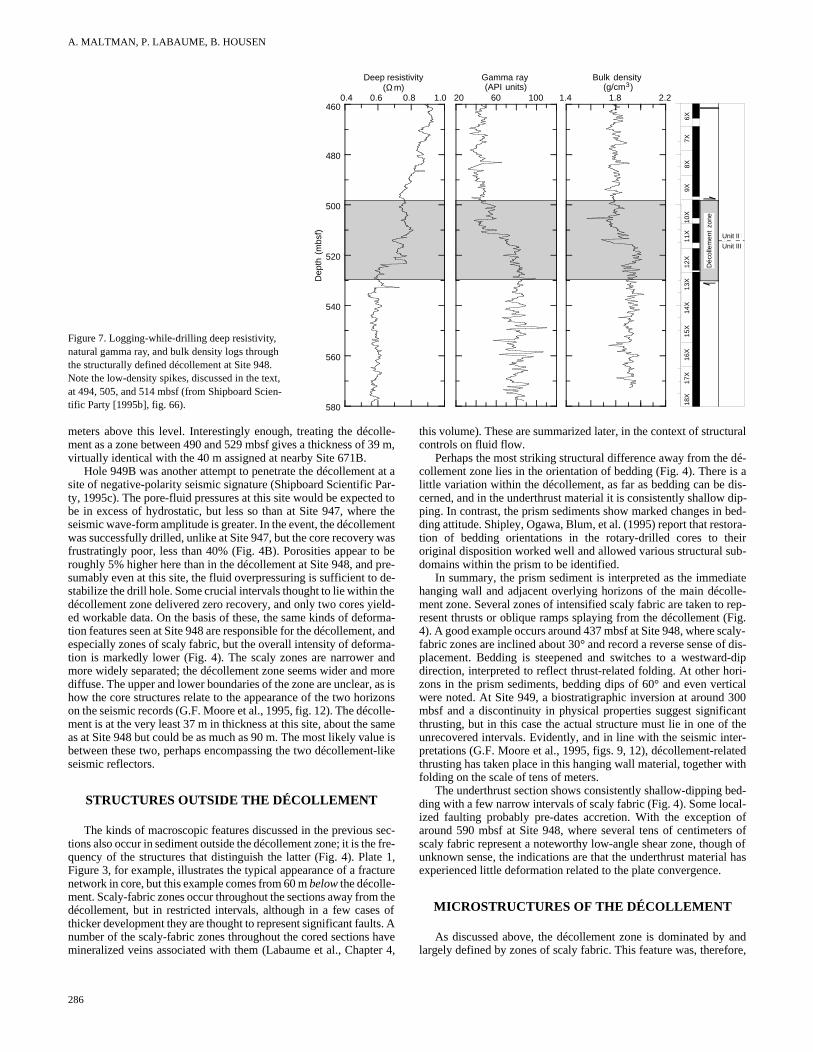
Site 948 was located as close as possible to Site 671B, whichinvestigated during Leg 110, where coring had been successfboth the prism and the décollement. Observations from the eadrilling indicated that the décollement consists of 40 m of intenssheared scaly clay. Like Site 947, Hole 948A was devoted to LWbut here, at a site with positive-polarity seismic signature, it succfully penetrated the entire prism, the décollement zone, and ovem of underthrust sediment (Shipboard Scientific Party, 1995b). results disclose important observations for the structural geologthe décollement. Two low-density spikes at 505 and 514 mbsthought to indicate porosities of 68% and 61%, respectively, in ctrast to material of 53% porosity above the décollement and 47%low (Fig. 7). The lower anomaly spans a 2-m interval and coincwith the Unit II/III lithologic boundary. Inferring such thin (a fewmeters) intervals of high porosity is very compatible with the dis
0 10 20 30 40400
450
500
550
600
Shear zone thickness (cm)D
epth
(m
bsf)
Figure 6. Frequency and thickness of zones of intense scaly fabric (shearzones) in Hole 948C. Note the increased frequency at the décollementThe uppermost thick zone (14 cm) of this cluster was taken while shipbto denote the top of the décollement. Subsequent considerations, sesuggest that the upper surface of the décollement zone is better definedtop of the cluster, at 490 mbsf (from Shipboard Scientific Party [1995b],21).
ge-atD
outal.,be-e toothere-, thebout nor-er-entif-
ane, mayforeist
wasl in
rlierelyD,ss-
r 50he ofareon- be-es
ri-
bution of the deformation pattern to be discussed below, althougremarked above, it is noticeable that the lithologic junction itsshows no deformation in the recovered cores. There is a gedownward decrease in density, taken to represent a steady increporosity, in the lower part of the prism towards the décollement zoThe lowest value (highest porosity), apart from the two spikes mentioned, occurs at 494 mbsf, and has a significance that iscussed below.
Hole 948C was drilled to 421 mbsf without coring, and then covery began in order to span the décollement zone (Fig. 4A). hole was terminated at 592 mbsf, well into the underthrust sedimeCore recovery, at 95%, was excellent and provided a fine opportuto use the deformation features to define precisely the level ofzone of décollement. The cores showed clearly that the domimode of deformation in the sediments is the generation of narzones of scaly fabric, with associated fracture networks and stdisruption as described in the previous section. We carefully recothe frequency and thickness of these zones (Fig. 6). The markedcentration of scaly-fabric zones coincides approximately with depth of the décollement seen on the seismic sections at this locand enabled a structural definition of the feature. On this basis, thcollement begins sharply at 498 mbsf and continues heterogenefor a thickness of about 31 m. The lower margin is gradationaabout 529 m. The position of this lower boundary is substantiatethe distribution of the stratal disruption; it is characteristic of the loer half of the zone, below the lithologic junction at 514 mbsf, bufound nowhere below 522 mbsf (Fig. 4A).
Despite the abruptness of the upper boundary as defined by sfabric zones, however, there is some question about exactly howtop of the décollement should be defined. There are a number oservations that suggest the level may be better treated as being meters higher. First, the sharp change in anisotropy of magneticceptibility at about 490 mbsf has already been noted, suggestinga horizon exists at this level, where the prism is efficiently decoupfrom the lower material. Second, the high-porosity spike at 494 mnoted above, suggests that fluid is concentrated at this horizon. Tbecause ideas on fluid flow along the décollement sprang larfrom anomalies in chemical concentrations of species such as ride ion and methane, these were carefully investigated on Leg Such distinct anomalies do occur in Hole 948C, and both occur atmbsf. Fourth, breccia was recorded while shipboard at the top ostructural décollement at 498 mbsf (Fig. 4A; Shipley, Ogawa, Bluet al., 1995, fig. 20); a further example noted at 492 mbsf togewith additional examples seen later above 498 mbsf suggest thamight be an important deformation texture in the uppermost hzons. Parts of these samples are sheared, but some of the clastsno signs of deformation; the material may be a deformed sedimenbreccia, perhaps later deformed by hydraulic fracturing resulfrom overpressure rather than by shearing. Of most significancefluid-flow properties of this material are probably different to nobrecciated sediment.
All of this seems to suggest that although the dominant shstrain is being recorded at 498 mbsf and below, important hydroglogical and associated deformation effects are occurring sev
Table 1. Proportion of scaly fabric zones (SFZ) and undeformed sedi-ment in the décollement zone at Hole 948C, to illustrate the highly heter-ogeneous nature of the strain.
Totaldécollement
zoneLithologic
Unit ILithologic
Unit II
Total thickness (m) 40 24 16Number of SFZ 98 60 38Average number of SFZ/m 2.45 2.5 2.4Cumulative SFZ thickness (m) 3.3 1.8 1.5Average individual SFZ thickness (m) 0.033 0.03 0.039% thickness of total 8.8 7.5 9.4
zone.ard text,at thefig.
285
A. MALTMAN, P. LABAUME, B. HOUSEN
0.4 0.6 0.8 1.0460
480
500
520
540
560
580
Deep resistivity(Ω m)
Dep
th (
mbs
f)
20 60 100
Gamma ray (API units)
Déc
olle
men
t Z
on
e
10X
11X
12X
13X
14X
15X
16X
17X
18X
6X
7X
8X
9X
Unit II
Unit III
1.4 1.8 2.2
Bulk density (g/cm )3
6X7X
8X9X
10X
11X
12X
13X
14X
15X
16X
17X
18X
Unit II
Unit III
Déc
olle
men
t zo
ne
Figure 7. Logging-while-drilling deep resistivity, natural gamma ray, and bulk density logs through the structurally defined décollement at Site 948. Note the low-density spikes, discussed in the text, at 494, 505, and 514 mbsf (from Shipboard Scien-tific Party [1995b], fig. 66).
f
Pterm
to
t
onrm ,r
ln
etc
m
lt t
ural
dé-s ais-ip-ed-ra-irb-
iatele-rep-ig.
aly-f dis--dipri-ical00ntther-
tedith
ed-l-ofs ofh of has
andre,
meters above this level. Interestingly enough, treating the décment as a zone between 490 and 529 mbsf gives a thickness ovirtually identical with the 40 m assigned at nearby Site 671B.
Hole 949B was another attempt to penetrate the décollemensite of negative-polarity seismic signature (Shipboard Scientificty, 1995c). The pore-fluid pressures at this site would be expecbe in excess of hydrostatic, but less so than at Site 947, wheseismic wave-form amplitude is greater. In the event, the décollewas successfully drilled, unlike at Site 947, but the core recoveryfrustratingly poor, less than 40% (Fig. 4B). Porosities appear roughly 5% higher here than in the décollement at Site 948, andsumably even at this site, the fluid overpressuring is sufficient tostabilize the drill hole. Some crucial intervals thought to lie withindécollement zone delivered zero recovery, and only two cores yed workable data. On the basis of these, the same kinds of deftion features seen at Site 948 are responsible for the décollemeespecially zones of scaly fabric, but the overall intensity of defotion is markedly lower (Fig. 4). The scaly zones are narrowermore widely separated; the décollement zone seems wider anddiffuse. The upper and lower boundaries of the zone are unclearhow the core structures relate to the appearance of the two hoon the seismic records (G.F. Moore et al., 1995, fig. 12). The décment is at the very least 37 m in thickness at this site, about theas at Site 948 but could be as much as 90 m. The most likely vabetween these two, perhaps encompassing the two décollemeseismic reflectors.
STRUCTURES OUTSIDE THE DÉCOLLEMENT
The kinds of macroscopic features discussed in the previous sec-tions also occur in sediment outside the décollement zone; it is thquency of the structures that distinguish the latter (Fig. 4). PlaFigure 3, for example, illustrates the typical appearance of a franetwork in core, but this example comes from 60 m below the décolle-ment. Scaly-fabric zones occur throughout the sections away frodécollement, but in restricted intervals, although in a few casethicker development they are thought to represent significant faunumber of the scaly-fabric zones throughout the cored sectionsmineralized veins associated with them (Labaume et al., Chap
286
olle-39 m,
t at aar-d to
e theent
was be
pre- de-heield-rma-t, and
a-andmore as isizonsolle-sameue ist-like
fre-e 1,ture
thes ofs. Ahaveer 4,
this volume). These are summarized later, in the context of structcontrols on fluid flow.
Perhaps the most striking structural difference away from the collement zone lies in the orientation of bedding (Fig. 4). There ilittle variation within the décollement, as far as bedding can be dcerned, and in the underthrust material it is consistently shallow dping. In contrast, the prism sediments show marked changes in bding attitude. Shipley, Ogawa, Blum, et al. (1995) report that restotion of bedding orientations in the rotary-drilled cores to theoriginal disposition worked well and allowed various structural sudomains within the prism to be identified.
In summary, the prism sediment is interpreted as the immedhanging wall and adjacent overlying horizons of the main décolment zone. Several zones of intensified scaly fabric are taken to resent thrusts or oblique ramps splaying from the décollement (F4). A good example occurs around 437 mbsf at Site 948, where scfabric zones are inclined about 30° and record a reverse sense oplacement. Bedding is steepened and switches to a westwarddirection, interpreted to reflect thrust-related folding. At other hozons in the prism sediments, bedding dips of 60° and even vertwere noted. At Site 949, a biostratigraphic inversion at around 3mbsf and a discontinuity in physical properties suggest significathrusting, but in this case the actual structure must lie in one of unrecovered intervals. Evidently, and in line with the seismic intepretations (G.F. Moore et al., 1995, figs. 9, 12), décollement-relathrusting has taken place in this hanging wall material, together wfolding on the scale of tens of meters.
The underthrust section shows consistently shallow-dipping bding with a few narrow intervals of scaly fabric (Fig. 4). Some locaized faulting probably pre-dates accretion. With the exception around 590 mbsf at Site 948, where several tens of centimeterscaly fabric represent a noteworthy low-angle shear zone, thougunknown sense, the indications are that the underthrust materialexperienced little deformation related to the plate convergence.
MICROSTRUCTURES OF THE DÉCOLLEMENT
As discussed above, the décollement zone is dominated by largely defined by zones of scaly fabric. This feature was, therefo
STRUCTURAL GEOLOGY OF THE DÉCOLLEMENT
smeinr
ehis,
igc pinhfa.t as h nmspd ai
soe
dga pmreusdayo
aimenth. nies
the
toent, al., ob- twoorke, atcoidg—ed
one.eleut
oomonllyk
izonandardn,st ofsm.tingkaig;Ourcaly be-pear-rva-the
sop-ns,ion
n-ing-dé-
ichingin-
anyunc--ay
ay beh lo-er-nts.otingesce.frac-the
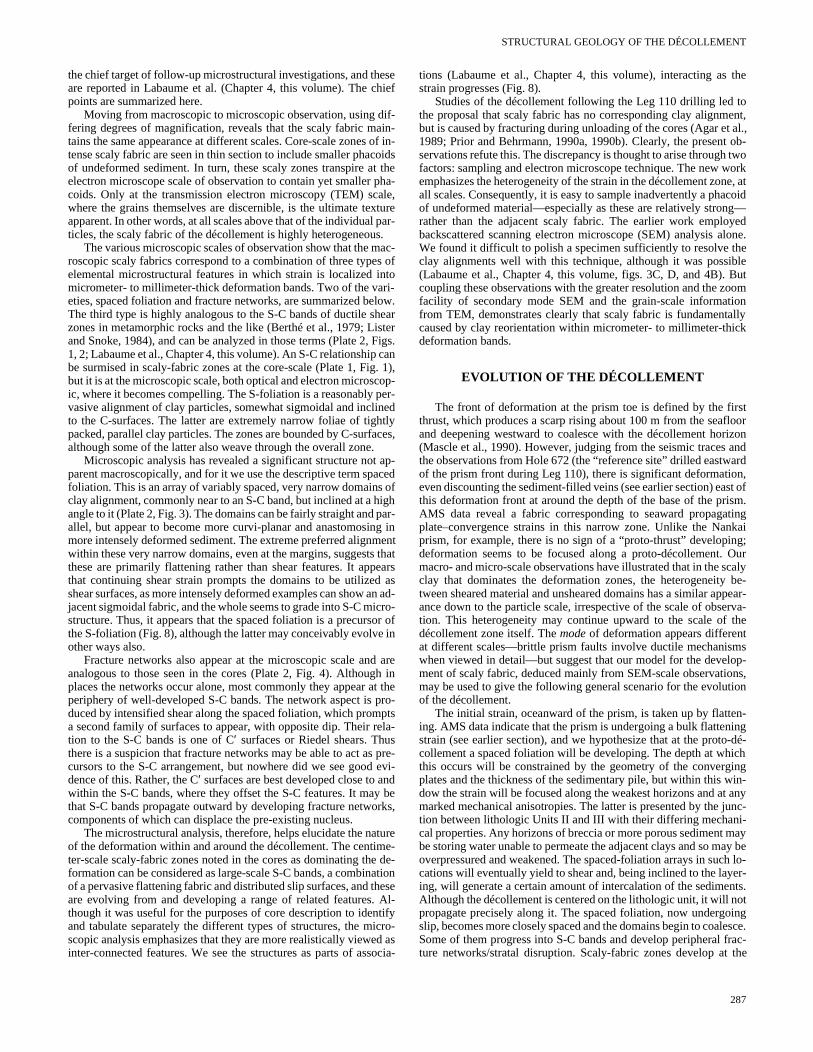
the chief target of follow-up microstructural investigations, and theseare reported in Labaume et al. (Chapter 4, this volume). The chiefpoints are summarized here.
Moving from macroscopic to microscopic observation, using dif-fering degrees of magnification, reveals that the scaly fabric main-tains the same appearance at different scales. Core-scale zones of in-tense scaly fabric are seen in thin section to include smaller phacoidsof undeformed sediment. In turn, these scaly zones transpire at theelectron microscope scale of observation to contain yet smaller pha-coids. Only at the transmission electron microscopy (TEM) scale,where the grains themselves are discernible, is the ultimate textureapparent. In other words, at all scales above that of the individual par-ticles, the scaly fabric of the décollement is highly heterogeneou
The various microscopic scales of observation show that the roscopic scaly fabrics correspond to a combination of three typelemental microstructural features in which strain is localized micrometer- to millimeter-thick deformation bands. Two of the vaeties, spaced foliation and fracture networks, are summarized bThe third type is highly analogous to the S-C bands of ductile szones in metamorphic rocks and the like (Berthé et al., 1979; Land Snoke, 1984), and can be analyzed in those terms (Plate 21, 2; Labaume et al., Chapter 4, this volume). An S-C relationshipbe surmised in scaly-fabric zones at the core-scale (Plate 1, Fbut it is at the microscopic scale, both optical and electron microsic, where it becomes compelling. The S-foliation is a reasonablyvasive alignment of clay particles, somewhat sigmoidal and inclto the C-surfaces. The latter are extremely narrow foliae of tigpacked, parallel clay particles. The zones are bounded by C-suralthough some of the latter also weave through the overall zone
Microscopic analysis has revealed a significant structure noparent macroscopically, and for it we use the descriptive term spfoliation. This is an array of variably spaced, very narrow domainclay alignment, commonly near to an S-C band, but inclined at aangle to it (Plate 2, Fig. 3). The domains can be fairly straight andallel, but appear to become more curvi-planar and anastomosimore intensely deformed sediment. The extreme preferred alignwithin these very narrow domains, even at the margins, suggestthese are primarily flattening rather than shear features. It apthat continuing shear strain prompts the domains to be utilizeshear surfaces, as more intensely deformed examples can showjacent sigmoidal fabric, and the whole seems to grade into S-C mstructure. Thus, it appears that the spaced foliation is a precurthe S-foliation (Fig. 8), although the latter may conceivably evolvother ways also.
Fracture networks also appear at the microscopic scale ananalogous to those seen in the cores (Plate 2, Fig. 4). Althouplaces the networks occur alone, most commonly they appear periphery of well-developed S-C bands. The network aspect isduced by intensified shear along the spaced foliation, which proa second family of surfaces to appear, with opposite dip. Their tion to the S-C bands is one of C′ surfaces or Riedel shears. Ththere is a suspicion that fracture networks may be able to act acursors to the S-C arrangement, but nowhere did we see goodence of this. Rather, the C′ surfaces are best developed close to within the S-C bands, where they offset the S-C features. It mathat S-C bands propagate outward by developing fracture netwcomponents of which can displace the pre-existing nucleus.
The microstructural analysis, therefore, helps elucidate the nof the deformation within and around the décollement. The centter-scale scaly-fabric zones noted in the cores as dominating thformation can be considered as large-scale S-C bands, a combiof a pervasive flattening fabric and distributed slip surfaces, and are evolving from and developing a range of related featuresthough it was useful for the purposes of core description to ideand tabulate separately the different types of structures, the mscopic analysis emphasizes that they are more realistically viewinter-connected features. We see the structures as parts of as
.ac-
s oftoi-low.earterFigs.can. 1),op-er-edtlyces,
ap-ced ofigh
par-g inent
thatears asn ad-
cro-r of in
areh int thero-ptsla-
s pre- evi-nd berks,
turee-
de-ationeseAl-tifycro-d asocia-
tions (Labaume et al., Chapter 4, this volume), interacting as strain progresses (Fig. 8).
Studies of the décollement following the Leg 110 drilling led the proposal that scaly fabric has no corresponding clay alignmbut is caused by fracturing during unloading of the cores (Agar et1989; Prior and Behrmann, 1990a, 1990b). Clearly, the presentservations refute this. The discrepancy is thought to arise throughfactors: sampling and electron microscope technique. The new wemphasizes the heterogeneity of the strain in the décollement zonall scales. Consequently, it is easy to sample inadvertently a phaof undeformed material—especially as these are relatively stronrather than the adjacent scaly fabric. The earlier work employbackscattered scanning electron microscope (SEM) analysis alWe found it difficult to polish a specimen sufficiently to resolve thclay alignments well with this technique, although it was possib(Labaume et al., Chapter 4, this volume, figs. 3C, D, and 4B). Bcoupling these observations with the greater resolution and the zfacility of secondary mode SEM and the grain-scale informatifrom TEM, demonstrates clearly that scaly fabric is fundamentacaused by clay reorientation within micrometer- to millimeter-thicdeformation bands.
EVOLUTION OF THE DÉCOLLEMENT
The front of deformation at the prism toe is defined by the firstthrust, which produces a scarp rising about 100 m from the seafloorand deepening westward to coalesce with the décollement hor(Mascle et al., 1990). However, judging from the seismic traces the observations from Hole 672 (the “reference site” drilled eastwof the prism front during Leg 110), there is significant deformatioeven discounting the sediment-filled veins (see earlier section) eathis deformation front at around the depth of the base of the priAMS data reveal a fabric corresponding to seaward propagaplate–convergence strains in this narrow zone. Unlike the Nanprism, for example, there is no sign of a “proto-thrust” developindeformation seems to be focused along a proto-décollement. macro- and micro-scale observations have illustrated that in the sclay that dominates the deformation zones, the heterogeneitytween sheared material and unsheared domains has a similar apance down to the particle scale, irrespective of the scale of obsetion. This heterogeneity may continue upward to the scale of décollement zone itself. The mode of deformation appears differentat different scales—brittle prism faults involve ductile mechanismwhen viewed in detail—but suggest that our model for the develment of scaly fabric, deduced mainly from SEM-scale observatiomay be used to give the following general scenario for the evolutof the décollement.
The initial strain, oceanward of the prism, is taken up by flatteing. AMS data indicate that the prism is undergoing a bulk flattenstrain (see earlier section), and we hypothesize that at the protocollement a spaced foliation will be developing. The depth at whthis occurs will be constrained by the geometry of the convergplates and the thickness of the sedimentary pile, but within this wdow the strain will be focused along the weakest horizons and atmarked mechanical anisotropies. The latter is presented by the jtion between lithologic Units II and III with their differing mechanical properties. Any horizons of breccia or more porous sediment mbe storing water unable to permeate the adjacent clays and so moverpressured and weakened. The spaced-foliation arrays in succations will eventually yield to shear and, being inclined to the laying, will generate a certain amount of intercalation of the sedimeAlthough the décollement is centered on the lithologic unit, it will npropagate precisely along it. The spaced foliation, now undergoslip, becomes more closely spaced and the domains begin to coalSome of them progress into S-C bands and develop peripheral ture networks/stratal disruption. Scaly-fabric zones develop at
287
A. MALTMAN, P. LABAUME, B. HOUSEN
int4wd
a
ft4r
r td
ao
c
e
donv
,
weendingt, asolef de-
t one ac-uth-
ig andd ineing
boutcciafluidif-
oc-rism, de-
dé- the
res,s oft dis-cific arero-valsancena-rittle
eticf theetailhen
ially zonepperckog-abricupt-, theg the thetheear-and, the the
flu-b-
te,edi-
thernttain
eaultcar-
core scale, and, at the next higher scale, the décollement zone sifies. Densification of scaly-fabric zones in two separate clusmay be responsible for the double décollement inferred at Site 9
It has been postulated that arrays of shear zones in clays groindividual surfaces locking up and new zones propagating outwarproduce an ever broadening band of sheared clay (e.g. Maltm1987; Moore and Byrne, 1987). In the case of the shear-driventachment at the base of an accretionary prism, the continuing sstrain should, therefore, lead to the décollement thickening landwAlthough this may happen after a décollement is pervasively filledslip surfaces, all the signs are that the décollement at the toe oBarbados prism is not thickening in this way. Notwithstanding difficulties of defining the thickness of the décollement at Site 9the zone becomes narrower and more sharply bounded as it is tarcward, that is, between Sites 949 and 948. The explanation main the very heterogeneous distribution of the shear. Rather than ging “outward” and thicker, the new shear zones propagate inwardpreviously undeformed sediment to produce a gradually moretensely and uniformly deformed zone. It may be that once all itsternal slip surfaces have been fully utilized the décollement thengins to thicken outward. The fluid-rich zone material around the of the décollement at Site 948 may become increasingly utilized ing subsequent displacement, producing some thickening arcwfrom the prism toe. These observations emphasize that quantificof the relationship between displacement and thickness of a décment zone should consider the cumulative thickness of the acscaly-fabric intervals rather than the bulk thickness of the zonecause of the large proportion of unsheared material that it may tain.
There is little doubt that shear zones cannot slip indefinit(Hicher et al., 1994). Having developed peripheral fracture netwoand Riedel shears, perhaps even through-going P-shears, therecreased friction between the now well-aligned particles in a sczone, and there are low-tortuosity channels for fluid escape leato system hardening. The nucleation and propagation of new zoffer an energetically more efficient way of accommodating contiing bulk strain. In addition, any zones experiencing a pulse of eleed pore pressure may propagate through hydrofracture and befrom reduced frictional strength during the subsequent slip. Thusphacoids of undeformed sediment are gradually dissected, shear
Figure 8. Synoptic sketch to show the associations of microstructures thataccount for the macroscopic appearance of scaly-fabric zones in cores. FN =fracture network, SF = S-fabric; C-S refers to the S-C deformation bands.
288
ten-ers9. by toan,de-hearrd.
by thehe9,acedy lieow-intoin-in-be-opur-ardtionlle-
tualbe-on-
lyrksis in-alyingnesu-at-
nefit thezone
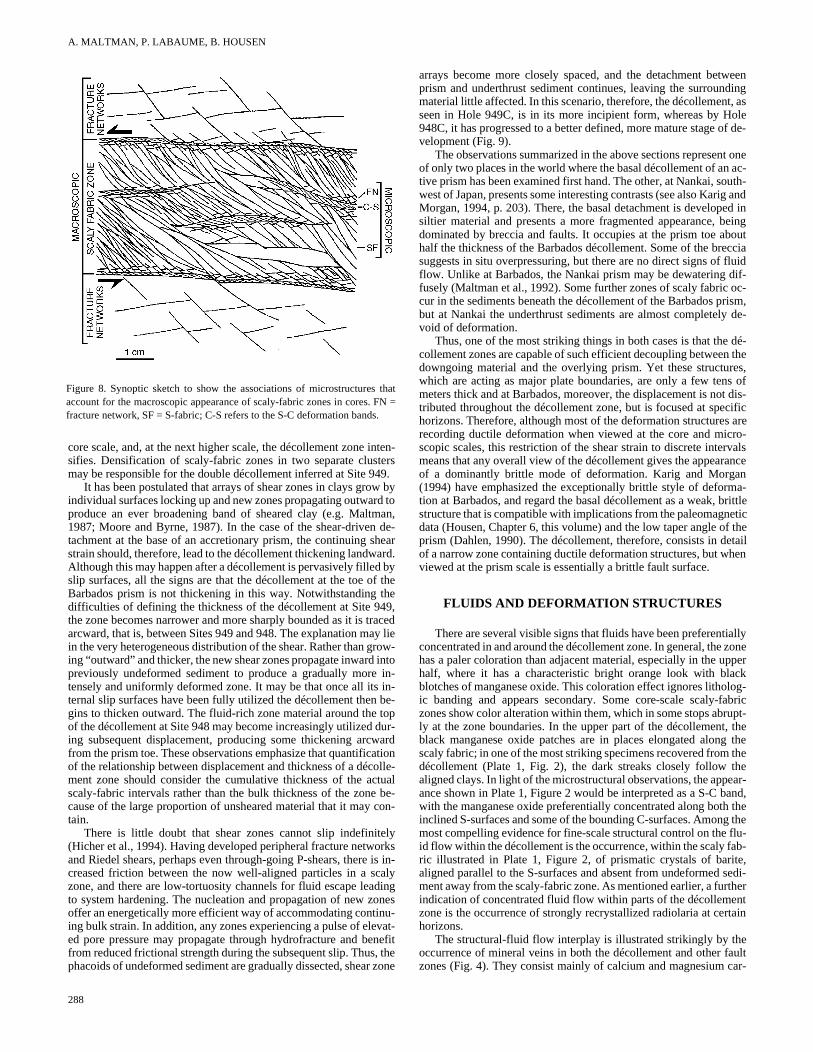
arrays become more closely spaced, and the detachment betprism and underthrust sediment continues, leaving the surrounmaterial little affected. In this scenario, therefore, the décollemenseen in Hole 949C, is in its more incipient form, whereas by H948C, it has progressed to a better defined, more mature stage ovelopment (Fig. 9).
The observations summarized in the above sections represenof only two places in the world where the basal décollement of antive prism has been examined first hand. The other, at Nankai, sowest of Japan, presents some interesting contrasts (see also KarMorgan, 1994, p. 203). There, the basal detachment is developesiltier material and presents a more fragmented appearance, bdominated by breccia and faults. It occupies at the prism toe ahalf the thickness of the Barbados décollement. Some of the bresuggests in situ overpressuring, but there are no direct signs of flow. Unlike at Barbados, the Nankai prism may be dewatering dfusely (Maltman et al., 1992). Some further zones of scaly fabric cur in the sediments beneath the décollement of the Barbados pbut at Nankai the underthrust sediments are almost completelyvoid of deformation.
Thus, one of the most striking things in both cases is that thecollement zones are capable of such efficient decoupling betweendowngoing material and the overlying prism. Yet these structuwhich are acting as major plate boundaries, are only a few tenmeters thick and at Barbados, moreover, the displacement is notributed throughout the décollement zone, but is focused at spehorizons. Therefore, although most of the deformation structuresrecording ductile deformation when viewed at the core and micscopic scales, this restriction of the shear strain to discrete intermeans that any overall view of the décollement gives the appearof a dominantly brittle mode of deformation. Karig and Morga(1994) have emphasized the exceptionally brittle style of deformtion at Barbados, and regard the basal décollement as a weak, bstructure that is compatible with implications from the paleomagndata (Housen, Chapter 6, this volume) and the low taper angle oprism (Dahlen, 1990). The décollement, therefore, consists in dof a narrow zone containing ductile deformation structures, but wviewed at the prism scale is essentially a brittle fault surface.
FLUIDS AND DEFORMATION STRUCTURES
There are several visible signs that fluids have been preferentconcentrated in and around the décollement zone. In general, thehas a paler coloration than adjacent material, especially in the uhalf, where it has a characteristic bright orange look with blablotches of manganese oxide. This coloration effect ignores litholic banding and appears secondary. Some core-scale scaly-fzones show color alteration within them, which in some stops abrly at the zone boundaries. In the upper part of the décollementblack manganese oxide patches are in places elongated alonscaly fabric; in one of the most striking specimens recovered fromdécollement (Plate 1, Fig. 2), the dark streaks closely follow aligned clays. In light of the microstructural observations, the appance shown in Plate 1, Figure 2 would be interpreted as a S-C bwith the manganese oxide preferentially concentrated along bothinclined S-surfaces and some of the bounding C-surfaces. Amongmost compelling evidence for fine-scale structural control on the id flow within the décollement is the occurrence, within the scaly faric illustrated in Plate 1, Figure 2, of prismatic crystals of barialigned parallel to the S-surfaces and absent from undeformed sment away from the scaly-fabric zone. As mentioned earlier, a furindication of concentrated fluid flow within parts of the décollemezone is the occurrence of strongly recrystallized radiolaria at cerhorizons.
The structural-fluid flow interplay is illustrated strikingly by thoccurrence of mineral veins in both the décollement and other fzones (Fig. 4). They consist mainly of calcium and magnesium
STRUCTURAL GEOLOGY OF THE DÉCOLLEMENT
the
Accretionar y prism
thrusts andlateral ramps
Underthrust section
Thrusts andlateral ramps
Décollement
Frontal thrust
Proto-décollement
Earlyflattening
strain
Broad, diffusezone of shearFracture networks
adjacent toscaly fabric zones
Fluid expelledby pore collapseBreccia
Intensification of deformationwithin décollement
Weak deformationin underthrust section
Localised overpressuringand dilation of pores andshear zones
Figure 9. Synoptic sketch to illustrate the structure of the décollement as seen at the two Leg 156 cored sites. Top sketch is based on seismic sections, and bottom sketch utilizes core-scale and microstructural data.
er
L
o
Tpi
t” ofe).
col- flu-
g ofkets.r flu-agingt to-mi-mbryomedn theoadally col-neral,uffi-
l dis-d atits in-ll beed.ha-ne of
annelroge-
nt atin de-te/
t het-cent. De-f theugh
bonates, but some contain zeolite and phillipsite. Labaume et al.(Chapter 5, this volume) identify four families of veins. One groupconsists of long, thin, extensional veins that parallel the foliationwithin scaly-fabric zones. Another family comprises the irregularveins and patches that cross weakly deformed sediment, but are relat-ed microscopically to fractures and are always close to scaly-fabriczones. A third type appears unrelated to faulting, but has only beenrecognized in some loose core-chips, probably originating from thelower part of the prism.
Particularly significant is a fourth group of veins, which showcomplex, multi-stage microstructures, including evidence of periodicmineral precipitation into open fractures. All the mineral growthshows extensional rather than shear geometry. The manganese con-tent of the fluid appears to have decreased through time, with a cor-responding increase in calcium, as the early precipitates are mainlyrhodochrosite, whereas the last formed minerals are calcite. The O-,C-, and Sr-isotope contents of the minerals show that the fluids musthave originated in the deeper parts of the prism, with decreasing mix-ing between the exotic and local pre-fluids through time. Such obser-vations, together with the chemical anomalies recorded in the upperpart of the décollement, indicate that the décollement zone is capof transporting fluids over long distances. The compound naturthe veins testifies that the drainage at any place happened intetently; the texture reflects a history of repeated dilatant “jacking” ding progressive deformation and fluid pulsation.
The model presented for the development of scaly fabric (baume et al., Chapter 4, this volume) involved porosity collapse lowing rotation and alignment of clay particles and expulsion of pfluid. This is one mechanism by which pulses of migrating fluid wbe generated. Where the aligned clays do not collapse but areapart by overpressured pore fluid, the reduction in tortuosity of flow path will allow the shear zones to act as potential conduits. same effect will arise where overpressured fluid is injected into a viously formed, but collapsed, scaly-fabric zone. Evidence that tha significant mechanism comes from the extensional fabric-paraveins mentioned above. The dilation associated with rotation ofclay particles into their preferred orientation is itself unlikely to halasted long enough to allow the precipitation of vein minerals. Ovpressured pore fluids are, therefore, invoked to prolong the dilatand the multiple nature of the vein-fill indicates that this happenedpeatedly. In addition, there is now laboratory evidence that subs
able ofmit-
ur-
a-fol-re
illheldthehere-
s islleltheveer-ion, re-tan-
tiates and goes some way towards quantifying this “jacking aparpre-existing clay alignments (Zwart et al., Chapter 24, this volum
A general model, therefore, involves the scaly-fabric zoneslapsing during their production and generating bodies of expelledid. The fluid is overpressured, due largely to tectonic thickeninthe prism, and tends to coalesce with other fluid into larger pocBearing in mind the fractal-like aspect of the fabrics, such greateid masses may correspond to those detected on the seismic imof the décollement. The prism taper gives a hydraulic gradienwards the deformation front, down which the fluid attempts to grate. The most permeable routes are chosen; these may be escaly zones still in a state of dilation or they may be already forshear zones of low tortuosity. Such zones will be redilated whefluid pressure reaches a critical proportion of the confining l(Zwart et al., Chapter 24, this volume), and they will preferentitransmit fluid pulses until the effective pressure rises again. Thelapsed scaly zone, perhaps now stained or coated with new miis then available for future re-opening when further pulses of sciently overpressured fluid arrive.
The whole scenario is, therefore, one of spatial and temporacontinuities. At any one time, the deformation will be concentratecertain intervals and areas of the décollement and, because of terplay with the fluid escape, the pockets of overpressuring wihighly localized. At a later time, the distribution will have changA major result of the Leg 156 drilling and related work is the empsis that the basal décollement of the Barbados prism is not a zouniformly intense and ongoing shear, acting consistently as a chof steady drainage. Its deformation and hydrogeology are heteneous, both spatially and through time.
SUMMARY AND CONCLUSIONS
The structural geology of cores recovered from the décollemethe toe of the Barbados accretionary prism has been analyzed tail, giving new insight into the nature and evolution of this plaboundary fault. The structure comprises a zone of intensified buerogeneous deformation, 31 m thick, but 39 m thick if suprajabreccia and various physico-chemical anomalies are includedspite the restricted thickness of such a significant fault, the bulk oshear strain is concentrated within thin intervals distributed thro
289
A. MALTMAN, P. LABAUME, B. HOUSEN
n
u fou
sfrmnd
btahgre
tig h
n
lou
lro
,
me
cc
c
cM.
bin,n
ault,
bri-and-
of
ip-er,T.,der-ng
and
men-
ci-31
andidge
gic
95.cre-
,
role
of
A.,nn,
.,iger,r-ary
ine-
os
,
,
94.dé-
the décollement, and these total less than 10% of the overall thickof the zone. Moreover, the shear fabrics are highly heterogenewith zones of sheared clay wrapping around relatively undeformlenses, at all scales of observation down to that of the individgrains.
Core-scale deformation features consist principally of fractnetworks, stratal disruption, and, most especially, zones of scalyric. Microscopic examination shows the scaly zones to consist combination of a pervasive flattening fabric and distributed slip sfaces, closely resembling S-C structures. These develop as strains supplant initial flattening microstructures, termed spaced ation. Continuing shear strain progressively dissects the undefolenses to produce an overall zone that becomes more intesheared, better defined, and narrower—the difference between ing Site 949 and the more landward Site 948.
The top of the décollement shows a pronounced change in theentation of magnetic anisotropy, indicating efficient decoupling tween the prism and the lower material. This is probably facilitaby overpressuring, even though fabric-parallel color changes mineralized veins testify to fluids migrating preferentially along tdécollement. Overpressuring at the décollement implies trappinfluids there, but this is compatible with facilitated drainage if the pcesses take place in alternating, periodic pulses. Analyses of thcrofabrics of the mineralized veins support this inference and helpplain the mechanisms. This, the most detailed examination to daa décollement zone at an active convergent plate margin, highlthat the deformation and drainage of the structure are strikinglyerogeneous, both spatially and through time.
ACKNOWLEDGEMENTS
Don Fisher and Yujiro Ogawa are thanked for helpful commeon the manuscript.
REFERENCES
Agar, S.M., Prior, D.J., and Behrmann, J.H., 1989. Back-scattered electronimagery of the tectonic fabrics of some fine-grained sediments: implica-tions for fabric nomenclature and deformation processes. Geology,17:901−904.
Bangs, N.L., and Westbrook, G.K., 1991. Seismic modelling of the décoment zone at the base of the Barbados Ridge accretionary compleJ.Geophys. Res., 96:3853−3866.
Berthé, D., Choukroune, P., and Jegouzo, P., 1979. Orthogneiss, myand non-coaxial deformation of granites: the example of the SoArmorican shear zone. J. Struct. Geol., 1:31−42.
Biju-Duval, B., Moore, J.C. et al., 1984. Init. Repts. DSDP, 78A: Washington(U.S. Govt. Printing Office).
Brothers, R.J., Kemp, A.E.S., and Maltman, A.J., 1996. Mechanical devement of vein structures due to the passage of earthquake waves thpoorly-consolidated sediments. Tectonophysics, 260:227−244.
Brown, K.M., 1994. Fluids in deforming sediments. In Maltman, A. (Ed.),The Geological Deformation of Sediments: London (Chapman and Hall)205−237.
Brown, K.M., and Behrmann, J.H., 1990. Genesis and evolution of sscale structures in the toe of the Barbados Ridge accretionary wedgInMoore, J.C., Mascle, A., et al., Proc. ODP, Sci. Results, 110: College Sta-tion, TX (Ocean Drilling Program)., 229−244.
Brown, K.M., Mascle, A., and Behrmann, J.H., 1990. Mechanisms of action and subsequent thickening in the Barbados Ridge accretionary plex: balanced cross-sections across the wedge toe. In Moore, J.C.,Mascle, A., et al., Proc. ODP, Sci. Results, 110: College Station, TX(Ocean Drilling Program), 209−227.
Dahlen, F.A., 1990. Critical taper model of fold-and-thrust belts and actionary wedges. Ann. Rev. Earth Planet. Sci., 18:55−99.
Fisher, A.T., Zwart, G., Shipley, T., Ogawa, Y., Ashi, J., Blum, P., Brümann, W., Filice, F., Goldberg, D., Henry, P., Housen, B.A., Jurado, J., Kastner, M., Labaume, P., Laier, T., Leitch, E.C., Maltman, A
290
essous,ed
ual
reab-f ar-
hearoli-
edselyrill-
ori-e-ednde ofo- mi- ex-e ofhtset-
ts
lle-x.
niteth
op-ugh
all.
re-om-
re-
k-.-
J.,
Meyer, A., Moore, J.C., Peacock, S., Rabaute, A., Steiger, T.H., ToH.J., Underwood, M.B., Xu, Y., Yin, H., and Zheng, Y., 1996. Relatiobetween permeability and effective stress along a plate boundary fBarbados accretionary prism. Geology, 24:307−310.
Hanamura, Y., and Ogawa, Y., 1993. Layer-parallel faults, duplexes, imcate thrusts and vein structures of the Miura Group: keys to understing the Izu forearc sediment accretion to the Honshu forearc. The IslandArc, 3:126−141.
Hicher, P.Y., Wahyudi, H., and Tessier, D., 1994. Microstructural analysisstrain localisation in clay. Computers and Geotechnics, 16:205−222.
Housen, B.A., Tobin, H.J., Labaume, P., Leitch, E.C., Maltman, A.J., Shley, T., Ogawa, Y., Ashi, J., Blum, P., Brückmann, W., Filice, F., FishA.T., Goldberg, D., Henry, P., Jurado, M.-J., Kastner, M., Laier, Meyer, A., Moore, J.C., Peacock, S., Rabaute, A., Steiger, T.H., Unwood, M.B., Xu, Y., Zheng, Y., and Zwart, G., 1996. Strain decoupliacross the décollement of the Barbados accretionary prism. Geology,24:127−130.
Karig, D.E., and Morgan J.K., 1994. Tectonic deformation: stress paths strain histories. In Maltman, A. (Ed.), The Geological Deformation ofSediments: London (Chapman and Hall), 167−204.
Lister, G.S., and Snoke, A.W., 1984. S-C mylonites. J. Struct. Geol., 6:617−638.
Maltman, A.J., 1987. Shear zones in argillaceous sediments - an experital study. In Jones, M.E. and Preston, R.M.F. (Eds.) Deformation of sedi-ments and sedimentary rocks. Geol. Soc. London Special Publication29:77−87.
Maltman, A.J., Byrne, T., Karig, D.E., Lallemant, S., and the Shipboard Sentific Party, 1992. Structural geological evidence from ODP Leg 1regarding fluid flow in the Nankai accretionary prism. Earth Planet. Sci.Lett., 109:463−468.
Mascle, A., Endignoux, L., and Chennouf, T., 1990. Frontal accretion piggyback basin development at the southern edge of the Barbados Raccretionary complex. In Moore, J.C., Mascle, A., et al., Proc. ODP, Sci.Results, 110: College Station, TX (Ocean Drilling Program), 17−28.
Mascle, A., and Moore, J.C., 1990. ODP Leg 110 tectonic and hydrolosynthesis. In Moore, J.C., Mascle, A., et al., Proc. ODP, Sci. Results, 110:College Station, TX (Ocean Drilling Program), 409−422.
Mascle, A., Moore, J.C., et al., 1988. Proc. ODP, Init. Repts., 110: CollegeStation, TX (Ocean Drilling Program).
Moore, G.F., Zhao, Z., Shipley, T.H., Bangs, N., and Moore, J.C. 19Structural setting of the Leg 156 area, Northern Barbados Ridge actionary prism. In Shipley, T.H., Ogawa, Y., Blum, P., et al., 1995. Proc.ODP, Init. Repts., 156: College Station, TX (Ocean Drilling Program)13−27.
Moore, J.C., 1989. Tectonics and hydrogeology of accretionary prisms: of the décollement zone. J. Struct. Geol., 11:95−106.
Moore, J.C., and Byrne, T., 1987. Thickening of fault zones: a mechanismmelange formation in accreting sediments. Geology, 15:1040−1043.
Moore, J.C., Shipley, T.H., Goldberg, D., Ogawa, Y., Filice, F., Fisher, Jurado, M.J., Moore, G.F., Rabaute, A., Yin, H., Zwart, G., BrückmaW., Henry, P., Ashi, J., Blum, P., Meyer, A., Housen, B., Kastner, MLabaume, P., Laier, T., Leitch, E.C., Maltman, A.J., Peacock, S., SteT.H., Tobin, H.J., Underwood, M.B., Xu, Y., and Zheng, Y., 1995. Abnomal fluid pressure and fault-zone dilation in the Barbados accretionprism: evidence from logging while drilling. Geology, 23:605−608.
Prior, D.J. and Behrmann, J.H., 1990a. Backscatter SEM imagery of fgrained sediments from Site 671, Leg 110 - preliminary results.InMoore, J.C., Mascle, A., et al., Proc. ODP, Sci. Results, 110: College Sta-tion, TX (Ocean Drilling Program), 245−255.
————, 1990b. Thrust-related mudstone fabrics from the Barbadforearc: a backscattered scanning electron microscope study. J. Geophys.Res., 95:9055−9067.
Shipboard Scientific Party, 1995a. Site 947. In Shipley, T.H., Ogawa, Y.,Blum, P., et al., 1995. Proc. ODP, Init. Repts., 156: College Station, TX(Ocean Drilling Program), 71−86.
————, 1995b. Site 948. In Shipley, T.H., Ogawa, Y., Blum, P., et al.1995. Proc. ODP, Init. Repts., 156: College Station, TX (Ocean DrillingProgram), 87−192.
————, 1995c. Site 949. In Shipley, T.H., Ogawa, Y., Blum, P., et al.1995. Proc. ODP, Init. Repts., 156: College Station, TX (Ocean DrillingProgram), 193−257.
Shipley, T.H., Moore, G.F., Bangs, N.L., Moore, J.C., and Stoffa, P.L., 19Seismically inferred dilatancy distribution, northern Barbados Ridge
STRUCTURAL GEOLOGY OF THE DÉCOLLEMENT
collement: implications for fluid migration and fault strength. Geology,22:411−414.
Shipley, T.H., Ogawa, Y., Blum, P., et al., 1995. Proc. ODP, Init. Repts., 156:College Station, TX (Ocean Drilling Program).
Date of initial receipt: 31 July 1996Date of acceptance: 13 December 1996Ms 156SR-037
the
ofn into
1 21 2
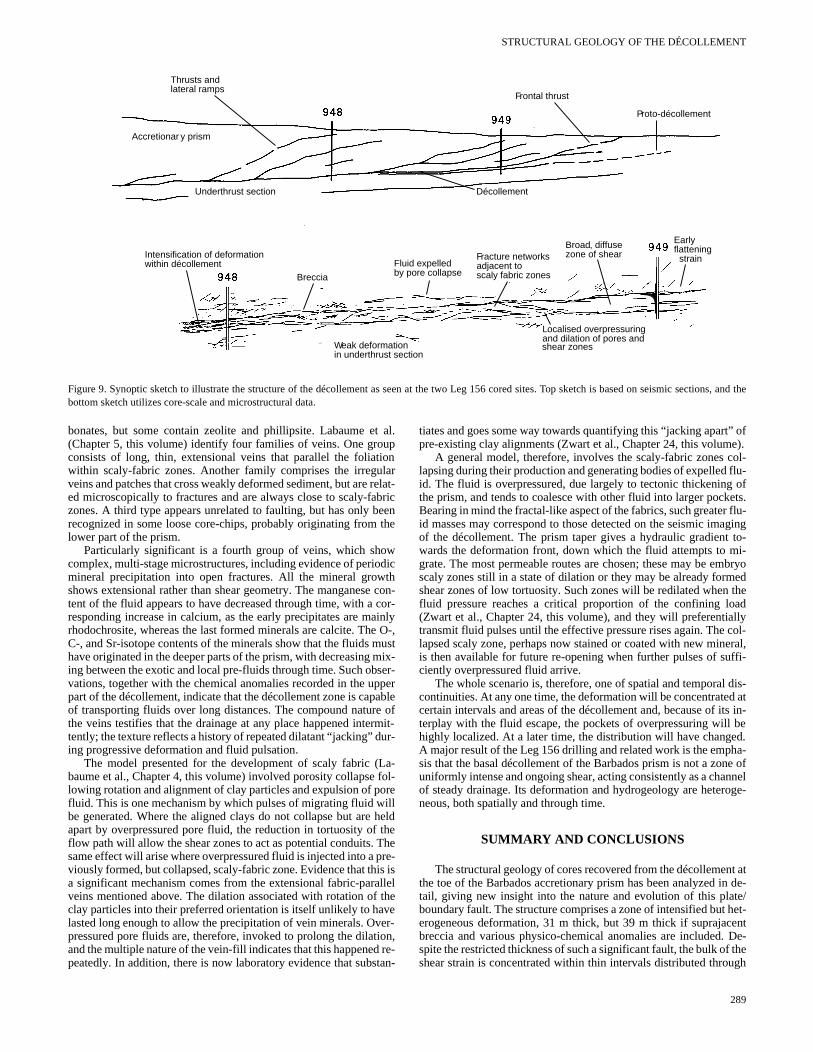
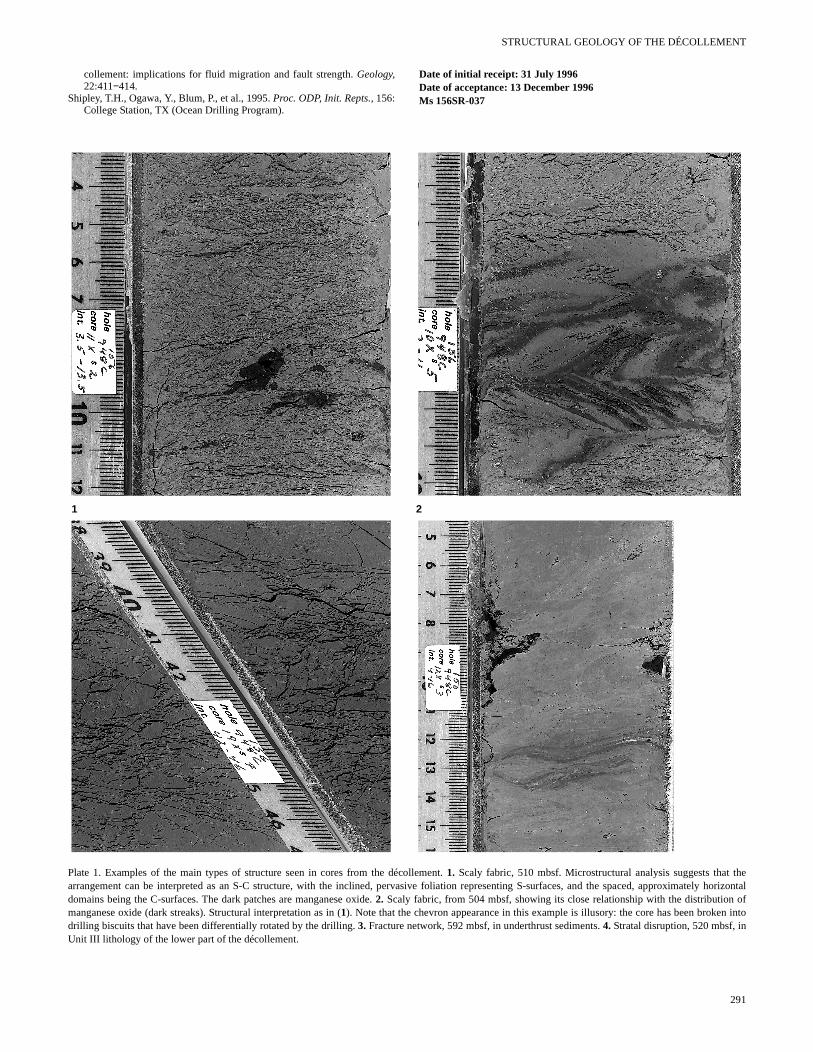
Plate 1. Examples of the main types of structure seen in cores from the décollement. 1. Scaly fabric, 510 mbsf. Microstructural analysis suggests that arrangement can be interpreted as an S-C structure, with the inclined, pervasive foliation representing S-surfaces, and the spaced, approximately horizontaldomains being the C-surfaces. The dark patches are manganese oxide. 2. Scaly fabric, from 504 mbsf, showing its close relationship with the distributionmanganese oxide (dark streaks). Structural interpretation as in (1). Note that the chevron appearance in this example is illusory: the core has been brokedrilling biscuits that have been differentially rotated by the drilling. 3. Fracture network, 592 mbsf, in underthrust sediments. 4. Stratal disruption, 520 mbsf, inUnit III lithology of the lower part of the décollement.
291
A. MALTMAN, P. LABAUME, B. HOUSEN
.
nd vary-
3 4
1 2
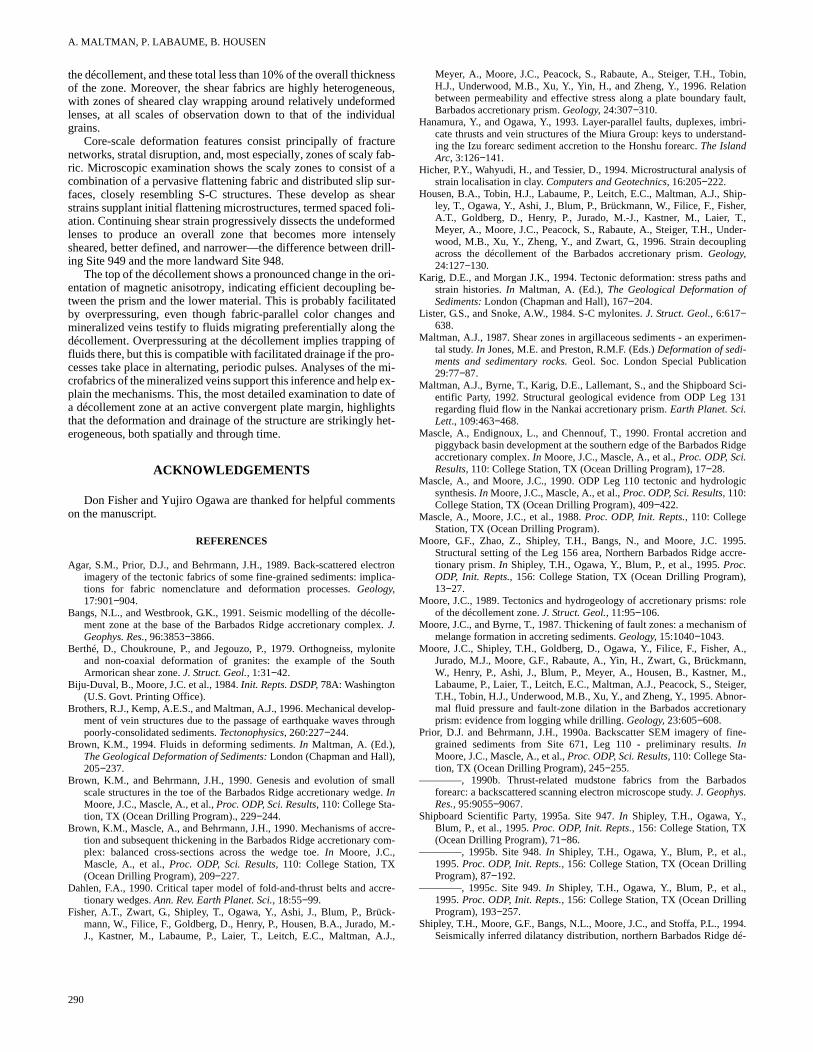
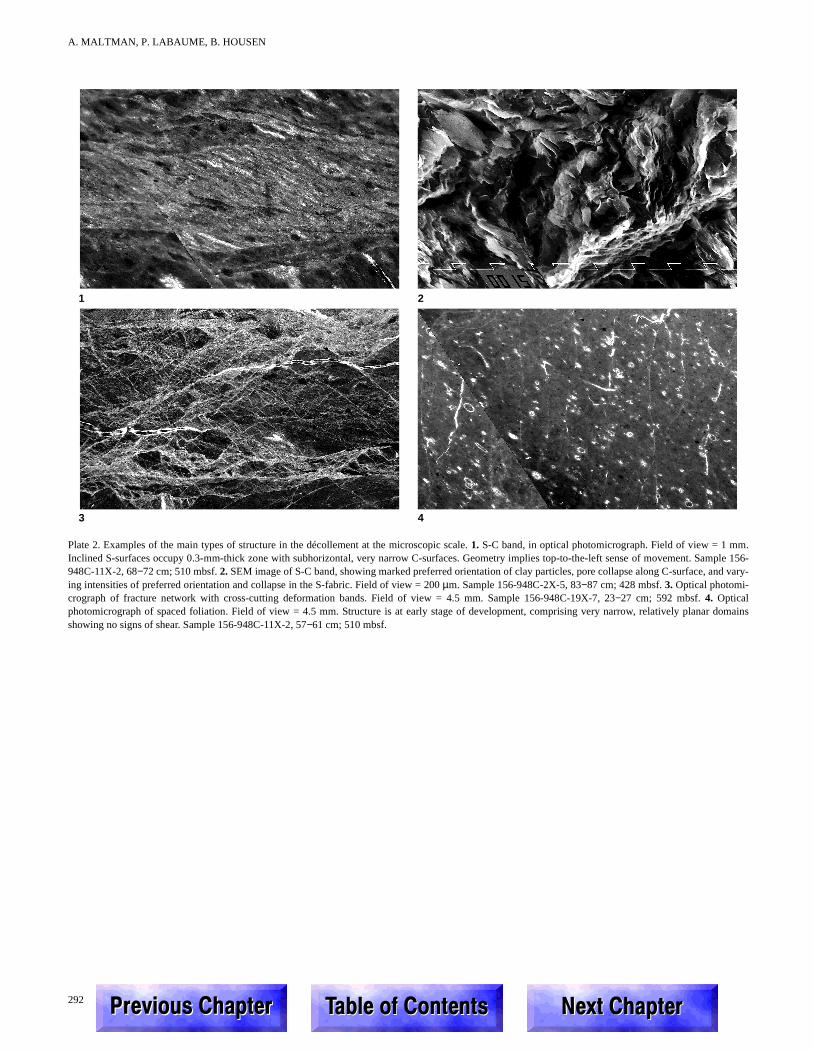
Plate 2. Examples of the main types of structure in the décollement at the microscopic scale. 1. S-C band, in optical photomicrograph. Field of view = 1 mmInclined S-surfaces occupy 0.3-mm-thick zone with subhorizontal, very narrow C-surfaces. Geometry implies top-to-the-left sense of movement. Sample 156-948C-11X-2, 68−72 cm; 510 mbsf. 2. SEM image of S-C band, showing marked preferred orientation of clay particles, pore collapse along C-surface, aing intensities of preferred orientation and collapse in the S-fabric. Field of view = 200 µm. Sample 156-948C-2X-5, 83−87 cm; 428 mbsf. 3. Optical photomi-crograph of fracture network with cross-cutting deformation bands. Field of view = 4.5 mm. Sample 156-948C-19X-7, 23−27 cm; 592 mbsf. 4. Opticalphotomicrograph of spaced foliation. Field of view = 4.5 mm. Structure is at early stage of development, comprising very narrow, relatively planar domainsshowing no signs of shear. Sample 156-948C-11X-2, 57−61 cm; 510 mbsf.
292 3UHYLRXV&KDSWHU3UHYLRXV&KDSWHU 7DEOHRI&RQWHQWV7DEOHRI&RQWHQWV 1H[W&KDSWHU1H[W&KDSWHU