of the rehabilitation program for relief wells dam… · cs concrete and steel structures em...
TRANSCRIPT

REPAIR, EVALUATION, MAINTENANCE, ANDREHABILITATION RESEARCH PROGRAM
TECHNICAL REPORT REMR-GT-18
EVALUATION OF THE REHABILITATION PROGRAMFOR RELIEF WELLS AT LEESVILLE DAM, OHIO
4D-A259 197 by',~ ~ ~ ~ ~~~~~~~~o E1! !1I I! ll ll!I !t!!,. Leach
Geotechnical Laboratory
DEPARTMENT OF THE ARMYWaterways Experiment Station, Corps of Engineers
3909 Halls Ferry Road, Vicksburg, Mississippi 39180-6199and
Glen Hackett
National Ground Water Association6375 Riverside DriveDublin, Ohio 43017 OTIC
8 ý=ELECTFSDEC02 41992 a
September 1992
Final Report
Approved For Public Release; Distribution Is Unlimited
92-32682
Prepared for DEPARTMENT OF THE ARMYUS Army Corps of Engineers
Washington, DC 20314-1000
Under Work Unit 32313
The following two letters used as part of the number designating technical reports of research published under theRepair, Evaluation, Maintenance, and Rehabilitation (REMR) Research Program identify the problem area under whichthe report was prepared:
Problem Area Problem Area
CS Concrete and Steel Structures EM Electrical and Mechanical
GT Geotechnical El Environmental Impacts
HY Hydraulics OM Operations Management
CO Coastal
Destroy this report when no longer needed. Do not returnit to the originator.
The findings in this report are not to be construed as an officialDepartment of the Army position unless so designated
by other other authorized documents.
The contents of this report are not to be used foradvertising, publication, or promotional purposes.Citation of trade names does not constitute anofficial endorsement or approval of the use of such
commercial products.
COVER PHOTOS:
TOP - Bacteria in water sample
BOTTOM - Well pump test

Form ApprovedREPORT DOCUMENTATION PAGE o o4-0188
Public reporting burden for this collection of information is estimated to average 1 hour er response, including the time for reviewing instructions, searching existing data sources.gathering and maintaining the data needed and completing and reviewng the collecion of information Send comments regarding this burden estimate or any other aspect of thiscollection of information, including suggestions for reducing this burden. to Washington Headquarters Services, Directorate for information Operations and Reports. 1215 JeffersonDavis Highway. Suite 1204. Arlington, VA 22202-4302, and to the Office of Management and Budget. Paperwork Reduction Project (0704-0188). Washington. DC 20503
1. AGENCY USE ONLY (Leave blank) 2. REPORT DATE 3. REPORT TYPE AND DATES COVERED
September 1992 Final report 5/86-6/874. TITLE AND SUBTITLE S. FUNDING NUMBERS
Evaluation of the Rehabilitation Program for ReliefWells at Leesville Dam, Ohio
6. AUTHOR(S) Work Unit 32313
Roy E. Leach
Glen Hackett
7. PERFORMING ORGANIZATION NAME(S) AND ADDRESSRES) 8. PERFORMING ORGANIZATIONREPORT NUMBER
See reverse. Technical Report-REMR-GT-18
9. SPONSORING/MONITORING AGENCY NAME(S) AND ADDRESS(ES) 10. SPONSORING/MONITORINGAGENCY REPORT NUMBER
US Army Corps of EngineersWashington, DC 20314-1000
11. SUPPLEMENTARY NOTES
Available from National Technical Information Service, 5285 Port Royal Road,Springfield, VA 22161
12a. DISTRIBUTION/ AVAILABILITY STATEMENT 12b. DISTRIBUTION CODE
Approved for public release; distribution is unlimited.
13. ABSTRACT (Maximum 200 words)
At a relief well and drainage system rehabilitation workshop held in April1985, it was determined that maintenance methods varied between Districts andthat no attempt had been made to document results versus the method used. TheHuntington District was planning the rehabilitation of 12 wells at Leesville Dam,Ohio, and agreed to use a composite of the various "common" Corps of Engineer(CE) cleaning methods along with the extra verification procedures needed todocument the results. Therefore, the objectives of the study were to document acommonly used CE well rehabilitation procedure, to provide the needed pre- andpost-verification data, and to evaluate the results.
For the study, encrustant, bacterial, and water analyses were conducted foruse in planning the rehabilitation procedure. Recommended procedures and thefinal selected procedures for rehabilitation are presented. Planning criteriarequired that the chemicals be industry accepted and commonly used with economics
, __(Continued)
14. SUBJECT TERMS 15. NUMBER OF PAGESDrainage Drains Evaluation 109Maintenance Rehabilitation Relief wells 16. PRICE CODERepair Subsurface Well bacteria
17. SECURITY CLASSIFICATION 18. SECURITY CLASSIFICATION 19. SECURITY CLASSIFICATION 20. LIMITATION OF ABSTRACTOF REPORT OF THIS PAGE OF ABSTRACT
UNCLASSIFIED UNCLASRTFI ED 11N TAQ TFT F.DNSN 7540-01-280-5500 Standard Form 298 (Rev 2-89)
Prescrtbed by A"N•'I %id 139-19298-102
7. (Concluded).
US Army Engineer Waterways Experiment StationGeotechnical Laboratory3909 Halls Ferry RoadVicksburg, MS 39180-6199
National Ground Water Association6375 Riverside DriveDublin, Ohio 43017
13. (Concludea).
being the final governing factor. The procedure used at this site incor-porated a long linear phosphate and sodium hypochlorite as chemicals withmechanical agitation using a surge block.
Several factors were considered during the evaluation: (a) the lake levelwas lowered between some of the pre- and post-pump tests; (b) there was nobacterial growth in two wells; and (c) there were hydrogeologic boundary con-ditions that altered groundwater quality, flow, and available bacterialnutrients from well to well. Although there were immediate benefits, post-bacterial analysis showed regrowth had started within 4 months of therehabilitation. There was no "as installed" specific capacity on record toevaluate overall results. Comparison of before and after pump tests indicatedan increase in specific capacity for the eight central wells (W-4 through W-11) considered to be representative of the well system that ranged from 35 to714 percent with an average value of 236 percent. The remaining four wellsare not included in the average values because they are at the end of thesystem, have less screen length, and appear to be founded in finer sediments.

PREFACE
This report was prepared at the US Army Engineer Waterways Experiment
Station (WES), Vicksburg, MS, and was sponsored by Headquarters, US Army Corps
of Engineers (HQUSACE), under the Work Unit 32313, "Rehabilitation of Relief
Wells and Drainage Systems" of the Repair, Evaluation, Maintenance, and
Rehabilitation (REMR) Research Program. The HQUSACE technical monitor was
Mr. Arthur H. Walz. This part of the study under REMR Wurk Unit 32313 was
conducted from May 1986 through June 1987 by the Soil and Rock Mechanics
Division (S&RMD) of the WES Geotechnical Laboratory (GL).
The research was conducted and the report was written by Mr. Glen
Hackett, formerly with the National Ground Water Association, and Mr. Roy E.
Leach, S&RMD. Mr. Gene P. Hale, GL, was the Problem Area Leader. The study
was under the supervision of Dr. Don Banks, Chief, S&RMD, and Mr. Milton
Myers, Chief, Soil Mechanics Branch (SMB). The work was conducted under the
general supervision of Dr. William F. Marcuson III, Director, GL. The REMR
Program Manager was Mr. William F. McCleese, WES, and the Directorate of
Research and Development (DRD) Coordinator, HQUSACE, was Mr. Jesse A.
Pfeiffer. Mr. James E. Crews and Dr. Tony C. Liu served as the REMR Overview
Committee.
The field study was conducted at Leesville Dam, Ohio, in the US Army En-
gineer District, Huntington, under the coordination of Messrs. L. W. Franks
and T. Plummer. The study would not have been possible without the District's
cooperation and support in allowing the research to be incorporated into one
of its ongoing rehabilitation projects. Dodson-Lindblom Associates, Inc.,
performed the actual well rehabilitation to Corps specifications.
At the time of the publication of this report, Director of WES was
Dr. Robert W. Whalin. Commander and Deputy Director was COL Leonard G.
Hassell, EN. -A--ei- - or /-
fi

CONTENTS
PagePREFACE ..... ....................................................... 1
CONVERSION FACTORS, NON-SI TO SI (METRIC)UNITS OF MEASUREMENT ........................................... .4
PART I: INTRODUCTION .... ...................................... .5
Background .... .............................................. 5Objectives .... .............................................. 5Scope ..... .................................................. 6
PART II: PROBLEM DEFINITION ................................... .7
Site Description .... ........................................ 7Problem Description .... ..................................... 8
PART III: METHOD OF STUDY ...................................... .9
General ..... ................................................ 9Site Characterization .... ................................... 9Analysis of Encrusting Material ............................ 10Vertical Profile of Iron Bacteria in the Wells ........... 10
Analysis of Groundwater Quality ........................... 12Developing and Conducting a Treatment Program .............. 12Evaluation of the Treatment Program ........................ 13
PART IV: SITE CHARACTERIZATION AND INITIAL SAMPLING RESULTS. 15
Site Geology and Hydrogeology .............................. 15Relief Well Description ..................................... 16Encrustant and Bacterial Sampling .......................... 17Groundwater Quality Sampling ............................... 17
PART V: TREATMENT SELECTION ................................. 19
Recommended Program .. ....................................... 19Selected Program ............................................ 19
PART VI: POST-PUMPING TEST AND SAMPLING RESULTS ........... 22
Pumping Test Results ........................................ 22Sanding of Wells ............................................ 24
In-Well Bacterial Sampling Results ......................... 24Groundwater Quality Results ................................. 25
PART VII: DISCUSSION ... ........................................ 26
Treatment Performance ....................................... 26Economics ................................................... 28
2

PART VIII: SUMMARY AND RECOMMENDATIONS ......................... 29
Summary ..................................................... 29Recommendations ............................................. 29
REFERENCES ........................................................ 31
TABLES 1-6
FIGURES 1-16
PHOTOGRAPHS 1-34
APPENDIX A: CONTRACTOR FURNISHED PUMP TEST DRAWDOWN CURVES ..... Al
APPENDIX B: BORING LOGS FOR RELIEF WELLS, LEESVILLE DAM, OHIO... Bi
3

CONVERSION FACTORS, NON-SI TO SI (METRIC)UNITS OF MEASUREMENT
Non-SI units of measurement used in this report can be converted to SI(metric) units as follows:
Multiply By To Obtain
feet 0.3048 meters
inches 25.4 millimeters
gallons 0.264 liters
4

EVALUATION OF THE REHABILITATION PROGRAM
FOR RELIEF WELLS AT LEESVILLE DAM, OHIO
PART I: INTRODUCTION
Background
1. From a Repair, Evaluation, Maintenance, and Rehabilitation (REMR)
program survey of United States Army Corps of Engineers (CE) district and
division practice, it was determined that rehabilitation of relief wells and
drains was a major maintenance item. The CE owns more than 5,000 relief wells
with related drain systems (piping, outlet valves, and regular sand drains
beneath soil and concrete structures). A REMR workshop held to discuss
maintenance problems revealed a diversity of rehabilitation procedures ranging
from severe neglect to state-of-the-art procedures with most programs relying
on availability of money and manpower or emergency management to trigger
rehabilitation. Guidance for rehabilitation exists in Engineering Manuals and
Regulations, but there is no set procedure and again economics is the govern-
ing factor for most CE well rehabilitation activity.
2. To be able to czmpare current cleaning procedures used by the CE
with any new methods that might be developed required merging of the several
procedures, determined at the workshop (which differed in detail), into a
"commonly used" CE method. The method chosen could not include all available
chemical or mechanical treatments; therefore, the adopted procedure was to use
industry "standard" chemicals and economical mechanical treatments. Once a
rehabilitation method was selected, its application required a presently
funded project where extra pre- and post-tests and documentation could be
conducted. The United States Army Engineer District, Huntington (OR}), was
planning the rehabilitation of 12 relief wells at Leesville Dam, Ohio, and
agreed to incorporate the extra work into the project.
Objectives
3. The primary objectives of this study were to:
a. Evaluate a basic rehabilitation procedure that is presently!Leing used in some form by a number of CE Districts.
5

k. Determine the type of data collection required to conduct andevaluate a successful relief well rehabilitation program.
c. Collect and evaluate data from the rehabilitation work atLeesville Dam.
4. A secondary objective is to compile the results of this study for
comparison with the results of other methods developed in the overall rehabil-
itation program. The documentation includes representative photos (1-28)
which will supply visual instruction for delineation of future problems.
Scope
5. This report provides the information necessary to plan, conduct, and
evaluate a relief well rehabilitation project using a procedure that has been
merged from several procedures used by CE Districts. Both the chemical and
mechanical cleaning aspects are discussed. The information presented is site
specific, and some minor adjustments would have to be made to adapt the
procedure to other sites.
6

PART II: PROBLEM DEFINITION
Site Description
6. Leesville Dam is an earthen embankment constructed by the United
States Army Corps of Engineers from 1935 to 1937 (Photos 1 and 2). The dam is
located in Orange Township, Carroll County, Ohio, at the confluence of the
South Fork and the North Fork of McGuire Creek (Figure 1). Leesville Lake was
created by damming McGuire Creek. McGuire Creek continues downstream from the
dam and discharges into Conotton Creek, which flows into Dover Reservoir and
the Tuscarawas River. Maintenance of the dam, as well as structures appurte-
nant to the dam, is overseen by personnel from ORB.
7. Consequent to the construction of Leesville Dam, underseepage at the
downstream toe of the dam created swampy conditions below the site of the dam.
To alleviate the wet surface conditions, a 4- to 8-ft*-thick filter blanket,
composed of coarse granular material enveloping a network of drainage tiles,
was installed below the damsite in November and December of 1975. In addi-
tion, 12 relief wells, at 75-ft horizontal spacings, were installed along the
length of the dam in late 1976 and early 1977 to lessen the hydrostatic
pressure beneath the dam. These wells were drilled through the filter blanket
and the rock toe of the dam, and into the underlying alluvial deposits.
Figure 2 is a plan view of the downstream side of the dam showing the location
of the 12 relief wells.
8. The relief wells terminate 4 to 7 ft below the surface of the filter
blanket and are individually housed within a 48-in.-diam corrugated metal
casing, with a hinged lid that is lock-bolted for security (Photo 3). A
general cross-sectional view of the housing for the individual relief wells is
shown in Figure 3. The relief wells are designed as uncapped, flowing wells
(Photo 4). The overflow from each well drains by gravity, through subsurface
drains in the filter blanket, and discharges into a collector ditch downstream
of the toe of the dam.
* A table of factors for converting non-SI units of measurement to SI
(metric) units is presented on page 4.
7

Problem Description
9. Pursuant to a request from personnel at the Waterways Experiment
Station (WES) and ORH, an inspection of the relief wells at Leesville Dam was
made in July, 1986, to determine whether the performance of the wells was
being impaired by iron bacteria. A visual inspection of the top of the relief
well casings and the floors of the well housings revealed the presence of
substantive amounts of reddish-brown, mucilaginous deposits characteristic of
iron-precipitating bacteria (Photo 5). Based on this presumptive visual
evidence of iron bacteria, the relief wells at Leesville Dam were selected for
study and inclusion in the well rehabilitation project. At that time,
however, the reduction in hydraulic performance of the relief wells, from the
apparent growth of iron bacteria, could not be determined because of the
absence of historic pumping test data for the wells. In general, it can be
stated that, before cleaning, wells 1, 2, 3, 11, and 12 did not flow and wells
4 - 10 did flow when the lake level was at elevation 963 ft. Also, the risers
for the nonflowing wells are 0.3 to 1.0 ft higher than the highest riser for a
flowing well. Wells 1, 2, 3, and 12 can only sustain very low pump rates and
are considered to be at the outer fringes of the water-bearing aquifer.
8

PART III: METHOD OF STUDY
General
10. The methodology for this study and subsequent well rehabilitation
project included the following items:
a. Site characterization.
b. Analysis of encrustant material.
c. Vertical profile of iron bacteria in the wells.
d. Analysis of groundwater quality.
e. Developing and conducting a chemical treatrent program.
f. Evaluation of the chemical treatment program.
Each item is discussed in some detail below.
Site Characterization
11. Characterization of the site involved evaluating the hydrogeology,
based on published information, and reviewing the design and construction of
the relief wells. Published reports, maps, and borehole logs were reviewed to
obtain information on the geology of the site. Borehole logs from the relief
wells and piezometers, as well as applicable engineering reports on previous
geotechnical studies conducted at Leesville Dam, were obtained from the ORH.
Information on the groundwater resources at the site was also obtained from
the Ohio Department of Natural Resources. These data primarily consisted of
driller's logs for domestic water wells drilled in the drainage basin of
McGuire Creek and Conotton Creek.
12. Specifications for the design and construction of the relief wells
at Leesville Dam were also received from the ORH. Technical critical criteria
for the design and installation of the filter pack, intake, and casing for the
relief wells were reviewed. The bid specifications for developing and pump
testing the relief wells, at the time of their initial installation, were also
reviewed. Records of the original pumping test results, however, were not
present in the files of the ORH.
9

Analysis of Encrusting Material
13. During the initial phase of this study, the reddish-brown, mucilag-
inous deposits occurring around the top of the majority of the relief well
casings were sampled in order to confirm the presence of iron bacteria. These
samples were collected by gently scraping the encrusting material away from
the surface of the well casing. This material was immediately placed in a
Nasco Whirl-PakTM containing water from the well (Photo 6), and the sample was
kept cool until analyze& at the contract laboratory.
14. The samples of the encrusting material were analyzed for the
presence of iron bacteria in accordance with Part 918 A. of the Standard
Methods for the Examination of Water and Wastewater (American Public Health
Association 1985). This procedure involves placing a small portion of the
material on a microscope slide, covering the material with a cover slip, and
examining the material under a low-power microscope for iron-encrusted
bacterial filaments.
Vertical Profile of Iron Bacteria in the Wells
15. An attempt also was made to determine the vertical distribution of
iron bacteria within the relief wells. The purpose for determining the
vertical profilp of iron bacteria in the relief wells was two-fold: (a) to
establish the presence or absence of iron bacteria, at depth, in the wells;
and (b) to identify any tendency for iron bacteria to occur at specific
vertical depths or zones in the wells. An empirical technique was used to
determine the presence of iron bacteria, at depth, in the relief wells. This
technique involved suspending solid surfaces in the wells, at fixed depths,
for a prescribed period of time. The solid surfaces, informally termed
"in-well collectors," served as sites for the attachment of iron bacteria.
These surfaces were subsequently retrieved from the wells and examined for the
presence of a biofilm containing iron bacteria.
16. The in-well collectors used in this study were fabricated by
cutting a one-eighth-inch-thick sheet of clear Plexiglas into I- by 3-in.
rectangles, and then drilling a small hole at one end of each rectangle. The
Plexiglas rectangles were identical in size to commercially available glass
microscope slides; however, the Plexiglas material eliminated concerns about
10

the potential breakage and loss of slides down in the wells. In order to
suspend the Plexiglas slides in the relief wells, monofilament line was used.
The monofilament line was measured and cut for each relief well, based on the
total depth of the well. Weights were tied to one end of the monofilament
line to anchor the line in the relief well. Brass, snap swivels were then
attached to the monofilament line at depths corresponding to the top, midsec-
tion, and bottom of the intake of the relief well. An exception to this
procedure, however, was made for relief wells W-l, -2, and -12. Due to the
short length of intake for each of these wells, snap swivels were attached to
the monofilament line at depths corresponding to the top and bottom of the
intake. Prior to attaching the Plexiglas slides to the weighted, monofilament
line for each relief well, the slides were immersed in a 50-mg/l chlorine
solution for 30 min. The slides were then rinsed with distilled water and
dried. Cotton string was threaded through the hole in each Plexiglas slide,
and the string was knotted forming a loop. The plexiglass slides were
attached to the weighted, monofilament line by hooking the cotton string
through the snap swivel (Photo 7). Each slide was labeled with the well
number and depth setting, and each weighted, monofilament line with attached
slides was placed in a sealed bag (Photo 8).
17. The in-well collectors were installed by slowly lowering the
weighted, monofilament line, with attached Plexiglas slides, through the
center of each relief well (Photo 9). Once the weighted end of the monofila-
ment line reached the bottom of the well, the top of the line was hooked
around a rung of the stationary ladder in each well housing to hold the
in-well collector in place (Photo 10). The in-well collectors were left in
the relief wells for a period of 19 days. The Plexiglas slides were then
retrieved by slowly raising the weighted, monofilament line from the relief
well (Photo 11) and carefully removing each slide from the snap swivel. The
individual Plexiglas slides were immediately immersed in distilled water in a
Nasco Whirl-Pak (Photo 12), and the slides were kept cool until analyzed at
the contract laboratory. The Plexiglas slides were directly analyzed for the
presence of iron bacteria by placing a cover slip on the plexiglass slide and
examining the slide using light microscopy.
11
Analysis of Groundwater Quality
18. During the course of this study, groundwater samples from the 12
relief wells were collected and analyzed for parameters considered important
to the growth of iron bacteria in groundwater. These parameters included ph,
temperature, oxidation-reduction potential, dissolved oxygen, ferrous iron,
and chemical oxygen demand (COD).
19. Temperature and pH measurements were made onsite using an Orion SA
250 portable meter with a Ross Combination Epoxy Body pH electrode and
automatic temperature compensation probe (Photo 13). An Orion redox elec-
trode, Model 96-78, was also used in the field with the SA 250 portable meter
for measuring the oxidation-reduction potential of the groundwater samples,
and an Orion Model 97-08 dissolved oxygen electrode was used with the SA 250
portable meter for dissolved oxygen determinations. Unfiltered, acid-
preserved groundwater samples were collected and taken to the contract
laboratory for COD and ferrous iron analyses. These two analyses were
conducted in accordance with Standard Methods for the Examination of Water and
Wastewater (American Public Health Association 1985).
20. Groundwater samples were collected from each relief well at a depth
of approximately 12 in. below the static or flowing water level. Samples were
collected and analyzed twice prior to the development and recommendation of a
chemical treatment program for controlling iron bacteria in the relief wells.
Groundwater samples were also collected and analyzed once after the treatment
program was completed.
Developing and Conducting a Treatment Program
21. The following information was reviewed prior to developing a
chemical treatment program to control iron bacteria in the relief wells at
Leesville Dam: (a) the hydrogeology of the site, (b) the design of the relief
wells, (c) the analysis of the encrusting material from the top of the relief
wells, (d) the results from the in-well collectors, and (e) the analysis of
the groundwater samples. Based on this information, a chemical treatment
program was recommended to the ORH. The recommended treatment program
included: (a) the type of chemicals to be used, (b) chemical concentrations,
(c) contact time for the chemicals in the well, (d) method for introducing the
12

chemicals in the well, and (e) method for surging the chemicals in the well.
Details of the recommended chemical treatment program, as well as the actual
treatment program used, are given in Part IV.
22. Prior to conducting the chemical treatment program in each relief
well, a temporary 5- to 6-ft length of casing had to be added to the well to
maintain a static water level inside the casing, above the floor of the relief
well housing. Maintaining the static water level inside the casing was
necessary in order to properly introduce, contain, and surge the chemicals in
the well. A 10-in.-diam PVC well casing was used for the temporary casing
extension. A neoprene sleeve was used to join the PVC riser pipe to the
fiberglass relief well casing (Photos 14 and 15). The neoprene sleeve was
secured to each pipe with stainless steel bands. Vertical support for the PVC
riser pipe was provided by extending the PVC pipe through a plywood platform
placed over the relief well housing (Photo 16).
Evaluation of the Treatment Program
23. During the final phase of the well rehabilitation project, the
effectiveness of the chemical treatment program was evaluated in two ways:
(a) by performing a pumping test on each relief well, both before and after
the chemical treatment program; and (b) by placing in-well collectors in the
relief wells after the treatment program was completed.
24. A step-drawdown pumping test was performed on the relief wells.
The test was conducted by setting a submersible turbine pump in the well and
pumping the well at three different rates, where possible, for a period of
2 hr at each rate (Photo 17). Riser pipe extensions were added to the wells
prior to the pumping tests allowing an initial static water level to be
measured for use as a basis for computing drawdowns. That some of the wells
were flowing prior to the rehabilitation pumping tests is evident from the
fact that water levels in the riser pipe extensions, except for wells W-l, -3,
-11, and -12, were higher than the tops of the well risers without the
extension. The elevations of the tops of risers for wells W-1, -2, -3, -11,
and -12, at the ends of the well line, are about a foot or so higher than that
of the remaining wells. Thus, in addition to the fact that W-l, -2, -3, and
-12 are low-producing wells, this increase in the elevations may account for
the absence of flow before the extensions. The scope of this study, however,
13

did not provide for a detailed analysis of the impact of hydrogeologic
boundary conditions and lake pool elevations on the pumping test results.
25. In-well collectors were placed in the relief wells, approximately 4
months after the chemical treatment program, to determine whether regrowth of
iron bacteria was occurring in the wells. Any regrowth of iron bacteria in
the relief wells was used as a long-term measurement of the effectiveness of
the treatment program.
14

PART IV: SITE CHARACTERIZATION AND INITIAL SAMPLING RESULTS
Site Geology and Hydrogeology
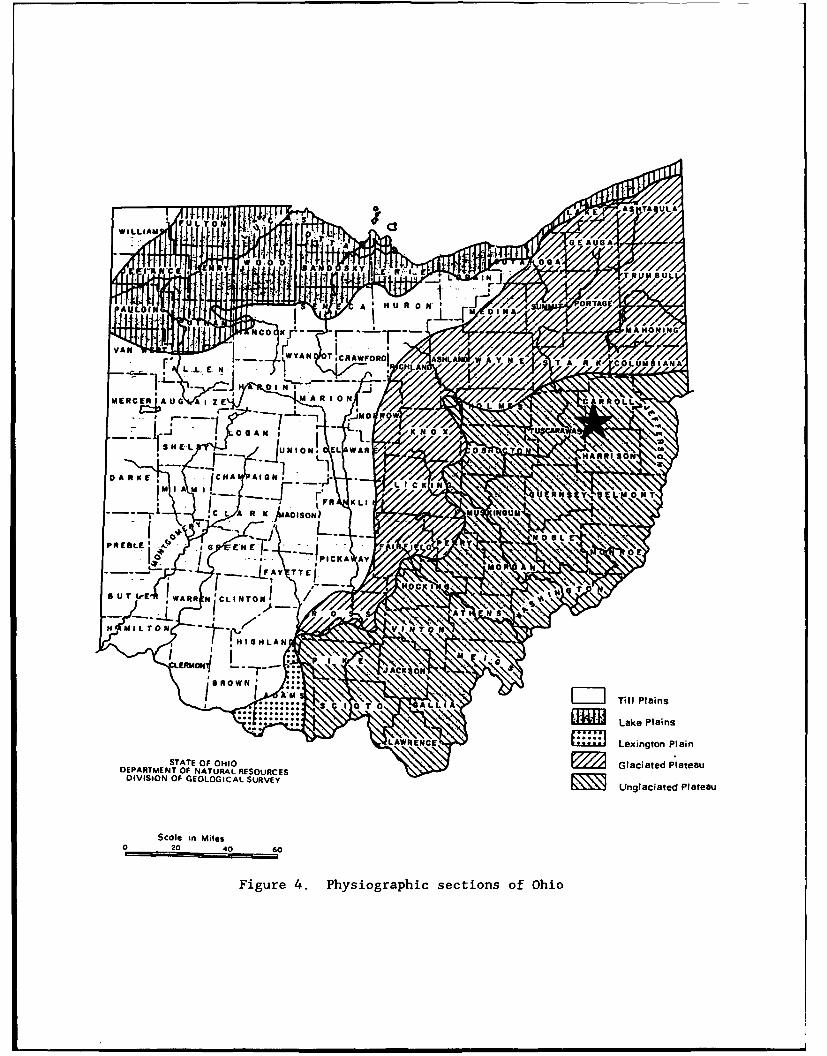
26. The study site is located in the Unglaciated Plateau section of the
Allegheny physiographic province (Figure 4). The Unglaciated Plateau is the
hilliest part of Ohio and is characterized by narrow ridges and steep-sided
valleys with narrow floodplains. Ridges are typically capped with resistant
sandstone, and the region has been maturely dissected by areal streams.
Bedrock is commonly exposed in the valley walls.
27. At the site of Leesville Dam, the valley floodplain of McGuire
Creek is approximately 1,000 ft wide and is approximately 930 ft above mean
sea level (Figure 1). The valley walls slope moderately upward for about
500 ft toward the maturely dissected upland. A geologic cross section along
the downstream toe of the dam is shown in Figure 5. Boring logs for the 12
relief wells are included in Appendix B.
28. Based on information from the boring logs for the relief wells, the
unconsolidated deposits within the valley of McGuire Creek range in thickness
from approximately 25 ft, near the sides of the valley, to approximately
95 ft, in the deepest part of the valley. The unconsolidated material
overlying the bedrock consists of alluvial deposits which are characterized as
predominantly silty to clayey sand (Figiir. 5). It appears that the alluvial
deposits close to the valley walls are generally less permeable than the
deposits near the center of the valley.
29. Bedrock at the site consists of a predominantly shale-sandstone
sequence with minor amounts of coal and underclay. Based on general strati-
graphic information for bedrock in the McGuire Creek and Conotton Creek
basins, these rocks represent formations from the Pennsylvanian Period.
Cyclothems of alternating sandstones and shales of the Conemaugh and underly-
ing Allegheny formations reportedly outcrop along the higher ridges. Inter-
bedded sandstones and shales of the older Pottsville formation occur beneath
the floodplain of McGuire Creek (US Army Corps of Engineers 1978).
30. The principal water-bearing formations in the area are the more
permeable sandstones and sandy shales. These formations, however, are not
consistent in thickness, character, and areal extent, and well yields typi-
cally range from 5 to 10 gpm (ODNR 1962). Alluvial deposits in the major
15

stream valleys may also serve as a local source of groundwater. These
deposits consist principally of clay, silt, fine sand, and some gravel and
generally yield adequate amounts of water for domestic supplies.
Relief Well Description
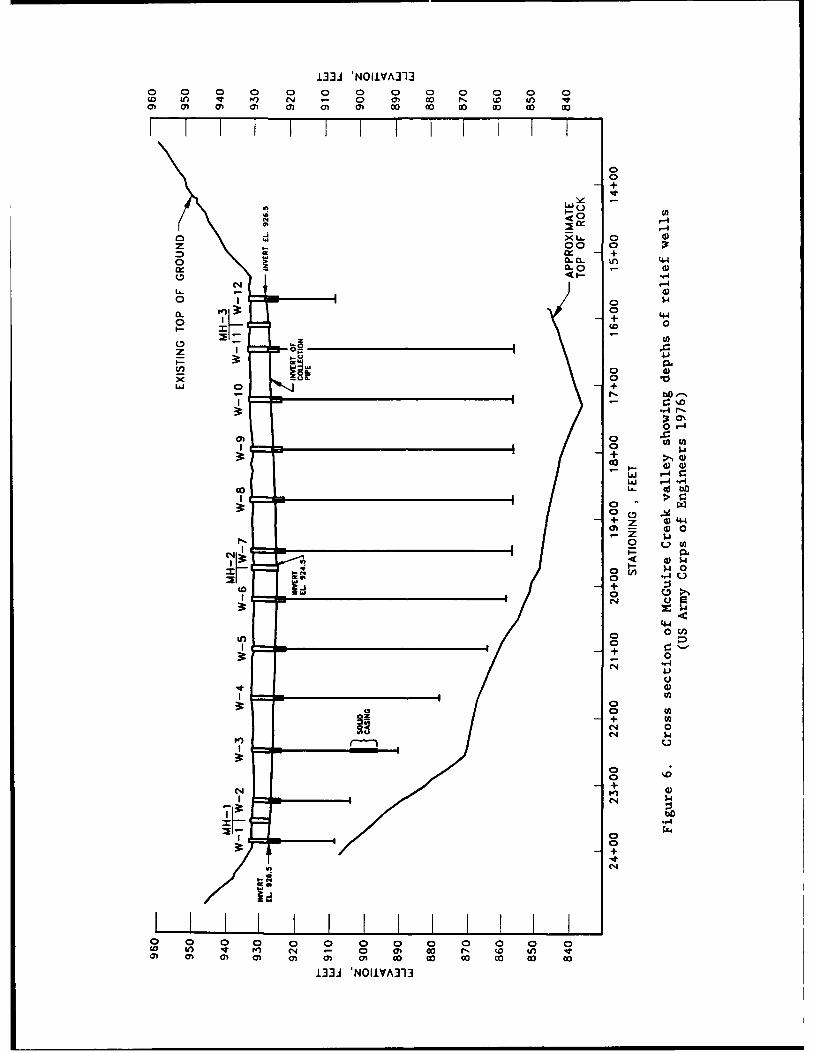
31. Figure 6 is a cross section of the valley of McGuire Creek showing
the relative depths of the 12 relief wells. Table 1 (US Army Corps of
Engineers 1976) lists elevations and lengths of various components of each
relief well. Based on the information provided in Table 1, the depths of the
relief wells, as measured from the floor of the well housings, range from
19.39 ft for relief well W-12 to 69.88 ft for relief well W-7.
32. The twelve relief wells at Leesville Dam are similar in design and
construction. The upper 8 to 10 ft of each well consist of solid, fiberglass
casing with an inner diameter of 10 in. (Figure 3). Below this length, the
fiberglass casing is perforated. The perforated casing serves as the well
"screen" and extends to the bottom of the well. The approximate length of the
intake for each relief well is given in Table 1. The only exception to the
standard design is relief well W-3, where a 10-ft, solid length of casing was
installed through an apparent alluvial clay deposit between elevations 895 and
905 ft above mean sea level (see Figure 6 and boring log for relief well W-3
in Appendix B).
33. The written design specifications for the relief wells state that
the perforations in the fiberglass pipe are machine-cut slots with a width of
one-sixteenth inch and a length of approximately 1-3/4 in. The slots provide
for a minimum total open area of 42 sq. in. per linear foot of the 10-in.-diam
pipe. This minimum open area represents approximately 11 percent of the total
surface area of the pipe. The slots are distributed in a uniform pattern
around the periphery of the pipe, and the openings are oriented with the
length of the slot normal to the axis of the pipe.
34. The 10-in, fiberglass casing and screen are centered in a 24-in.
-diam borehole that is "filter packed" from the bottom of the well to an
approximate elevation of 920 ft above mean sea level. The filter pack ar-und
the intake of each well is approximately 7 in. thick. The written design
specifications for the relief wells specify that the filter pack material is a
noncarbonaceous stone with less than 3 percent by weight of soft, friable,
16

thin, or elongated particles. Gradation of the material is as follows:
US Standard Sieve Percent by WeightOpening Passing
No. 4 95-100No. 8 70-90No. 16 30-70No. 30 15-50No. 50 5-15No. 100 0-5
Encrustant and Bacterial Sampling
35. The laboratory analysis of the samples of reddish-brown, mucilagi-
nous denosits collected from the surface of the relief well casings on July
31, 1986, confirmed the presence of filamentous iron-precipitating bacteria.
With the exception of relief well W-1, the sampled deposits from every well
contained significant amounts of iron-encrusted bacterial sheaths. Photomi-
crographs of these bacterial sheaths were taken and used to tentatively
classify this filamentous form of iron bacteria as Leptothrix (Photo 18).
36. Table 2 lists the findings from the in-well collectors that were
placed in relief wells throughout the 19-day period from July 31, 1986, to
August 19, 1986. The in-well collectors confirmed that 10 out of the 12
relief wells had iron bacteria occurring, at depth, in the well. These iron
bacteria were tentatively classified as species of the genera Leptothrix-
Sphaerotilus. Growth on the plexiglass slides was generally moderate to
heavy. Where iron bacteria were present in a well, they typically occurred at
all depths along the intake.
Groundwater Quality Sampling
37. Table 3 contains the results of groundwater quality samples
collected from the 12 relief wells. Samples were collected and analyzed for
temperature, pH, oxidation-reduction potential, and dissolved oxygen on July
31, 1986, and August 19, 1986. Samples also were collected on July 31, 1986,
for COD and ferrous iron and taken to the contract laboratory for analysis.
Values listed in Table 3 for these chemical parameters indicate that the
17

quality of the groundwater varied from slightly acidic to slightly alkaline
and that the water was typically low in dissolved oxygen with a corresponding-
ly low oxidation-reduction potential. In relief well W-l, however, where the
dissolved oxygen concentration was higher, the water had a higher oxidation-
reduction potential. The reported values for COD indicated appreciable
organic matter in the groundwater, with the exception of samples collected
from relief wells W-l, -3, and -10. Significant amounts of iron were found in
all relief wells except wells W-l, -4, and -5. In general, the values for the
water-quality parameters fell within the general ranges acknowledged as
suitable for the occurrence and growth of various iron-precipitating bacteria
in groundwater (Hackett and Lehr 1985).
18

PART V: TREATMENT SELECTION
Recommended Program
38. Based on the characterization of the site and the initial biologi-
cal and chemical sampling results, a three-step chemical treatment program for
the relief wells at Leesville Dam was recommended to personnel at the ORH. The
recommended three-step treatment program for each well involved the sequential
use of the following chemicals:
(a) a long-linear phosphate, (b) hydroxyacetic acid, and (c) sodium hypochlo-
rite.
39. Long-linear phosphates were recommended for the first step of the
treatment program for two reasons: (a) phosphates are sequestering agents
that are capable of forming soluble complexes with iron, thereby preventing
dissolved iron in groundwater from precipitating out of solution when using
strong oxidants, like chlorine, during latter steps in the treatment program;
and (b) phosphates have detergent capabilities that disperse the mucilaginous
deposits resulting from the growth of iron bacteria, thereby enhancing the
subsequent use of a disinfectant to kill the living bacterial cells within
these deposits. The second step of the recommended chemical treatment program
included the use of hydroxyacetic acid for three reasons: (a) hydroxyacetic
acid is an organic acid that acts as a systemic biocide against some iron
bacteria; (b) hydroxyacetic acid has a moderate capability to chemically
dissolve encrusting iron surrounding the bacterial sheaths and living bacteri-
al cells; and (c) hydroxyacetic acid is a chelating agent that can form
soluble complexes with iron and maintain the iron in solution. The third and
final step of the recommended chemical treatment involved the use of sodium
hypochlorite because chlorine is an effective disinfectant against the diverse
group of bacteria, collectively known as iron-precipitating bacteria.
Selected Program
40. After reviewing the recommended chemicals for use in the treatment
program, the Huntington, West Virginia District Office authorized a two-step
chemical treatment program using long-linear phosphates and sodium hypo-
chlorite. Acids were not used because of a concern by personnel in the
19

district office that the acid might affect the structural integrity of the
fiberglass casing.
41. Details of the actual chemical procedures used to clean and
rehabilitate each relief well at Leesville Dam included two steps:
42. A commercially available long-linear phosphate solution, known as
Aqua-MagTM, was obtained in 55-gal drums (Photo 19). A small electrical,
metering pump was used to measure and dispense a predetermined volume of the
phosphate solution into an empty 55-gal drum (Photos 20, 21, and 22). The
predetermined volume of phosphate solution was equivalent to 3 percent of the
well volume. The well volume was calculated as the volume inside the casing
and intake plus the volume in the filter pack (using a porosity value of 40
percent), multiplied by an empirical factor of 1.5. The premeasured volume of
phosphate solution was then pumped from the 55-gal drum, through a flexible
1-1/2-in.-diam hose, into the relief well (Photo 23). The discharge end of
the flexible hose was initially positioned at the bottom of the well screen
and was slowly raised to the top of the well screen as the phosphate solution
was pumped into the well. Immediately after adding the long-linear phosphates
to the well, the phosphates were surged in the well using a mechanical surge
block (Photos 24 and 25). Surging started at the top of the well intake and
continued downward to the bottom of the intake, at a rate of 15 ft/hr. The
length of the stroke of the surge block was approximately 36 in., and the
measured rate of fall of the surge block was about 3 ft/sec. The phosphates
were surged in the well for a period of 2 to 4 hr. (Note: An initial attempt
was made to surge the wells by hand using a cathead as shown in Photo 26.
This technique was found to be inadequate for sustaining the required surging
action over the prescribed period of 2 to 4 hr. A mechanically powered drill
rig was subsequently used to surge the relief wells throughout the chemical
treatment program). As surging progressed, each well was periodically bailed
to remove accumulated sediment in the well (Photo 27).
43. After the phosphates were surged in the well, a premeasured volume
of commercial grade sodium hypochlorite, containing 12 percent available
chlorine, was added to the well (Photo 28). The amount of sodium hypochlorite
added to the well was equivalent to a 50-mg/l concentration, by weight, of
chlorine. This chlorine solution was added to suppress any immediate growth
of iron bacteria that may have been stimulated by the addition of the
20

phosphates to the well. The chlorine solution was surged in the well for 2 hr
using the same surging technique as previously described for the phosphates.
After surging the chlorine solution, the chemicals were left in the well
overnight. The following morning, the well was surged for 30 min, and the
chemicals were then pumped from the well.
Ste_ 2
44. Immediately after pumping the well and removing the chemicals from
Step 1, a second 3 percent concentration, by volume, of phosphate solution was
pumped into the well. The phosphate solution was surged in the well for 2 to
4 hr using the same surging techniques as previously described in Step 1.
45. After the phosphates were surged in the well, a premeasured volume
of sodium hypochlorite was added to the well to obtain a 1,000-mg/l concentra-
tion, by weight, of chlorine in the well. The chlorine was surged in the well
for 4 hr using the same surging technique as previously described in Step 1,
and the chemicals were left in the well overnight. Throughout the night the
chlorine residual was periodically checked using a Hach Model CN-DT chlorine
test kit with a digital titrator. Additional sodium hypochlorite was added to
the well, when necessary, to maintain a 1,000-mg/l concentration of total
chlorine in the well. The following morning the well was surged for 30 min,
and the chemicals were then pumped from the well.
21
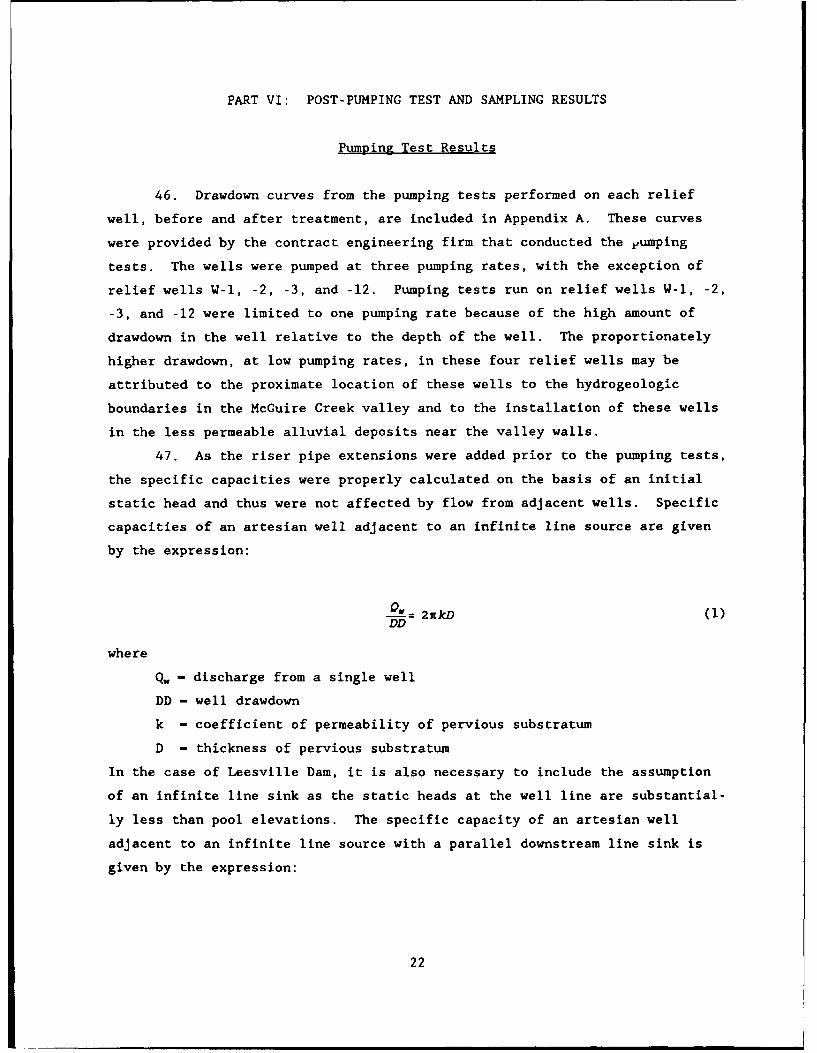
PART VI: POST-PUMPING TEST AND SAMPLING RESULTS
Pumping Test Results
46. Drawdown curves from the pumping tests performed on each relief
well, before and after treatment, are included in Appendix A. These curves
were provided by the contract engineering firm that conducted the Vumping
tests. The wells were pumped at three pumping rates, with the exception of
relief wells W-1, -2, -3, and -12. Pumping tests run on relief wells W-1, -2,
-3, and -12 were limited to one pumping rate because of the high amount of
drawdown in the well relative to the depth of the well. The proportionately
higher drawdown, at low pumping rates, in these four relief wells may be
attributed to the proximate location of these wells to the hydrogeologic
boundaries in the McGuire Creek valley and to the installation of these wells
in the less permeable alluvial deposits near the valley walls.
47. As the riser pipe extensions were added prior to the pumping tests,
the specific capacities were properly calculated on the basis of an initial
static head and thus were not affected by flow from adjacent wells. Specific
capacities of an artesian well adjacent to an infinite line source are given
by the expression:
0_= 2akD (1)DD
where
Q. - discharge from a single well
DD - well drawdown
k - coefficient of permeability of pervious substratum
D - thickness of pervious substratum
In the case of Leesville Dam, it is also necessary to include the assumption
of an infinite line sink as the static heads at the well line are substantial-
ly less than pool elevations. The specific capacity of an artesian well
adjacent to an infinite line source with a parallel downstream line sink is
given by the expression:
22
Q, _ 21tkDDD 2cD 1/2
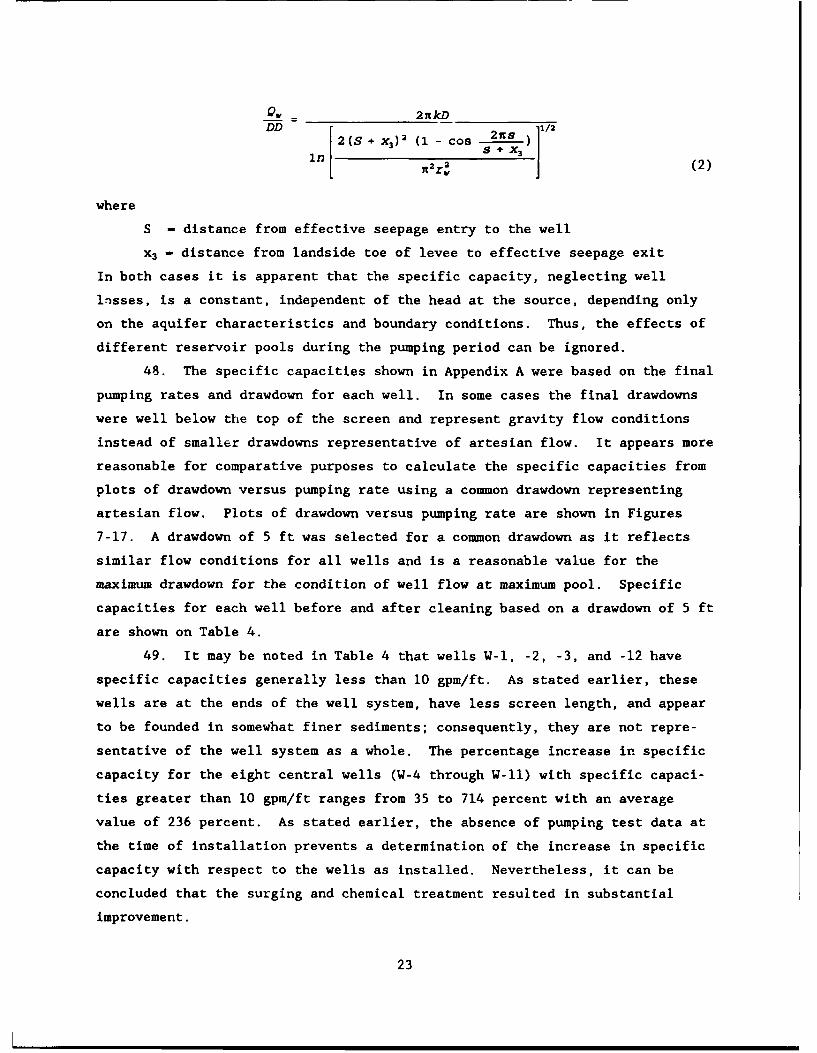
2(S + x 3)2 (1 - cos 2-S 1/21n S + J ( 2 )
where
S - distance from effective seepage entry to the well
X3 - distance from landside toe of levee to effective seepage exit
In both cases it is apparent that the specific capacity, neglecting well
losses, is a constant, independent of the head at the source, depending only
on the aquifer characteristics and boundary conditions. Thus, the effects of
different reservoir pools during the pumping period can be ignored.
48. The specific capacities shown in Appendix A were based on the final
pumping rates and drawdown for each well. In some cases the final drawdowns
were well below the top of the screen and represent gravity flow conditions
instead of smaller drawdowns representative of artesian flow. It appears more
reasonable for comparative purposes to calculate the specific capacities from
plots of drawdown versus pumping rate using a common drawdown representing
artesian flow. Plots of drawdown versus pumping rate are shown in Figures
7-17. A drawdown of 5 ft was selected for a common drawdown as it reflects
similar flow conditions for all wells and is a reasonable value for the
maximum drawdown for the condition of well flow at maximum pool. Specific
capacities for each well before and after cleaning based on a drawdown of 5 ft
are shown on Table 4.
49. It may be noted in Table 4 that wells W-l, -2, -3, and -12 have
specific capacities generally less than 10 gpm/ft. As stated earlier, these
wells are at the ends of the well system, have less screen length, and appear
to be founded in somewhat finer sediments; consequently, they are not repre-
sentative of the well system as a whole. The percentage increase in specific
capacity for the eight central wells (W-4 through W-11) with specific capaci-
ties greater than 10 gpm/ft ranges from 35 to 714 percent with an average
value of 236 percent. As stated earlier, the absence of pumping test data at
the time of installation prevents a determination of the increase in specific
capacity with respect to the wells as installed. Nevertheless, it can be
concluded that the surging and chemical treatment resulted in substantial
improvement.
23
Sanding of Wells
50. The surging which accompanied the well cleaning operations produced
relatively large amounts of sand in the wells. The average rate of sand
produced, as indicated by soundings in the wells, varied from 0.02 ft/hr at
well W-1 to 0.74 ft/hr at well W-8. Except for well W-1, all wells produced
sand at or in excess of 0.25 ft/hr. A rate of 0.25 ft/hr in a 10-in.-diam
well translates into approximately 8 pt/hr. The period of surging varied from
4 to 10 hr with no indications of reduced sand production with time. A well
that continues to produce sand in excess of 2 pt/hr is generally considered
unacceptable. Consequently, it appears that the wells may not have been
effectively developed at the time of installation. This fact is born out by
the large rocks measuring 2-1/2 to 3-1/2 in. that were found in well W-2
during the surging and chemical treatment. Furthermore, the size of the
screen slots, one-sixteenth inch or 1.58 mm, appears to be overly large with
respect to the specified filter gradation. Thus, it is possible that the
mechanical surging in itself may have produced significant increases in
specific capacity. If true, these increases would account for lack of
correlation between improvements in specific capacity and the presence or lack
of filamentous iron bacteria in the well before testing.
In-Well Bacterial Sampling Results
51. Table 5 presents the results from the in-well collectors that were
reset in the relief wells approximately 4 months after the chemical treatment
program was completed. The in-well collectors were placed in the wells
throughout the 19-day period from April 16, 1987, to May 5, 1987. Results
from the in-well collectors showed that 7 of the 12 relief wells had growth of
iron bacteria reoccurring, at depth, in the well. These iron bacteria were
tentatively classified as species of the genera Gallionella and Leptothrix-
Sphaerotilus, and growth on the plexiglass slides was generally reported as
"few." Where iron bacteria were present in a well, they were present at all
depths along the screen, except for relief wells W-3, -5, -8, and -10. In
these four wells, the results from the in-well collectors indicate that the
iron bacteria had a general tendency to occur only at shallower depths along
the well screen.
24

Groundwater Quality Results
52. The results from the groundwater samples collected from the 12
relief wells after chemical treatment are listed in Table 6. Samples were
collected on April 16, 1987, and analyzed for COD and ferrous iron. In
addition, samples for temperature, pH, oxidation-reduction potential, and
dissolved oxygen were collected and analyzed on May 5, 1987. No determination
of dissolved oxygen in the groundwater sample from relief well W-2 was made
because the dissolved oxygen probe could not provide a stable reading.
53. Values for the groundwater quality parameters listed in Table 6
indicate that the quality of the groundwater continued to be slightly acidic
to slightly basic. The groundwater contained low levels of dissolved oxygen,
with the exception of samples from relief wells W-1 and -11, and was generally
characterized by lower oxidation-reduction potentials. Reported values,
however, for COD and dissolved iron concentrations indicate substantive change
from the previous samples collected before the chemical treatment program.
Iron mineralization in the groundwater had increased significantly. However,
the dissolved iron concentrations in relief wells W-l, -2, -4, and -5 remained
relatively lower than values from the other wells. A noticeable drop had also
occurred in the organic matter content in the groundwater, as measured by the
COD values, with the exception of samples collected from relief wells W-9
and -12.
25

PART VII: DISCUSSION
Treatment Performance
54. Based on the median value for the percent increase in specific
capacity for the wells at Leesville Dam with greater than 10 gpm/ft of
drawdown (i.e. 236 percent for wells W-4 through W-11), the chemical treatment
program appeared to have an immediate beneficial effect on the hydraulic
performance of the wells. The degree of benefit is difficult to interpret
because there are no historic pumping test data for the wells. Without
historic pumping test data, the specific capacity for each relief well after
chemical treatment cannot be compared to the specific capacity of the well at
the time of the initial installation of the well. Nevertheless, the specific
capacity values, before and after chemical treatment, for 6 of the 12 relief
wells increased by at least 166 percent (Table 4).
55. With regard to relief well W-12, a comparison between Table 2 and
Table 5 shows that the chemical treatment program was successful in removing
the iron bacteria, at depth, in the well. However, the increase in the
specific capacity of relief well W-12 after chemical treatment was negligible
(Table 4). In this instance, it can be hypothesized that the hydraulic
performance of relief well W-12 is limited to a greater extent by the proxi-
mate location of the well to the hydrogeologic boundary of the valley (Fig-
ure 6), rather than by clogging with iron bacteria. The results from relief
well W-12 provide a good illustration that the comparison of specific capacity
alone, calculated before and after treatment, is a cursory indication of the
effectiveness of the chemical treatment program. Factors such as the well
depth and construction, hydrogeologic boundary conditions, and the varying
characteristics of the alluvial valley-fill deposits may have an overriding
influence on the hydraulic performance of the well.
56. The information in Table 5 indicates the chemical treatment program
was not successful in preventing the reoccurrence of iron bacteria in the
relief wells. Within 4 months after the completion of the treatment program,
iron bacteria were confirmed growing, at depth, in 7 of the 12 relief wells.
A comparison between Table 2 and Table 5 shows, however, that the predominant
types of iron bacteria identified in the relief wells, before and after the
chemical treatment program, were different. Before the chemical treatment
26

program, the species of iron bacteria identified most often on the in-well
collectors belonged to the genus Leptothrix. After the treatment program, the
species of iron bacteria identified most often on the in-well collectors
belonged to the genus Gallionella. This finding suggests that the chemical
treatment program was generally capable of removing the iron bacteria that
were in the relief wells at the time of cleaning, but that the wells may have
been recolonized by different organisms after the chemical treatment program.
If this assumption is correct, then the possibility must be considered of a
continuing source of iron bacteria within the alluvial deposits, as well as a
pathway through which these organisms gain access to the wells.
57. The more abundant growth of Gallionella, versus Leptothrix, in the
relief wells after the chemical treatment program may also be a result of
changes in the quality of the groundwater. Gallionella reportedly occur most
often in nonorganic, iron-bearing waters characterized by a low oxidation-
reduction potential (Hackett and Lehr 1985). Conversely, Leptothrix exhibit
more abundant growth in groundwater containing higher concentrations of
organic material. A comparison of values for COD and ferrous iron listed in
Tables 3 and 6 indicate that the organic content in the groundwater was
appreciably lower and that iron mineralization of the groundwater was signifi-
cantly higher after the chemical treatment program. Both of these changes in
groundwater quality appear to favor the growth of Gallionella, as opposed to
Leptothrix. As a result, the presence of Gallionella in the relief wells
after the chemical treatment program may not necessarily indicate that these
organisms are from a continuing source of iron bacteria. Gallionella may have
been present in the relief wells prior to the treatment program. However,
their growth may have been suppressed, at that time, by the quality of the
groundwater.
58. A final significant finding of this study is that relief wells W-4
and -6 did not contain iron bacteria growing, at depth, in the well either
before or after the treatment program. A review of the hydrogeologic informa-
tion and groundwater quality data obtained during this study does not provide
a reasonable explanation of why these two relief wells remained free of iron
bacteria, despite the fact that adjacent relief wells contained significant
growth of these organisms. Further study and comparison of relief wells W-4
and -6 to the other 10 relief wells at Leesville Dam may provide important
insights into the environmental conditions and processes which promote the
27

colonization of wells with iron bacteria.
Economics
59. The selection of a rehabilitation procedure is often based primari-
ly on the economics that exist at the time a decision must be made. Any
number of chemicals or mechanical procedures (air-lifting, surge block, or
jetting) could be used in combinations that would exhaust any budget. The
Leesville Dam rehabilitation plan was based on a combination of economics
which included extra tests to verify the results and well screen material
interaction with the treatment chemicals. For Leesville, the CE wanted a
record of performance for future reference, so extra pump tests and bacterial
determinations were added and thus conservatively increased the total costs
15 percent. If acid treatment had been used, another 30 percent would have
been added to the cost. The acid was not chosen because a literature and
industry search did not identify any data that would verify use of acid in any
dilution on fiberglass screens. The final cost, which includes strict
adherence to the adopted procedure and was considered state of the art for the
procedure chosen, was between $7K and $8K per well.
28
PART VIII: SUMMARY AND RECOMMENDATIONS
Summary
60. Based on the findings of this study and the well rehabilitation
project, the following summary can be made regarding the chemical treatment
program used to evaluate the control of iron bacteria in relief wells at
Leesville Dam, Ohio:
a. The chemical treatment program had an immediate beneficial
effect on the hydraulic performance of the relief wells. Based on pumping
tests performed on each well before and after the chemical treatment program,
the median value for the percent increase in the specific capacity for the
eight relief wells with specific capacities greater than 10 gpm/ft was
236 percent.
b. The amount of sand produced by the wells may indicate that the
wells were not effectively developed initially, and this fact in turn could be
part of the increase in specific capacities.
c. The chemical treatment program was not successful in preventing
regrowth of iron bacteria in the relief wells. The source of the iron
bacteria recolonizing the wells is unknown.
d Long-term control of the iron bacteria in the relief wells at
Leesville Dam, by the chemical treatment method used in this study, will
require repeated chemical treatments at regular intervals.
Recommendations
61. An effective treatment strategy for the control of iron bacteria in
the relief wells at Leesville Dam, Ohio, should include the following:
a. Perform supplemental pumping tests on the relief wells to
measure the hydraulic performance of the wells. Results from the pumping
tests should be kept on file and used to identify the decline of individual
well efficiencies.
b. Establish a critical percent reduction in relief well efficien-
cy that will serve as an administrative "action level." The action level will
define the need for implementing a well rehabilitation program.
29

C. Continue to study the iron bacteria populations in the 12
relief wells, as well as the groundwater quality in the alluvial deposits, to
define those factors unique to relief wells W-4 and W-6 which limit the growth
of iron bacteria in these wells. The additional study should include:
(1) Quanitifying the growth on in-well collectors.
(2) Downhole measuring of groundwater temperature, pH, dissolved
oxygen, and oxidation-reduction potential (Eh).
(3) Developing Eh/pH diagrams for iron, and correlating the
presence of iron bacteria with the stability of ionic species
of iron.
(4) Culturing groundwater samples from specific well depths to
determine "total plate counts" and to identify the presence of
other organisms which may contribute to encrusting problems.
d. Review of the effects, if any, of hydroxyacetic acid on the
structural integrity of the fiberglass well casing and screen.
e. Reevaluate a chemical treatment program, based on the informa-
tion collected in items c and d, to determine if a more effective chemical
treatment program can be developed.
f. Review the use of steam cleaning in conjunction with the use of
chemicals to determine if this method would be a more effective long-term
rehabilitation technique.
&. Implement a well rehabilitation procedure, based on information
collected in items c through f, when the action level, described in item b, is
reached.
30

REFERENCES
American Public Health Association. 1985. Standard Methods for the Examina-tion of Water and Wastewater, 16th ed., Washington, DC, 1193 pp.
Hackett, G., and Lehr, J. 1985. "Iron Bacteria Occurrence, Problems andControl Methods in Water Wells," National Water Well Association, Dublin,Ohio, 79 pp.
Ohio Department of Natural Resources (ODNR). 1962. "Underground WaterResources, Conotton Creek Basin," Division of Water, Ohio Department ofNatural Resources, file index P-8.
US Army Corps of Engineers. 1976. "Leesville Lake Relief Well Housings,Sections and Details," Drawing No. 0-271-UL-2-82/3 and 0-27i-UL-2-82/I, USArmy Engineer District, Huntington, Huntington, West Virginia.
US Army Corps of Engineers. 1978. "Leesville Lake Embankment ReanalysisReport," US Army Engineer District, Huntington, Huntington, West Virginia,30 pp.
31

10- 0 ° r- Noo.- a a
. .
w 1.
. . . . . . . . 4 . 4.
_ -; ; 'ý 0. 0 . : -0
a- 1-) 02 - X, " (
Q ..-:.. + J N
*4 44N~
1w 0
o a
6 C4
*, r ý aw C
NY - -

+ +-
CU
1-4 0
r-44-4 4-4
r4 _. 9:
W r~-4
410l -, +
*r4C- 4 4
..) 0
4) 14 4 4 0
41~~ -4 ) --40 0I 0-1ind 0 4
C-4 g 4 u 0 +4 V) lal . )
H-0~ ,- 42 4- w 0 4-4
00 44l n
v_4__ $ 0 w -49:~~~~ ~ -A% -4- ) 1 0
00? 34 >
4- 1_ 4 -4
044E~4~00 0 + 4~.
- - -4 p 0
0n 14- 0 4 0
0 iC4i ý4-
44 0. 4)0 0 19__ _ 41~ 41 0
w -4 142
(44 4.4 :3
l+ .+ +n 0 W00
Q "4 U"-40 "-f 4.)
bO4 + + i I-
CU LA Ln tA Ln LM LA LA04 4-) -4 04) C~- LA '.0 r-- -
, 4) LA I. . . . . .
4.J rL + -4 + C-4 (n 4. LA %.0 D

> bO 00ý4cn 4 ýo Ln Ln w w% 4 4 (N
0 0 w 0 0 %0 (N w 11- P- (i (V
"U) 0040 0 0
IN-
XbO ~0 v-
4 'C 0 % 0 LA w 0 m~(N~
6 0% 4 0 6.0'0 C~ ~0 en LA %.0 4-4 ~ 4.
0 en %D LA Nl- r- r- w w r- 6.0 a% CC. C%4 %D V 4 4 mf r- LA mA ,-4 0% 0"N-
-,4'
"- "-41 ý - 1 - 1
-444 00
54 00~
W .4
-A. *-b0 co %D 1-1 %0 w LA mA LA 0 LA LA mA ONJJ ~r. a 4 A .4 -4 .-4 ý- MA M (N (N .N
0 M A 00 0 0 0 0 0 0 0 0
0.
CA) ra CA cn LA 0 en LA LA 0 0 N- U') 0
0% f-4 0 '.0 0 (N (N %i (N LA (N CA (N
rfLA 0 (Nj M 4 (N4 4 LA 4 v-I M% M"4 1 r4 r-4 a-4 . . . .- ' + I V-
r ACAC - LA MA N- 0 0 0 enad 0 C? .! C ý . . . . . .
r-4
0 00 (N4 -4 a-f LA e) '.0 %.0 N- VI mMA C LA N- LA N- LA (N (N 4 % 1-
0 + +0.
44) r -( -4 LA %D0 N- w (N %A60 ID'
0 %D0 e..4 w.j ON M N- N-M~~0- C-% - N - N N . . . 60 60 N .
V-4
c2)6. 0% N- 00 cn (n LA) %D0 0 0 4 c CV)I 1 -4 M CV) 0 N- - 00 0% 0% ý4 ON
4.) C4 (N J (N 4 -4 -4 a-I a-I r-4 r4 v-4 -4 C(N
0, a N ( LA ON N1 - N- %D0 cn 0 cn a-4
cn V; (N 0* 0%, a; N- N-ý N- N-ý 00' L04(N( -4 -4 -4 r-4 r-4 -4 -4 (N4 C4
4) 0 - (N rA4 L . - ~ 0 -4 -400cz

Table 4Specific Capacity Values Before and After Treatment
Well Screen Specific Capacity cpm/ft* Percent Increase inNo. Length Specific Capacity
ft Before After After Chemical
Treatment Treatment reatment**
W-1 14.0 <10 <10 --
W-2 17.7 <10 <10 --
W-3 27.4 <10 <10 --
W-4 39.0 15 45 200
W-5 52.6 75 208 177
W-6 58.2 155 210 35
W-7 60.0 27 220 714
W-8 60.0 120 162 35
W-9 59.9 40 140 250
W-10 60.0 45 120 166
W-11 60.0 15 62 313
W-12 12.0 <10 <10 --
Mean (8 wells) 236
* Calculated at a drawdown of 5 ft, interpolated from data inAppendix A.
** Percentage is determined as the difference between thi specificcapacity, before and after treatment, divided by the value forthe specific capacity before treatment multiplied by 100.

14 U)
44
-4
-4 S-4)
U)
--. co -
'4 -+ + u+0o) u u 44 0d44r~__-4 ý ) "
1-4.- 0 +01 10 (
t9 4" -4
"O4 0+ -+ 0+ -0) 0d 0 0- 44Q4 to. 4.1 0 hO4
''- C__ "r4 4 -*L- 0 4)$ . 4)
0 4-) '-0 -4 FAc
W441 a). J1ow ~ 3 -.-. 41 0
s-I 4" 444"~ -E-4 ____ %D44)4 C0 od-4U. 4 0
4.1r- 4- S4C 4) U)LA0 414.) o4 41
___ 4.1 00dC d 40 a) w o -4 $I -4
L A4 0 4 -4 r-4 .
0 4 41L "4 '.0 14m44r**. r-4 -__0 0 4"
41+w +0 .0u u 44 '-41
0) r-4 0:
4~- ) 4"
W r-4-4
4-40 (A
-Cd
LA~~~c '.0 u. . . .,-4" (N c' -1A . "1- C

C, 'D '0 .4 '0 M~ 0' 0 '-4U ~ -4 -4 ifn fL ?1- N 10 W
44 .4 C., en C"
ý4vV v V V v V
,4 c 4 - 4 r4 4 14 ý~00 0 ; N ý C; N . 4 4 0
00
-4c
- r~- iA 0 0 'm Iý IA F- 0 e cI 'D Cq--
IA ~ ~ C in 11 '0 .- I 4 '0
f- In - 4 5n cc r. r, I 4
0
r-4 4NNN-4 -414 -4 -4 -4 -
In
4 N -4 C4 IA '0 r-. co 0' 1 4
004 -4 -4

11~ e:1~~
/ ~GUM
0 ~ ~~~~~~~~ ~ 20040 /i(l({'v< I ijI0M___________________VAN COTUYNEVA 0FE
SITE7 LOATO MAP
Figure 1. Sitelocatio ng m tapo Lesvll Gagi Carolgo..Oi

0
zjo0
046 _j C) )C)
096 U0
UU
-4
rz4

L_ "SEE NOTE NO. I FORi - . LAD DER EXTENSION
IL --JI HANDLE-• •HNE-HANDLES 11 HASP HINI
EL VARIES o1t I /-RAINE PIPE (GALV
ESEE NOTE E TO B T0 T
HIGHT POINTGH OF CORUGAO
TPIT RUN BLANKET NRIAL\\\1 0 ' )~~(CONSTRUICTION COMPZ• 1
24" F IE PACK
48" CCMP- 1275) 1 o. Yp. . BRE-GLASS.. SE APC APPROE TIIGOF. W-2 - S FWOR LA/
AN EXESO R)GONDLN OEQURMNS
2.SAET H RQIE TO P 2RE BCCMP COLLECTORLEL. VARIESWHN OE ,
3.COER T L�_CED�- WIT MACONCRETE TO BE TANGENT TOi~iil •" •, •HIGH POINT OF CORRUGATION
"4A. ELEVACT FO ABO30V PERM A N ENT C AS IN G
CASING W SCREENCENTRALIZER -- m
. 6 M A UT2CP FILTER PACKI---0 I.D. FIBERGLASS
•• • WELL SCREEN
FIBERGLASSS BOTTOM PLUG
LEGEND
1. SEE APPLICABLE SECTION OF SPECIFICATIONS FOR LADDERAND EXTENSION REQUIREMENTS.
2. SAFETY CHAIN REQUIRED TO PREVENT WIND FROM CLOSINGLID WHEN OPEN.
3. COVERS TO BE LOCKCe WITH MASTER LOCK NO. 6, A 406,KEYED ALIKE.
4. ELEVATIONS FOR ABOVE COMPONENTS ARE SHOWN INRELIEF WELL TABLE DRAWING NO. 82/1.
5. FOR MANHOLE DETAIL SEE DRAWING NO. 82/1.
6. FOR 60" DIAMETER MANHOLE USE 1/2- TREAD PLATE.
Figure 3. Cross-sectional view of relief well housing(US Army Corps of Engineers 1976)
AS TA ULA
Fru ToWIýLýLIAM
r:
W 0.0 n.. 4T U
N A H U It 0 N 0 TAM INA
NCO KrL- MANONIN
rWVAN T!CRAWFOROJ A3H T A R K Cot AL -L'.. E- N C
Ol
MERCER A U 6 1 ZE M A R 1 0 N M C RROLL
blo
OGAN X 0 X
'A
UNION. EL WAR NA
0 A R 9 E C"A rAt amj
'A I ICKA r , FR KLI
1/_ .16
.!C;A R K AOISON)
L -PHIPREGLE L
PICXA AV Ma
AT TTEJ
8 U T trE WARR N CLINTOMI
A
T Eý
c
H MILTON vo
HIGHLAN
LERMomq 1.0JAC N
BROWN
S 1 0 T 0 ALLIA Till Plains
Lake Plains
LAW Lexington Plain
STATE OF OHIO Glaciated PlateauDEPARTMENT OF NATURAL RESOURCES
DIVISION OF GEOLOGICAL SURVEY Unglaciated Plateau
ScOle in Miles0 20 40 60
Figure 4. PhysiograPhic sections of Ohio

133U M UOlIVA13J
r I-GOI
91--03
I-M4
LI-03
r-/A
V1-03 0 04.4
0cc-03 *
at 00
4777 0
TM c
b rO.
3- - oc-
L33 W l-0 V
1333 'N011VA3130 0 0 0 0 0 0 0 0 0 0 0 0
w ) in IT ) C' 9 0 m) 0 N~ LD i vC" C" 0) I 0) ) C" 0) co 00 0 o c
0
cr +
00 $4
a-I
z 00 0
020
(C2.0 I 0
x ~0 10O +L +
0 -
0 w
+
00 ,.- co 00
I - 00
IT 0_ vV
Uw 0 U
44)
0
:a +
0
+
I V) 0
(%4iI 3 '-
0 0 0 0 0(0 U,) 0~ 4 - 0 m) l w (0 Ita) m) m) M) (n 0) ) OD co (0 0 co 00
1333 'NOIIVA313

PUMPING RATE IN GPM0 100 200 300 400 500 600
0
2
SCREEN LENGTHS
W-1 14.0 FTW-2 17.7 FT
40 BEFORE TREATMENT
5 FT DRAWDOWN * AFTER TREATMENT
6
LA
"U /•APPROXIMATE TOP OF SCREENSz
W-2
o NOTE: SPECIFIC CAPACITIESAT 5 FT DD FOR BOTHWELLS LESS THAN
O• 10 GPM/FT
10
12
14WELLS W-1 AND W-2
o- LEESVILLE DAMW-1 RELIEF WELL
PUMPING TESTS1 - 1986 - 1987
16
Figure 7. Drawdown versus pumping rate for wells W-l and W-2

PUMPING RATE IN GPM0 100 200 300 400 500 600
0
2
SCREEN LENGTH = 27.4 FT
0 BEFORE TREATMENT* AFTER TREATMENT
4
5 FT DRAWDOWN
6
NOTE: SPECIFIC CAPACITIESU" AT 5 FT DD LESS THAN
z 10 GPM/FT
z 8
3:00
APPROXIMATE TOP OF SCREEN
10
12
14WELL W-3
LEESVILLE DAMRELIEF WELL
PUMPING TESTS16_ _1986 - 1987
16
Figure 8. Drawdown versus pumiping rate for well W-3

PUMPING RATE IN GPM0 100 200 300 400 500 600
0
2SCREEN LENGTH = 39.0 FT
o BEFORE TREATMENT4 AFTER TREATMENT
5 FT DRAWDOWN
6PERCENT INCREASE AT 5 FT DD
"Li 45-15"Li 15 200 PERCENT
_z
z 8
0
APPROXIMATE TOP OF SCREEN
10
12
14 WELL W-4
LEESVILLE DAMRELIEF WELL
PUMPING TESTS1986 - 1987
16
Figure 9. Drawdown versus pumping rate for well W-4

PUMPING RATE IN GPM0 100 200 300 400 500 600
0
2 SCREEN LENGTH = 52.6 FT0 BEFORE TREATMENT
* AFTER TREATMENT
4
5 FT DRAWDOWN
6PERCENT INCREASE AT 5 FT DDI-X
Lh" 208-75L.J 75 =177 PERCENT
z
za
0
10
APPROXIMATE TOP OF SCREEN
12
14WELL W-5
LEESVILLE DAMRELIEF WELL
PUMPING TESTS1986 - 1987
16
Figure 10. Drawdown versus pumping rate for well W-5

PUMPING RATE IN GPM0 100 203 300 400 500 600
0
2SCREEN LENGTH = 58.2 FT0 BEFORE TREATMENT* AFTER TREATMENT
5 FT DRAWDOWN
PERCENT INCREASE AT 5 FT DD. 210-155- 35 PERCENT
155_z
z 8
0
10
C.APPROXIMATE TOP OF SCREEN
12
14WELL W-6
LEESVILLE DAMRELIEF WELL
PUMPING TESTS1986 - 1987
16
Figure 11. Drawdown versus pumping rate for well W-6

PUMPING RATE IN GPM0 100 200 300 400 500 600
0
2SCREEN LENGTH = 60 FTo BEFORE TREATMENT* AFTER TREATMENT
4.
5 FT DRAWOOWN
6
PERCENT INCREASE AT 5 FT DDW,., 220-27
"227 =714 PERCENTz
80
APPROXIMATE TOP10 OF SCREEN10t
12
14WELL W-7
LEESVILLE DAMRELIEF WELL
PUMPING TESTS1986 - 1987
16
Figure 12. Drawdown versus pumping rate for well W-7

PUMPING RATE IN GPM0 100 200 300 400 500 600
0
2SCREEN LENGTH = 60 FT
o BEFORE TREATMENT
0 AFTER TREATMENT
5 FT DRAWDOWN
6
PERCENT INCREASE AT 5 FT OD
160-120 3 ECN
10
14
WELL W-8LEESVILLE DAM
RELIEF WELLPUMPING TESTS1986 - 1987
16 ""
Figure 13. Drawdown versus pumping rate for well W-8

PUMPING RATE IN GPM
0 100 200 300 400 500 6000
2
SCREEN LENGTH = 59.9 FT
0 BEFORE TREATMENT
* AFTER TREATMENT
5 FT DRAWDOWN
6
PERCENT INCREASE AT 5 FT DD'" 140- 40040 250 PERCENT" ~40
z
z 80
10 [--APPROXIMATE TOP OF GCREEN
12
14WELL W-9
LEESVILLE DAMRELIEF WELL
PUMPING TESTS1986 - 1987
16
Figure 14. Drawdown versus pumping rate for well W-9

PUMPING RATE IN GPM
0 100 200 300 400 500 6000
2SCREEN LENGTH = 60 FT
o BEFORE TREATMENT0 AFTER TREATMENT
4.
5 FT DRAWDOWN
6
PERCENT INCREASE AT 5 FT DD.- 120-45_ 166 PERCENT
45_z
z 800
APPROXIMATE TOP OF SCREEN
10
12
14WELL W-1O
LEESVILLE DAMRELIEF WELL
PUMPING TESTS1986 - 1987
16
Figure 15. Drawdown versus pumping rate for well W-10

PUMPING RATE IN GPM0 100 200 300 400 500 600
0
2
SCREEN LENGTH = 60 FT
o BEFORE TREATMENT
0 AFTER TREATMENT
5 FT DRAWDOWN
6
PERCENT INCREASE AT 5 FT DD,. 62-15"15 - 313 PERCENTz
z 80
"APPROXIMATE TOP OF SCREEN0\C,:
10
12
14WELL W-1 1
LEESVILLE DAMRELIEF WELL
PUMPING TESTS
16 _1986 - 1987
Figure 16. Drawdown versus pumping rate for well W-11

PUMPING RATE IN GPM0 100 200 300 400 500 600
0
2
SCREEN LENGTH = 12 FTo BEFORE TREATMENT* AFTER TREATMENT
4
5 FT DRAWDOWN
6
I-L•J
z APPROXIMATE TOP OF SCREENz 8
0: NOTE: SPECIFIC CAPACITY <10 GPM
BEFORE AND AFTER
10
12
14WELL W-12
LEESVILLE DAMRELIEF WELL
PUMPING TESTS1986 - 1987
16
Figure 17. Drawdown versus pumping rate for well W-12

Photo 1. Leesville Dam, Ohio - lakeside
Photo 2. Leesville Dam, Ohio downstream toe

4••
Photo 3. Corrugated casing for individuallyhoused relief wells
Vi,
Photo 4. Relief wells designed as uncapped,flowing wells

a.
b.Photo 5. Reddish-brown, mucilaginous depositsin well characteristic of iron-precipitating
bacteria (Continued)

C.
Photo 5. (Concluded)
Photo 6. Nasco Whirl-Pak containing waterfrom well

Photo 7. Plexiglas slides attached to weighted,monofilament line
Photo 8. Plexiglas slides labeled and placedin sealed bag

Photo 9. Lowered weighted, monofilament linewith attached slides into each relief well
Photo 10. Monofilament line anchored to a rungon the stationary ladder

Photo 11. Retrieval of Plexiglas slides
Photo 12. Slides immersed in distilled waterin a Nasco Whirl-Pak
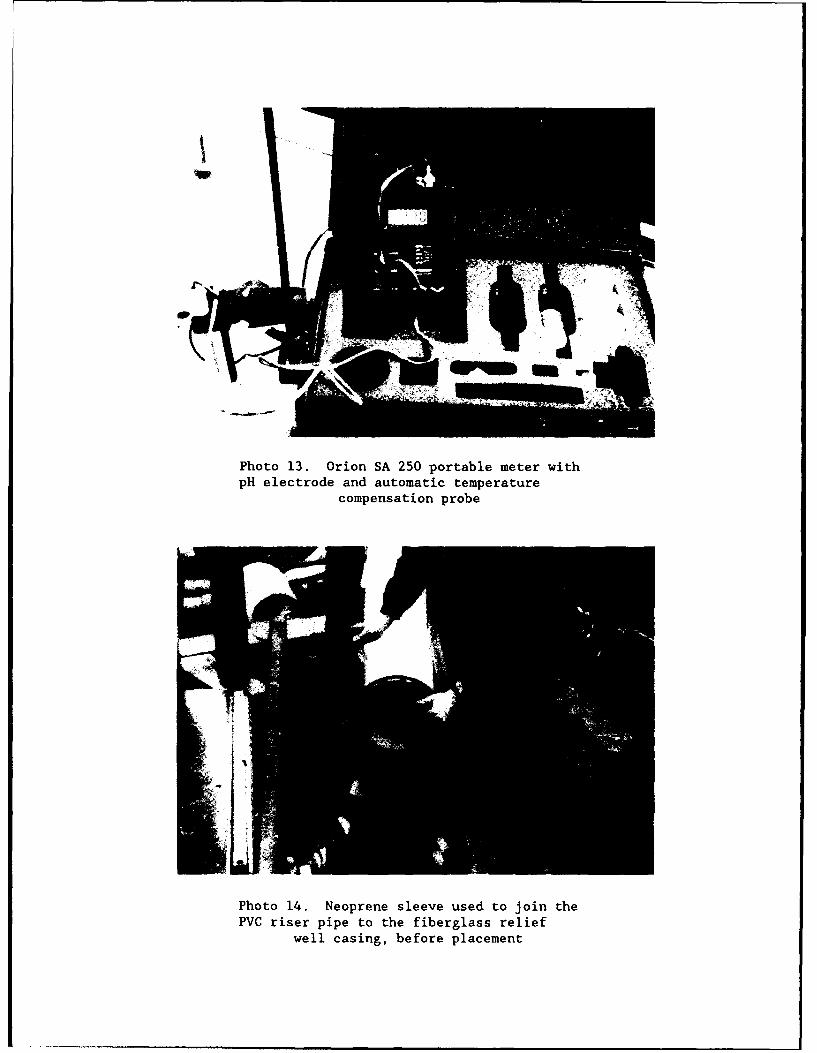
Photo 13. Orion SA 250 portable meter withpH electrode and automatic temperature
compensation probe
Photo 14. Neoprene sleeve used to join thePVC riser pipe to the fiberglass relief
well casing, before placement

Photo 15. Neoprene sleeve used to join thePVC riser pipe to the fiberglass relief
well casing, installed
Photo 16. Vertical support for PVC riserpipe; plywood platform placed over the
relief well housing

a.
b.Photo 17. Pump test conducted using a sub-mersible turbine pump and pumping at three
different rates (Continued)

C.
Photo 17. (Concluded)
a.Photo 18. Photomicrographs of bacterial
sheaths, Lepothrix (Continued)

b.
C.
Photo 18. (Concluded)

Photo 19. A commercially available long-linearphosphate solution obtained in 55-gal drums
Photo 20. Chemical mixing operation - smallelectrical, metering pump

Photo 21. Chemical mixing operation - smallelectrical, metering pump transfer-ringsolution from the chemical supply drum to
55-gal barrel
Photo 22. Chemical mixing operation - smallelectrical, metering pump measuring long-
linear phosphate solution

Photo 23. Premeasured volume of phosphatesolution pumped into relief well
Photo 24. Phosphates surged in the well usinga mechanical surge block

Photo 25. Surge block
Photo 26. Unsuccessful attempt to surge thewells by hand, using a cathead

Photo 27. Bailing well to remove accumulated sediment
Photo 28. Sodium hypochloride added to the well

APPENDIX A: CONTRACTOR FURNISHED PUMPTEST DRAWDOWN CURVES
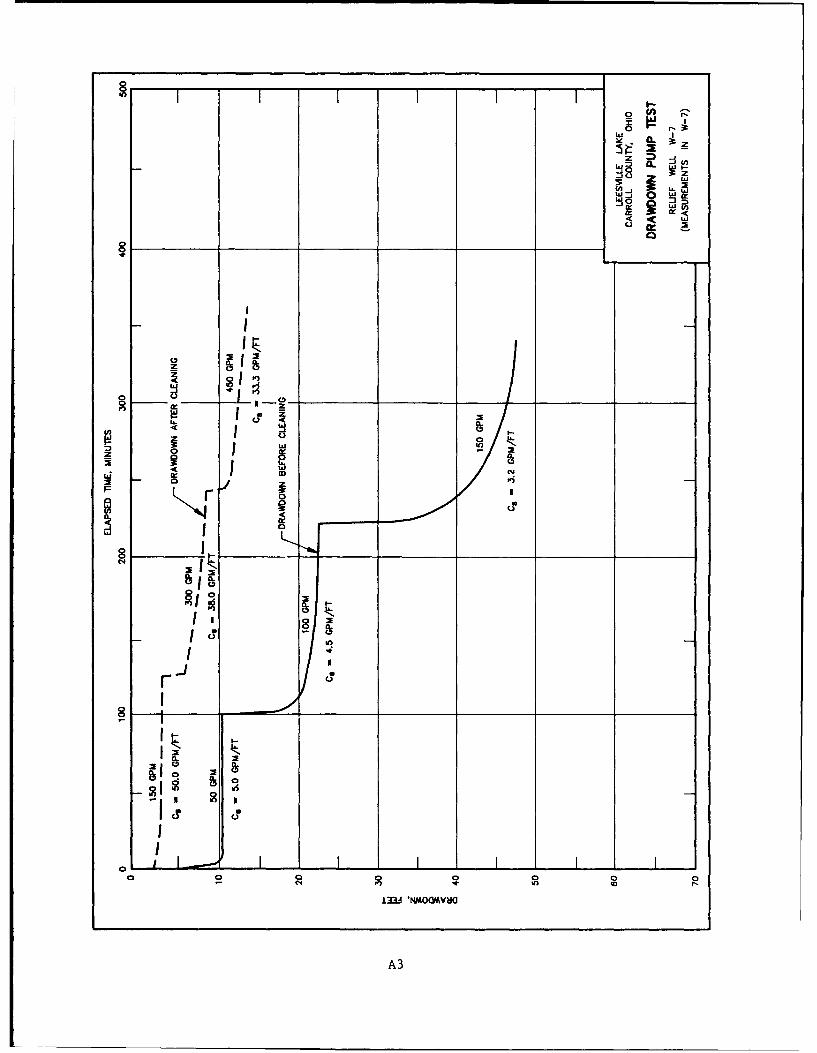
ww
00
C4 inIA3 a-CKH
I L~jA3
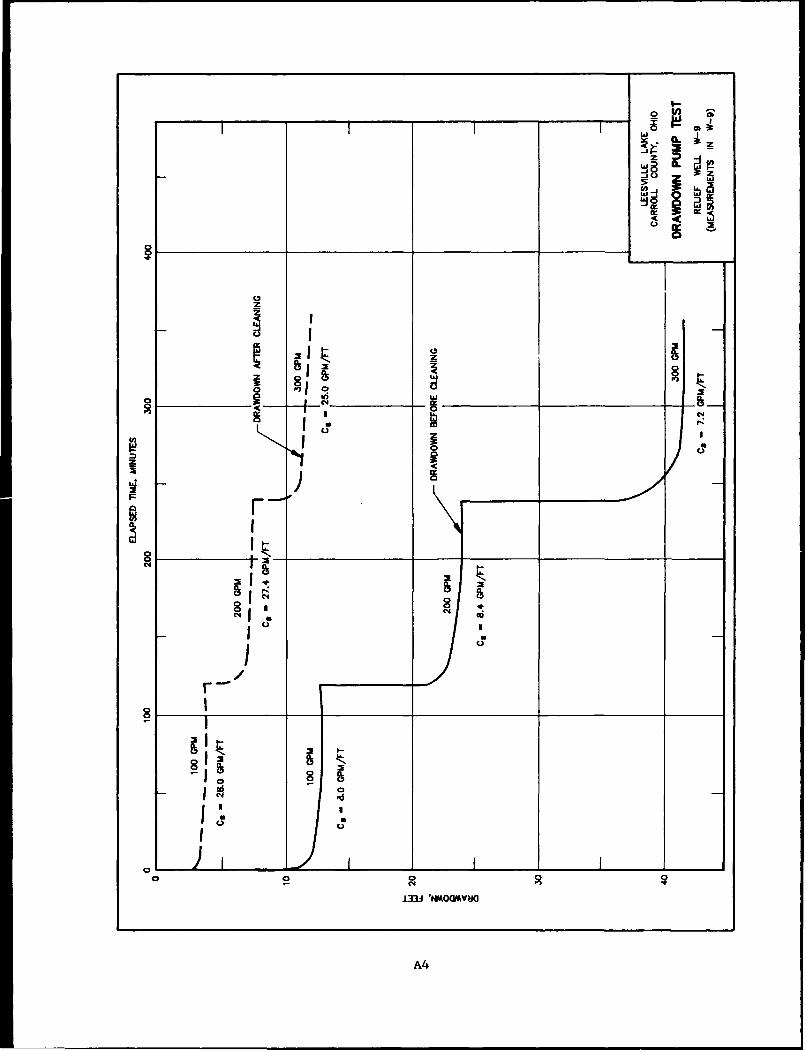
z z
CL
-I0
~~Il 9 _C) _ _2L
F r
8.C;
I C4
00
UO
A4

L.J
0
•IgIK
z
0
zz
IIx
a ~ CT
/ I _ r I II]
1I33.3 wNo(mysa
A5

ww7-
o
ILJ
lza
0I2
C',,
010
In 0 /
A3zWGVJ
2 A6

I-
z p
0~
0
ILz Iz
C,<
z 0
0 e
Ir
wN ci, m
C-,
J,, C-A
0 4~ 0OD40
A7

z
IL
8~ w
z~ l
II< w
Izz
IIn
0
00 8 .
F lo
,u.,
NN
04 c0
8 A8

00
I ~0.Ir z
I w ~ ~ w
0 -a-
zz
0. 0
C.< CD
LTJ
A9

z
I~0.
coo
C).za
22
Fw
00
NIz
-h--F-4C4U
04 40 O
NA

zz-0
4( c . u( '
CD
zi
'0 /F I!
0 U1
1100
C4 an eO
133-4 WOOMYN
All

0 -
La~ ~IL
LL;
inz
cc;irnvim*~ 2mc~a
A12

-�
l�
a
�ca�
_____________________ _______________C,z
ww
m
I 2
0
0
-� -�a 0(U C
z I II U
U0
-
F FI
��I I
IaC,'IC"U I
U
U UI/
-___
ii
00 0 0
C,'
133i MMO�VV�IO
Al 3

W.'
oGo
0 a
C -I---I-
to do0 0/
133.4 WOGMY/
A14'

APPENDIX B: BORING LOGS FOR RELIEF WELLS,LEESVILLE DAM, OHIO
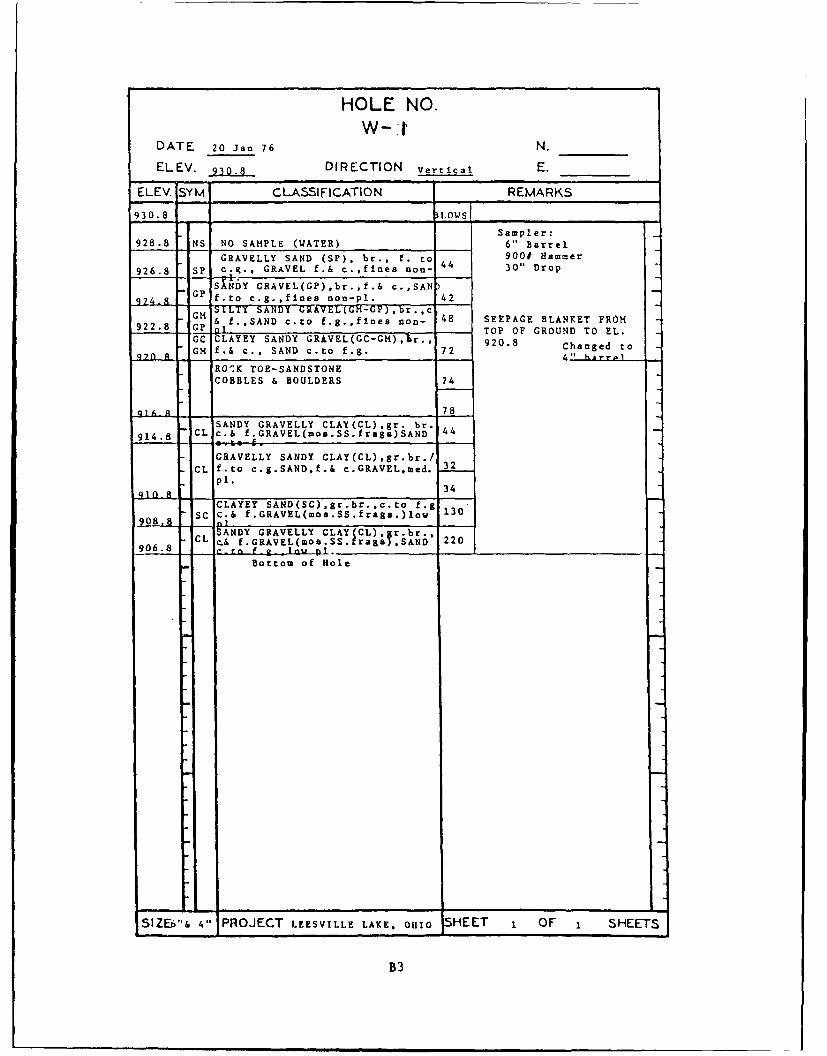
HOLE NO.W-:t
DATE 20 Jan 76 N.
ELEV. 930.8 DIRECTION Vertical E.
ELEV. SYM. CLASSIFICATION REMARKS
930.8 1LOWS
Sampler:928.8 NS NO SAMPLE (WATER) 6" Barrel
GRAVELLY SAND (SP), br., f. to 900# Hammer
926.8 SP C.g., GRAVEL f.& c.,fines non- 30" Drop
SxiNDY GRAVEL(GP),br."•.& c.,SAN)""GP f.to c.g.,fInes non-pl. 42
GMSILTY SANDY GRVEL(GM-GP),br.,c9 OP f.,SAND c.to f.g.,finea non- 48 SEEPAGE BLANKET FROM
9228 P TOP OF GROUND TO EL.GC CLAYEY SANDY GRAVEL(GC-GH),Ir., 920.8 Changed to
GM f.& C., SAND c.to f.g. 72RO':K TOE-SANDSTONECOBBLES & BOULDERS 74
78SANDY GRAVELLY CLAY(CL),gr. br.
914.8 CL c.& f.GRAVEL(moa.SS.frago)SAND 44-a. - 10 -
GRAVELLY SANDY CLAY(CL).gr.br./CL f.to c.g.SAND,f.& c.GRAVEL,Med. 32
qls p1. 34
CLAYEY SAND(SC),gr.br.,c.to f.g 3908.8 - SC C.& f.GRAVEL(mos.SS.frags.)low 130
• S .1ANDY GRAVELLY CLAY(CL),Ir9 CL c& f.GRAVEL(moG.SS. rag AN 220
906.8 •n f • In, P1 .Bottom of Hole
SIZEb"& 4" PROJECT LEESVILLE LAKE. OHIO HEET 1 OF 1 SHEETS
B3

HOLE NO.
DATE 1 8 Mar. 76 W 2N. ____
ELEV. 93. DIRECTION Vertical E. ____
ELEV SYM, CLASSIFICATION REMARKS
GRAVELLY SAND(SP).dk.br.,f. toIc.g.,GRAVEL f.&~ c./tr.of SS. 14 Sampler:
SP frags. 6" Barrel
_____)____ ___________ 52 900# Raamner
c"I SILTY GRAVELLY SAND(SaI-SP) ,dk.br. 30" DropSP f. to c.g. 61
ROCK TOE-SANDSTC*'E SE.EPAGE BLANKET FRal923.2 COBBLES & BOULDERS 72 TOP OF GRUJND TO EL.925.2
SILTY SANDY GRAVE-L(af),dlc.br.-,-. ~t& c./nuii.SS.frags,,SAND f. to c.g., 68 Cagdt
al GRAVEL f.& c.,non pl.4"Bre
72
917.2 6
+ 1GRAVELLY SILTY SAND (af),dk.br., f915.2 - e ~L'P.,/rc.GAY f.& c.(mos. 52
q1K7 a /niun.SS.frags..SAND ftoc.gsli~.pl. 7CLAYEY SAND (SC) ,br.gr.& ý,r.,E.to
SC c.g.,GRAVEL f.& c.(nos.SS frags.), 48low pl.
90. SC LAYET SAND(SC--96f),g-r.br.,'f.to m.g./S
907.2 I tr.c.,f.GRAVEL/tr.SS.frags. 29CL ANDY CIAY(CL),gr.br.,f. to c.g. 3
905.2 CL SANlD, f.GRAVE-L/tr.SS frags.,Iow p1. 3
SANDY CIAY(CL),br.gr.,f. to c.g. 32CL SAND/f.& c. GRAVEL, m.pl. 3
899.2 38
CL SANDY CLAY (CL) ,br.gr. ,SAND f.to c.g.897. GRAVEL f.& c.(ors.SS.frags)low p1 . 42
SCCLAYEY SAND(SC),gr.gr.,SAND f.to c.g.-GRAVEL f.& c.(mts.SS.frags)low pl. 72
C.LA[IM SAMUs) o5r.gr. ,ZWMLj i. ru -
893 2 SCc. 1lowp1. 102892.5 NS, jSMl 325S ___________
Bottoma of Hole
SIZE 6"&14" PROJECT LEESVILLE LAXcE. 0111o -HEET 1 OF 1 SHEETS
B4

HOLE NO.W-3
DATE 18 Feb. 1976 N.
ELEV. g DIRECTION VErti._! E.
ELEV YM' CLASSIFICATION REMARKS
SANDY GRAVEL (GP), br., f.6 c., Sampler:"GP SAO f. to c.g. 6" Barrelto2 cg900N Hammer
24 30" Drop
9? 7 1 _______________1______ 26SGP iANDY (iRAVEL(GP-D'1),br.,i. 6 c.
922.7 aj SAND f. to c.g, 4 SEEPAGE BLANKET FRP1
ROCK TOE-SANDSTONE TOP OF GRUN To EL. 922.7C O B B L E S & B O U L D E R S 1 10 C h a n g e d T E
Changed to
918.7 3j SILTY GRAVMLY fr. - 26 4" Barrel
916.7 Sp to c.g. GRAVEL f.& c./few SS.frags. 26GKAVULLY SILET SAND(U1),br.,t.to c.g.
914.7 S GRAVEL f.& ct+4 SS.frags.SILTY GRAVELLY SAND(S),br., f.to
912.7 m m.g. GRAVEL f. & c. 30'2- ýF- ILVI GRAVELLY SAWI(bM-SP),br., t.SP to m.g.. GRAVEL f.& c.(approx.SO0
- '-n •. )2i SILTY GRAVELLY SAND(SM),br.,f.to c.g.
908.7 GRAVEL f. 6 c. 7S"GRAVELLLY SILTAY SAND(fJ ,br. ft.g./'tr.
S6.4 m.& c.,GRAVEL f.& c.(30%SS.frags.) 709 - CL GRAVELLY SANDY CLAY(CL),br.f. to m.g.
904.7 -SAND,GRAVEL f.& c.(15% SS.frags.) 72GRAVELLY CLAY(CLj,br.,f to m.g.SAMJ
. CL GRAVEL f. c. 72902.7 - LAVLLt" hAN LLAY(LLJ,Dr., t. to
900.7 CL m.g.SAND,GRAVEL-num.SS.frags. 38
SANDY CLAY (CL), br.,f. to m.g.SANDGRAVEL.num.SS.frags. & tr. of 72"CL s. SH. frags.
896.7 668GRAvI±Lr CLAYEY SANM(SCJ,Dr.T. -to
Aq4 7 m.g.,GRAVEL-wd.SSH. 6 SS. 68
.S61SILTY GRAVELLY S'&W (SI) ,r., f . to892.7 m. g./wd. SH. & SS. 72
(4 SILTY GRAVELLY SAND(af),hr. ,.to m.sqfl_7 g., GRAVEL f.6 c.Omos.SS.6 Sil.frags.) 130
SANDY CLAY(CL),br.,f.to m.g.SAND,888.7 CL GRAVEL f. & c. 62
- SC CLAYEY SAND(SC),br., f. to m.g.,886.7 GRAVEL f.& c.,num.SS. 6 SiI. frags. 708 7 GRAVELLY CIAYhY SAID(LJ,br..t. to (. -
884.7 SC g.,GRAVEL f.& c.(mos.SS.6 SlI.frags.) 68CLAYEY SAND (SC), br.,f. to m.g.,
Sc GRAVEL, f. & c.(mos. SS.) 108
,-o 7 ' 1 10 ,,,___ _ _ __ _ _ __ _ _
SIZE,6" 6 4" PROJECT L-LSVII..E lAKE, olio SHEET 1 OF 2 SHEETS
B5

CONTD.W-3
ELEV SYM CLASSIFICATION REMARKS
880.7 BLOWSI CLAYEY SAND(SC) ,br. ,f. to c.g.,
s7s 7 SC GRAVEL f. & c., SS. &, SH. frags. 130
CLAYEY SAND (SC), br., f. to m.g.,SC GRAVEL mos. SS. frags.
874.7 180CLAYEY SAD(SC), br., f. to c.g.,
SC GRAVEL mos. wd. SS. frags.______________________300 _____________
Bottom of Hole
SIZE 4" PROJECT LEESVILLE LAXE, 01110 SHEET z OF z SHEETS
B6

HOLE NO.W-4
DATE 2 Mar, 76 N.
ELEV. 930.8 DIRECTION Vertical E.
ELEV SYM CLASSIFICATION REMARKS
GRAVELLY SAND(SP), br., f. to c.g.,
S GRAVEL f. 6 c. Smpler:
6" Barrel92 -A 67 9001 Hanwr
ROCK TOE - SANDSTONE 30" DropCOBBLES & BOJLDERS SEPAGE BUN)= FRCN
-168 TOP OF GPD TO EL. 926.8GP SANDY GRAVEL[GP-ul), br. ,t. 4 C., 10 Changed to
920.8 ( SAND f- to c.g. 102 4" BarrelGRAVELLY SAND (SP), it.br., f.to c.g.
918.8 SP /nAm. SS. frags.(soft) 168SP GRAVELLY SAND(SP-994),lt.br., f. to c
916.8 a1 g., GRAVEL f.& c.(mos.SS. frags.) 225Gp SAD Y GRAVLL(P-Q) , lt.br., t.to c.
914.8 -(2I g. SAND, GRAVEL c. to f.,sli, Pl. 104al1 SILTY GRAVELLY SAM (3%i-SP), br.,f.to
912.8 Sp m.g., GRAVEL c. to f. 62SP SAWDSP-al), gr.br., f.to c.g./tr.
910.8 _9.1 f. GRAVEL & SS. frags. 14
a1 SILTY GRAVELLY SAND(a1-SP),lt.br.SP f. to c.g., GRAVEL f. to c./num. 12
SS. frags.906.8 28________________
SILTY SAND(af), dk.br., f. to c.g.,904-9 a1 GRAVEL f. to c./tr.SS.frags. 57
SILT[Y SAND (at), gr.br. & br.,f. toScg. GRAVEL f. to c./num. SS. 3frags.
900.8 53SILTY SAND(9.O, br.,f. to c.g.,GRAVEL f. to c./SS. frags. 168
896.8 151. 1 SILTY SAND(3I-SC), gr.br., f.to c.g.
894.8 SC GRAVEL f.to c. (mos.SS.frags)sli.pl. 101at GRAVELLY SILTY SAND(aI-SC),gr.br.,f.
892.8 SC to c.g.,GRAVEL f.to c./num.SS.frags. 48al SILTY SAND(aS-SC),gr.br.,f.to c.g.,
890.8 SC GRAVEL f.to c.(Cms.SS.frags.)sli.pl. S5CLAYEY SAND(SC),gr.br.,f.to C.g.j,.
888.8 SC GRAVEL/tr.SS.frags., low pl. 495ALNLT tLAHtLLJ,Dr.gr.,=u f.N O c.g.
886.8 CL tr.f.to c.GRAVEL & SS.frags,low pl. ssCLAYEY SAND(SC),br.gr.,f.to c.g.,
884.8 SC GRAVEL f.to c.(mos.SS.frags),low pl. 5- l SILTY SAM(al-SC), lt.br. ,f.g./tr.
882.8 SC m.g., sli.pl. 52SILTY SAND(al),lt.br., f. to c.g.,t.
880.8 at GRAVEL/num.SS. frags., v.sli.pl. 38
SIZE6" 4" PROJECT LEESVILL LAKE, 01I0 SHEET 1 OF 2 SHEETS
B7

CONTD.W-4
ELEV. SYM CLASSIFICATION REMARKS
880.8 _ .. BLOVS
SANDY CLAY(CL), br.g-r.,SAND f. to 39
'L c.g., GRAVEL f. & c./SS. frags.,
ama - low pl.CLAYEY SAND(SC), gr.br.,f. to c.g.,
874.8 GRAEL f.to c.(mos.SS.frags.),low pl. 52
GRAVELLY CLAYEY SAND(SC) br.gr.,f.toSC c.g.,GRAVEL f.to c.(mos.SS.),low pl. 72
9... •t SILTY SAND(af),dk.br.,j. to m./tr.c.,
870.8 GRAVEL f.(mos.SS.frags),v.sli.pl. 82
CLAYEY SAND(SC),br.,f. to c.g., tr.f.
S c.GRCAVEL Y SS.frags.,low pl. 72
868.4 -JS L N SAMPLE
Bottom of Hole
SIZE 4" PROJECT I-ESVILLE I-AKE, 0.1110 SHEET 2 OF 2 SHEETS
B8

HOLE NO.W-5
DATE IS Mar. 76 N.
ELEV. _ DIRECTION EerticaE.
ELEV SYM CLASSIFICATION REMARKS
GRAVELLY SAND(SP), br., f. to c.g., Sampler:GRAVEL f. to c.
SP 900# Hammer71 30" Drop
925.3 72 SEEPAGE B1A4= FRCOMTOP OF GROUND TO EL. 925.3
ROCK TOE - SANDSTONE 9COBBLES 6 BCULDERS Changed to
78 4" Barrel
19.i3 ___________________ 1102UP SANDY GCAVEL(GP) ,br. ,SAND f. to
917.3 GP c.g., GRAVEL c. to f. 87SILTY -ATNDY-CRAVLL(UNT1 , br., c. E
915.3 , f., SAND f. to c.g. 82GP- SANDY GRAVEL(GP-Gf), br., f. & c.,
213.3 ati SAND f. to c.g. 57
GRAVELLY SAND(SP), br., f. to m.g./911.3 SP tr. c., GRAVEL f., so. org. mat. 52
at GRAVELLY SILTY SAND(at), br., f.g.,909.3 GRAVEL f. 42
SILTY GRAVELLY SAND(SaI), br., f, to c
907.3 a' g., GRAVEL f. & c., non. pl. 27SP- SILTY GRAVELLY SAND(SM-SP), br., f.
905.3 ISM to c.g., GRAVEL f. & c. S2
SILTY SAND(a'I), br., f.g./tr, m.9. a c., tr. f. GRAVEL 56
SILTY SAND (Sat, br., f. to c. g.,a! f. GRAVEL size frags.
897.3 72
at- SILTY SAND (aI-SP), br., f. to m.g.,895.3 SP GRAVEL f. . c./ntun.SS. frags. 68
t1- SILTY SAND (a1-SC), br., f. to c.g.,893.3 SC f. GRAVEL 72
GRAVELLY CLAYEY SAND (SC), br., f. tc- SC c.g., GRAVEL f.& c., low pl. CLAY 68aSql _%
SC CLAYEY SAND (SC), br., f. to c.g.,GRAVEL f. & c., low pl. 167
887.3 117CIAYEY SAND (SC), br., t.g./so.m.
885.3 SC & c., tr. GRAVEL size SS. & SLS.fragtl. 175
CLAYEY SAN (SC), br., f. to c.g.,883.3 SC nun.f. GRAVEL size SS. frags. 172
SC CLAYEY SAND (SC), br., GRAVEL f.881.3 &S C c. 94
SIZE 6" & 4" PROJECT LEESVILLE LAKE, 01110 SHEET 1 OF 2 SHEETS
B9

CONTD.W-5
"ELEV. SYM CLASSIFICATION REMARKS881.3 B _______'________
I- SILTY SAND(%I-SP),br., f. to c.g.,879.3 p f. GRAVEL-num. SS. frags. 62
- CLAYEY SAND (SC-Sf), br., f. tom. g., f. GRAVEL (mos. SS. frags.) 69
875.3 58-C CLAYEY SAND (SC), br., f. to m.g.,
873.3 f. GRAVEL (mos. SS. frags.) 62N SILTY SAND (al), br., f. to m.g.,/tr
871.3 c..GRAVEL f./SIS. & SS. frags, S8
CLAYEY SAND (SC), lt. br., f. to m.g* /tr.c., GRAVEL f. & c./so.wd. q_
frags., low pl.58
865.3 71CLAYEY SAND (SC), mot.1t.br. & gr.,f.SC to m.g., f.GRAVEL size SS. frags. 86
862.8 al- SILTY SAND (aI-SC),gr. 6 tan, f.g.,SC /tr. c. & m.g., GRAVEL size S11.__ frags., wd., las./tr mica
Bottom of Hole
SIZE 4" PROJECT LEESVILLE LAKE, OCiaO SHEET 2 OF 2 SHEETS
B1O

HOLE NO.
DATE 9 Feb. 76 N.
ELEV. 9 DIRECTION Vej~tica E.
ELEV SYM CLASSIFICATION REMARKS
93 1.2 BIT Ms
GRAVELLY SAND(SP), br., f. to c. Sampler:Sg., GRAVEL f. & c. 6" Barrel
SP 9000 Hammer22 30" Drop
925.2 48 SEEPAGE BLAN1•r FRC.TOP OF GRCUND TO EL. 925.2
85ROCK TOE - SA.)STOXNE Changed toCOBBLES & BOULDERS 128 4" Barrel
11a
917.2 128"P SAND (SP), br., f. to c.g., GRAVEL
915.2 f. & c./few SS. frags. 12CLAYEY GRAVELLY SAND (SC), f. to
913.2 SC c.g./few SS. frags. 4291 GRAVELLY SAND (SP), br., f. to c.g.,
911.2 GRAVEL f. & c. 24,- SILTY GRAVELLY SAND (SM-SP), br., f.
909.2 SP to c.g., GRAVEL f. & c., wd. 22
GRAVELLY SAND (SP-,94, br., f. to c.SP g., GRAVEL f. & c. 294
905.2 22
SILTY GRAVELLY SAND (a0), br.,f. to c.g., GRAVEL f. & c. 60
901.2 70_________________.2 SILTY GRAVELLY SAND (ai-SP), br.,
St- f. to c.g., GRAVEL f. & c. 48SP
897.2 SP 48
SM- SILTY GRAVELLY SAND (SM-SP), br.,SP f. to c.g., GRAVEL f. & c. 42
55
891.2 _- 65SC CLAYEY GRAVELLY SAND (SC), br., f.
889.2 to c.g., GRAVEL f. & c. 55at- SILTY GRAVELLY SAND (S4-SP), br.,
887.2 SP f. to c.g., GRAVEL f. & c. 56
SILTY GRAVELLY SAND (S9), br., f.,94 to c. g., GRAVEL f. & c. 68
77
881.2 _ 78
SIZE 6" 4' PROJECT LEESVlLIE LAKE, 01110 SHEET 1 OF 2 SHEETS
1311

CONTD.
W-6
ELEV. SYM. CLASSIFICATION REMARKS
881.2 BLDS
•,t- 72Sp SILTY GRAVELLY SAND(aS-SP), br., f.
0 c.g., GRAVEL f. & c., tr.LAY 6
875.2 67__ SILTY GRAVELLY SAND (,1), br., f. to
873.2 c.g., GRAVEL f. & c. 54a1- SILTY GRAVELLY SAND (aI-SP), br.,f.
871.2 SP to m.g./tr.c., GRAVEL f. & c. SRSILTY GRAVElLY SAND (%',•, br , f. to
869.2 'N C.g., GRAVEL f. & c. 72SILTY SAND (94-SC), br., f. to c.g.,
31- GRAVEL f. & c. 49sc
865.2 __ 66SILTY SAND (a1), br., f. to c.g.,so.
863.2 a1 sm. GRAVEL & frags. 68at SILTY SA&D (a1), br., f. to c.g./tr._ _ of c. & f. GRAVEL
a1 GRAVELLY SILTY SAND (a3), br., f. to859.2 m.g., GRAVEL f. & c. 54
SC CLAYEY SAND (SC), br., f. to m.g.,857.2 so. GRAVEL(mos.frags)/tr. of SILT 44
' l- GRAVELLY SILTY SAND(31-SC), br., f.855.2 SC to c.g., GRAVEL f. & c./SS.& S3.frag! 315
Bottomi of lole
SIZE 4" PROJECT LEESVILLE LAKE, 01110 SHEET 2 OF 2 SH`ETS
B12

HOLE NO.W-7
DATE 12 Mar 76 N.
ELEV. 91- -DIRECTION v E. _____E.
ELEV SYM CLASSIFICATION REM~ARKS
SANDY GRAVEL,(GP-C?,f, lt.br. * Sanpler: 6" BarrelC. to f.g./tr. of SS. frags. Hanuier: 900N
Gp_ f. to c.g. SAND Drop: 30"62
SILTY SANDY GRAVEL (G14) ,lt.br.,c. to OF SEPGE BCAJNDRC TOPE.92.
923.2 f.g.,f.to c.g.SAN4D (uxos.SS.frags.) 64 OFGLIDTE.922
0-ianged to
RDCK TOE - SAND)STONE144"BreCOBBLES AND BCULDERS
917.21_________________ 42
- GRAVELLY SILTY SAND(af),gr.br.,f. to c.g.jf.g. GRAVEL/tr. SS. 32
at frags.
ISILTY GRAVELLY SAt4D(SNI),lt.br.,f~to 3
9-1L. c.g.SANDM,f.to c.g.G;RAVFL/tr.SS frags 34
SCGRAVELLY CLAYEY SAND(SC),dk.gr.f. to
909.2 __ .g.,f.to c.g.GRAVEL/tr.SS.frags. 19
- SILTY GRAVELLY SAND(a4).gr.br.
alf.to c -g., f.to c. g. GRAVEL/nuin. 2
9OS-2 SS. frags. 3
SILTY SAND(SM),lt.br..f.to c.g./num.SS. frags./f.GRAVEL 48
SILTY GRAVELLY SAND(ai),lt.br. f. 28to c g., f- to c.g.GRAVEL/rmm.SS. trags. 4
44
897. - -SILTY SAND(34I),lt.br., f.to c.g.,
895.2 at f.to c.g. GRAVEL/num.SS. frags. 46
atGRAVELLY SILTY SAM (at),lt.br., f.R01_ to c.g.. f.to c.g.GRAVEL/mun.SS.frag 48
SILTY GRAVELLY SAND(R-1) gr.br f. to
891. SN .g.. f.to c.g.GRAVEL/nran.SS.frags. 53SILTY SAND(aI4Lgr.br.,f.to c.g.,E.
889.2 l o c.g.G;RAVEL/ruua,.SS. frags. 104
SSILF1 SND(aI) ,dk.br., f. to c.g./tr
987 f. GRAVEL. 120
GRAVELLY SILTY SAND(SH), gr.br.
88S.2 at f:t c~. f. to c.g.GRAVE-Lmois.SS. 60
atSILTY GRAVELLY SAND(SM),gr.br.,f.to883.2 _ c.jZ.GRAVEIL(rmos.SS.frags.) 87
SILTY GRAVELLY SAND(3c4),dk.br.
9881.2 all 46
ISIZE6'& 4" 1PROJECT LEESVILLE LAKE, 01110 PHEET 1 OF 2 SHEETS
B13

CON TD.W-7
E LEV. SYM. CLASSIFICATION REMARKS
881.2 f -to c .g. , f -to c. g. GRAVEL/ tr. BLWSS. frags. 52_
SILTY GRAVELL SAJD(a4-SP),Sdk.br., f. to C-g., f. to c.g.GRAVEL
FS /s. SS frags.87S.2 I _____I________________
S ILTY SAIZ (al) ,dk.br.,i. to'g.87. -aIf. to c.g.GRAVEL/num.SS. frags.
GRAVELLY SILTY SAND (ao), dk. br.Sf. to c.g.,.f. to c.g. GRAVEL/znu. 788
SS. frags.869.2
atSILTY GRAVELLY SAND(91), br. )S'If. to c.g., f. to c.g. GRAVEL
965.2 (mos. SS. frags.) n
ISILTY SA.ND(a1),1t.br.,f.to c.g.,f.to863.2 I"c.g. GRAVEL(rnos.SS.frags.) 68_
SILTY_ GRVEL - D~I)I 68-,T861.2 at c.g.,f.to c.g.GRAVEL/num.SS.frags. 41
____ %I- SILTY GRAVELLY SAND(9SI-SP), lt.br.,
859.2 SP f.to c.g.,f.to c.g.GRAVEL/num.SS.frag5 38
atGRAVELLY SILTY SAND(a1),g-r.br.,f.to857.2 -c.g.,f.to c.g.GRAVEL/num.SS.frags. 300
atSILTY SAND(af),gr.br.,f.to c.g., f. 72to c.g. GRAVEL/num.SS.frags.
SILTY GRAVELLY SAND(Sa1),gr.br.f.to851.2 ML c.g.,f. to c.g.GRAVEL/num.SS.frags. 80
S GRAVELLY CLAYEY SAND(SC).gr.br.f. to-S c.g.,f.to-s.g.GRA% L(mos.SS.frags.)_ 275
__g q -L SHALE. gr.h. 300/i
Bottom of Hole
S IZE 6"& 4" PROJECT UFEsv~iLL LAKE, OI SHEET 2 OF 2 SHEETS
B14

HOLE NO.W-8
DATE 30 Jan 76 N.ELEV. , JDIRECTION E. _____E
ELEV SY M CLASSIFICATION REMARKS
'V1 ____________________________ _____________________
US Sampler: 6" BarrelNO WIPLE 1amuier: 9001
Drop: 30"
G-SANDY GRAVEL (GP-(1I), dlk.br. SEEPAGE BLANKET FRCIA TOP
PlI ROK TOE-SANDSTONE. MBBL ES 72 OF GROUIND TO EL. 925.4
923.4 JAND BOULDERS 681
92. CCLAYEY SANDY GRAVEL(GC),gr.br.,f.to Changed to921. .' c~ f.toc.g.SAND/so.SS.frags. 76 4" Barrel
SILTY SANDY GRAVEL(QG1-GP), it. br. s(1.- f.to c.g.,f.to c.g. SAND/tr.G~p SS. frags.
917.4 112Sp- SAN[D(SP-a0,lt.br.,E. to c.g.,/tf.to
91S.4 c~t c.g. GRAVEL & mmn. SS. frags. 8
CL' GRAVELLY SANDY CLAY(CL),br.gr.,f.to__LL3. ___ c.g..f.to c.g.GRAVEL/mos.SS. frags. 72
9114 SILTY SANDY GRAVEL(QGI),dk.br.,f. to91. c.g. ,f.to c.g.SAND(moKs.SS.frags.) 87
SMSILTY SAND(a1),dk.br.,f.to c.g./909.4 f. to c.g.GRAVEL & tr.SS. frags. 24
SM FZVaET=rLY SAND(al),dk-.br. t.to907.4 __c.g., f. to c.g.GRAVELLY/tr.SS.frags. 30
SILTY SAND(&%f),gr.br.,f.to c.g.,/905.4 al~. f.GRAVEL (mos.SS.frags.) 72
SM- SILTY SAND(SM-SC), g-r.br., f. to 48SC e.g.If. (RAVEL & ntan.SS. frags.
901.4 1________________ _ 6'8
SILTY SAND(Sa1), dk.br.,f. to c.g. 48al! If.to c.g. GRAVEL(mos.SS.frags.)
_n7-4___________ 46
SILTY SAND(S.4), dk.br.,f. to c.g./89S.4 __f. to c.g.GRAVEL & niam.SS. frags. 42
SILTY GRAVELLY SAND(S.1),dk.br. f.to893.4 af c.g.,f.to c.g.GRAVEL(mos.SS.frags:) 46
GRAVELLY SILTY SAND(al),dk.br. f.to814 c.g. ,f. to c.g.GRAVEL(mos.SS.frags.) 48
R4SILTY GRAVELLY SAND(S.I),dk.br. t.to889.4 c.g.,f.to c.g.GRAVEL(mos- SSfrags.) 46
-%I[ SILTY GRAVELLY SAND(S.I-SP),d1k.br.f.887.4 SP to c.g.,f.& c.g.GRAVEL(inos.SS.frags.) 54
.9 SILTY GRAVELLY SAND(S.I),dk.br.f.to885.4 c.g.,f.& c.g.GRAVEL/num.SS.frags. 58
-SILTY GRAVELLY SAND(S.1-SP),lt.br. f.883.4 SPto c.g., f.& c.g.GRAVEL(mos.SS.frags) 52
881.4 alSILTY GRAVELLY SAND(S.o,lt.br.,f.tfo-881.4c.g.J.f4 c.g.GRAVEL(so.SS.frags.) 54
SIZE 6"& 4" PROJECT LEESVILLE LAKE, 0111O SHEET 1 OF 2 SHEETS
B15

CONTD.W-8
ELEV. SYM ~ CLASSIFiCATION REMARKS
ý't SILTY GRAVELLY %kND0(-2,-SP),1t.br.,f.879.4 SP~ to c.g.,f. 4 c. g. QýAVEL (mos. SS. frags' 60
SILTY GRAVELLY &AM ,ao br. f.
to c.g., f. & c.g.GRAVEL/ 4nwm. SS. frags. 145
142
871.4 225
SILTY GRAVELLY SAN~D, dk. br. 186f. to c.g., f.g. GRAVEL/ntnn.
74 55S. frags. 185
GRAVELLY SILTY SAND(.%0, dk.br.865.4 at f.to c.g.,.f.& c~g.GRAVE-L/nuzm.SS.frags aIz...
':tSILTY SAND(94L)dK-.br.,f.to c.g..f.G86. c.g.GRAVEL (so.SS.frags.) 152
at SILTY GRAVELLY SAND(a4), dk.gr., c.861.4 to c.g., f.& c.g.GRAVEL(so.SS.frags.) 145
SILTY SAND(a4), dk.br.f.to c.g.,85. 9 f.' c.g.GRAVEL~so.SS.frags.) 58
atSILTY GRAVELLY SAND(a1),dk.br.,f.to857.4 c.g.,f.& c.g.GRAVEL(so.SS.frags.) 116
.4SILTY SAND(SM),gr.br.,f.to c.g., 108f.& c.g. GRAVEL,(so.SS.frags.)
853.4 __________________ 11694SILTY SAND(a1),dk.br.,f.to c.g., f.
851.4 & c.g.GRAVEL (so.SS.frags.)CLAYEY SAND (SC),gr.br.,f.to c.g.Itr.
849.4 SC f.& c.g.GRAVEL(so.SS.frags.) 180CLSANDY CLAY(CL),d1.gr.,f. to c.g.SAND
847.4 tr. f.& c.g.GRAVEL(mos.SS.frags) 330
Bottom of Hole
SZE 6'& 4" PROJECT LEESVILLE LAKCE, OHI0 ISHEET 2 OF 2 SHEETS
B16

HOLE NO.
DATE 24 Mar. 76 N.
ELEV. o DIRECTION E. .____E.
ELEV SYM CLASSIFICATION REMARKS
9_ _ _ _ BIDfWS
921 NS NO SPLE Sampler: 6" Barrel_2L - N- SPLE_ Ilanner: 180DN
- Drop: 24"GRAVELLY SAND (SP), br., f. to 6
SP c.g., f. 6 c.g. GRAVEL
925.1 72;SANDY GRAVEL (GP), br., f. & c.g., SEEPAGE BLANKET FRfal
GP c. to f.g. SAND 21 TOP OF GROUJND TO EL. 923.1
SP- GRAVELLY SAND (SP-SM), br., c. to921.1 SM f.g., c. 6 f.g. GRAVEL 28 BUT NOT NPTED ON
GC- CLAYEY SANDY GRAVEL (GC-GP), br., c. FIELD L919.1 GP & f.g. GRAVEL, C. to f.g. SAND
SP- GRAVELLY SAND (SP-SNI), br.,f.to c.g.
917L1- ' f. & c.g. GRAVEL 38GRAVELLY SAND (SP), br., f. to c.g.,
915.1 f. to c.g. GRAVEL 17SP- GRAVELLY SAND(SP-SM), br.,f.to c.g.,
913.1 [S f. to c.g. GRAVEL 383.1-1 SILTY GRAVELLY SAND(SM-SP),br.,f.
911.1 Sp to c.g., f. 6 e.g. GRAVEL 60GRAVELLY SAND(SP), br.f. to e.g.,
.1 SP f. 6 c.g. GRAVEL 21Ap SANDY GRAVEL(GP), br.,f.6 c.g.,
907.1 f. to c.g. SAN 33CLAYEY GRAVELLY SAND(SC), br.,f.
905.1 SC to c.g., f. & e.g. GRAVEL 34G11- CLAYEY SANDY GRAVEL (G(Q-cP),br.
903.1 GP f. 6 c.g., f. to e.g. SAND 29CLAYEY GRAVELLY SAND (SC), br.f.
901.1 SC to c.g., f. 6 c.g. GRAVEL 17
CLAYEY SAND(SC), br.jf. to e.g.SC SAND/f. & c.g. GRAVEL, few frags. 9
897.1 23
SILTY SAND (SM-SC), br.jf. to 1931- c.g. SAND/f. 6 c.g. GRAVELSC frags. @ 34.0'893.1 ___________________ 29
SILTY SAND (S9), br. f. to e.g./ 10- f. 6 c.g. GRAVEL
-829,.1 28- SILTY SAN (SM-SC), br., f. to c.g.
S1- /f. 6 c.g. GRAVEL 20SC
885.1 __ 32CLAYEY SAND (SC), br., f. to c.g.
SC f. 6 e.g. GRAVEL 49
881.1 I - 161
SIZE 6" 6 4" PROJECT LEESYILLE LAKE, OlIO SHEET 1 OF 2 SHEETS
B17

CONTD.W-9
ELEV. SYM CLASSIFICATION REMARKS
GRAVELLY SILTY SAND(Sl), br. f. toc_ . g./nufrags. 19CLAYEY SAND (SC), br., f. to c.g./nuVn. frags.c ___
119
811 NS No SAIIPLE871.1
GRW.ELLY CLAYEY SAtO(SC), br.
869.1 SC f.g. to c.g., f. & c.g. GRAVEL 71
CLAYEY SAND (SC), br., f. to c.g. 100f. & c.g. GRAVEL
SC 865, l142GRAVELLY CLAYEY SAND3 (S('), hr.
863.1 SC f. to c.g., f. & c.g. *'"'-" 1. 178
CLAYEY SAND (SC), br., f. to c.g.,f. & c.g. GRAVEL/tr. wood frags. 18S
@ 68.0'/frags. @ 68.01 & 70.0'SC 147
47
65
853.1 66
GRAVELLY CLAYEY SAND (SC), br. 69SC f. to c.g., f. & c.g. GRAVEL
86
847.1 112
"CLAYEY SAND (SC), br. f. to c.g. 120/f. & c.g. GRAVEL
SC843.1 255
Bottom of Hole
SI ZE6" 6 4" PROJECT LEESVILLE LAKE, otllo SHEET 2 OF 2 SHEETS
B18

HOLE NO.W -1O
DATE 4 Mar 76 N.
ELEV. 931.7 DIRECTION Vertical E.
ELEV SYM CLASSIFICATION REMARKS
929.7 t _ NO 1IIP-- 0 Sampler: 6" Barrel-ýP GRAVELLY SAND(SP), br., f. to c.g,, RHammer: 9001
927.7 C. to C.9. GRAVEl. 0o Drnp." 3n"
925.7 .INS NO SAMPLE 72 SEEPAGE BLM1 T FRC?.-TOP OF GROUND TO EL. 925.7
ROCK TOE - SANDSTONE 100
COBBLES BOULDJ1ERS Changed to4" Drive BBL
SANDY GRAVEL (GP), hr., f. to c.g.917.7 GP f. to c.g. sand/SS. frags 78
sp- GRAVELLY SAND (SP-S%•), br. f. to915.7 alj c.g./SS. frags. 72
at- SILTY GRAVELLY SAND (Sa-SP), lt.br.q11 7 SP f. to c.g., f. & c.g. GRAVEL 7r
CLAYEY GRAVELLY SAND (SC), br.f. to911.7 -S c.g.. f. toc.g. GRAVEL 38
GRAVELLY SAND (SP-SC), br. f. toSP- c. g., f. to c.g. GRAVELSc
QA7 7 42
- SP- GRAVELLY SAND (SP-9I), br. f. to905.7 at c.g., f.g. GRAVEL/frags. 82
93 SILTY SAND, br., f. to c.g./903.7 __ frags. 86
SC CLAYEY SAND (SC), br., f. to c.g,
7 /.. to c. g. GRAVEL 72a' SILTY SAND (SM), br., f. to c.g.
899.7 /frags. 38CLAYEY SAND (SC), br., f. to c.g.
897.7 " _S /1. frags. wd. 49
SILTY SAND (94), br.f. to c. g.,/f. to c. g. GRAVEL
- /frags.
42
44
42
32
883.7 37
CLAYEY SAND (SC), br., f. to c.g.,881.7 Sc f. to c.g. GRAVEL/frags. 58
SIZE 6" & 4' PROJECT LESVILLE LAKE, 01110 SHEET 1 OF - 2 SHEETS
B19

CONTD.W -I0
ELEV SYMI CLASSIFICATION REMARKS
_88__7 BLOdSat SILTY SAND (al), br., f. & c.g.,/
879.7 f. & e.g. GRAVEL & SS. frags. 78SILTY SAND (SO, br., f. to c.g./
877.7 a! f.g. GRAVEL 106.SP- ILITY (LAVLLI SAM (bk-'iJ, or.
875.7 , S 9885 CLAYEY SAND (SC), br., f. to c.g.,/
Sc f.g. GRAVEL & frags. 92
SILTY GRAVELLY SAND (SP-aI), br..Sp- f. to c.g. GRAVEL/frags. 89
8 58.0'/numz. frags. 8 60.0'
B69.7 1089I SILTY GRAVELLY SAND (aI-SP), br., f.
8671.7 SP to c.g., f. to c.g.GRAVEL/m., frags. 68
CLAYEY GRAVELLY SAND (SC), br.SC f. to e.g., f. to e.g. GRAVEL/tr. IN
COAL @ 64.0'863.7 72
SILTi GRAVELLY SAND (SP-aI), br.SP f. to e.g., f. to e.g. GRAVEL/few 46- . frags. •-
859 - __ __62
SILTY SAND (at), br., f. to e.g./__7.7 GRAVEL & frags. 66
GRAVELLY CLAYEY SAND (SC), br.SC f. to c.g., f. to e.g. GRAVEL • 90
frags. wd.853.7 __________________ 92
S CIAYEY SAD (SC), br., f. to c.g.
851.7 (mos. f. num. frags). 102
GRAVELLY CLAYEY SAND (SC), br. 118SC f. to c.g., f. to e.g. GRAVEL/
frags. @ 80.0'847.7 _ 92
- SC CLAYEY GRAVELLY SAND (SC), br.,t.84S.7 to e.g., f. to e.g. GRAVEL/few frags 200
GRAVELLY CLAYEY SAND (SC) br.SC f. to c.g., f. to e.g. GVEL/ 215
frags. 22S
839.7 302
SILTY GRAVELLY SAND (94), br.,f.837.7 to c.g.,f. to c.g.GRAVEL/few frags. 235836.7 GRAVELLY CIAYEY SAND (SC), br.,f.to 325
c.g.,f.g. GRAVFL/frags.
Bottom of Hole
SIZE6" 8 4" PROJECT LEESVILLE LAKE, 01IO SHEET 2 OF 2 SHEETS
B20

HOLE NO.W-I!
DATE I kbr 76 N.
ELEV. 6 DIRECTION Vertical E.
ELEV SYM CLASSIFICATION REMARKS
931.7 BI•[rw
I GRAVE.LY SAND (SP), dk. br. I 6f. to c.g., c. to f.g. GRAVEL/tr. 0 Samplerr 96" Barn ep SS. frags. (10% of SAMPLE Drop: 30"DECAYED O)OD) Dr1p:j3
S_29G,-7 Sv P d g23 SEEPAGE BLANKET FRCI. TOP
ýP- SANDY GRAVFL(GP-('), dk.br f.g. to OF GR(OND TO EL. 923.7923.7 1-1 c.g./tr.SS.frags.f. to c.g.SAND, rts 48
ROix TOE - SANDSTOJE Changed toCOBBLES AND WJLDERS 70 4" Barrel
91.7 GRAVELLY SILTY SAND(' 10, gr.,f. to917.7 N c.g., f.& c.g.GRAVEL/tr.SS. fragj 64
1,I- SILTY SAND(Sl-SC),gr.br., f.to c.g.,915.7 3C f.g. GRAVEL/tr. SS. frags. 7?
SILTY GRAVELLY SAND(%i),gr.br., f.to_l -_ c.g., f.to c.g.GRAVEL/tr.SS.frags. 78-- T TY RAV --SND .:7) , dk. br. , t. to
911.7 94 c.g.,f. to c.g.GRAVEL/tr.SS.frags. 66
SILTY SAND(al), grr.br.,f. to c.g./ 622 tr.f.to c.g.GRAVEL & so.SS.
frags.907.7 64
;C- CLAYEY SAND (SC-S4),br.gr., f. to90S.7 &%I c.g./tr. f.g. GRAVEL 66
SANDY CI.AY(CL),br.,gr., f. to c.g.903.7 :L SAM)/tr.f.to c.g. GRAVEL(mos.SS.frag:) 68
SANDY CLAY (CL), dk. gr.f. to c.g. SAND,(,ms. SS. frags 8 28.0') 64/c. to f. g. GRAVEL(mos. SS. frags. @ 32.0', 34.0')/tr. SS. frags. @ 36.0' 72
:L (mos. SS. frags. @ 40.0')
74
64
62
889.7 110CLAYEY SAND(SC),dk.gr., f.to c.g.
887.7 Ic.6 f.GRAVEL (mos.SS. frags.) 80
SANDY CLAY (CL), dk. gr., f. to c.g.SAND,/f. & c.g. GRAVEL 92/tr. SS. frags. @ 44.0'
883.7 L 58:LL SANDY CLAY(CL),br.gr.. f. to c.g.SANI
881.7 �mos.SZ. frags.)/f.g.GRAVF. 72SIZE 4-, & 4' PROJECT LEES'VIuEI LAKE, cllIO ISHEET I OF 2 SHEETS
B21

CONTD.w -I I
ELEV SYM CLASSIFICATION REMARKS
SAMY' C LAY (CL) , a-.kgr. fA c. g.R7 - L SANDjj 76
-CLAML SAND(SC7-1irJ,gr.br.j,.to c. g./I
SL~ ~ fhc.g.GRAVEL(mos.SS. frags.) 6
SILTY WMN(a1) ,gr.br.. f. toc.g. (mns. SS. frags. 54.0' to58.0')/f.& c.g. GRAVEL 54.0'to 7
.~58.0' 7
871.7 72I
SILTY SAPD(al), lt.br.f. to c.g. 72'ISAND/f.g.GRAVE-L & tr. S.S.frags.
86.7 SILTY SAD&,gr.br. f. to c.g. 6865.7 __/tr. f. & c.g. GRAVEL & nion.SS.frags 6
GRAVELLY SILTY SAND(S.1), gr. 72br., f. to c.g.,f.6 c.g.GRiAVEL/
861.7 nizun.SS. frags. @ 68.0' & [email protected] 7
CLAYEY SAND(SC),br.gr. f to c.g. 108If.& c.g.GRAVEL/nuzn.SS.fr3gs.
SC 70.0'/tr.SS.frags.@ 72.0'
-r, 7 __________________ 112
855.7 is N ML 172CLAYEY SAND(SC), br.gr.,f. to c.g.
- /f.g. GRAVEL & tr. 5S. frags. 170SANDMY CLAY(CL),br.gr. f. to c.g.
8SI.7 -' SAND/f.to c.g.QLAVEL 6 tr.SS.frags. 257
- c CLAYEY SAND(SC), lt.g-r.,f. to c.g.A4.1 If. to c.g.GRAVEL & ntnn.SS. frags. 178
GRAVELLY CLAYEY SAND(SC), *it.sC gr., f. to c.g.SAND, f. to c.g. 1122
864GRAVEL (mos. SS. frags. 6.&. 51.)
Bottom of Hole
SIZE 6"& 4" PR. T ULEESVILLE- LAKE, 01110 SHEET z OF z SHEETS1
B22

HOLE NO.W-12
DATE 19 ?lar 76 N.
ELEV. 9., DIRECTION Vertical E.
ELEV SYM CLASSIFICATION REMARKS
931.8 BLOWS- S lNO SVa~qLE
9nh.8 ItsNO____PLESampler: 6" BarrelQIGRAVELLY SAND,(SP),br..f.to c.g. Hanmer: 18001
sp f. & c.g. GRAVEL/tr.SILT @ 4.0' Drop: 24"
SEEPAGE BLAN FRCI TOP925.810 OF GRCOUND TO EL. 923.8SANDY GRAVEL(GP), f. & c.g.
923.8 ;P f.to c.g. SANDI
2-1 SANDY GRAVEL(GP-Gf), br., f.& c.g. RIPRAP PRESENT UTr NOT92. L •1 f. to c.g.SAND - 29 NOTED ON FIELD LOG.
-.4 SILTY SANDY GRAVEL(-II-GP), br. c. &
919.8 ! fdg. SS. frags. f.to c.g. SAND/few 38
- SANDY GRAVEL(GP-(•l),br.f.to c.g.917.8 2! f. to c.g. SAM 46
SILTY GRAVELLY SAM (9,0, br., f. to915.8 c.g., f. to c.g. GRAVEL 43
-1- SILTY SANDY GRAVEL(CI-GP), br.,f.g.
913.8 - f. to c.g. SAND/SS. frags. 38SILTY GRAVELLY SAND(at), br. f. to Changed to
911.8 , c.g.SAND, f. & c.g. GRAVEL 4' Barrel
99 SANDY GRAVEL(GP), br., f. to c.g.,909.8 f. to c.g.SAND/few SS. frags. 26
SILTY GRAVELLY SAMN(SO, br., f. to907.8 .1 c.g., C.& f.g.GRAVEL/tr.bk.tignite 16
-C ýc CLAYEY SAND(SC),br. f. to m.g.905.8 _ /so. f.g. GRAVEL 16
SILTY GRAVELLY SAND(SI), br. f. to-n - m.g.,f.g. GRAVEL 21
SILTY SAND(Sl), br., f. to m.g.,901.8 __ /f.g. GRAVEL 19
SILTY GRAVELLY SAND(,%1), lt.br.899.8 __ f. to c.g., c.& f.g. GRAVEL 58
%I SILTY SAND(S))/tr.f.g.GRAVEL897.8 25
-1. SILTY SAND (91),gr.,f. to m.g.895.8 /tr. f. SS. frags. 34
SILTY GRAVELLY SANDfSI),br.,f.893.8 to c.g., f.g. GRAVE 38
GRAVELLY SILTY SAND (Sl),gr.891.8 ,I f. to c.g., f.g. GRAVEL 30
SANDY CLAY, (CL), br.,f.g. to c.g.889.8 - L SAND/tr. f. GRAVEL 98
SC CLAYEY SAND(SC) gr., f. to c.g.887.8 _ /GAVEL f.g.& c.g. 106
SUALE, gr., wd. to SILTY SAND,885.8 §AND f. to m.g./sevr. s,.rusty iron 134
Bottom of Ilole
SIZE6", 4" PROJECT LEESVILLE LAKE, m1o 0 SHEET 1 OF 1 SHEETS
B23

Waterways Experiment Station Cataloging-In-Publication Data
Leach, Roy E.Evaluation of the rehabilitation program for relief wells at Leesville Dam,
Ohio / by Roy E. Leach and Glen Hackett ; prepared for Department ofthe Army, US Army Corps of Engineers.
109 p. : ill. ; 28 cm. - (Technical report; REMR-GT-1 8)Includes bibliographical references.1. Relief wells - Maintenance and repair - Evaluation. 2. Subsurface
drainage - Ohio - Carroll County. 3. Water, Underground - Microbi-ology. 4. Leesville Dam (Ohio) I. Hackett, Glen. II. United States.Army. Corps of Engineers. Ill. US Army Engineer Waterways Experi-ment Station. IV. Repair, Evaluation, Maintenance, and RehabilitationResearch Program. V. Title. VI. Series: Technical report (US Army En-gineer Waterways Experiment Station) ; REMR-GT-1 8.TA7 W34 no.REMR-GT-18