offering memorandum - images1.loopnet.comimages1.loopnet.com/d2/p_qeqqr9yl6jnvggphpndenlw1... ·...
TRANSCRIPT

5933 LA TIJERA BLVDLos Angeles, CA 90056
Offering Memorandum
1

N O N - E N D O R S E M E N T A N D D I S C L A I M E R N O T I C E
Confidentiality and DisclaimerThe information contained in the following Marketing Brochure is proprietary and strictly confidential. It is intended to be reviewed only by the party receiving it from Marcus & Millichap and
should not be made available to any other person or entity without the written consent of Marcus & Millichap. This Marketing Brochure has been prepared to provide summary, unverified
information to prospective purchasers, and to establish only a preliminary level of interest in the subject property. The information contained herein is not a substitute for a thorough due
diligence investigation. Marcus & Millichap has not made any investigation, and makes no warranty or representation, with respect to the income or expenses for the subject property, the
future projected financial performance of the property, the size and square footage of the property and improvements, the presence or absence of contaminating substances, PCB's or
asbestos, the compliance with State and Federal regulations, the physical condition of the improvements thereon, or the financial condition or business prospects of any tenant, or any
tenant's plans or intentions to continue its occupancy of the subject property. The information contained in this Marketing Brochure has been obtained from sources we believe to be
reliable; however, Marcus & Millichap has not verified, and will not verify, any of the information contained herein, nor has Marcus & Millichap conducted any investigation regarding these
matters and makes no warranty or representation whatsoever regarding the accuracy or completeness of the information provided. All potential buyers must take appropriate measures to
verify all of the information set forth herein. Marcus & Millichap is a service mark of Marcus & Millichap Real Estate Investment Services, Inc. © 2018 Marcus & Millichap. All rights reserved.
Non-Endorsement NoticeMarcus & Millichap is not affiliated with, sponsored by, or endorsed by any commercial tenant or lessee identified in this marketing package. The presence of any corporation's logo or
name is not intended to indicate or imply affiliation with, or sponsorship or endorsement by, said corporation of Marcus & Millichap, its affiliates or subsidiaries, or any agent, product,
service, or commercial listing of Marcus & Millichap, and is solely included for the purpose of providing tenant lessee information about this listing to prospective customers.
ALL PROPERTY SHOWINGS ARE BY APPOINTMENT ONLY.
PLEASE CONSULT YOUR MARCUS & MILLICHAP AGENT FOR MORE DETAILS.
5933 LA TIJERA BLVD
Los Angeles, CA
ACT ID X0121050
2

TABLE OF CONTENTS
SECTION
INVESTMENT OVERVIEW 01Offering Summary
Regional Map
Local Map
Aerial Photo
FINANCIAL ANALYSIS 02Rent Roll Summary
Rent Roll Detail
Operating Statement
Notes
Pricing Detail
Acquisition Financing
MARKET COMPARABLES 03Sales Comparables
Rent Comparables
MARKET OVERVIEW 04
Market Analysis
Demographic Analysis
5933 LA TIJERA BLVD
3

5933 LA TIJERA BLVD
4
INVESTMENT
OVERVIEW

5933 LA TIJERA BLVD
#
EXECUTIVE SUMMARY
OFFERING SUMMARY
MAJOR EMPLOYERS
EMPLOYER # OF EMPLOYEES
Raytheon 8,941
Team One 5,000
Centinela Frman Rgonal Med Ctr 3,796
Sony Pictures Studios 3,040
Spacex 3,000
US Post Office 2,527
Classic Party Rentals 2,502
Time Warner Cable Entps LLC 2,500
Aerospace Corporation 2,315
Kaiser Permanente West 2,000
Police Dept 1,911
Mattel Toy Company 1,900
DEMOGRAPHICS
1-Miles 3-Miles 5-Miles
2017 Estimate Pop 29,156 261,291 895,573
2010 Census Pop 28,293 252,418 857,775
2017 Estimate HH 12,593 100,594 321,700
2010 Census HH 12,108 96,466 305,950
Median HH Income $65,558 $51,763 $49,660
Per Capita Income $38,065 $30,374 $28,290
Average HH Income $88,034 $78,526 $78,100
UNIT MIX
NUMBEROF UNITS
UNIT TYPEAPPROX.SQUARE FEET
1 Bachelor/ 1 Bath- Non Conforming Unit
1 1 Bedroom/ 1 Bath
2 2 Bedroom/ 1 Bath
4 Total 2,421
VITAL DATA
Price $1,195,000 CURRENT PRO FORMA
Down Payment 100% / $1,195,000 CAP Rate 4.38% 5.31%
Loan Type All Cash GRM 16.19 14.03
Price/Unit $298,750Net Operating Income
$52,365 $63,423
Price/SF $493.60Net Cash Flow After Debt Service
4.38% / $52,365 5.31% / $63,423
Number of Units 3 + *1 Total Return 4.38% / $52,365 5.31% / $63,423
Rentable Square Feet 2,421
Year Built 1950
Lot Size 0.17 acre(s)
* Bachelor is a Non-Conforming Unit
5
*

REGIONAL MAP
5933 LA TIJERA BLVD
6

LOCAL MAP
5933 LA TIJERA BLVD
7

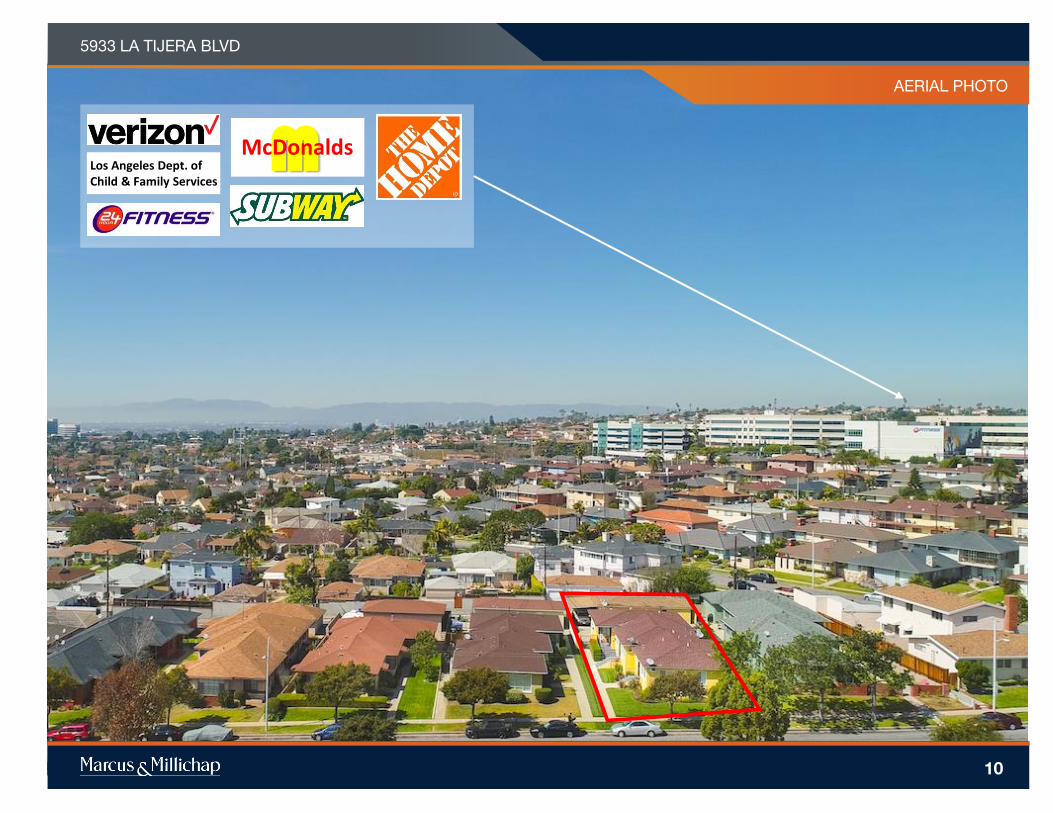
AERIAL PHOTO
5933 LA TIJERA BLVD
8

AERIAL PHOTO
5933 LA TIJERA BLVD
9
Los Angeles Dept. of Child & Family Services
MMcDonalds
Frank D. Parent Elementary School
La TijeraElementary School
MMcDonalds
Westfield Shopping Mall Culver City
The Promenade @Howard Hughes Center
AERIAL PHOTO
5933 LA TIJERA BLVD
10
Los Angeles Dept. of Child & Family Services
MMcDonalds
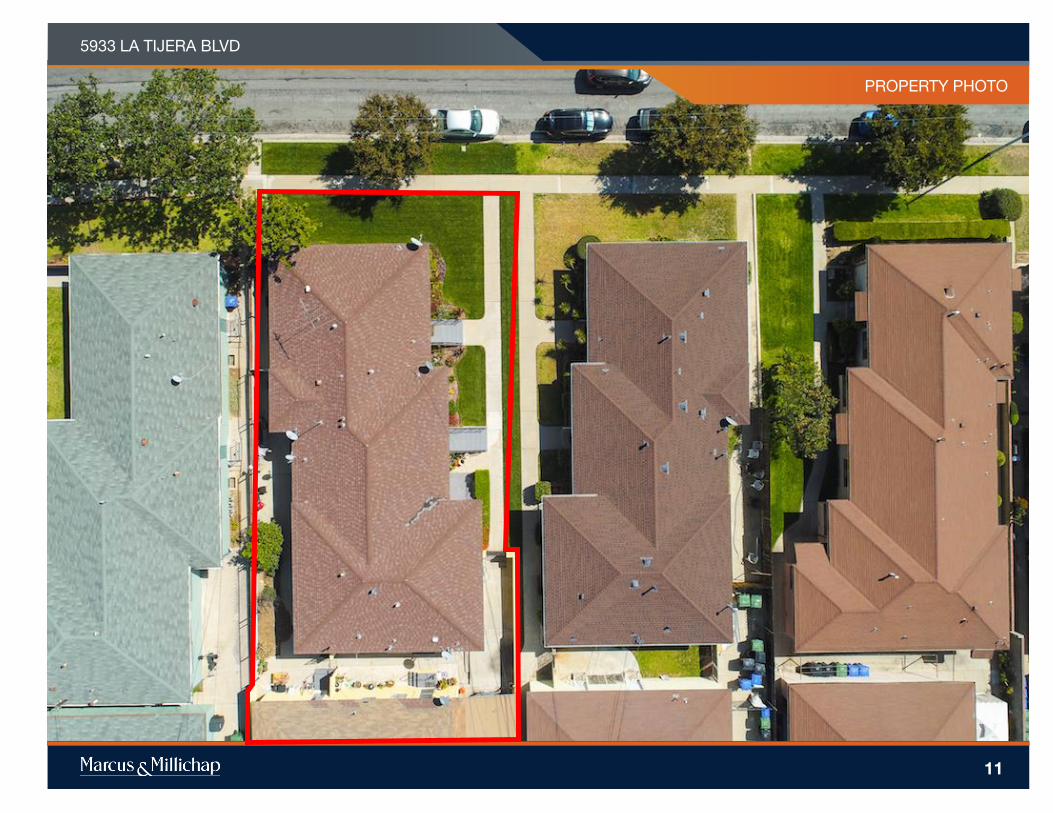
PROPERTY PHOTO
5933 LA TIJERA BLVD
11

PROPERTY PHOTO
5933 LA TIJERA BLVD
12

PROPERTY PHOTO
5933 LA TIJERA BLVD
13

PROPERTY PHOTO
5933 LA TIJERA BLVD
14

5933 LA TIJERA BLVD
15
FINANCIAL
ANALYSIS

FINANCIAL ANALYSIS
5933 LA TIJERA BLVD
RENT ROLL SUMMARY
16
* Bachelor is a non-conforming unit.
*

FINANCIAL ANALYSIS
5933 LA TIJERA BLVD
17
RENT ROLL DETAIL
* Bachelor is a non-conforming unit.
*
FINANCIAL ANALYSIS
5933 LA TIJERA BLVD
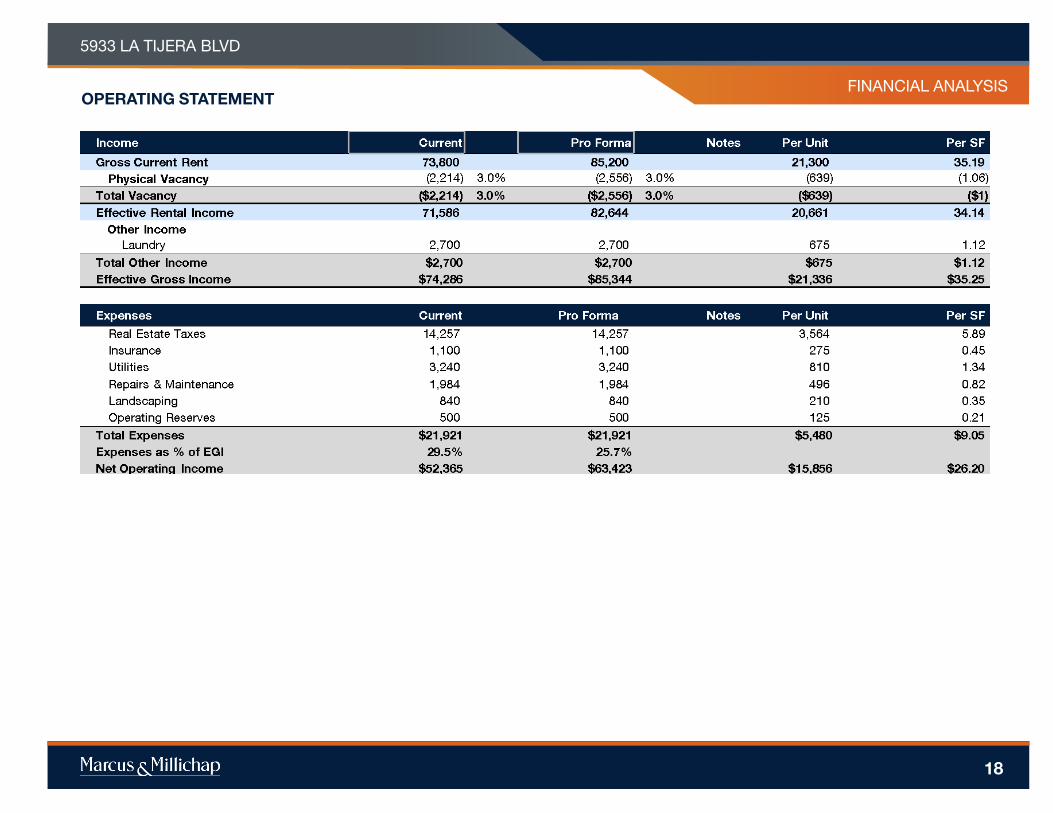
OPERATING STATEMENT
18

FINANCIAL ANALYSIS
5933 LA TIJERA BLVD
PRICING DETAIL
19
-Non Conforming Unit
* Bachelor is a non-conforming unit.
*

MARCUS & MILLICHAP CAPITAL CORPORATION
CAPABILITIES
MMCC—our fully integrated, dedicated financing arm—is committed to
providing superior capital market expertise, precisely managed execution, and
unparalleled access to capital sources providing the most competitive rates and
terms.
We leverage our prominent capital market relationships with commercial banks,
life insurance companies, CMBS, private and public debt/equity funds, Fannie
Mae, Freddie Mac and HUD to provide our clients with the greatest range of
financing options.
Our dedicated, knowledgeable experts understand the challenges of financing
and work tirelessly to resolve all potential issues to the benefit of our clients.
National platform
operating
within the firm’s
brokerage
offices
$5.63 billion
total national
volume in 2017
Access to
more capital
sources than
any other firm
in the industry
Optimum financing solutions
to enhance value
Our ability to enhance
buyer pool by expanding
finance options
Our ability to enhance
seller control
• Through buyer
qualification support
• Our ability to manage buyers
finance expectations
• Ability to monitor and
manage buyer/lender
progress, insuring timely,
predictable closings
• By relying on a world class
set of debt/equity sources
and presenting a tightly
underwritten credit file
WHY MMCC?
Closed 1,707
debt and equity
financings
in 2017
ACQUISITION FINANCING
5933 LA TIJERA BLVD
20

5933 LA TIJERA BLVD
SALES COMPARABLES MAP
21
5933 LA TIJERA BLVD
(SUBJECT)
5133 W 58th Pl
5429 W Slauson Ave
5937 La Cienega Boulevard
5108 West Slauson Avenue
SALES COMPARABLES
ON MARKET COMPARABLES
1
2
3
4

5933 LA TIJERA BLVD
22
MARKET
COMPARABLES

PROPERTY NAME5933 LA TIJERA BLVD
SALES COMPARABLES
23
SALES COMPARABLES
Avg. $334.10
Avg. $357.42
$0.00
$50.00
$100.00
$150.00
$200.00
$250.00
$300.00
$350.00
$400.00
$450.00
$500.00
5933 La
Tijera Blvd
5133
W 58th Pl
5429 W
Slauson Ave
5937 La
Cienega
Boulevard
5108 West
Slauson
Avenue
Average Price Per Square Foot
Avg. $493,333
Avg. $458,333
$0
$70,000
$140,000
$210,000
$280,000
$350,000
$420,000
$490,000
$560,000
$630,000
$700,000
5933 La
Tijera Blvd
5133
W 58th Pl
5429 W
Slauson Ave
5937 La
Cienega
Boulevard
5108 West
Slauson
Avenue
Average Price Per Unit
Avg. 13.78
0.00
1.80
3.60
5.40
7.20
9.00
10.80
12.60
14.40
16.20
18.00
5933 La
Tijera Blvd
5133
W 58th Pl
5429 W
Slauson Ave
5937 La
Cienega
Boulevard
5108 West
Slauson
Avenue
Average GRM
Avg. 4.14%
0.0
0.5
1.0
1.5
2.0
2.5
3.0
3.5
4.0
4.5
5.0
5933 La
Tijera Blvd
5133
W 58th Pl
5429 W
Slauson Ave
5937 La
Cienega
Boulevard
5108 West
Slauson
Avenue
Average Cap Rate
SALES COMPARABLES
ON MARKET COMPARABLES
SALES COMPS AVG
ON MARKET COMPS AVG

PROPERTY NAME
MARKETING TEAM
5933 LA TIJERA BLVD
SALES COMPARABLES
rentpropertyname1
rentpropertyaddress1
rentpropertyname1
rentpropertyaddress1
rentpropertyname1
rentpropertyaddress1
24
SALES COMPARABLES ON MARKET COMPARABLES
Units Unit Type
Offering Price: $1,195,000 1 Bachelor 1 Bath
Price/Unit: $298,750 1 1 Bdr 1 Bath
Price/SF: $493.60 2 2 Bdr 1 Bath
CAP Rate: 4.38%
GRM: 16.19
Total No. of Units: 4
Year Built: 1950
Underwriting Criteria
Income $74,286 Expenses $21,921
NOI $52,365 Vacancy ($2,214)
5933 LA TIJERA BLVD5933 La Tijera Blvd, Los Angeles, CA, 90056
1
Units Unit Type
Close Of Escrow: 5/3/2016 3 2 Bdr 2 Bath
Sales Price: $1,300,000
Price/Unit: $433,333
Price/SF: $337.93
CAP Rate: 3.91%
GRM: 16.67
Total No. of Units: 3
Year Built: 1956
5133 W 58TH PL5133 W 58th Pl, Los Angeles, CA, 90056
Units Unit Type
Close Of Escrow: 2/8/2016 1 3 Bdr 1.5 Bath
Sales Price: $1,325,000 2 2 Bdr 1.5 Bath
Price/Unit: $441,667
Price/SF: $287.42
CAP Rate: 4.37%
GRM: 15.77
Total No. of Units: 3
Year Built: 1960
2
5429 W SLAUSON AVE5429 W Slauson Ave, Los Angeles, CA, 90056

PROPERTY NAME
MARKETING TEAM
5933 LA TIJERA BLVD
SALES COMPARABLES
rentpropertyname1
rentpropertyaddress1
rentpropertyname1
rentpropertyaddress1
rentpropertyname1
rentpropertyaddress1
25
SALES COMPARABLES ON MARKET COMPARABLES
Units Unit Type
Close Of Escrow: 2/5/2018 2 2 Bdr 2 Bath
Sales Price: $1,210,000
Price/Unit: $605,000
Price/SF: $376.95
GRM: 8.90
Total No. of Units: 2
Year Built: 1960
3
5937 LA CIENEGA BOULEVARD5937 La Cienega Boulevard, Los Angeles, CA, 90056
4
Units Unit Type
On Market 3 2 Bdr 1.5 Bath
List Price: $1,375,000
Price/Unit: $458,333
Price/SF: $357.42
Total No. of Units: 3
Year Built: 1955
5108 WEST SLAUSON AVENUE5108 West Slauson Avenue, Los Angeles, CA, 90056

8
5933 LA TIJERA BLVD
RENT COMPARABLES MAP
5933 LA TIJERA BLVD
(SUBJECT)
5850 Condon Avenue
7014 Flight Avenue
The Sheffield Apartments
Ladera Townhouse
Apartments
Sycamore Apartments
Ladera Apartments
4
7
8
9
11
20
12
14
15
16
17
13
18
10
4
1
2
3
5
6
26

PROPERTY NAME5933 LA TIJERA BLVD
RENT COMPARABLES
27
AVERAGE RENT - MULTIFAMILY
Avg. $2,405
$0
$300
$600
$900
$1,200
$1,500
$1,800
$2,100
$2,400
$2,700
5933 La
Tijera Blvd
5850 Condon
Avenue
7014 Flight
Avenue
The
Sheffield
Apartments
Ladera
Townhouse
Apartments
Sycamore
Apartments
Ladera
Apartments
2 Bedroom
Avg. $1,985
$0
$300
$600
$900
$1,200
$1,500
$1,800
$2,100
$2,400
5933 La
Tijera Blvd
5850 Condon
Avenue
7014 Flight
Avenue
The
Sheffield
Apartments
Ladera
Townhouse
Apartments
Sycamore
Apartments
Ladera
Apartments
1 Bedroom

PROPERTY NAME
MARKETING TEAM
5933 LA TIJERA BLVD
RENT COMPARABLES
rentpropertyname1
rentpropertyaddress1
rentpropertyname1
rentpropertyaddress1
rentpropertyname1
rentpropertyaddress1
28
YEAR BUILT: 1950
rentpropertyname1
rentpropertyaddress1
Unit Type Units SF Rent Rent/SF
Bachelor 1 Bath 1 $650 $0.00
1 Bdr 1 Bath 1 $1,500 $0.00
2 Bdr 1 Bath 2 $2,000 $0.00
Total/Avg. 4 $1,538
5933 LA TIJERA BLVD5933 La Tijera Blvd, Los Angeles, CA, 90056
YEAR BUILT: 1953
1
Unit Type Units SF Rent Rent/SF
1 Bdr 1 Bath 10 $2,095
Total/Avg. 10 $2,095
5850 CONDON AVENUE5850 Condon Avenue, Los Angeles, CA, 90056
2
YEAR BUILT: 1951
Unit Type Units SF Rent Rent/SF
1 Bdr 1 Bath 4 525 $1,959 $3.73
Total/Avg. 4 525 $1,959 $3.73
7014 FLIGHT AVENUE7014 Flight Avenue, Los Angeles, CA, 90045

PROPERTY NAME
MARKETING TEAM
5933 LA TIJERA BLVD
RENT COMPARABLES
rentpropertyname1
rentpropertyaddress1
rentpropertyname1
rentpropertyaddress1
rentpropertyname1
rentpropertyaddress1
29
YEAR BUILT: 1970
3
Unit Type Units SF Rent Rent/SF
1 Bdr 1 Bath 47 844 $1,900 $2.25
Total/Avg. 47 844 $1,900 $2.25
THE SHEFFIELD APARTMENTS5800 Green Valley Circle, Culver City, CA, 90230
YEAR BUILT: 1950
4
Unit Type Units SF Rent Rent/SF
2 Bdr 1 Bath 22 810 $2,351 $2.90
Total/Avg. 22 810 $2,351 $2.90
LADERA TOWNHOUSE APARTMENTS6233 S La Brea Avenue, Los Angeles, CA, 90056
5
YEAR BUILT: 1972
Unit Type Units SF Rent Rent/SF
2 Bdr 1 Bath 36 1,233 $2,330 $1.89
Total/Avg. 36 1,233 $2,330 $1.89
SYCAMORE APARTMENTS875 Victor Avenue, Inglewood, CA, 90302

PROPERTY NAME
MARKETING TEAM
5933 LA TIJERA BLVD
RENT COMPARABLES
rentpropertyname1
rentpropertyaddress1
rentpropertyname1
rentpropertyaddress1
rentpropertyname1
rentpropertyaddress1
30
YEAR BUILT: 1956
6
Unit Type Units SF Rent Rent/SF
2 Bdr 1 Bath 2 975 $2,535 $2.60
Total/Avg. 2 975 $2,535 $2.60
LADERA APARTMENTS4757-4811 W Slauson Avenue, Los Angeles, CA, 90056

5933 LA TIJERA BLVD
31
MARKET
OVERVIEW

MARKET OVERVIEW
OVERVIEW
WESTSIDE CITIES, LOS ANGELES
GROWING TECH SECTOR
The region’s growing high-tech sector has awarded the Santa Monica/Venice
area the nickname of “Silicon Beach,” attracting companies such as Google.
WELL-EDUCATED WORKFORCE
Area residents are well educated. A majority of adults possess at least a
bachelor’s degree and more than a quarter also have a graduate degree.
HIGH INCOMES
Educational attainment translates into a median household income that is well
above the national average. High home prices, however, keep the
homeownership level near 40 percent.
The Westside Cities area is located west of downtown Los Angeles and
north of Los Angeles International Airport. The market contains the
following submarkets: Brentwood-Westwood-Beverly Hills; Palms-Mar
Vista; and Santa Monica-Marina del Rey. Cities from Venice to Playa Del
Rey to Culver City are all located within these submarkets. The region is
projected to add 12,000 residents through 2022, resulting in the
formation of more than 7,600 households.
▪ Major employers in the region include entertainment giants 21st Century Fox and Sony Pictures.
While roughly 20,000 jobs are in the motion-picture industry, ancillary businesses tied to
entertainment are a major source of employment, as is marketing and advertising.
▪ The large healthcare industry is represented by UCLA Medical Group, Cedars-Sinai Medical Center,
Providence Health and Services, and the local VA.
▪ Educational institutions including UCLA, Loyola Marymount and Pepperdine University employ more
than 42,000 workers.
▪ Tourism and retail shopping are major drivers of the local economy.
DEMOGRAPHICS
ECONOMY
METRO HIGHLIGHTS
* Forecast
Sources: Marcus & Millichap Research Services; BLS; Bureau of Economic Analysis; Experian; Fortune; Moody’s Analytics; U.S. Census Bureau
5933 LA TIJERA BLVD
649K
2017POPULATION:
300K
2017HOUSEHOLDS:
39.4
2017MEDIAN AGE:
$81,400
2017 MEDIAN HOUSEHOLD INCOME:
U.S. Median:
37.8U.S. Median:
$56,3002.5%
Growth2017-2022*:
1.9%
Growth2017-2022*:
32

33
Metro well-positioned to handle spike in new supply. Los Angeles County enters this
year having recently absorbed 10,500 units, which has preserved tight vacancy and
pent-up demand throughout most of the market. Recent leasing activity has spurred
a rise in construction activity, with a cycle-high number of new rentals slated for
finalization this year. While this influx of apartments could be cause for concern, rising
single-family home values, a strong rate of household formations and diverse job
growth suggest the county should experience a second consecutive year of robust
absorption.
Demand for luxury rentals further tested. In 2018, more than 17,000 units will be
completed in the county, a record level of multifamily development and the highest
annual volume among West Coast metros. More than 40 percent of this year’s new
supply is in Greater Downtown Los Angeles, including nearly 4,000 rentals within the
city’s core. The county’s three other primary regions are also slated to witness
upticks in apartment deliveries, led by the Tri-Cities/San Fernando Valley and
Westside Cities where finalizations total 1,900 and 1,700 units, respectively. Renter
demand should match construction activity in most locales, with the exception of
downtown Los Angeles, supporting a minimal rise in overall vacancy and a second
consecutive year of above-average rent growth.
Historically High Delivery Volume
Minimally Adjusts Vacancy
LOS ANGELES COUNTY
Sources: CoStar Group, Inc.; Real Capital Analytics
5933 LA TIJERA BLVD
Investment Trends
• Deal flow in Los Angeles County fell moderately over 2017, yet annual sales
volume dropped by $600 million year over year. The billions of dollars closed
in 2017 reflect an increased number of smaller Class C trades coupled with a
reduction in Class A and larger-scale property deals.
• Sales activity within the city of Los Angeles accounted for roughly a third of
recent deal flow. Hollywood represents the top locale for value-add Class C
trades, with Mid-Wilshire home to a concentration of Class A and B
opportunities that net low-3 percent returns. Investors with an eye for higher-
quality assets just outside the city target the southern portion of the San
Fernando Valley, home to low-4 percent maximum returns.
• Affordable submarkets adjacent to the core also represent hot spots for
capital deployments. Value-add investors focused on sub-$20 million deals
pursue listings in Long Beach, the South Bay and the San Gabriel Valley.
Downtown Long Beach, Torrance and Inglewood all possess sizable
inventories of Class C assets that net buyers mid-4 percent cap rates.
• The high-priced tech hub of Santa Monica remains a sought-after locale
among institutional investors, yet a lack of listings hinders local deal flow and
drives pricing for available properties.
Multifamily 2018 Outlook
Vacancy
Y-O-Y
BasisPoint
Change
MetroEffective
Rent
Y-O-Y
Change
Downtown Los Angeles 5.5% 130 $2,529 5.2%
San Fernando
Valley/Tri-Cities3.4% 0 $2,168 6.0%
South Bay/Long Beach 4.5% 40 $2,328 5.4%
Westside Cities 3.6% 10 $3,252 4.1%
Los Angeles 4.1% 30 $2,309 6.3%

34
• Metro employers created 62,300
jobs over the past year, reducing
the unemployment rate by 70
basis points to a historically low
4.5 percent. During the previous
12-month period, organizations
added 60,500 positions.
• Education and health services
hiring drove overall job gains, yet
the professional services,
construction and financial sectors
added a combined 27,600
positions.
EMPLOYMENT
• Deliveries rose over the past 12
months after annual completions
totaled 9,900 units in 2016.
More than half of last year’s new
supply was located in the
Downtown Los Angeles region,
with 2,000 rentals finalized in the
San Fernando Valley/Tri-Cities
market.
• Metrowide, developers have at
least 22,800 apartments
underway with completions
extending into 2020.
CONSTRUCTION
• Net absorption of 10,500 units
allowed vacancy to hold at 3.8
percent last year, following an
increase of 40 basis points
during the previous period.
• Renter demand slightly
outpaced deliveries in the San
Fernando Valley/Tri-Cities
region, reducing vacancy to 3.4
percent. Net absorption was
historically strong in Downtown
Los Angeles as 5,800 units were
leased.
VACANCY
• Unchanging vacancy and an
influx of new rentals supported a
5.7 percent rise in rent growth,
with the average effective rate
advancing to $2,172 per month
following a 4.3 percent boost last
year.
• Rent growth was most
pronounced in the South
Bay/Long Beach region, where
the average effective rate
climbed by 10 percent to $2,203
per month.
RENTS
LOS ANGELES COUNTY
increase in effective
rents Y-O-Y5.7%basis point change
in vacancy Y-O-Y0units completed
Y-O-Y11,000increase in total
employment Y-O-Y1.4%
* Forecast
5933 LA TIJERA BLVD
4Q17 – 12-Month Period

35
Buyers Targeting Below-Average Pricing Drive Deal Flow
Outlook: Investors seek rentals in
transitioning submarkets and areas of
minimal construction amid a peak in
apartment development. An influx of new
projects over a three-year span could
equate to more Class A acquisition
opportunities for institutional buyers.
Vacancy
Rate
Y-O-Y
BasisPoint
Change
SubmarketEffective
Rent
Y-O-Y%
Change
South Los Angeles 2.1% 0 $1,681 8.7%
Southeast Los Angeles 2.7% -60 $1,664 7.0%
Van Nuys/Northeast San
Fernando Valley2.8% 20 $1,667 6.8%
Palms/Mar Vista 2.9% -20 $2,527 3.3%
Mid-Wilshire 3.4% -20 $2,319 3.4%
North San Gabriel Valley 3.5% 0 $1,638 6.2%
Northridge/Northwest
San Fernando Valley3.5% 30 $1,835 6.6%
Sherman Oaks/North
Hollywood/Encino3.5% -30 $2,236 3.6%
Burbank/Glendale/
Pasadena3.7% -30 $2,335 2.4%
Santa Monica/
Marina del Rey3.7% 0 $3,407 2.5%
Overall Metro 3.8% 0 $2,172 5.7%
Submarket Trends
Lowest Vacancy Rates 4Q17
Sales Trends
LOS ANGELES COUNTY
• Sales velocity slowed by nearly 9 percent year over year as a sizable pool of Los
Angeles County-based buyers pursued a smaller inventory of value-add complexes.
• The average price per unit advanced 4 percent to $256,200 per door, compressing the
metro’s average cap rate by 10 basis points to 4.7 percent.
Sources: CoStar Group, Inc.; Real Capital Analytics
5933 LA TIJERA BLVD
* 2017-2022 **2016 Los Angeles-Long Beach-Anaheim, CA Metropolitan Statistical Area

36
• Developers completed a cycle-
high volume of new units over
the past 12 months following the
delivery of 4,500 rentals during
the previous year. Downtown
Los Angeles recently welcomed
3,800 apartments.
• Construction is underway on
11,300 units throughout the
region including 5,900 rentals in
downtown Los Angeles and
2,900 apartments in Hollywood.
CONSTRUCTION
• Pent-up demand for core-
located units translated to net
absorption of 5,800 units,
holding the region’s vacancy rate
at 4.2 percent.
• Availability in Mid-Wilshire
dipped 20 basis points to 3.4
percent, representing an eighth
straight year of sub-4 percent
vacancy. Downtown Los
Angeles absorbed 3,300 units,
holding local vacancy below 5
percent.
VACANCY
• An influx of luxury units pushed
the region’s average effective
rent to $2,404 per month, an
annual gain of 4.2 percent. A rise
of 1 percent was registered last
year.
• Average rent in Hollywood
climbed 5.7 percent to $2,487
per month. Rent growth was
more subdued in downtown Los
Angeles, where an increase of
2.8 percent pushed the average
rate to $2,455 per month.
RENTS
LOS ANGELES METRO AREA: GREATER DOWNTOWN LOS ANGELES
increase in effective
rents Y-O-Y4.2%basis point change
in vacancy Y-O-Y0units completed
Y-O-Y6,100
• A historically high volume of units are
completed in Downtown Los Angeles
this year following an influx of new
rentals in 2017. Upcoming deliveries
include six downtown high-rises each
comprising more than 500 apartments.
While finalizations are largely
concentrated in the core, both Mid-
Wilshire and Hollywood welcome more
than 1,000 units. Investors remained
confident in the region prior to this
upcoming wave of finalizations, as
absorption kept pace with delivery
volume over the past 12 months amid
continued job growth. Moving forward,
buyer demand for redevelopment and
value-add opportunities adjacent to the
core or near employment hubs should
remain robust, subdued only by a spike
in vacancy.
• Overall deal flow is driven by trades in
Hollywood and Mid-Wilshire, while
transaction activity downtown remains
limited. Primarily a Class C market,
Hollywood offers buyers a wealth of
pre-1970-built assets at low-3 percent
to 4 percent cap rates. Mid-Wilshire
presents investors with similar returns
along with opportunities to acquire
Class A assets.
• Investors requiring higher yields for
Class C properties place a focus on
Westlake and Koreatown, where high-3
to high-4 percent cap rates are readily
available.
Investment Trends
* Forecast
5933 LA TIJERA BLVD
4Q17 – 12-Month Period

37
• Delivery volume over the past
year surpassed the previous 24-
month completion total, as
developers finalized 1,300 units.
At least half these new rentals
are in
Brentwood/Westwood/Beverly
Hills.
• Developers are underway on
3,200 units with completion
dates extending into 2019. Two
sizable projects in Marina del
Rey account for most of this
year’s new supply.
CONSTRUCTION
• Renter demand outpaced
deliveries last year, reducing the
region’s vacancy rate to 3.5
percent. An increase of 10 basis
points was noted during the
previous period.
• A decline of 50 basis points was
registered in
Brentwood/Westwood/Beverly
Hills, compressing vacancy to
3.8 percent. In Palms/Mar Vista,
a reduction of 20 basis points
lowered unit availability to 2.9
percent.
VACANCY
• The average effective rent
climbed by 4.7 percent to $3,124
per month over the last year.
• Santa Monica/Marina del Rey
remains the most expensive
submarket in Los Angeles
County with an average rent of
$3,407 per month. Rate growth
was most noticeable in
Brentwood/Westwood/Beverly
Hills, where an increase of 7.3
percent pushed the average rent
to $3,342 per month.
RENTS
LOS ANGELES METRO AREA: WESTSIDE CITIES
increase in effective
rents Y-O-Y4.7%basis point
decrease in
vacancy Y-O-Y
30units completed
Y-O-Y1,300
• Rising single-family home values in
Silicon Beach and inland Westside
Cities place homeownership out of
reach for many mid- to high-earning
residents, fueling demand for rentals at
a time when some of the region’s most
notable employers are entering new
headquarters. Snap recently moved to
a 300,000-square-foot space in Santa
Monica, while Amazon Studios inked a
lease for the historic Culver Studios. In
Playa Vista, Google will occupy the
former Spruce Goose Hangar. These
relocations point to future job growth
and increased demand for rentals near
employment hubs, heightening investor
competition for available listings.
• Transaction activity was sparse over
the past year, with an average of one
deal closing per month, a sign most
owners are holding in favor of steady
NOI gains. The trades that did occur
primarily involved sub 40-unit
properties that closed at 2.7 percent to
low-3 percent cap rates.
• Pricing that exceeds $500,000 per unit
is commonplace for well-located
properties of various vintages in Santa
Monica and Beverly Hills, where a mix
of local and out-of-state institutions
battle for a limited pool of for-sale
assets. Buyers seeking lower pricing for
pre-1990-built rentals largely target
Culver City.
Investment Trends
* Forecast
5933 LA TIJERA BLVD
4Q17 – 12-Month Period

38
• More than 2,000 rentals were
completed over the past year,
surpassing the 1,400 apartments
finalized during the previous
period. The 507-unit Altana in
Glendale represented the largest
recent delivery.
• Construction is underway on
more than 5,300 units with
completion dates extending into
2020. Roughly 70 percent of
these rentals are in the San
Fernando Valley.
CONSTRUCTION
• On net absorption of nearly
2,200 units, the region’s vacancy
rate held below 4 percent for a
seventh straight year, dipping 10
basis points to 3.4 percent.
• In both Sherman Oaks/North
Hollywood/Encino and
Burbank/Glendale/Pasadena,
the region’s largest submarkets,
availability declined by 30 basis
points, dropping vacancy to 3.5
percent and 3.7 percent,
respectively.
VACANCY
• Tight vacancy throughout the
region warranted steady rent
growth, with the average
effective rent climbing 4.1
percent to $2,045 per month.
• Above-average rent growth
occurred in the affordable
submarkets of Van
Nuys/Northeast San Fernando
Valley and Northridge/Northwest
San Fernando Valley, where
gains of 6.8 percent and 6.6
percent were registered.
RENTS
LOS ANGELES METRO AREA: SAN FERNANDO VALLEY/TRI-CITIES MARKET
increase in effective
rents Y-O-Y4.1%basis point increase
in vacancy Y-O-Y10units completed
Y-O-Y2,020
• The region’s proximity to Downtown
Los Angeles and Westside Cities
coupled with its lower cost of living
make it a desirable spot for families
and millennials seeking moderate
commute times and relatively
affordable rents. Additionally, the
market boasts a diverse economy led
by the IT, construction and logistics
sectors. These factors support renter
demand and tight vacancy moving
forward, influencing more investors to
pursue listings in the Tri-Cities and
near Highway 101.
• Assets of varying quality are readily
available within the region, attracting
a mix of buyers including some out-
of-state capital. Investors focused on
the Tri-Cities are most active in
Pasadena and Glendale, where
properties containing less than 50
units are acquired at low- to high-3
percent yields. Pricing for well-
located apartments can often eclipse
$500,000 per unit in these locales.
• The southern portion of the San
Fernando Valley is a significant driver
of regional deal flow, offering buyers
higher yields and lower pricing than
the Tri-Cities. Listings in North
Hollywood, Van Nuys and Sherman
Oaks routinely net investors mid-3
percent to low-4 percent returns, with
Class A listings often trading for less
than $400,000 per unit. Investor
competition in the Valley is likely to
rise this year prior to the influx of
more than 2,000 apartments in 2019.
Investment Trends
* Forecast
5933 LA TIJERA BLVD
4Q17 – 12-Month Period

39
• After the completion of roughly
2,400 units in 2016, delivery
volume slowed over the past
year as less than 500 units were
finalized.
• Developers are building more
than 2,700 units. Roughly 40
percent of these apartments are
slated for 2018 completion,
including the 375-unit Modera
West LA adjacent to the
Promenade at Howard Hughes
Center.
CONSTRUCTION
• After hovering below 4 percent
for three straight years, the
region’s vacancy rate rose
slightly to 4.1 percent over the
last 12 months.
• Long Beach’s vacancy rate sits
just below 4 percent entering this
year following a 20-basis-point
uptick. South Bay witnessed the
same bump in availability,
pushing the submarket’s
vacancy rate to 4.3 percent.
VACANCY
• Limited new units heightened the
value of existing apartments as
the average effective rent rose
by double digits to $2,203 per
month.
• Rent is becoming less affordable
in Long Beach at $1,932 per
month following a recent 10
percent bump. The South Bay’s
average rent advanced by a
comparable 9.9 percent to
$2,509 per month.
RENTS
LOS ANGELES METRO AREA: SOUTH BAY/LONG BEACH
increase in effective
rents Y-O-Y10.0%basis point increase
in vacancy Y-O-Y20units completed
Y-O-Y480
• Regarded as Los Angeles County’s
aerospace hub, South Bay/Long Beach is
home to many mid- to high-earning
engineers, software professionals and
machinists. Anticipated additions by
Boeing Co., SpaceX and Northrop
Grumman this year should bolster the
region’s stock of well-paid workers and
preserve demand for rentals while home
prices remain out of reach for most
residents. Economic growth and a recent
dearth of apartment deliveries have
allowed vacancy to remain tight
throughout the region, prolonging a span
of strong rent growth. Owners’ ability to
notably boost rents, often following
significant property renovations,
heightens investor demand for value-add
properties prior to the delivery of more
than 2,000 units over the next two years.
• Transactions involving older Class C
assets dominate deal flow. Local and
Orange County-based investors primarily
vie for these properties, many of which
are priced slightly below $10 million.
Downtown Long Beach represents a
locale of interest for opportunistic buyers
targeting low- to mid-4 percent returns.
• Buyers seeking value-add assets priced
below $300,000 per unit focus on the
South Bay cities of Torrance and
Inglewood, where yields can reach the
high-4 percent range.
Investment Trends
* Forecast
5933 LA TIJERA BLVD
4Q17 – 12-Month Period

40
5933 LA TIJERA BLVD
LOS ANGELES METRO AREA
• Fed raises benchmark interest rate, plots path for additional increases. The Federal
Reserve increased the federal funds rate by 25 basis points, lifting the overnight lending rate
to 1.5 percent. While the Fed noted that the inflation outlook had moderated in recent months,
an upgraded economic forecast factoring in recent tax cuts and a rollback in regulation
strengthened growth projections for the next two years. As a result, the Fed has guided
toward two additional rate hikes this year, while setting the stage for as many as four
increases in 2019.
• Lending costs rise alongside Fed rate increase. As the Federal Reserve lifts interest rates,
lenders will face a rising cost of capital, which may lead to higher lending rates for investors.
However, in an effort to compete for loan demand, lenders may also choose to absorb a
portion of the cost increases. While higher borrowing costs may prompt buyers to seek higher
cap rates, the positive economic outlook should provide rent growth that outpaces inflation
over the coming year. As a result, sellers remain committed to higher asking prices, which has
begun to widen an expectation gap as property performance and demand trends remain
positive.
• The capital markets environment continues to be highly competitive. Government
agencies continue to consume the largest share, just slightly over 50 percent, of the
apartment lending market. National and regional banks control approximately a quarter of the
market. Global markets and foreign central banks are keeping pressure down on long-term
interest rates. Pricing resides in the 4 percent realm with maximum leverage of 75 percent.
Portfolio lenders will typically require loan-to-value ratios closer to 70 percent with interest
rates in the high-3 to mid-4 percent range. The passage of tax reform and rising fiscal stimulus
will keep the U.S. economy growing strongly and rental demand will remain high with the
national apartment vacancy rate at 5 percent at the end of 2017.
Include sales $2.5 million and greater
Sources: CoStar Group, Inc.; Real Capital Analytics
Capital Markets

PROPERTY NAME
MARKETING TEAM
5933 LA TIJERA BLVD
DEMOGRAPHICS
Source: © 2017 Experian
Created on June 2018
POPULATION 1 Miles 3 Miles 5 Miles
▪ 2022 Projection
Total Population 29,047 260,014 893,832
▪ 2017 Estimate
Total Population 29,156 261,291 895,573
▪ 2010 Census
Total Population 28,293 252,418 857,775
▪ 2000 Census
Total Population 29,494 256,736 837,577
▪ Daytime Population
2017 Estimate 21,851 284,443 755,543
HOUSEHOLDS 1 Miles 3 Miles 5 Miles
▪ 2022 Projection
Total Households 12,655 101,717 328,088
▪ 2017 Estimate
Total Households 12,593 100,594 321,700
Average (Mean) Household Size 2.33 2.57 2.72
▪ 2010 Census
Total Households 12,108 96,466 305,950
▪ 2000 Census
Total Households 12,695 96,825 298,920
Growth 2015-2020 0.49% 1.12% 1.99%
HOUSING UNITS 1 Miles 3 Miles 5 Miles
▪ Occupied Units
2022 Projection 12,655 101,717 328,088
2017 Estimate 12,788 103,039 330,744
Owner Occupied 5,534 43,465 119,011
Renter Occupied 7,059 57,129 202,690
Vacant 195 2,445 9,044
▪ Persons In Units
2017 Estimate Total Occupied Units 12,593 100,594 321,700
1 Person Units 33.95% 31.49% 29.68%
2 Person Units 30.99% 28.08% 27.28%
3 Person Units 16.53% 16.05% 15.63%
4 Person Units 10.77% 12.21% 12.41%
5 Person Units 4.88% 6.35% 7.10%
6+ Person Units 2.89% 5.83% 7.90%
HOUSEHOLDS BY INCOME 1 Miles 3 Miles 5 Miles
▪ 2017 Estimate
$200,000 or More 5.84% 5.35% 5.72%
$150,000 - $199,000 7.23% 5.64% 4.98%
$100,000 - $149,000 15.24% 12.70% 11.50%
$75,000 - $99,999 14.52% 11.07% 10.76%
$50,000 - $74,999 17.00% 16.46% 16.79%
$35,000 - $49,999 12.37% 12.23% 13.03%
$25,000 - $34,999 9.67% 10.35% 10.47%
$15,000 - $24,999 8.48% 11.55% 11.55%
Under $15,000 9.64% 14.66% 15.20%
Average Household Income $88,034 $78,526 $78,100
Median Household Income $65,558 $51,763 $49,660
Per Capita Income $38,065 $30,374 $28,290
POPULATION PROFILE 1 Miles 3 Miles 5 Miles
▪ Population By Age
2017 Estimate Total Population 29,156 261,291 895,573
Under 20 21.66% 24.22% 25.16%
20 to 34 Years 20.06% 20.93% 24.36%
35 to 39 Years 6.33% 6.49% 7.18%
40 to 49 Years 14.19% 13.99% 13.81%
50 to 64 Years 21.91% 20.08% 17.78%
Age 65+ 15.85% 14.27% 11.72%
Median Age 41.47 38.72 35.32
▪ Population 25+ by Education Level
2017 Estimate Population Age 25+ 21,103 180,778 604,134
Elementary (0-8) 2.73% 7.83% 10.69%
Some High School (9-11) 4.69% 8.56% 9.99%
High School Graduate (12) 14.81% 18.27% 19.58%
Some College (13-15) 28.29% 25.08% 21.11%
Associate Degree Only 8.30% 7.35% 6.16%
Bachelors Degree Only 21.43% 18.78% 18.48%
Graduate Degree 18.80% 12.24% 11.19%
▪ Population by Gender
2017 Estimate Total Population 29,156 261,291 895,573
Male Population 44.71% 46.42% 47.91%
Female Population 55.29% 53.58% 52.09%
41
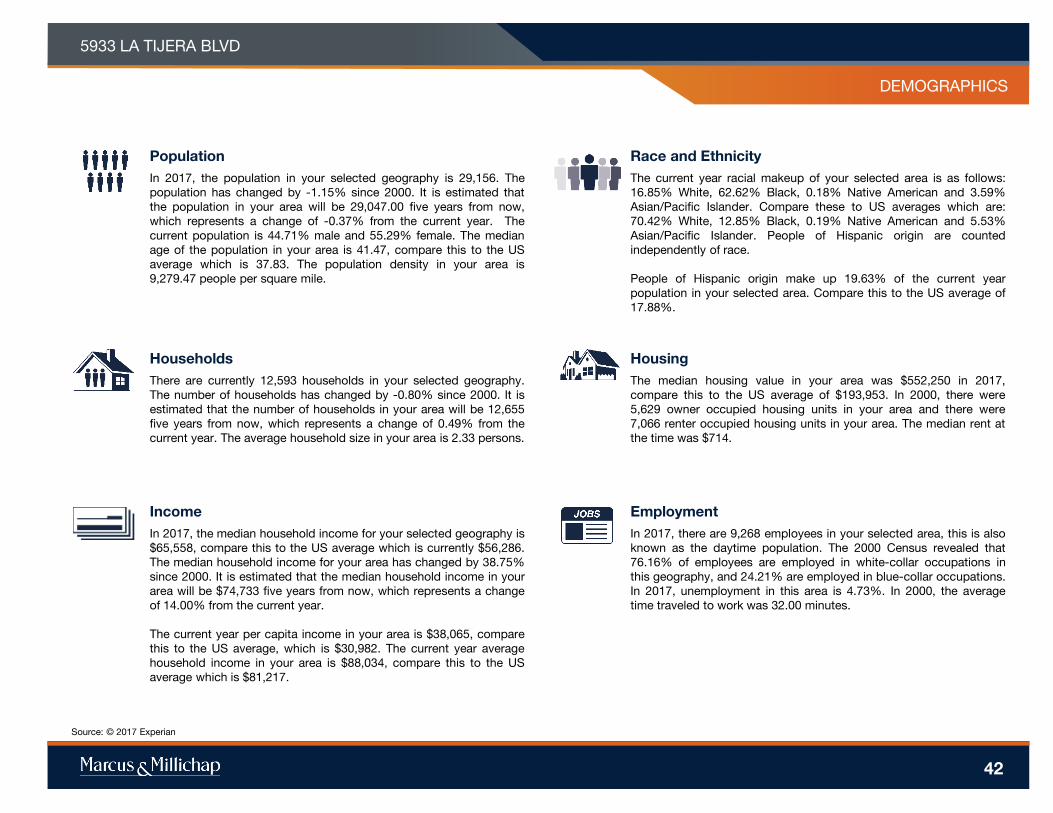
Income
In 2017, the median household income for your selected geography is
$65,558, compare this to the US average which is currently $56,286.
The median household income for your area has changed by 38.75%
since 2000. It is estimated that the median household income in your
area will be $74,733 five years from now, which represents a change
of 14.00% from the current year.
The current year per capita income in your area is $38,065, compare
this to the US average, which is $30,982. The current year average
household income in your area is $88,034, compare this to the US
average which is $81,217.
Population
In 2017, the population in your selected geography is 29,156. The
population has changed by -1.15% since 2000. It is estimated that
the population in your area will be 29,047.00 five years from now,
which represents a change of -0.37% from the current year. The
current population is 44.71% male and 55.29% female. The median
age of the population in your area is 41.47, compare this to the US
average which is 37.83. The population density in your area is
9,279.47 people per square mile.
Households
There are currently 12,593 households in your selected geography.
The number of households has changed by -0.80% since 2000. It is
estimated that the number of households in your area will be 12,655
five years from now, which represents a change of 0.49% from the
current year. The average household size in your area is 2.33 persons.
Employment
In 2017, there are 9,268 employees in your selected area, this is also
known as the daytime population. The 2000 Census revealed that
76.16% of employees are employed in white-collar occupations in
this geography, and 24.21% are employed in blue-collar occupations.
In 2017, unemployment in this area is 4.73%. In 2000, the average
time traveled to work was 32.00 minutes.
Race and Ethnicity
The current year racial makeup of your selected area is as follows:
16.85% White, 62.62% Black, 0.18% Native American and 3.59%
Asian/Pacific Islander. Compare these to US averages which are:
70.42% White, 12.85% Black, 0.19% Native American and 5.53%
Asian/Pacific Islander. People of Hispanic origin are counted
independently of race.
People of Hispanic origin make up 19.63% of the current year
population in your selected area. Compare this to the US average of
17.88%.
PROPERTY NAME
MARKETING TEAM
5933 LA TIJERA BLVD
Housing
The median housing value in your area was $552,250 in 2017,
compare this to the US average of $193,953. In 2000, there were
5,629 owner occupied housing units in your area and there were
7,066 renter occupied housing units in your area. The median rent at
the time was $714.
Source: © 2017 Experian
DEMOGRAPHICS
42

8
5933 LA TIJERA BLVD
DEMOGRAPHICS
43