office of economics
TRANSCRIPT


OFFICE OF ECONOMICS
Robert B. Koopman, Director
The International Economic Review is a regular staff publication of the Office of Economics, U.S. InternationalTrade Commission. The opinions and conclusions contained in this publication are those of the authors and arenot the views of the Commission as a whole or of any individual Commissioner. The IER is produced as partof the Commission’s international trade monitoring program. Its purpose is to keep the Commission informedabout significant developments in international economics and trade and to maintain the Commission’s readinessto carry out its responsibility to provide technical information and advice on international trade matters topolicymakers in the Congress and the Executive Branch. The information and analysis in this series are for thepurpose of this publication only. Nothing in this publication should be construed to indicate how the Commis-sion would find in an investigation conducted under any statutory authority. The IER is available to Govern-ment officials outside the Commission on a request basis. The IER also is available on the Commision’sInternet web site (http://www.usitc.gov/) and through the U.S. Department of Commerce National Trade DataBank (NTDB). Inquiries or comments on information appearing in the IER may be made directly to the author,or to:
Editor, International Economic ReviewCountry and Regional Analysis Division/OE, Room 602U.S. International Trade Commission500 E Street SW., Washington, DC 20436Telephone (202) 205-3255
International Economic ReviewJanuary/February 2001
i
TABLE OF CONTENTSPage
INTERNATIONAL DEVELOPMENTS
Preferential Trade Agreements and the Multilateral Trading SystemDoes the current proliferation of preferential trading agreements (PTAs)encourage or impede evolution toward freer global trade? Does it perhaps evenincrease the likelihood of trade tensions between competing trading blocs?The article presents two models that show how PTAs could affect the multilateraltrading system. One model suggests that global free trade may—or may not—beachieved through PTA expansion, depending on a PTA’s membership policies.The second model suggests that the greater the degree of preference between thePTA and nonmembers, the less likely PTA members will be willing to undertakemultilateral trade liberalization and the more likely nonmembers will be, to supportlarge-scale multilateral liberalization.(Soamiely Andriamananjara, 202-205-3252) 1. . . . . . . . . . . . . . . . . . . . . . . . . . . . . . . . . . . . . . . . . . . . . . . .
ASEAN Free-Trade Area Discussions on including China, Japan, and South KoreaLeaders from the 10 member countries of the Association of Southeast Asian Nations(ASEAN) met in November 2000, and agreed to initiatives aimed at promoting furthereconomic integration in the region. Leaders from China, Japan, and South Korea alsojoined in these discussions, in what has become known as the “ASEAN-plus-three”meetings. Among the agreed proposals was one to study the impact of creating anASEAN free-trade area that would include China, Japan, and South Korea.(Michael Barry, 202-205-3246) 5. . . . . . . . . . . . . . . . . . . . . . . . . . . . . . . . . . . . . . . . . . . . . . . . . . . . . . . . . . .
U.S. Trade Developments(Michael Youssef, 202-205-3269) 8. . . . . . . . . . . . . . . . . . . . . . . . . . . . . . . . . . . . . . . . . . . . . . . . . . . . . . . . .
International Economic Comparisons(Michael Youssef, 202-205-3269) 15. . . . . . . . . . . . . . . . . . . . . . . . . . . . . . . . . . . . . . . . . . . . . . . . . . . . . . . . .
Statistical Tables 18. . . . . . . . . . . . . . . . . . . . . . . . . . . . . . . . . . . . . . . . . . . . . . . . . . . . . . . . . . . . . . . .


International Economic ReviewJanuary/February 2001
1
INTERNATIONAL TRADEDEVELOPMENTS
Preferential Trade Agreements and the MultilateralTrading System
Soamiely Andriamananjara1
Does the current proliferation of preferential trading agreements (PTAs) encourage or impede evolution toward freerglobal trade? Does it perhaps even increase the likelihood of trade tensions between competing trading blocs? Thearticle presents two models that show how PTAs could affect the multilateral trading system. One model suggeststhat global free trade may—or may not—be achieved through PTA expansion, depending on a PTA’s membershippolicies. The second model suggests that the greater the degree of preference between the PTA and nonmembers, theless likely PTA members will be willing to undertake multilateral trade liberalization and the more likely nonmem-bers will be, to support large-scale multilateral liberalization.
As a guiding principle, the multilateral trading sys-tem–organized under the auspices of the World TradeOrganization (WTO)–is based upon the concept of“most-favored-nation” and “nondiscriminatory” treat-ment of all WTO members. During the last two de-cades, however, a growing number of WTO membershave begun to explore alternatives to multilateral tradeliberalization–in the form of preferential trading agree-ments (PTAs).2 By design, these PTAs grant more fa-vorable conditions to trade with other parties to theagreement than to trade with WTO members. AlthoughPTAs clearly depart from the overarching WTO princi-ple of “nondiscrimination,” they are permitted underspecific conditions spelled out in GATT Article XXIV,the so-called 1979 Enabling Clause, and in GATS Ar-ticle V.
PTAs have flourished all over the world. Nearly allof the 140 WTO members are now party to at least
1 The views and conclusions expressed in this article arethose of the author. They are not necessarily the views of theU.S. International Trade Commission as a whole or of anyindividual Commissioner.
2 PTAs can take different forms ranging from free-tradeareas such as the Latin American Free-Trade Area (LAFTA),or the North American Free-Trade Area (NAFTA); to mone-tary unions such as the European Union (EU) and customsunions such as the Mercado Común del Sur (Mercosur).
one agreement.3 Feeling that progress through WTOtalks is too slow, even countries traditionally opposedto the preferential approach are now looking at PTAsas an alternative route to further trade liberalization.For instance, until very recently, Japan has relied com-pletely on the multilateral system, but is now activelypursuing different PTAs with South Korea, Singapore,Mexico, and Canada. South Korea opposed preferentialdeals in the past, but is negotiating now with New Zea-land and Chile as well as Japan.
The “Regionalism versusMultilateralism” DebateThe inherently discriminatory nature of PTAs—in
contrast to multilateral trade liberalization—can beharmful to both member and nonmember nations. Al-though PTAs can create trade, they can also divert
3 As of May 2000, 127 PTAs have been notified to theGATT/WTO and are in force, of which 100 are under GATTArticle XXIV, 17 under the Enabling Clause, and 11 underGATS Article V. See http://www.wto.org/english/tratop_e/re-gion_e/region_e.htm.
International Economic Review January/February 2001
2
trade away from lower cost producers in nonmembercountries.4 Although it is possible to reconcile prefer-ential trading with progress toward freer global trade,policy analysts have identified two big dangers: (1)slower or even blocked multilateral liberalization, and(2) leaving aside of the world’s poorest countries. It istherefore important that policymakers understand therelationships between PTAs and the multilateral tradingsystem. Does preferential trading encourage evolutiontoward globally freer trade, or does it place impedi-ments in its way, and perhaps even increase the likeli-hood of trade wars between competing trading blocs?This forms the nub of the “Regionalism versus Multi-lateralism” debate.5
In parallel to the proliferation of PTAs, the aca-demic literature on the subject has thrived in recentyears, focusing in particular on two dimensions of theissue. One dimension pertains to the dynamics of PTAformation and asks whether PTAs have a tendency toexpand their memberships or to merge, and whetherthis tendency will continue until it culminates in globalfree trade. The second dimension concerns the effectsof the establishment of a PTA on the member and non-member countries’ incentives for multilateral trade lib-eralization.
The remainder of this article presents two modelsthat could be useful in thinking respectively aboutthese two dimensions. One model about membershipdynamics shows that globally free trade may or maynot be achieved through PTA expansion depending onthe PTA membership policies. A second model focus-ing on producers’ influence shows that the greater thedegree of preference in the PTA, the less is the magni-tude of multilateral trade liberalization that PTA mem-bers are willing to undertake and the greater is the non-member countries’ support for large scale multilateralliberalization.
The “Dynamics” of PTAFormation: Stagnant orExpanding Membership?Will PTAs continue to expand and merge until one
super PTA encompassing the entire world is left? Thisprocess has been termed “domino regionalism” by
4 The seminal work on the trade-creation/trade-diversiontradeoff is by Jacob Viner, The Customs Union Issue (Wash-ington DC: Carnegie Endowment for International Peace,1950).
5 For a survey of this literature, Jagdish Bhagwati andArvind Panagariya, “Preferential Trading Areas and Multi-lateralism—Strangers, Friends, or Foes?” in J. Bhagwati andA. Panagariya, eds., The Economics of Preferential TradeAgreement (Washington DC: American Enterprise InstitutePress, 1996).
Richard Baldwin, who uses a political economy modelto show how the expansion of a PTA increases the in-centives of the outsiders to apply for membership.6 Heargues that the most recent wave of regionalism wascaused by two idiosyncratic events (namely, the 1994North American Free-Trade Agreement or NAFTA,and the European Communities’ EC 1992 program),multiplied by a “domino effect.” Baldwin’s resultssuggest a continuous expansion of the PTA that willstop only when all remaining outsiders conclude theywill incur loss of domestic market share and other coststhat more than offset preferential market-access andother gains by becoming members of the PTA. Onedirect implication of his result is that if membershipwere open (i.e. member countries cannot prevent non-members from joining), and if noneconomic factors(e.g. security or sovereignty motives) against seekingentry were absent, regionalism would lead to globalfree trade.
Baldwin’s analysis, though insightful, tells one partof the story but it fails to consider the incentives of thePTA members to keep other countries out of the ar-rangement. After all, the formation and expansion of atrading bloc require a “coincidence of wants” amongall interested parties—members and nonmembers.Both nonmembers must want to join the PTA and, atthe other end, the members must be willing to acceptthem as new members. Therefore, a complete analysisof the issue should also look at the incentives of themembers to accept or reject new members. SoamielyAndriamananjara investigates the effects of the forma-tion or expansion of a PTA on members, nonmembers,and the world as a whole.7 He demonstrates that anexpansion of a regional grouping always unambiguous-ly hurts those left out (even if the external tariffs of thePTA remain constant). He also shows that the effects ofan expansion on a member country are positive forsmall PTAs, but become negative as the PTA member-ship grows more numerous.
Consider an outsider country contemplating entryinto a trading bloc. Its choice is determined by thetrade-off between the costs of opening up one’s ownmarket to more foreign competition and the gains fromobtaining better, preferential access to the PTA prefer-ential market. In the context of Andriamananjara’smodel, it can be shown that the market-access gain is
6 Richard Baldwin, “A Domino Theory of Regional-ism,” NBER Working Paper 4364 (NBER: Cambridge MA,1995).
7 For more details on the model, see Soamiely Andria-mananjara, “On the Size and Number of Regional Integra-tion Arrangements: A Political Economy Model,” WorldBank Policy Research Working Paper 2117 (World Bank:Washington DC, 1999).
International Economic ReviewJanuary/February 2001
3
always larger than the costs of allowing entry, as longas the aggregate size of the PTA market exceeds that ofthe prospective member. Since the larger the PTA, themore an outsider stands to gain from joining, the incen-tive of a nonmember country to apply for membershipincreases with the size of the PTA. Outsider countriesthat initially had little interest in joining the PTA may-become interested when the PTA size becomes largeenough. According to this model, an outsider wouldalways want to apply for membership to an existingbloc. Thus, if the PTA had an open membership policy,it would likely continue to expand until global freetrade is achieved.
Consider next the incentives of the PTA members.If member countries could choose to accept or rejectnew members, the expansion of the bloc is probablynot likely to yield global free trade. In fact, when de-ciding whether to accept or reject a new member, aPTA member compares the gains from getting prefer-ential access to the new member’s market against thelosses of having to share its original preferential mar-ket with the new member—the pie is getting larger butit also has to be shared by more members. For a smallbloc size, the gains are large enough to offset the lossesso that the insiders are willing to accept new members.As the bloc expands, however, the insider’s incentivesfor further PTA expansion decrease and eventually goto zero before the PTA encompasses the entire world.Hence, the expansion of a PTA fails to lead to globalfree trade when PTA membership is selective (i.e. aPTA grants membership to a new member if and onlyif all existing members agree to admit the new mem-ber) because it implies a reduction of the PTA mem-bers’ welfare from the levels that they achieve whenonly a limited number of countries are members.8 Infact, at some point, the members will refuse to admitnew members as “congestion” characteristics of thePTA start to kick in, whereby bureaucratic rigiditiesmay begin to impose additional costs that hamper gainsfrom expanded market access within the PTA.
So far, the process being considered is one inwhich only one PTA forms and expands at any giventime. One can also look at an alternative processwhereby PTAs form more or less symmetrically andmerge simultaneously to yield progressively largerblocs. Will this continue so as to yield one single bloc,which is global free trade? In this model, it can beshown that in this simultaneous bloc expansion, the
8 When the PTA members decide to stop further expan-sion, the rejected countries have an incentive to form theirown PTA. The model demonstrates that the possibility of asecond bloc leads the members of the original bloc to pre-empt the losses associated with the creation and enlargementof a second PTA by choosing a group size larger than the onethey would have chosen if only one bloc were allowed toform. Hence, the threat of regionalism by outsiders formingadditional blocs in competition would encourage previousblocs toward larger PTAs.
regionalism process fails to converge into a single blocexcept when the external tariff happens to be low en-ough. This is an example of open regionalism, basedon low external tariffs, leading to multilateral freetrade. One direct implication of this is that global freetrade can be achieved through bloc expansion if trad-ing blocs lower their external tariffs, as well as lowerand eliminate their own internal tariffs.
PTAs and Incentives forMultilateralism
The second dimension in the “Regionalism versusMultilateralism” debate is to study the effects of theestablishment of the PTA incentives for nondiscrimina-tory trade liberalization. This is particularly relevantgiven that preferential trade policies alter the balanceof gains and losses that members and nonmembers ex-perience from multilateral trade liberalization. In a re-cent contribution to the literature, Pravin Krishna usesa three-country model to show that a PTA between twocountries reduces the incentives to liberalize tariffs re-ciprocally with the third country. He also demonstratesthat, given sufficient trade is diverted away from non-members, multilateral liberalization that was feasiblebefore the PTA formed ceases to be so afterwards.9
One can use a simple model to study the effects ofregional integration on the incentives of PTA membersand nonmembers to undertake multilateral trade liber-alization (i.e. reciprocal trade liberalization amongmembers and nonmembers).10 Consider a world withthree countries, two of which are potential PTA mem-bers. Assume that the producers’ profits play a decisiverole in determining a country’s trade policies; that is,the gains and losses of domestic producers drive deci-sions regarding trade liberalization.11
Consider a representative firm in one of the poten-tial PTA members. In this model, multilateral trade lib-eralization has two opposing effects on the profits ofthat firm: (i) it decreases the profits it makes in thelocal market as reduced domestic protection producesmore competition from abroad, and (ii) it increases theprofits it makes abroad (in both other members’ andnonmembers’ markets) as it gets better access to other
9 When the PTA members decide to stop further expan-sion, the rejected countries have an incentive to form theirown PTA. The model demonstrates that the possibility of asecond bloc leads the members of the original bloc to pre-empt the losses associated with the creation and enlargementof a second PTA by choosing a group size larger than the onethey would have chosen if only one bloc were allowed toform. Hence, the threat of additional competition from asecond bloc would encourage the first bloc to expand.
10 Pravin Krishna, “Regionalism and Multilateralism: APolitical Economy Approach,” Quarterly Journal of Eco-nomics, vol. 113, No. 1 (1998) pp. 227-251.
11 Other political economy models may include consum-er welfare or tariff revenues as determinants of trade policy.
International Economic Review January/February 2001
4
countries’ markets. As the degree of preference rises, itcan be shown that the domestic profit loss from multi-lateral liberalization increases (i.e. the first effect isstrengthened) and the profit gain in the other membercountries decreases (i.e. the second effect is weak-ened).12 This makes the insiders more reluctant to un-dertake larger scale multilateral liberalization: themore preference an insider gives and gets from otherinsiders, the less market access it is willing to give upin exchange for that received from outsiders. The sim-ple model therefore offers an example of how an in-crease in the degree of preference in the PTA can re-duce a PTA member’s willingness to undertake largerscale multilateral trade liberalization.
Consider next the changes in the incentives of arepresentative firm in the excluded or “outsider”coun-try. Multilateral trade liberalization increases the firm’sprofits in the PTA market, but decreases those made inits own domestic market. An increase in the level ofdiscrimination that it faces (that is, the level of prefer-ence between the PTA members and outsiders) leavesdomestic profits unchanged but decreases its profits inthe PTA market due to trade diversion from nonmem-ber to member countries. Given these different effects,it can be analytically shown that the larger the level ofpreference enjoyed by PTA members, the larger is theexcluded country’s support for larger scale multilateralliberalization. Small tariff cuts are not enough to offsetthe excluded country’s profit losses from the trade di-versionary effects of the PTA.
ConclusionThe models summarized and discussed in this ar-
ticle are theoretical in nature, based admittedly on
12 The term “degree of preference” refers here to thedifference between tariffs charged to PTA members andthose charged to nonmembers.
stylized assumptions. In practice, incentives vary fromcountry to country, as well as among different types ofPTAs. Moreover, some PTAs have been established forpolitical reasons that extend beyond solely economicreasons.
Keeping these limitations in mind, the foregoingdiscussion could still be useful in thinking about theincentives of members and nonmembers and the im-plications of the recent proliferation of PTAs on theglobal trading system. Does preferential trading en-courage or impede evolution toward globally freertrade, perhaps even increasing the likelihood of tradetensions or “trade wars” between competing tradingblocs? Although it is beyond the scope of this article tooffer any specific policy implications, a number ofgeneral conclusions emerge from the discussion thatcould be useful in designing future preferential tradeinitiatives.S If a PTA has an open membership policy, it
may well continue to expand until globalfree trade is reached.
S If PTA membership is selective, global freetrade is unlikely to be achieved throughPTA expansion.
S In a world where more than one PTA formssimultaneously, global free trade can bereached through sequential PTA mergers if(and only if) the trading blocs’ external tar-iffs are not too high.
S The greater the degree of preference in thePTA, the lesser is the magnitude of multilat-eral trade liberalization that PTA membersare willing to undertake.
S The greater the degree of preference in thePTA, the greater is the nonmember coun-tries’ support for large scale multilateral lib-eralization.
International Economic ReviewJanuary/February 2001
5
ASEAN Free-Trade Area Discussions on IncludingChina, Japan, and South Korea
Michael Barry1
(202) [email protected]
Leaders from the 10 member countries of the Association of Southeast Asian Nations (ASEAN) met in November2000, and agreed to initiatives aimed at promoting further economic integration in the region. Leaders from China,Japan, and South Korea also joined in these discussions, in what has become known as the “ASEAN-plus-three”meetings. Among the agreed proposals was one to study the impact of creating an ASEAN free-trade area that wouldinclude China, Japan, and South Korea.
Leaders from the 10 member countries of the Asso-ciation of Southeast Asian Nations2 (ASEAN) met inNovember 2000 in Singapore, concluding a number ofinitiatives aimed at promoting further cohesion andeconomic integration of the ASEAN area. In what hasbeen dubbed “ASEAN-plus-three” meetings, leadersfrom China, Japan, and South Korea also attended, andreached agreement on a proposal to study the impact ofincluding China, Japan, and South Korea within theASEAN free-trade area. An overview of the agree-ments discussed at the ASEAN November meetingsfollows.3
Agreements reached among ASEAN members in-cluded an “e-ASEAN” agreement on electronic com-merce, several cooperation initiatives on technical as-sistance and worker training programs, and a plan torelax selected tariff reduction deadlines set under theASEAN Free-Trade Agreement (AFTA). Agreementsreached within the ASEAN-plus-three framework in-cluded accelerating construction of the Trans-Asian
1 The views and conclusions expressed in this article arethose of the author. They are not necessarily the views of theU.S. International Trade Commission as a whole or of anyindividual Commissioner.
2 Members of ASEAN include Brunei Darussalam,Cambodia, Indonesia, Laos, Malaysia, Myanmar (Burma),Philippines, Singapore, Thailand, and Vietnam.
3 Sources consulted for this article include ASEAN Sec-retariat, “The Fourth ASEAN Informal Summit: Press State-ment by the Chairman, Singapore, Nov. 25, 2000,” found atinternet address http://www.asean.or.id/summit/infs4_cps.htm, retrieved Dec. 20, 2000; U.S. Department ofState telegram, message reference No. 03227, “Singapore -ASEAN and ASEAN Plus Three Meet to Discuss RegionalIntegration,” Dec. 1, 2000; BNA, “International Agreements:ASEAN Leaders Pledge to Study Possibility of NortheastAsian Trade Zone,” International Trade Daily, Nov. 28,2000; and “China and ASEAN: The Best Things in Life,”The Economist, Dec. 8, 2000.
Railway between Singapore and the Chinese city of-Kunming, a regional Currency Swap Crisis Pact, a pro-posal to formalize ASEAN-plus-three meetings into amore official “East Asian Summit,” and finally a pro-posal to study the impact of creating an ASEAN free-trade area that would include China, Japan, and SouthKorea.
Asian Integration4
The ASEAN meetings and discussions of possibletrade agreements with China, Japan, and South Koreaare one of several recent moves toward regional in-tegration in Asia. Singapore has reached a free-tradeagreement with New Zealand, and is currently nego-tiating agreements or considering such with Australia,Canada, Japan, Mexico, and the United States. NewZealand has been negotiating with Chile and HongKong. Japan and South Korea have explored the ideaof freer trade with each other as well as with othercountries. Japan’s international trade minister, TakeoHiranuma, states that Japanese companies particularlywant an agreement with Mexico, because their subsid-iaries are facing the elimination of a tariff exemptionon imported parts used in products they export to theUnited States. China is still completing negotiations forWTO accession, but has also suggested interest in re-gional trade agreements. Although the relationship be-tween regional trade agreements and the process ofmultilateral trade liberalization remains a topic of dis-cussion for economists and policymakers (see relatedarticle in this IER), leaders of Asian countries appear to
4 Sources consulted for this section include: ASEANSecretariat, “The ANGKOR Agenda: Report on the High-Level Task Force on the AFTA-CER Free Trade Area,” Sept.2000.

International Economic Review January/February 2001
6
be using both routes to achieve freer trade in theregion.
Agreement to Study anASEAN-plus-three FTAIn this context, ASEAN members met during their
November 2000 meetings with officials from China,Japan, and South Korea to discuss proposals to form afree-trade area (FTA) that would include all 10ASEAN as well as these three additional East Asiancountries. A working party headed by South Korea wasformed to research the impact of forming an ASEAN-plus-three FTA, and leaders agreed to discuss the re-sults of the report at the next ASEAN-plus-three meet-ing, scheduled for 2001 in Brunei. Singapore’s PrimeMinister Goh Chok Tong emphasized that the workinggroup would only study the idea, and that if any type ofFTA were to be implemented, it would be over the longterm. An official from the Chinese Foreign Ministrystated before the meetings that “China stands ready toexplore the possibility of setting up links with theASEAN free-trade area or of creating a free-trade zonebetween China and ASEAN.” For Japan, an importantissue will be the impact any such agreement will haveon its relatively high agricultural trade protection. ForASEAN members, the impact on both regional tradeand investment flows will be a key point of interest.China has been attracting trade and investment awayfrom ASEAN members in recent years. Before the1997 Asian financial crisis, ASEAN’s share of foreigndirect investment attracted to Asia’s developing econo-mies was approximately 30 percent; last year, however,this share had fallen to 15 percent.5
Significant ASEAN exports to China, South Korea,and Japan include machinery and electrical appliances,mineral products, wood and wood articles, and pre-pared foodstuffs. The largest ASEAN imports from Ja-pan include chemicals, plastics, machinery and electri-cal appliances, and motor vehicles. From China,ASEAN imports include machinery and electrical ap-pliances, textiles and apparel, base metals, and metalarticles. From South Korea, ASEAN imports includemachinery and electrical appliances, mineral products,base metals, and metal articles. ASEAN’s largest ex-port partners are the United States, Japan, the EuropeanUnion, and Hong Kong. Its largest import partners areJapan, the United States, the European Union, SouthKorea, and China.
5 “Taiwan Hopes to Strengthen Trade Ties with China,ASEAN Considers China Free Trade Zone,” World Trade,Feb. 2001, p. 18.
Agreements within theASEAN-plus-three
Framework6
China, Japan, South Korea, and ASEAN membersagreed to expand work on the $2.5 billion Trans-Asianrailway, which will stretch from Singapore in the southto Kunming, China in the north. The project is to becompleted by 2006, and has been put under the author-ity of the Mekong Basin Development Program.7 TheMekong program is meant to boost economic develop-ment in Cambodia, Laos, Myanmar, Thailand, andVietnam. Areas of particular focus include the develop-ment of infrastructure in transport, telecommunica-tions, irrigation, and energy. The Mekong program alsoseeks to promote development of trade and investment,and development of the agricultural sector.
Another proposal raised at the Singapore meetingswas to turn the informal ASEAN-plus-three meetingsinto a more formal “East Asian Summit.” Singapore’sPrime Minister Goh Chok Tong said that any suchgrouping in Asia would not be aimed against any par-ticular country, such as the United States. He saidASEAN “needs the United States in East Asia. This isnot an attempt to shut out Washington from East Asia.”
The Currency Swap Crisis Pact announced at theASEAN meetings in Singapore will create a mecha-nism to help avoid future currency crises within theregion. The pact creates a network of bilateral currencyswaps, giving participating ASEAN-plus-three coun-tries experiencing short-term liquidity shortfalls anavenue to borrow funds without having to undertakeIMF austerity measures.8 Central banks in theASEAN-plus-three countries will provide funds to sta-bilize currencies, and will have the ability to borrowfrom each other under re-purchase agreements. Lend-ers will hold various securities from borrowers untilthe latter repays the swap loan. Swaps conducted out-side of an IMF framework will be limited to a durationof 1 year.
6 Sources consulted for this section include: ASEANSecretariat, “ASEAN Trade with Major Trading Partners,”found at Internet address http://www.aseansec.or.id/stat/ex-tra7.htm, retrieved Jan. 15, 2001; Financial Times, “BeijingSignals Trade Pact Interest,” Nov. 22, 2000; Inside USTrade, “China Premier Zhu Hints at FTA Negotiations withASEAN,” Nov. 27, 2000, found at internet addresshttp://www.insidetrade.com, retrieved Dec. 14, 2000; and“Asian Ambition,” Financial Times, Nov. 28, 2000.
7 The Mekong River in Southeast Asia flows approxi-mately 2,600 miles from Southeast China to the South ChinaSea, creating a vast delta in southern Vietnam known as theMekong Basin, which is a major rice-producing region.
8 The IMF has several programs that lend money tocountries with liquidity problems. Some of the lending issubject to austerity measures, in which the borrowing coun-try must, for example, improve its fiscal balance or tightenits monetary policy.
International Economic ReviewJanuary/February 2001
7
Agreements withinASEAN9
During the ASEAN meetings, an emphasis was puton bridging a perceived gap between the more devel-oped ASEAN members (Brunei, Indonesia, Malaysia,the Philippines, Singapore, and Thailand) andASEAN’s four newer members (Cambodia, Laos, My-anmar, and Vietnam). The e-ASEAN framework agree-ment on electronic commerce agreed at the these meet-ings aims to narrow the divide between higher andlower tech ASEAN countries. Specific goals includeincreasing Internet connectivity, greater incorporationof local materials (so-called local content), further de-velopment of e-commerce, and the liberalization oftrade in information and communications technology.In addition, the e-ASEAN framework calls for furtherdevelopment of human resources and worker training,and a proposal to expand “e-governance,” which wouldput government information on-line for public access.Several measures discussed were aimed at increasingtrust and confidence in the Internet, including the es-tablishment of a system of mutual recognition of digi-tal signatures, systems to guarantee secure electronictransactions, protection of intellectual property rights,protection of personal data and consumer privacy, andmechanisms to aid the settlement of disputes. Finally,under the e-ASEAN agreement, import duties and non-tariff barriers to intra-ASEAN trade in computer-re-lated goods are to be phased out over time. The phase-outs will begin in January 2003 for the six originalASEAN members, and in 2008 for the four newermembers.
A fourth proposal discussed at the meetings wasthe creation of an Asian information technology (IT)belt, which would electronically link the higher techcities of the ASEAN-plus-three grouping, such asBangkok, Kuala Lumpur, Seoul, Shanghai, Singapore,and Tokyo. To achieve this goal, Japan and China both
9 Sources consulted for this section include: DonghyunPark, “The Prospects for Further Economic Integration inASEAN,” Journal of Economic Integration, vol. 14, No. 3,Sept. 1999.
pledged significant funding, aimed at helping ASEAN-plus-three countries improve their IT infrastructure. Ja-pan also announced that it will host a major IT confer-ence for Asia in 2001.
In a separate agreement, ASEAN members an-nounced the “Initiative for ASEAN Integration” (IAI)which includes several measures aimed at worker train-ing, technical assistance, and increasing human capitalin Asia. Under a 5-year technical assistance program,Singapore agreed to open special training institutes inCambodia, Laos, Myanmar, and Vietnam. These insti-tutes will provide vocational training to researchers inthe fields of trade development, export promotion, hu-man resource development, agriculture and food busi-ness, technical training, and tourism. Courses will in-clude information technology “Train-the-Trainers”seminars to improve IT skills in the four countries. Sin-gapore also agreed to increase its annual grant of schol-arships from 30 to 60 per year. The full-time under-graduate scholarships are for citizens of ASEAN coun-tries to study at either the National University of Singa-pore (NUS) or Nanyang Technical University of Singa-pore (NTS). Finally, the IAI included a program tosponsor youth exchange programs at primary (“youth”)and secondary school levels, aimed as well at promot-ing regional integration.
Finally, ASEAN members agreed to relax tariff re-duction deadlines that had been set under the ASEANFree-Trade Agreement (AFTA). AFTA was launched atthe Fourth ASEAN Summit in Singapore in January1992, when member countries adopted the CommonEffective Preferential Tariff (CEPT) to give ASEANmembers uniform preferential tariff treatment in intra-ASEAN trade. The original time table had been to re-duce tariff rates to a range of 0 to 5-percent duty on 85percent of products traded within the ASEAN regionby the year 2000, on 90 percent of products by 2001,and on all products by 2002. To be eligible, goods weresubject to a 40-percent ASEAN local-content rule. Therecent agreement to delay these tariff reductions wasprompted by the Malaysian government, which soughtto retain its existing tariffs on automobiles.

International Economic ReviewJanuary/February 2001
9
U.S. TRADE DEVELOPMENTSMichael Youseff1
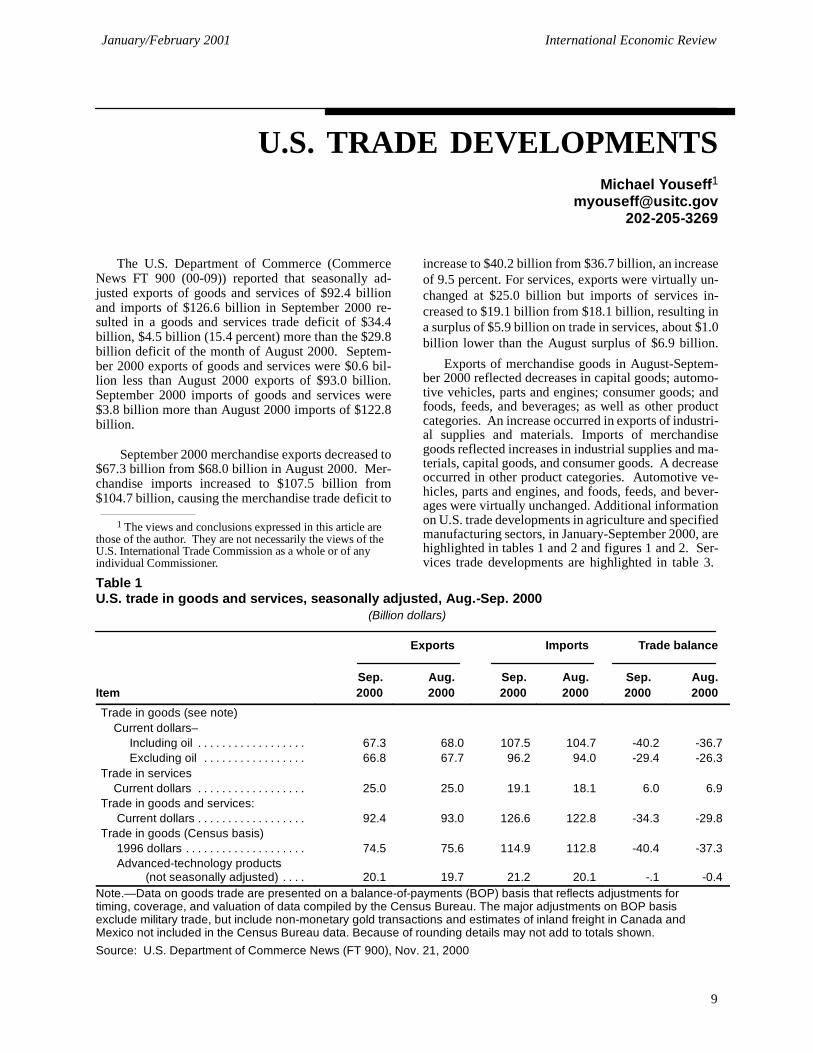
The U.S. Department of Commerce (CommerceNews FT 900 (00-09)) reported that seasonally ad-justed exports of goods and services of $92.4 billionand imports of $126.6 billion in September 2000 re-sulted in a goods and services trade deficit of $34.4billion, $4.5 billion (15.4 percent) more than the $29.8billion deficit of the month of August 2000. Septem-ber 2000 exports of goods and services were $0.6 bil-lion less than August 2000 exports of $93.0 billion.September 2000 imports of goods and services were$3.8 billion more than August 2000 imports of $122.8billion.
September 2000 merchandise exports decreased to$67.3 billion from $68.0 billion in August 2000. Mer-chandise imports increased to $107.5 billion from$104.7 billion, causing the merchandise trade deficit to
1 The views and conclusions expressed in this article arethose of the author. They are not necessarily the views of theU.S. International Trade Commission as a whole or of anyindividual Commissioner.
increase to $40.2 billion from $36.7 billion, an increaseof 9.5 percent. For services, exports were virtually un-changed at $25.0 billion but imports of services in-creased to $19.1 billion from $18.1 billion, resulting ina surplus of $5.9 billion on trade in services, about $1.0billion lower than the August surplus of $6.9 billion.
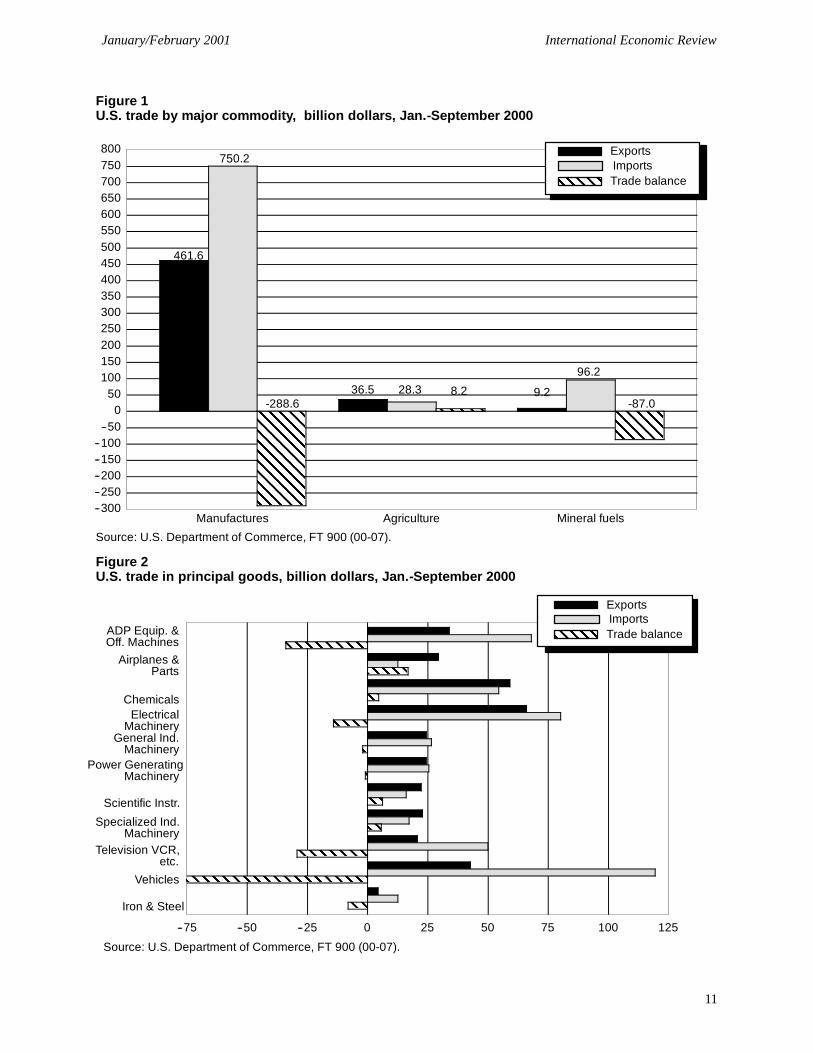
Exports of merchandise goods in August-Septem-ber 2000 reflected decreases in capital goods; automo-tive vehicles, parts and engines; consumer goods; andfoods, feeds, and beverages; as well as other productcategories. An increase occurred in exports of industri-al supplies and materials. Imports of merchandisegoods reflected increases in industrial supplies and ma-terials, capital goods, and consumer goods. A decreaseoccurred in other product categories. Automotive ve-hicles, parts and engines, and foods, feeds, and bever-ages were virtually unchanged. Additional informationon U.S. trade developments in agriculture and specifiedmanufacturing sectors, in January-September 2000, arehighlighted in tables 1 and 2 and figures 1 and 2. Ser-vices trade developments are highlighted in table 3.
Table 1U.S. trade in goods and services, seasonally adjusted, Aug.-Sep. 2000
(Billion dollars)
Exports Imports Trade balance
Sep. Aug. Sep. Aug. Sep. Aug.Item 2000 2000 2000 2000 2000 2000
Trade in goods (see note)Current dollars–
Including oil . . . . . . . . . . . . . . . . . . 67.3 68.0 107.5 104.7 -40.2 -36.7Excluding oil . . . . . . . . . . . . . . . . . 66.8 67.7 96.2 94.0 -29.4 -26.3
Trade in servicesCurrent dollars . . . . . . . . . . . . . . . . . . 25.0 25.0 19.1 18.1 6.0 6.9
Trade in goods and services:Current dollars . . . . . . . . . . . . . . . . . . 92.4 93.0 126.6 122.8 -34.3 -29.8
Trade in goods (Census basis)1996 dollars . . . . . . . . . . . . . . . . . . . . 74.5 75.6 114.9 112.8 -40.4 -37.3Advanced-technology products
(not seasonally adjusted) . . . . 20.1 19.7 21.2 20.1 -.1 -0.4Note.—Data on goods trade are presented on a balance-of-payments (BOP) basis that reflects adjustments fortiming, coverage, and valuation of data compiled by the Census Bureau. The major adjustments on BOP basisexclude military trade, but include non-monetary gold transactions and estimates of inland freight in Canada andMexico not included in the Census Bureau data. Because of rounding details may not add to totals shown.Source: U.S. Department of Commerce News (FT 900), Nov. 21, 2000
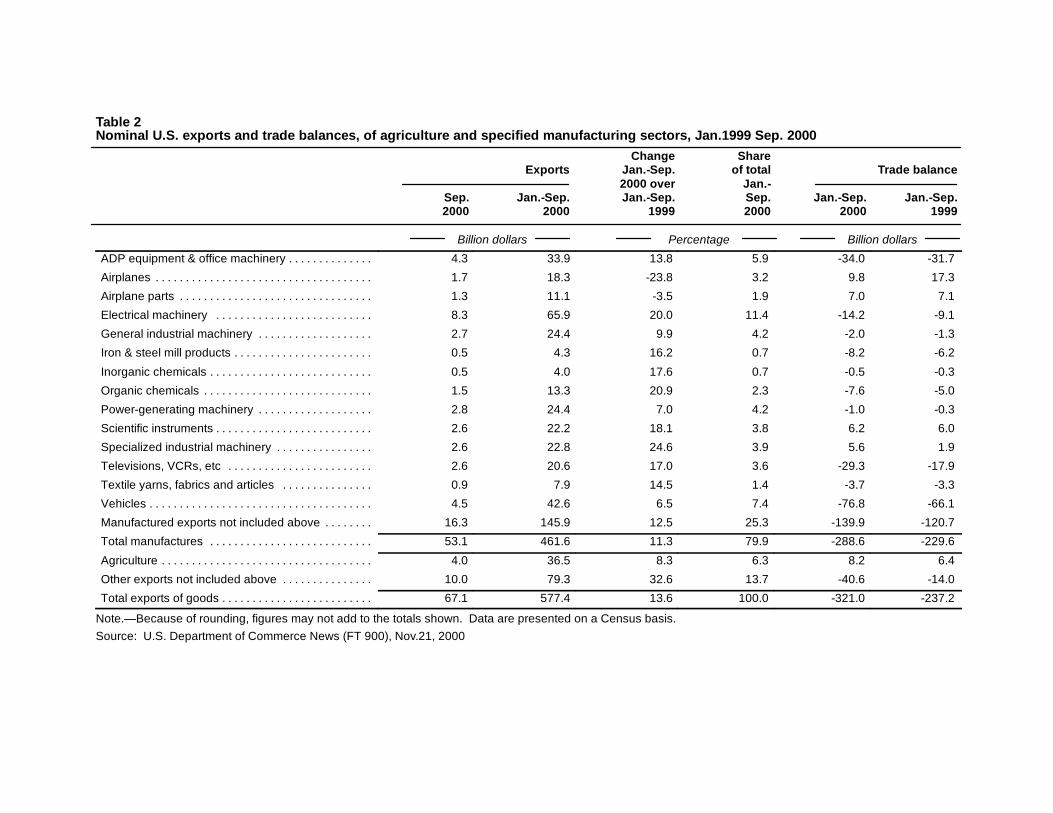
Table 2Nominal U.S. exports and trade balances, of agriculture and specified manufacturing sectors, Jan.1999 Sep. 2000
Change ShareExports Jan.-Sep. of total Trade balance
2000 over Jan.-Sep. Jan.-Sep. Jan.-Sep. Sep. Jan.-Sep. Jan.-Sep.2000 2000 1999 2000 2000 1999
Billion dollars Percentage Billion dollars
ADP equipment & office machinery . . . . . . . . . . . . . . 4.3 33.9 13.8 5.9 -34.0 -31.7
Airplanes . . . . . . . . . . . . . . . . . . . . . . . . . . . . . . . . . . . . 1.7 18.3 -23.8 3.2 9.8 17.3
Airplane parts . . . . . . . . . . . . . . . . . . . . . . . . . . . . . . . . 1.3 11.1 -3.5 1.9 7.0 7.1
Electrical machinery . . . . . . . . . . . . . . . . . . . . . . . . . . 8.3 65.9 20.0 11.4 -14.2 -9.1
General industrial machinery . . . . . . . . . . . . . . . . . . . 2.7 24.4 9.9 4.2 -2.0 -1.3
Iron & steel mill products . . . . . . . . . . . . . . . . . . . . . . . 0.5 4.3 16.2 0.7 -8.2 -6.2
Inorganic chemicals . . . . . . . . . . . . . . . . . . . . . . . . . . . 0.5 4.0 17.6 0.7 -0.5 -0.3
Organic chemicals . . . . . . . . . . . . . . . . . . . . . . . . . . . . 1.5 13.3 20.9 2.3 -7.6 -5.0
Power-generating machinery . . . . . . . . . . . . . . . . . . . 2.8 24.4 7.0 4.2 -1.0 -0.3
Scientific instruments . . . . . . . . . . . . . . . . . . . . . . . . . . 2.6 22.2 18.1 3.8 6.2 6.0
Specialized industrial machinery . . . . . . . . . . . . . . . . 2.6 22.8 24.6 3.9 5.6 1.9
Televisions, VCRs, etc . . . . . . . . . . . . . . . . . . . . . . . . 2.6 20.6 17.0 3.6 -29.3 -17.9
Textile yarns, fabrics and articles . . . . . . . . . . . . . . . 0.9 7.9 14.5 1.4 -3.7 -3.3
Vehicles . . . . . . . . . . . . . . . . . . . . . . . . . . . . . . . . . . . . . 4.5 42.6 6.5 7.4 -76.8 -66.1
Manufactured exports not included above . . . . . . . . 16.3 145.9 12.5 25.3 -139.9 -120.7
Total manufactures . . . . . . . . . . . . . . . . . . . . . . . . . . . 53.1 461.6 11.3 79.9 -288.6 -229.6
Agriculture . . . . . . . . . . . . . . . . . . . . . . . . . . . . . . . . . . . 4.0 36.5 8.3 6.3 8.2 6.4
Other exports not included above . . . . . . . . . . . . . . . 10.0 79.3 32.6 13.7 -40.6 -14.0
Total exports of goods . . . . . . . . . . . . . . . . . . . . . . . . . 67.1 577.4 13.6 100.0 -321.0 -237.2
Note.—Because of rounding, figures may not add to the totals shown. Data are presented on a Census basis.Source: U.S. Department of Commerce News (FT 900), Nov.21, 2000
International Economic ReviewJanuary/February 2001
11
Figure 1U.S. trade by major commodity, billion dollars, Jan.-September 2000
--300--250--200--150--100
--500
50100150200250300350400450500550600650700750800
Manufactures Agriculture Mineral fuels
ImportsExports
Trade balance
461.6
750.2
36.5 28.3 8.2 9.2
96.2
-87.0-288.6
Source: U.S. Department of Commerce, FT 900 (00-07).
Figure 2U.S. trade in principal goods, billion dollars, Jan.-September 2000
--75 --50 --25 0 25 50 75 100 125
ADP Equip. &
Airplanes &
ChemicalsElectrical
Power Generating
General Ind.
Specialized Ind.
Vehicles
ImportsExports
Trade balance
Machinery
Machinery
Scientific Instr.
Iron & Steel
Machinery
Parts
Off. Machines
Machinery
Source: U.S. Department of Commerce, FT 900 (00-07).
Television VCR,etc.
International Economic Review January/February 2001
12
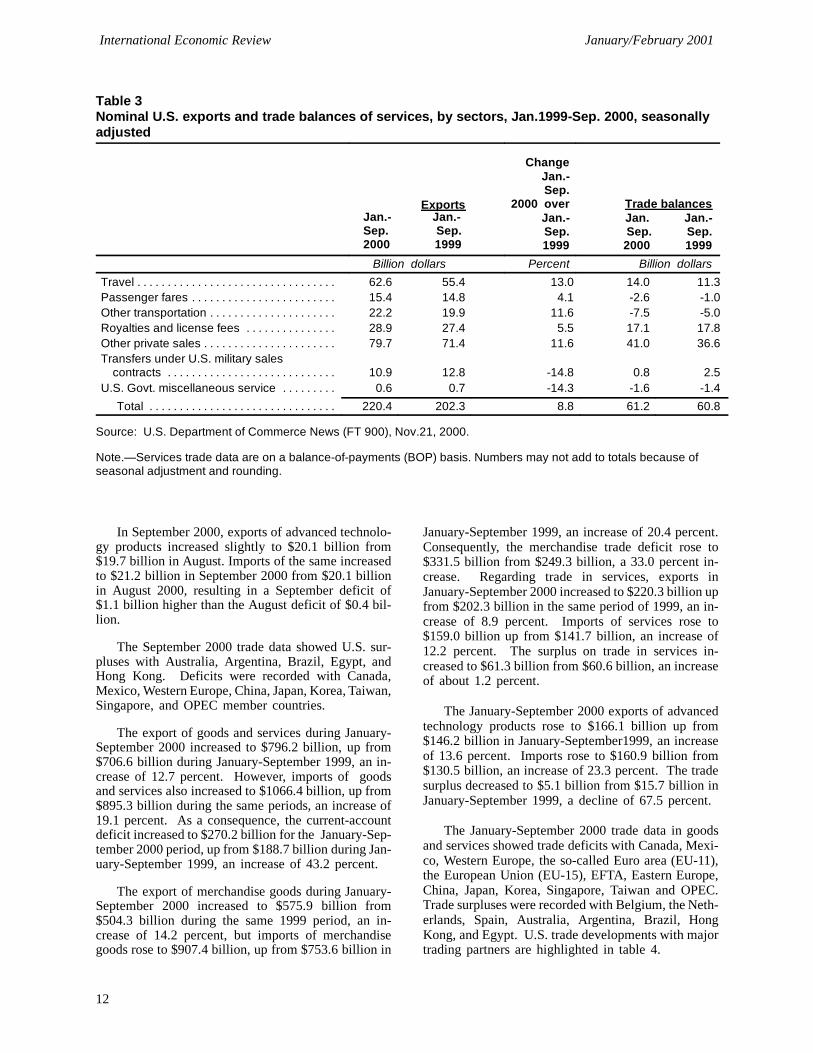
Table 3Nominal U.S. exports and trade balances of services, by sectors, Jan.1999-Sep. 2000, seasonallyadjusted
ExportsJan.- Jan.-Sep. Sep.2000 1999
ChangeJan.-Sep.
2000 overJan.-Sep.1999
Trade balancesJan. Jan.-Sep. Sep.2000 1999
Billion dollars Percent Billion dollars
Travel . . . . . . . . . . . . . . . . . . . . . . . . . . . . . . . . . 62.6 55.4 13.0 14.0 11.3Passenger fares . . . . . . . . . . . . . . . . . . . . . . . . 15.4 14.8 4.1 -2.6 -1.0Other transportation . . . . . . . . . . . . . . . . . . . . . 22.2 19.9 11.6 -7.5 -5.0Royalties and license fees . . . . . . . . . . . . . . . 28.9 27.4 5.5 17.1 17.8Other private sales . . . . . . . . . . . . . . . . . . . . . . 79.7 71.4 11.6 41.0 36.6Transfers under U.S. military sales
contracts . . . . . . . . . . . . . . . . . . . . . . . . . . . . 10.9 12.8 -14.8 0.8 2.5U.S. Govt. miscellaneous service . . . . . . . . . 0.6 0.7 -14.3 -1.6 -1.4
Total . . . . . . . . . . . . . . . . . . . . . . . . . . . . . . . 220.4 202.3 8.8 61.2 60.8
Source: U.S. Department of Commerce News (FT 900), Nov.21, 2000.
Note.—Services trade data are on a balance-of-payments (BOP) basis. Numbers may not add to totals because ofseasonal adjustment and rounding.
In September 2000, exports of advanced technolo-gy products increased slightly to $20.1 billion from$19.7 billion in August. Imports of the same increasedto $21.2 billion in September 2000 from $20.1 billionin August 2000, resulting in a September deficit of$1.1 billion higher than the August deficit of $0.4 bil-lion.
The September 2000 trade data showed U.S. sur-pluses with Australia, Argentina, Brazil, Egypt, andHong Kong. Deficits were recorded with Canada,Mexico, Western Europe, China, Japan, Korea, Taiwan,Singapore, and OPEC member countries.
The export of goods and services during January-September 2000 increased to $796.2 billion, up from$706.6 billion during January-September 1999, an in-crease of 12.7 percent. However, imports of goodsand services also increased to $1066.4 billion, up from$895.3 billion during the same periods, an increase of19.1 percent. As a consequence, the current-accountdeficit increased to $270.2 billion for the January-Sep-tember 2000 period, up from $188.7 billion during Jan-uary-September 1999, an increase of 43.2 percent.
The export of merchandise goods during January-September 2000 increased to $575.9 billion from$504.3 billion during the same 1999 period, an in-crease of 14.2 percent, but imports of merchandisegoods rose to $907.4 billion, up from $753.6 billion in
January-September 1999, an increase of 20.4 percent.Consequently, the merchandise trade deficit rose to$331.5 billion from $249.3 billion, a 33.0 percent in-crease. Regarding trade in services, exports inJanuary-September 2000 increased to $220.3 billion upfrom $202.3 billion in the same period of 1999, an in-crease of 8.9 percent. Imports of services rose to$159.0 billion up from $141.7 billion, an increase of12.2 percent. The surplus on trade in services in-creased to $61.3 billion from $60.6 billion, an increaseof about 1.2 percent.
The January-September 2000 exports of advancedtechnology products rose to $166.1 billion up from$146.2 billion in January-September1999, an increaseof 13.6 percent. Imports rose to $160.9 billion from$130.5 billion, an increase of 23.3 percent. The tradesurplus decreased to $5.1 billion from $15.7 billion inJanuary-September 1999, a decline of 67.5 percent.
The January-September 2000 trade data in goodsand services showed trade deficits with Canada, Mexi-co, Western Europe, the so-called Euro area (EU-11),the European Union (EU-15), EFTA, Eastern Europe,China, Japan, Korea, Singapore, Taiwan and OPEC.Trade surpluses were recorded with Belgium, the Neth-erlands, Spain, Australia, Argentina, Brazil, HongKong, and Egypt. U.S. trade developments with majortrading partners are highlighted in table 4.

Table 4U.S. exports and imports of goods with major trading partners, Jan. 1999-Sep. 2000
(Billion dollars)
Exports Imports Trade balances
Jan.- Jan. Jan.- Jan.- Jan.- Jan.-Sep. Sep. Sep. Sep. Sep. Sep. Sep. Sep.
Country/areas 2000 2000 1999 2000 2000 1999 2000 1999
Total . . . . . . . . . . . . . . . . . . . . . . . . . . . 67.1 577.4 508.1 106.7 898.4 745.3 -321.0 -237.2
North America 24.4 216.8 184.5 31.7 271.4 226.0 -54.5 -41.5
Canada . . . . . . . . . . . . . . . . . . . . . . 14.6 134.4 122.8 19.3 170.3 145.7 -35.9 -23.0Mexico . . . . . . . . . . . . . . . . . . . . . . 9.7 82.5 61.7 12.4 101.1 80.3 -18.6 -18.6
Western Europe . . . . . . . . . . . . . . . . . 15.4 132.7 121.9 19.8 177.2 154.8 - 44.5 -32.8
Euro Area 10.0 84.6 78.0 13.8 120.2 105.2 -35.6 -27.2
European Union (EU-15) . . . . . . . 14.2 120.3 112.1 18.1 161.7 142.1 -41.4 -30.0
France . . . . . . . . . . . . . . . . . . . . 1.6 14.5 13.9 2.3 21.4 18.9 -6.9 -4.9Germany . . . . . . . . . . . . . . . . . . 2.4 21.6 19.7 4.8 43.7 40.1 -22.2 -20.4Italy . . . . . . . . . . . . . . . . . . . . . . 1.4 8.2 7.2 2.3 18.8 16.5 -10.6 -9.3Netherlands . . . . . . . . . . . . . . . 1.8 15.8 14.2 0.8 7.2 5.9 8.6 8.3United Kingdom . . . . . . . . . . . 3.5 30.2 28.9 3.3 32.0 28.7 -1.8 0.2Other EU . . . . . . . . . . . . . . . . . 0.9 8.6 8.4 2.1 15.4 11.5 -6.8 -3.0
EFTA1 . . . . . . . . . . . . . . . . . . . . . . . . . 0.9 8.8 6.8 1.4 12.3 10.1 -3.5 -3.3
FSR/Eastern Europe . . . . . . . . . . . . . 0.5 4.5 4.4 1.8 12.3 8.4 -7.8 -4.0
Russia . . . . . . . . . . . . . . . . . . . . . . . 0.2 1.7 1.5 0.8 5.9 4.1 -4.2 -2.7Pacific Rim Countries . . . . . . . . . . . . 17.6 150.3 127.2 37.7 307.3 261.6 -157.0 -134.4
Australia . . . . . . . . . . . . . . . . . . . . . 1.0 9.4 8.4 0.6 4.8 3.9 4.7 4.4China . . . . . . . . . . . . . . . . . . . . . . . . 1.4 11.7 9.9 10.1 72.8 59.4 - 61.1 - 49.4Japan . . . . . . . . . . . . . . . . . . . . . . . . 5.5 47.9 42.1 11.6 108.0 95.0 - 60.1 - 52.8NICs2 . . . . . . . . . . . . . . . . . . . . . . . . 7.5 63.1 51.9 10.3 82.2 69.0 -19.1 -17.1
Latin America . . . . . . . . . . . . . . . . . . . 5.1 43.4 40.6 6.2 54.5 42.3 -11.1 -1.7
Argentina . . . . . . . . . . . . . . . . . . . . . 0.4 3.5 3.6 0.3 2.3 1.9 1.2 1.7Brazil . . . . . . . . . . . . . . . . . . . . . . . . 1.4 11.1 9.6 1.2 10.6 8.3 0.5 1.3
OPEC . . . . . . . . . . . . . . . . . . . . . . . . . 1.9 13.9 14.2 6.1 49.3 29.3 -35.4 -15.2
Other Countries . . . . . . . . . . . . . . . . . 2.9 22.1 20.7 5.9 48.2 37.9 -26.0 -17.1
Egypt . . . . . . . . . . . . . . . . . . . . . . . . 0.3 2.5 2.2 0.1 0.7 0.5 1.9 1.8South Africa . . . . . . . . . . . . . . . . . . 0.4 2.3 1.9 0.4 3.1 2.3 -0.9 -0.4Other . . . . . . . . . . . . . . . . . . . . . . . . 2.2 17.4 16.6 5.4 44.4 35.1 - 27.0 -18.5
1 EFTA includes Iceland, Liechtenstein, Norway, and Switzerland.2 The newly industrializing countries (NICs) include Hong Kong, the Republic of Korea, Singapore, and Taiwan. FSR = Former Soviet Republics.
Note.—Country/area figures may not add to the totals shown because of rounding. Exports of certain grains, oilseeds, and satellites are excluded from country/area exports but included in total export table. Also some countries are included in more than one area. Data are presented on a Census Bureau basis.Source: U.S. Department of Commerce News (FT 900), Nov.21, 2000
International Economic Review January/February 2001
14
World TradeAccording to the most current trade statistics re-
leased recently by the World Trade Organization(WTO), world merchandise trade during 2000 is likelyto record one of the highest growth rates of the pastdecade, reaching around 10 percent or twice the raterecorded in 1999.2 The report also released the firstcomprehensive, detailed overview of goods and ser-vices trade in 1999, with data arrayed by region, coun-try, and product category. Highlights from the reportfollow.
World economic growth accelerated during 1999,with recovery in Asia after the 1997-98 financial crisisand continued strong economic growth in the UnitedStates stimulating world trade growth in particular. Al-though world merchandise exports in 1999 remainedthe same as in 1998 on average—about 5 percent involume terms—the rate of growth in world trade accel-erated markedly in the second half of 1999 and moreso into 2000. With economic activity outpacing mostprojections during the first half of 2000, world mer-chandise exports for 2000 are expected to exceed 10percent on average, one of highest growth rates forworld trade recorded over the past decade. The reportsuggests a somewhat slower pace for world tradegrowth in 2001 to around 7 percent.
In value terms, world trade growth in 1999 wascomposed of world merchandise exports, which roseby 3.5 percent to $5.47 trillion, whereas world com-mercial services exports rose more modestly, by 1.5percent to $1.35 trillion. The weakness of the Euroagainst the U.S. dollar led to decreased exports of com-mercial services from Western Europe, which typicallyaccount for nearly half of total services exports.
Growth in world trade varied widely by geographicregion. North America and Asia accounted for strongimport and export growth, whereas Africa and LatinAmerica recorded contractions in merchandise and ser-vices imports. Nonetheless, merchandise exports fromAfrica and Latin America registered significantgrowth. Merchandise exports from developing coun-tries grew by 9 percent during 1999. This increasedthe developing countries’ share of world exports toover 27 percent, with increased manufactures exportsas well as higher fuel prices and trade playing a majorrole. Over the past decade, developing country exportsof manufactures have increased their world share from17 percent of world manufactures trade to 25 percent.
Trade among regional trading agreements also var-ied during 1999. Intra-NAFTA imports expanded by11 percent, approximately the average rate worldwide,
2 WTO, International Trade Statistics 2000, Nov. 30,2000 (WTO: Geneva, 2000).
but NAFTA exports to other regions declined. The re-cession in Mercosur countries led to a contraction inin-traregional trade of 25 percent. Intra-EU trade laggedbehind imports from outside the EU. Only the ASEANgrouping recorded an expansion of intraregional trade,somewhat more than exports outside the region.
International capital flows, foreign direct invest-ment in particular, were a major determinant of inter-national trade. Large capital inflows into the UnitedStates sustained the large increase of U.S. imports,which reached the unprecedented level of 18.5 percentof world merchandise imports.
In 1999, growth of major product categories formerchandise trade ranged from an increase for fuels ofnearly 20 percent, to a decrease for iron and steel prod-ucts of more than 10 percent. World exports of officeand telecom equipment rose by 10 percent to nearly$770 billion, with a sharp rise in semiconductor salesand mobile phones contributing to this dynamicgrowth. Exports of automotive products rose by 5 per-cent, with suppliers from Mexico, Korea, the CzechRepublic, Hungary, Poland, and other less typical ex-porters supplanting the large traditional producers.Weak Western European trade, in particular intraregio-nal EU trade, was largely responsible for the decline inworld textile exports and the near stagnation in cloth-ing trade. In marked contrast, however, intraregionalAsian trade in clothing recovered by 8 percent, andclothing exports from Latin America to North Americarose by 15 percent. One of the major features of worldclothing trade has been clothing exports from LatinAmerica to North America and from the East Europeantransition economies to Western European marketshave begun to surpass clothing exports of developingcountries in Asia to these markets.
World exports of commercial services in 1999 ex-panded by 1.5 percent to $1.35 trillion, althoughgrowth in trade in services varied more strongly on aregional basis. Transport services were strong in theUnited States in particular, related to robust merchan-dise trade. Travel services were also strong in Asia,recovering from their steep decline following the1997-98 financial crisis. Commercial services trade inWestern Europe and Latin America were weaker thanin North America and Asia. Services trade in Africagrew by 8.5 percent, the strongest increase of all re-gions during 1999, attributed largely to a recovery inEgyptian tourist earnings.
Trade by Region
North AmericaNorth America continued as the major engine of
world trade expansion during 1999. North America,with roughly a one-fifth share of world imports, in-
International Economic ReviewJanuary/February 2001
15
creased its merchandise imports to $128 billion and itscommercial services imports to $16 billion, accountingfor more than half of the worldwide expansion ingoods and services trade in 1999. North AmericanGDP growth exceeded 4 percent for the third year in arow, contributing to a rise in merchandise imports ofover 10 percent annually while merchandise exports re-mained closer to 6 percent annually. North Americanimports of services rose faster than exports of services.As the major factor in the North American economy,the U.S. merchandise trade deficit continued to widenin this event, the surplus on trade in services continuedto erode, and the U.S. current-account deficit amountedto 3.7 percent of GDP, which exceeded the previouspeak set in 1987.
Latin AmericaLatin America’s GDP, which expanded by 3.5 per-
cent annually between 1990 and 1997, slowed in 1998and stagnated in 1999. Merchandise imports and com-mercial services declined for the first time in the1990s, contrasting sharply with the dynamic growth ofa decade earlier. Within Latin America, a sharp differ-
ence regarding output and trade is salient betweenMexico on the one hand, and all other Latin Americancountries on the other hand, owing principally to Mexi-co’s deep integration into the North American tradingsystem through NAFTA. In 1999, Mexico accountedfor about 45 percent of the region’s merchandise trade,and recorded double-digit growth in both merchandiseexports and imports. All other Latin American coun-tries reported a steep fall in merchandise imports aswell as stagnation in the value of merchandise exports.Brazil accounted for another 15 percent of the regionalmerchandise trade, whereas Mexico, Brazil, and thethree other top traders in the region account for morethan 75 percent of merchandise exports and imports.
Western EuropeThe slowdown in Western Europe’s GDP growth in
1999 is reflected in slower regional trade growth. Ex-ports and imports of merchandise and commercial ser-vices stagnated in nominal dollar terms, although mer-chandise exports and imports in real terms expandedby nearly 4 percent.


International Economic ReviewJanuary/February 2001
17
INTERNATIONAL ECONOMICCOMPARISONS
Michael [email protected]
202-205-3269
U.S. Economic PerformanceRelative to Other Group of
Seven (G-7) MembersU.S. real GDP–the output of goods and services
produced in the United States measured in 1996prices—grew at an annual rate of 2.4 percent in thethird quarter of 2000 following a 5.6-percent growthrate in the second quarter, according to revised esti-mates by the U.S. Department of Commerce (Com-merce News BEA 00-34). For the year 1999 real GDPgrew by 4.2 percent.
The annualized rate of real GDP growth in thethird quarter of 2000 was 2.8 percent in the UnitedKingdom, 4.8 percent in Canada, 2.7 percent in France,2.3 percent in Germany, 2.1 percent in Italy, and 1.0percent in Japan. The annualized rate of real GDPgrowth in the third quarter was 2.8 percent for EUmembers linked by the Euro currency, the Euro area(EU-11).
Industrial ProductionThe Federal Reserve Board (Federal Reserve Sta-
tistical Release -G.17 (419)) reported that U.S. indus-trial production fell by 0.2 percent in November 2000following a decline of 0.1 percent in October.Manufacturing output dropped by 0.5 percent with de-clines spread about evenly across durable and nondura-ble goods industries. Output at utilities surged by 3.6percent in November due to unseasonably cold weath-er. The output of consumer goods ticked up by 0.1 per-cent in November after having fallen by 0.9 percent inOctober. The production of durable consumer goodsdecreased for a second month and was pulled down bya drop in the assembly rate of autos and light trucks.The output of other consumer durables, which dippedby 0.3 percent in November, was held down by a dec-line in carpeting and furniture. Total industrial produc-tion in November 2000 was 4.7 percent higher than
1 The views and conclusions expressed in this article arethose of the author. They are not necessarily the views of theU.S. International Trade Commission as a whole or of anyindividual Commissioner.
in November 1999. Overall industrial capacity utiliza-tion was 4.6 percent higher in November 2000 than inNovember 1999.
For the third quarter as a whole, total industrialproduction index increased at an annual rate of 3.7 per-cent, the slowest quarterly rate since the first quarter of2000.
Other G-7 member countries reported the follow-ing growth rates of industrial production. For the yearended October 2000, Japan reported an increase of 6.6percent, the United Kingdom reported an increase of0.6 percent, Germany reported an increase of 4.1 per-cent, Italy reported an increase of 4.3 percent. For theyear ended September 2000, France reported an in-crease of 3.4 percent and Canada reported an increaseof 4.3 percent. The Euro area reported an increase of5.6 percent for the year ended September 2000.
PricesThe seasonally adjusted U.S. Consumer Price In-
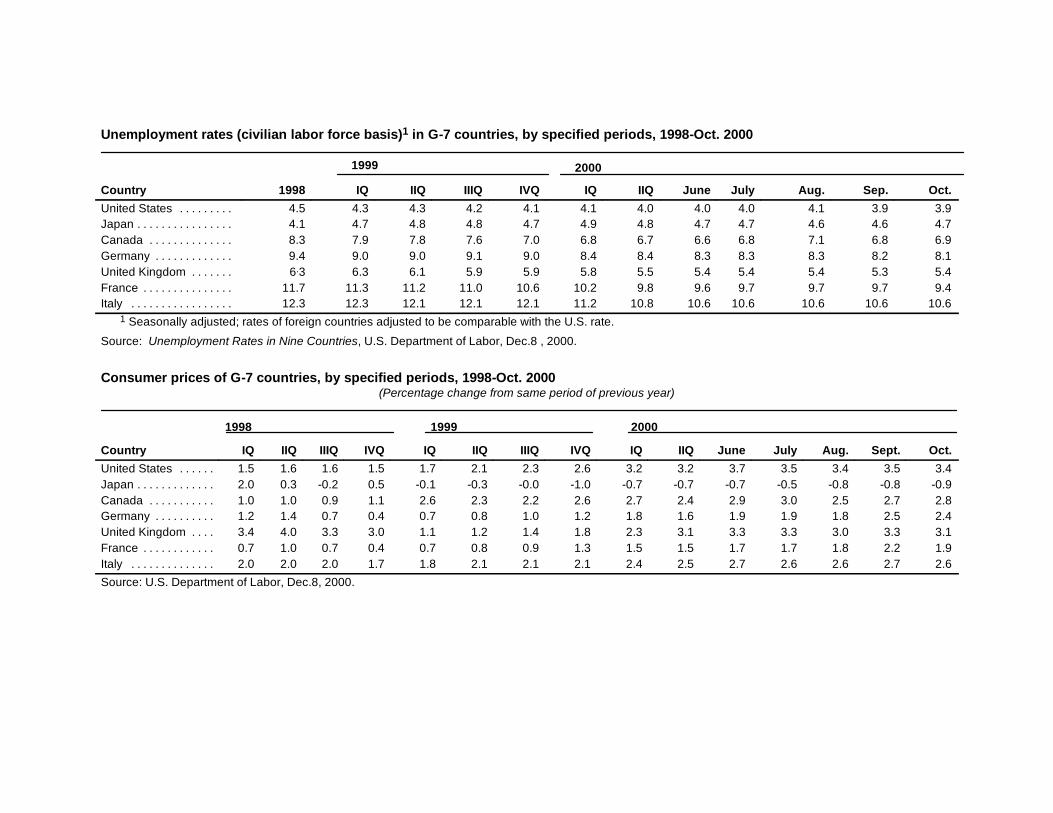
dex (CPI) increased 0.2 percent in November 2000, thesame as in October 2000, according to the U.S. Depart-ment of Labor (USDL-00-360). The food index, whichrose by 0.1 percent in October 2000, was unchanged inNovember. The energy index increased by 0.1 percentin November 2000, following a 0.2-percent rise in Oc-tober. For the 12-month period ended November 2000,the urban CPI (“CPI-U”) increased by 3.4 percent.
During the 1-year period ended November 2000,prices increased by 2.4 percent in Germany, 2.7 percentin Italy, 3.2 percent in Canada, 3.2 percent in theUnited Kingdom, and by 2.2 percent in France. Duringthe 1-year period ended October 2000, prices declinedby 0.9 percent in Japan. Prices increased by 2.9 per-cent in the Euro area in the year ended November2000.
EmploymentThe Bureau of Labor Statistics (USDL 01-02) re-
ported that the unemployment rate was unchanged inDecember 2000 at 4.0 percent. The jobless rate hasbeen in the 3.9 to 4.1 percent range since October1999. Employment fell in manufacturing, but rose inconstruction and in the services sector.
International Economic Review January/February 2001
18
In other G-7 countries, their latest unemploymentrates were 6.9 percent in Canada, 9.3 percent in Ger-many, 5.5 percent in the United Kingdom, 9.4 percentin France, 10.5 percent in Italy, and 4.7 percent in Ja-pan. The unemployment rate in the Euro area was 8.9percent.
ForecastsThe OECD Economic Outlook report No. 68 is-
sued in November 2000 expects global economicgrowth prospects to remain relatively bright, despitehigher oil prices and a weakening in many equity mar-kets.2 After reaching 4.5 percent this year–the fastestpace in more than a decade–growth among the OECDeconomies is projected to slow to about 3.25 percent(at an annual rate) in 2001 and 3.0 percent in 2002.Against a background of some modest further tighten-ing in monetary policy in the United States and theEuro area, core inflation is likely to remain low in mostOECD countries. Areawide employment should con-tinue to rise while unemployment may remain close toabout 6 percent of the labor force. The OECD reportalso stated that, with a sharper and more widespreadrebound in activity outside the OECD area than ex-pected previously, world output may rise by some 4.75percent this year before slowing to a growth rate of 4.0percent in 2001 and 2002.
The OECD report also stated that financial marketdevelopments so far do not suggest turbulence, butcould remain sources of risk in particular if the opti-mism attached to technology stocks continues to waneand risk premia in high-yield corporate bond marketscontinue to widen. Such developments could affectconfidence and discourage private spending, triggeringa sharper slowdown than projected, particularly in theUnited States. Attractive returns and buoyant econom-ic conditions in the United States have ensured that therecord high current-account deficit has been financedwithout difficulty. Ultimately, however, the current-ac-count deficit requires adjustments that might take placesmoothly. However, a change in foreign investor senti-ment could slacken the pace of capital inflows and leadto turbulence in foreign-exchange markets, with possi-bly inflationary consequences that might require amonetary policy response that, in turn, could lead to amore abrupt slowdown in the U.S. economy.
Moreover, the OECD report points out that the un-usually long expansion in the United States (althoughin few other OECD economies), coupled with thestrong pick-up in U.S. productivity growth, hasprompted much discussion of the sources of growthand the set of policies that might favor better growthperformance in OECD economies. Although the
2 OECD, Economic Outlook No. 68, Dec. 20, 2000,(OECD: Paris, 2000).
debate is dominated by “new economy” arguments em-phasizing the production and diffusion of informationand communications technology, the evidence suggeststhat “old economy” mechanisms are still crucial to un-derstanding the growth process. In particular, the accu-mulation of various kinds of capital–human as well asphysical–plus the need for research and development,are considered two key elements for economic growth.Differences across countries in this respect may con-tribute significantly to explain the observed variationsin growth patterns.
Raising levels of per capita income in the longterm requires a broad set of policies, including: soundmacroeconomic management; a tax system that en-courages work effort and entrepreneurship; openness tointernational trade and competition; and governmentexpenditure programs that emphasize investment andcapital accumulation, including investment in infra-structure. Appropriate conditions in financial marketsand product market regulations also have an importantrole in fostering innovation and productivity enhance-ment. However, the “new economy” does raise somenovel policy challenges, notably in respect to consumerprotection, taxation, and competition policy, accordingto the OECD report.
The OECD report projected U.S. real GDP to growat a rate of 5.2 percent in 2000, 3.5 percent in 2001,and 3.3 percent in 2002. Inflation is projected to reach2.1 percent in 2000, 2.2 percent in 2001, and 2.3 per-cent in 2002. U.S. unemployment rate is projected toreach 4.0 percent in 2000, 4.2 percent in 2001, and 4.5percent in 2002. U.S. current-account deficit wouldreach 4.3 percent of GDP in 2000, 4.5 percent in 2001,and 4.3 percent in 2002.
In the Euro area (EU-11), the rise in oil prices andless accommodating monetary conditions have alreadycontributed to a moderate deceleration in the pace ofeconomic activity in the area in the course of 2000.Nonetheless, economic growth is set to expand at ratesabove potential over the coming 2 years. The OECDreport projected Euro area GDP to increase at a rate of2.9 percent in 2000, 2.6 percent in 2001, and 2.7 per-cent in 2002. Inflation is projected to increase by 1.2percent in 2000, 1.9 percent in 2001, and 2.0 percent in2002. Unemployment in the Euro area is projected toreach 9.0 percent in 2000, and then decline to 8.3 per-cent in 2001, and 7.7 percent in 2002. Current-accountbalances would show a surplus of 0.1 percent of GDPin 2001 and 0.4 percent of GDP in 2002.
In the broader European Union (EU-15), GDP isprojected to increase at a rate of 3.4 percent in 2000,3.0 percent in 2001, and 2.7 percent in 2002. Inflationis to increase by 1.4 percent in 2000, 2.0 percent in2001, and 2.2 percent in 2002. Unemployment is pro-jected to reach 8.2 percent in 2000, and decline thereaf-ter to 7.6 percent in 2001, and 7.2 percent in 2002.The current account would show a deficit of 0.2
International Economic ReviewJanuary/February 2001
19
percent of GDP in 2000 and 2001, but achieve balancein 2002.
In Japan, the economy has started a moderate re-covery. Output is projected to grow at a rate of 2.0 to2.25 percent during the 2001-2002 projection period,with deflation gradually subsiding as economic growthpicks up, according to the report. Japan’s current ac-count is estimated to show a 2.8-percent surplus as apercent of GDP in 2000, 2.7 percent in 2001, and 3.0percent in 2002.
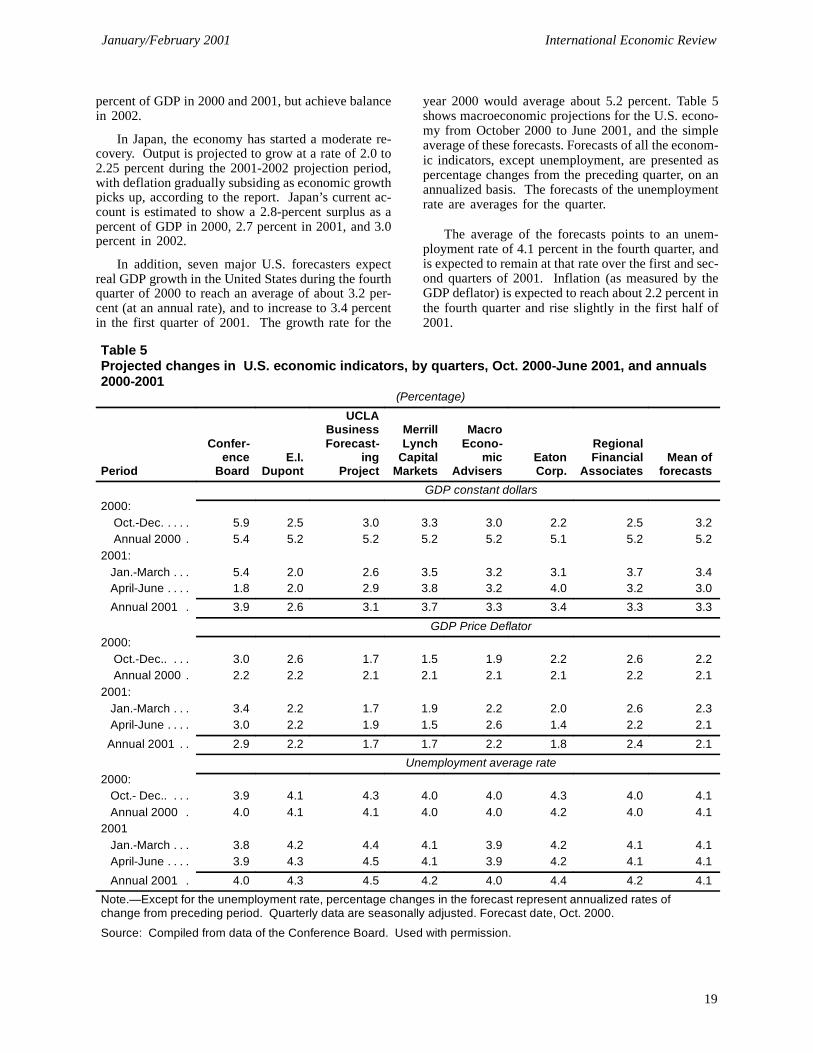
In addition, seven major U.S. forecasters expectreal GDP growth in the United States during the fourthquarter of 2000 to reach an average of about 3.2 per-cent (at an annual rate), and to increase to 3.4 percentin the first quarter of 2001. The growth rate for the
year 2000 would average about 5.2 percent. Table 5shows macroeconomic projections for the U.S. econo-my from October 2000 to June 2001, and the simpleaverage of these forecasts. Forecasts of all the econom-ic indicators, except unemployment, are presented aspercentage changes from the preceding quarter, on anannualized basis. The forecasts of the unemploymentrate are averages for the quarter.
The average of the forecasts points to an unem-ployment rate of 4.1 percent in the fourth quarter, andis expected to remain at that rate over the first and sec-ond quarters of 2001. Inflation (as measured by theGDP deflator) is expected to reach about 2.2 percent inthe fourth quarter and rise slightly in the first half of2001.
Table 5Projected changes in U.S. economic indicators, by quarters, Oct. 2000-June 2001, and annuals2000-2001
(Percentage)
Period
Confer-ence
BoardE.I.
Dupont
UCLABusinessForecast-
ingProject
MerrillLynch
CapitalMarkets
MacroEcono-
micAdvisers
EatonCorp.
RegionalFinancial
AssociatesMean of
forecasts
GDP constant dollars2000:
Oct.-Dec. . . . . 5.9 2.5 3.0 3.3 3.0 2.2 2.5 3.2Annual 2000 . 5.4 5.2 5.2 5.2 5.2 5.1 5.2 5.2
2001:Jan.-March . . . 5.4 2.0 2.6 3.5 3.2 3.1 3.7 3.4April-June . . . . 1.8 2.0 2.9 3.8 3.2 4.0 3.2 3.0
Annual 2001 . 3.9 2.6 3.1 3.7 3.3 3.4 3.3 3.3
GDP Price Deflator2000:
Oct.-Dec.. . . . 3.0 2.6 1.7 1.5 1.9 2.2 2.6 2.2Annual 2000 . 2.2 2.2 2.1 2.1 2.1 2.1 2.2 2.1
2001:Jan.-March . . . 3.4 2.2 1.7 1.9 2.2 2.0 2.6 2.3April-June . . . . 3.0 2.2 1.9 1.5 2.6 1.4 2.2 2.1
Annual 2001 . . 2.9 2.2 1.7 1.7 2.2 1.8 2.4 2.1
Unemployment average rate2000:
Oct.- Dec.. . . . 3.9 4.1 4.3 4.0 4.0 4.3 4.0 4.1Annual 2000 . 4.0 4.1 4.1 4.0 4.0 4.2 4.0 4.1
2001Jan.-March . . . 3.8 4.2 4.4 4.1 3.9 4.2 4.1 4.1April-June . . . . 3.9 4.3 4.5 4.1 3.9 4.2 4.1 4.1
Annual 2001 . 4.0 4.3 4.5 4.2 4.0 4.4 4.2 4.1
Note.—Except for the unemployment rate, percentage changes in the forecast represent annualized rates ofchange from preceding period. Quarterly data are seasonally adjusted. Forecast date, Oct. 2000.
Source: Compiled from data of the Conference Board. Used with permission.

International Economic ReviewJanuary/February 2001
21
STATISTICAL TABLES
Unemployment rates (civilian labor force basis)1 in G-7 countries, by specified periods, 1998-Oct. 2000
20001999
Country 1998 IQ IIQ IIIQ IVQ IQ IIQ June July Aug. Sep. Oct.
United States . . . . . . . . . 4.5 4.3 4.3 4.2 4.1 4.1 4.0 4.0 4.0 4.1 3.9 3.9Japan . . . . . . . . . . . . . . . . 4.1 4.7 4.8 4.8 4.7 4.9 4.8 4.7 4.7 4.6 4.6 4.7Canada . . . . . . . . . . . . . . 8.3 7.9 7.8 7.6 7.0 6.8 6.7 6.6 6.8 7.1 6.8 6.9Germany . . . . . . . . . . . . . 9.4 9.0 9.0 9.1 9.0 8.4 8.4 8.3 8.3 8.3 8.2 8.1United Kingdom . . . . . . . 6.3 6.3 6.1 5.9 5.9 5.8 5.5 5.4 5.4 5.4 5.3 5.4France . . . . . . . . . . . . . . . 11.7 11.3 11.2 11.0 10.6 10.2 9.8 9.6 9.7 9.7 9.7 9.4Italy . . . . . . . . . . . . . . . . . 12.3 12.3 12.1 12.1 12.1 11.2 10.8 10.6 10.6 10.6 10.6 10.6
1 Seasonally adjusted; rates of foreign countries adjusted to be comparable with the U.S. rate.
Source: Unemployment Rates in Nine Countries, U.S. Department of Labor, Dec.8 , 2000.
Consumer prices of G-7 countries, by specified periods, 1998-Oct. 2000(Percentage change from same period of previous year)
200019991998
Country IQ IIQ IIIQ IVQ IQ IIQ IIIQ IVQ IQ IIQ June July Aug. Sept. Oct.
United States . . . . . . 1.5 1.6 1.6 1.5 1.7 2.1 2.3 2.6 3.2 3.2 3.7 3.5 3.4 3.5 3.4Japan . . . . . . . . . . . . . 2.0 0.3 -0.2 0.5 -0.1 -0.3 -0.0 -1.0 -0.7 -0.7 -0.7 -0.5 -0.8 -0.8 -0.9Canada . . . . . . . . . . . 1.0 1.0 0.9 1.1 2.6 2.3 2.2 2.6 2.7 2.4 2.9 3.0 2.5 2.7 2.8Germany . . . . . . . . . . 1.2 1.4 0.7 0.4 0.7 0.8 1.0 1.2 1.8 1.6 1.9 1.9 1.8 2.5 2.4United Kingdom . . . . 3.4 4.0 3.3 3.0 1.1 1.2 1.4 1.8 2.3 3.1 3.3 3.3 3.0 3.3 3.1France . . . . . . . . . . . . 0.7 1.0 0.7 0.4 0.7 0.8 0.9 1.3 1.5 1.5 1.7 1.7 1.8 2.2 1.9Italy . . . . . . . . . . . . . . 2.0 2.0 2.0 1.7 1.8 2.1 2.1 2.1 2.4 2.5 2.7 2.6 2.6 2.7 2.6
Source: U.S. Department of Labor, Dec.8, 2000.

U.S. trade balances by major commodity categories and by specified periods, 1998-Oct. 2000(In billions of dollars)
2000
Commodity categories 1998 Nov. Dec. Jan. Feb. Mar. Apr. May. June July Aug. Sept. Oct.
Agriculture . . . . . . . . . . . . . . . . . . 14.9 1.4 1.0 1.0 1.2 1.0 0.5 0.5 0.8 0.9 1.1 1.1 1.7
Petroleum and selectedproducts (unadjusted) . . .
-43.4 -6.5 -6.0 -7.1 -9.0 -9.6 -8.6 -8.5 -10.0 -10.7 -10.6 -9.6 -9.5
Manufactured goods . . . . . . . -241.1 -31.1 -25.5 -27.9 -27.8 -31.6 -28.7 -32.9 -31.4 -36.4 -35.8 -36.2 -38.9Unit value of U.S. imports of
petroleum and selectedproducts (unadjusted) . . . . . . $10.81 $20.9 $20.90 $23.18 $23.18 $25.01 $24.42 $24.16 $26.65 $27.76 $26.59 $28.98 $28.62
1 Exports, f.a.s. value, unadjusted. Imports, customs value, unadjusted.
Source: Advance Report on U.S. Merchandise Trade, U.S. Department of Commerce, FT900 (00-07), Dec.19, 2000.
