office of federal procurement policy pamphlet number 4 · office of federal procurement policy...
TRANSCRIPT
Office of Federal Procurement Policy
Pamphlet Number 4
Supplement No. 2 to OMB Circular No. A-76
A Guide for Writing and Administering Performance
Statements of Work for Service Contracts
Chapter 1
General and Introduction
1-1. -- New Role of Contractors.
Each year the government contracts for a large part of its mission support. As a result, civilian contractors have assumed a major role in day-to-day operations in the area of services. Contractors do such work as transportation, refuse collection, food services, and janitorial services. At some places they provide an entire support function, including engineering and supply.
a. Whenever the government contracts out a job, it is entitled to receive quality service. So that the government can define and measure quality, this document presents a method of identifying and stating requirements in such a way that the statement of work (SOW) will state accurately our minimum requirements. It also explains how to assure that the contractor has actually performed the services required.
b. This document is also designed to show non-contracting personnel how to write a SOW and a Quality Assurance (QA) surveillance plan for service contracts. It explains how contract administration personnel should take action based on surveillance results. (The example used is a service contract for vehicle operations and maintenance but, the method can be used for other service contracts, including total support contracts.
1-2. -- Terms Explained.
Following are terms used frequently in this document.
a. Acceptable Quality Level. The maximum percent defective, the maximum number of defects per hundred units, or the number of defects in a lot that can be considered satisfactory on the average. The allowable leeway or variance from a standard before the government will reject the specific service. And AQL does not say that the contractor may knowingly offer defective service. It implies that the government recognizes that defective performance sometimes happens unintentionally. As long as the percent of defective performance does not exceed the AQL, the service will not be rejected by the government. The contractor, however, must reperform the defective service when possible.
b. Acceptable Sampling. A form of sampling used to determine a course of action. A procedure that gives a specified risk of accepting lots of given quality.

c. Activity. Another name for a work process. (An activity uses inputs and generates outputs).
d. Administer. That stage of the contracting cycle in which the contracting officer insures that the total contract is being followed, makes necessary changes to the contract, and insures progress toward contract completion.
e. Analyst. A non-Contracting person charged with developing a SOW and a QA surveillance plan; also, the person who analyzes a function to develop the required documents.
f. Attribute. The property a unit has of being either bad or good. That is, the quality characteristic of a unit is either within the specified requirement or it is not.
g. Attribute Sampling. A form of acceptance sampling that grades a service as defective or non-defective.
h. Buy. That stage of the contracting cycle in which the customer state what he or she wants contracted. This stage includes funding the requirement, writing the SOW and writing the surveillance plan.
i. Define. That stage of the contracting cycle in which the customer states what he or she wants contracted. This stage includes funding the requirement, writing the SOW and writing the surveillance plan.
j. Input. Anything put into a system or process or expended in its operation to achieve a result or output.
k. Interface. A common boundary between two organizations or activities.
l. Job Analysis. The act of looking at a job as it is being done in-house or a contractor to determine what actually results. Job analysis looks at organization, workload, performance values, and resources.
m. Lot. A collection of service outputs from which a sample is to be drawn and inspected to determine conformance with the standard.
n. Lot Size. The number of service outputs in a lot.
o. Organizational Analysis. The act of looking at an organization to determine what kind of services it provides.
p. Output. The amount of something produced by a system or process during a given span of time.

q. Percent of Sample Found Defective. Determined by dividing the number of defects by the sample size when the reject number has been equaled or exceeded. The resulting number is used to make an equitable deduction from the contract price for non-performance by the contractor.
r. Performance Indicator. A characteristic of an output of a work process that can be measured.
s. Performance Value. A composite of a standard and an acceptable quality level which describes the quality of an output of a work process.
t. Qualify. That stage of the contracting cycle in which one determines that the contractor’s work satisfies the requirements of the SOW.
u. Quality Assurance. Those actions taken by the government to check goods or services to determine that they meet the requirements of the SOW.
v. Quality Assurance Evaluator (QAE). That person responsible for checking contractor performance.
w. Quality Control. Those actions taken by a contractor to control the production of goods or services so that they will meet the requirements of the SOW.
x. Random Number Table. A table of numbers arranged in a random fashion. A table used to make random samples.
y. Random Sample. A sampling method whereby each service output in a lot
z. Random Sampling. A method of looking at a few individual items in a lot to determine the quality of that lot against a standard.
aa. Release. That stage of the contracting cycle in which goods and services are accepted as meeting contract requirements and payment is made to the contractor.
ab. Reliable Service. A service that is dependable and is provided when required.
ac. Sample. A sample consists of one or more service outputs drawn from a lot, the outputs being chosen at random. The number of outputs in the sample is the sample size.
ad. Sampling Guide. The part of the surveillance plan which contains all the information needed to perform a random sample.
ae. Sampling Plan. A plan which indicates that AQL, the number of units from each lot which are to be inspected (sample size) and the criteria for determining the acceptability of the lot (acceptance and rejection numbers). Used to develop the sampling guide.
af. Service. A job performed to the standard and within the acceptable quality level. The contractor must do the specific job, and meet the standard, and meet the acceptable quality level before one can say that performance has been acceptable and that he/she should be paid.
ag. Source. That stage of the contracting cycle in which the contracting office prepares the bid package, finds potential contractors to do the work, and accepts bids from proposed contractors.
ah. Standard. An acknowledged measure of comparison.
ai. Statement of Work. A document that describes accurately the essential and technical requirements for items, materials, or services including the standards used to determine whether the requirements have been met.
aj. Surveillance Plan. An organized written document used for quality assurance surveillance. The document contains sampling guides, checklists, and decision tables.
ak. System. A group of interacting, interrelated, or interdependent elements forming a collective entity.
al. Tree Diagram. A visual representation of the major functions performed by a system which shows logical parts and subparts.
am. Uniform Service. A service that is, within defined limits, always the same.
an. Work. A series of actions, changes, or functions that bring about an end result.
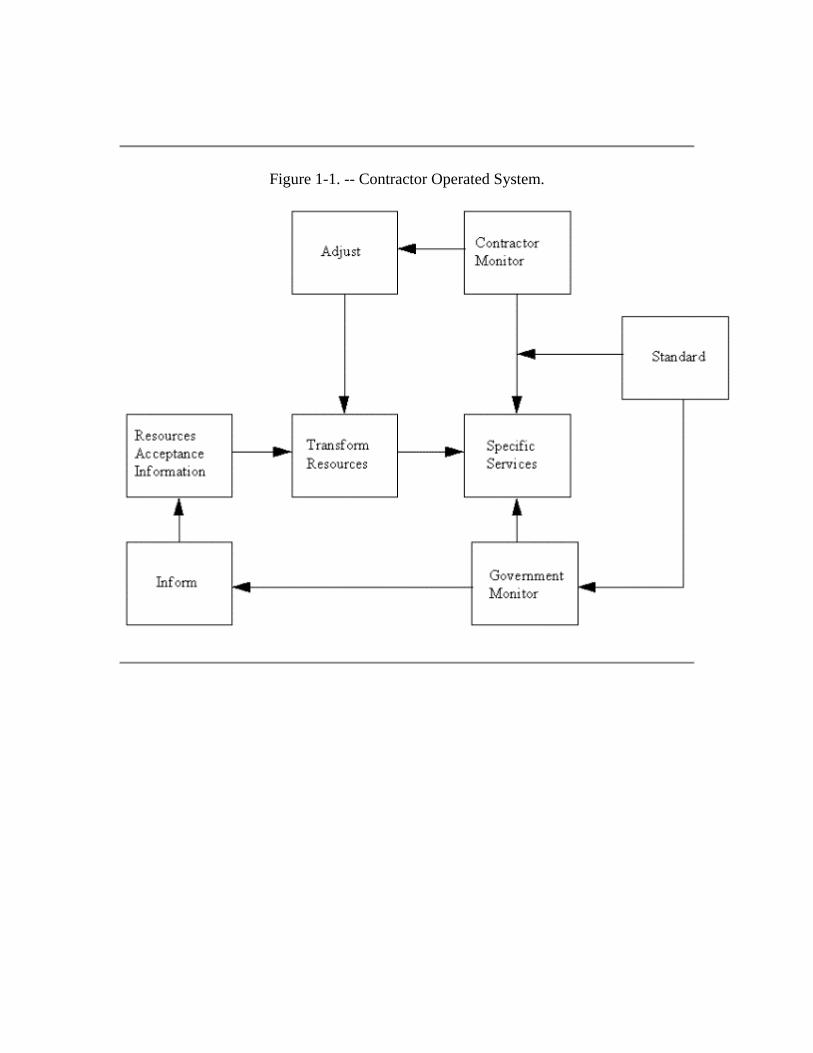
Figure 1-1. -- Contractor Operated System.
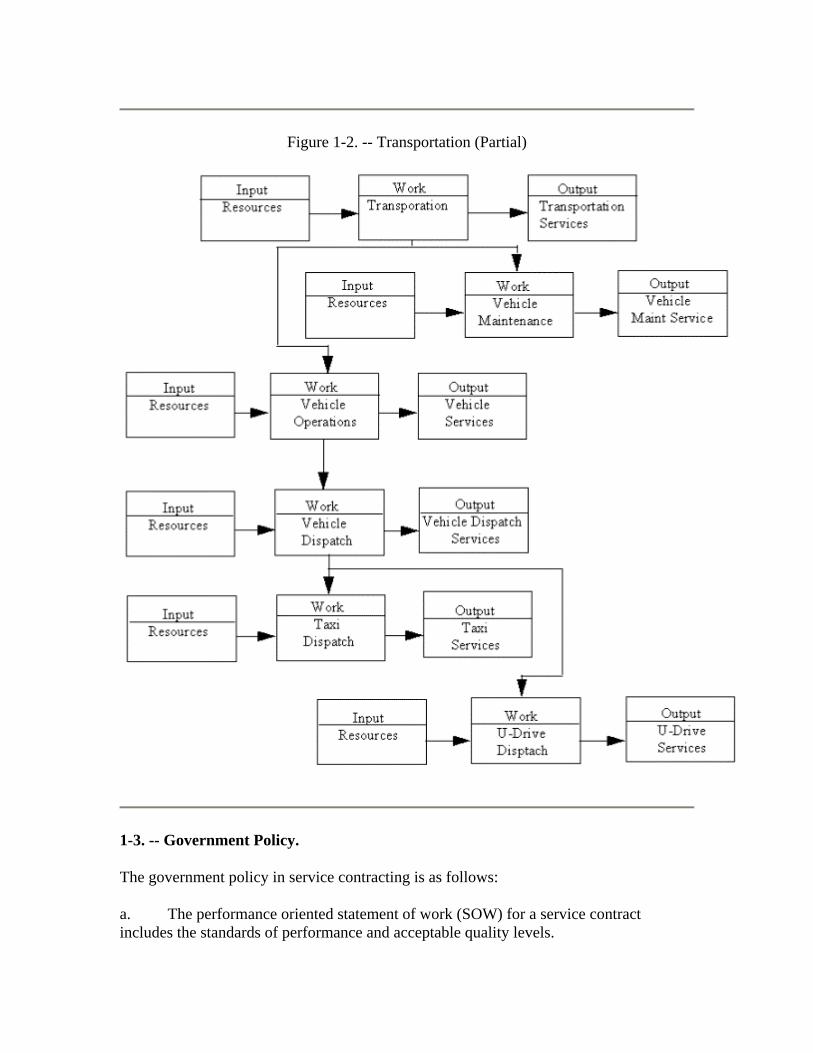
Figure 1-2. -- Transportation (Partial)
1-3. -- Government Policy.
The government policy in service contracting is as follows:
a. The performance oriented statement of work (SOW) for a service contract includes the standards of performance and acceptable quality levels.

b. Standards must be measurable.
c. Quality control is a contractor responsibility.
d. A performance oriented SOW must not contain detailed procedures unless absolutely necessary. Rely on a statement of the required service as an end product.
e. References to directives in the SOW should be held to a minimum.
f. The surveillance plans described in this document are an acceptable way of performing quality assurance.
g. The most qualified persons available must write the SOW and the surveillance plan. Standardized government documents, when available, will provide valuable basic information.
1-4. -- A Systems Approach.
The design of a SOW and the surveillance plan is based on a systematic analysis of the function to be put under contract or already under contract. The procedure for deriving these two products is called job analysis. The procedure consists of a step-by-step review of the requirement to arrive at the specific output services and associated standards.
a. Jobs as Systems. The analysis assumes that an operation is a system. An operation can be called a system because it consists of a job or a combination of jobs carried out by people, and sometimes, machines for a certain purpose. The parts of a system are usually called input, work, output, and control loops. These parts are shown in figure 1-1.
(1) From a contractor’s view, the system consists of taking people, facilities, material, and the SOW and inputting it into a work process. The result of this work is a contract output.
(2) Two major control loops are at work in this system. Both loops use standards as the basis for determining acceptability.
(3) The contractor quality loop feeds back information from the output into the work process so that the contractor can adjust performance to meet the standard specified.
(4) On the other hand, government quality assurance looks at the output and determines its acceptability. This information then becomes an input for contractor management to adjust the quality control function.
b. Parts and Subparts. Every service contract operation can be viewed as a system. Further, each major system can be broken into small parts or subsystems. For example, the system portrayed in figure 1-1 were called transportation, the major system could be
broken into small parts called vehicle operations, vehicle maintenance, and traffic management. Further, each of these parts could be broken down into the smaller parts or subparts that make up that part, as shown in figure 1-2.
(1) Note that the transportation work area leads to vehicle operations, which leads to vehicle dispatch, which leads to taxi dispatch and U-drive dispatch. Each work area has its own set of inputs and outputs. This chart does not contain all of the work areas associated with transportation. Rather, it only shows an example of how a system can be broken into its parts.
(2) The chart looks a great deal like a standard organizational chart, except that this chart shows each thing that happens rather than who performs the task. Further, by showing an input, it shows what must be there for something to take place. It shows that each job must have an output that can be measured in some way.
c. Results of the Systems Approach. A proposed contract effort must be viewed in a systematic way to arrive at an output or performance-oriented SOW and a means of measuring the service. Thus, a systematic approach to analysis will result in an enforceable, clear SOW. It will also produce a quality assurance surveillance plan that tells the government if the service is provided as specified. Further, the systems approach permits the analyst to identify outputs and separate them from the specific procedures required to create the outputs.
(1) When the government specifies a given procedure, it assumes responsibility for insuring that the design or procedure will result in the desire output. On the other hand if it specifies the output performance and its quality standard, the contractor must then use the best management to achieve that level of performance,
(2) Last, systematic analysis gives a clear picture of what input is needed to get the job done. This data is most useful in analyzing a contract bid price, conducting a preaward survey, creating a list of government furnished property, and making payment deductions in case of non-performance.
1-5. -- Team Approach.
The development of a quality SOW is a result of team effort. The leading members of the team are the functional office, the local contracting office, and the manpower/management engineering office. The latter can provide previous manpower studies to assist in determining jobs performed.
a. Responsibilities. During the contracting cycle, responsibilities are assigned as shown in figure 1-3. This chart shows which major functions occur during the contracting cycle and which important actions take place during each function. The columns on the right show who is responsible at each stage of the purchase cycle.

(1) The functional area chief should be considered the team leader exercising authority and responsibility for the function that will be under contract. Functional persons state the service that will be delivered, measure the quality of service, and accept the service.
(2) The contracting office is the means of getting a contract and enforcing its provisions.
(3) The contracting office also provides the necessary authority and technical experience in contracting to make the contract a workable document.
(4) The manpower/management engineering office performs cost studies required by OMB Circular A-76.
b. Relationship in Contracting Out. The lines of authority and responsibility that exist when a function is contracted out, are shown in figure 1-4.
(1) When a given function is performed in-house, with government personnel, the line of authority flows from the agency chief, to the functional area chief, and then to the function. However, when authority is delegated in the contract environment, the contracting office (and especially, the contracting officer) become a part of the authority line.
(2) By law, only a contracting officer may make a contract and may direct a contractor. Hence, the functional area chief must act through the contracting officer to obtain and manage a service contract.
(3) In a contract function, responsibility does not follow the line of authority. Rather, the functional area chief has overall responsibility to see that the service is provided but works through the contracting officer’s authority. Two major tools for that use are a well-defined quality SOW and a surveillance plan.
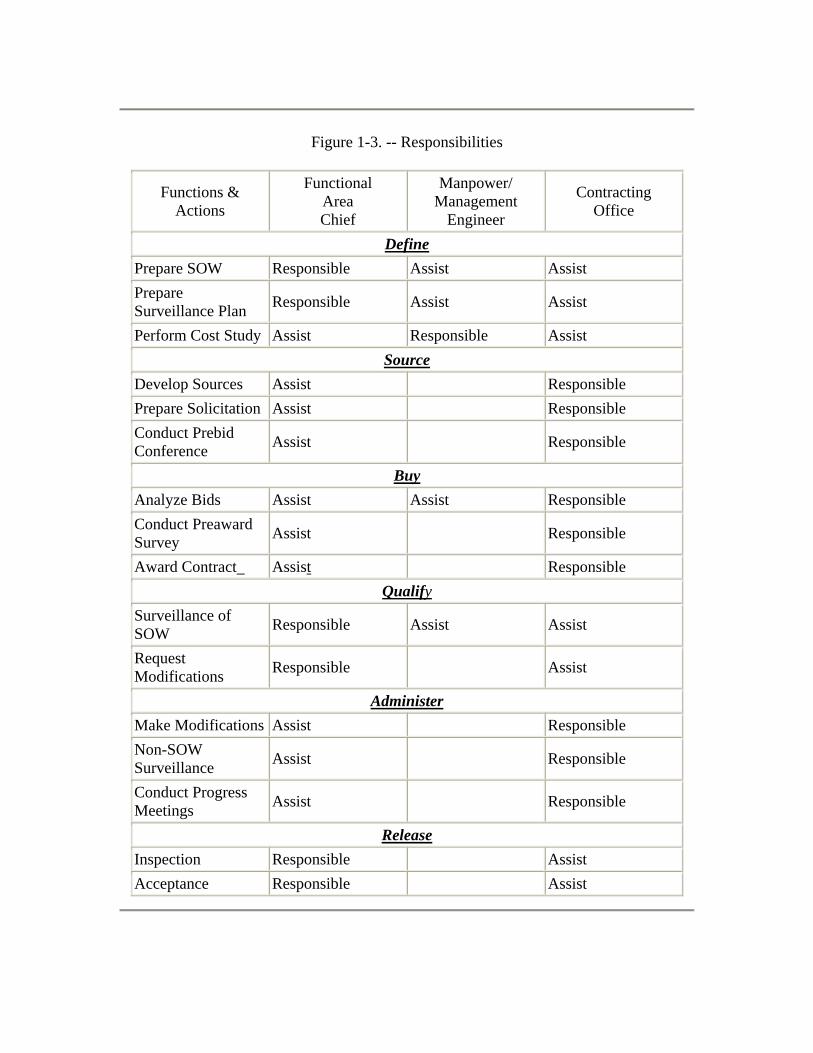
Figure 1-3. -- Responsibilities
Functions & Actions
Functional Area Chief
Manpower/ Management
Engineer
Contracting Office
Define Prepare SOW Responsible Assist Assist Prepare Surveillance Plan Responsible Assist Assist
Perform Cost Study Assist Responsible Assist Source
Develop Sources Assist Responsible Prepare Solicitation Assist Responsible Conduct Prebid Conference Assist Responsible
Buy Analyze Bids Assist Assist Responsible Conduct Preaward Survey Assist Responsible
Award Contract Assist Responsible Qualify
Surveillance of SOW Responsible Assist Assist
Request Modifications Responsible Assist
Administer Make Modifications Assist Responsible Non-SOW Surveillance Assist Responsible
Conduct Progress Meetings Assist Responsible
Release Inspection Responsible Assist Acceptance Responsible Assist
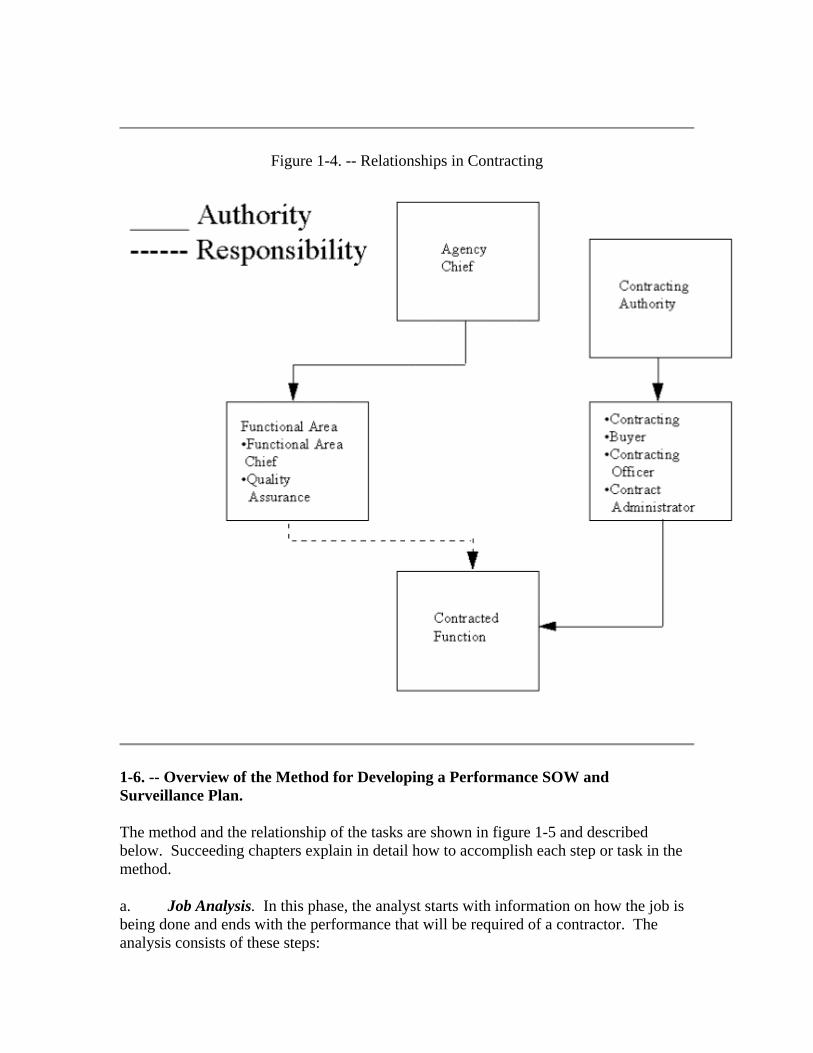
Figure 1-4. -- Relationships in Contracting
1-6. -- Overview of the Method for Developing a Performance SOW and Surveillance Plan.
The method and the relationship of the tasks are shown in figure 1-5 and described below. Succeeding chapters explain in detail how to accomplish each step or task in the method.
a. Job Analysis. In this phase, the analyst starts with information on how the job is being done and ends with the performance that will be required of a contractor. The analysis consists of these steps:

(1) Do Organizational Analysis. First, the analyst reviews the current organization and identifies the services it provides.
(2) Prepare Tree Diagram. A tree diagram breaks a job into smaller and smaller parts. Each part brings about a final result or service.
(3) Do Work Analysis. Take each part of the tree diagram and break it into input, work, and output. Input is what is needed to do the job, work is what steps are needed to do the job, output is what the work produces. During this step the analyst decides, with management, what outputs the contractor will provide and what work will remain in-house.
(4) Gather Data. After the analyst has picked the services on the tree diagram that are to be contractor supplied, data can be gathered. In this step, the analyst collects data on how much input is required to do the job, and how often the output is provided.
(5) Do Performance Analysis. Each service proposed for contract has a performance value assigned. The analyst decides how the service can be measured. With management, the analyst determines what standards apply. With management, an acceptable quality level is applied.
(6) Analyze Directives. During this step the analyst decides what directives, if any, apply to the service to be provided. Directives are classified as mandatory or advisory. They must be held to a minimum.
(7) Deduct Analysis. During this step the analyst works with the manpower/management engineering office to prepare the estimated contractor cost of each specific service. These costs are stated in the SOW as a percentage of total contract cost, for a formally advertised procurement. These costs are used as the basis for deductions for non-performance; in a negotiated procurement, they are used to evaluate contractor proposals. Actual negotiated costs re included in the SOW.
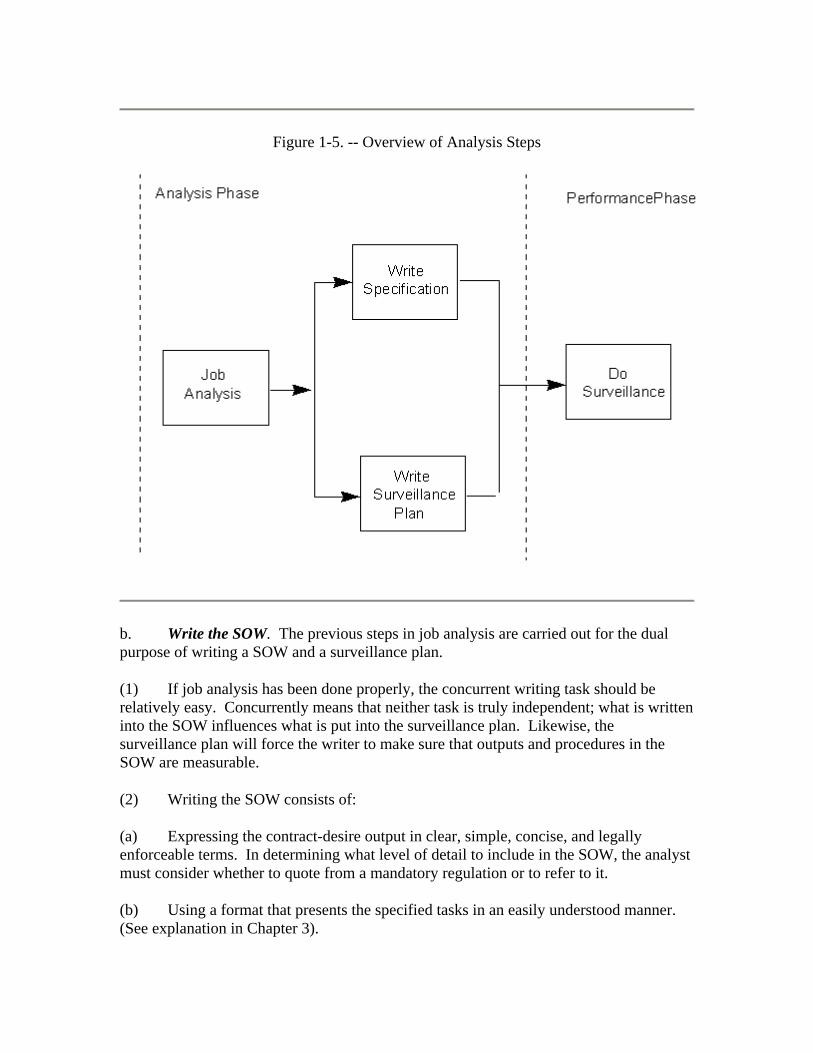
Figure 1-5. -- Overview of Analysis Steps
b. Write the SOW. The previous steps in job analysis are carried out for the dual purpose of writing a SOW and a surveillance plan.
(1) If job analysis has been done properly, the concurrent writing task should be relatively easy. Concurrently means that neither task is truly independent; what is written into the SOW influences what is put into the surveillance plan. Likewise, the surveillance plan will force the writer to make sure that outputs and procedures in the SOW are measurable.
(2) Writing the SOW consists of:
(a) Expressing the contract-desire output in clear, simple, concise, and legally enforceable terms. In determining what level of detail to include in the SOW, the analyst must consider whether to quote from a mandatory regulation or to refer to it.
(b) Using a format that presents the specified tasks in an easily understood manner. (See explanation in Chapter 3).
(c) Determining what exhibits will help convey to the contractor the job that needs to be done.
c. Writing a Surveillance Plan. The surveillance plan is a document used to make sure that systematic quality assurance methods are used. It assumes that the contractor is responsible for managing and controlling the output of service. The government plan seeks to determine if contractor-provided service meets the quantity and quality standards. The development of the plan involves these major steps:
(1) Identifying Key Performance Indicators. The job analysis phase identified many performance indicators. Not all of these indicators are critical to the service being provided. During this step the analyst must decide which indicators to include in the plan, using as criteria, the criticality of the process and its output, the availability of quality assurance manpower, and the adaptability of each indicator to overlap and check many kinds of outputs.
(2) Identify Information Sources. Each plan uses many sources of information (for example, existing management information systems, customer complaints, and random sampling).
(3) Develop Tools. The writer of the surveillance plan has many tools. These tools are:
(a) The Sampling Guide. The sampling guide is a written procedure which states what will be checked, the standard of performance, and how the checking will be done. (For a sample guide, see Chapter 4). The sampling guides used in this regulation are based on statistical techniques called for in Military Standard 105D, Sampling Procedures and Tables for inspection by Attributes. By sampling a small part of the total service in a random fashion, the QAE can accept or reject the service, based on the standard.
(b) Decision Tables. When a service is rejected, a decision must be made as to who is at fault (the contractor or the government). A decision table is used for this purpose. The decision table identifies different kinds of unsatisfactory performance, probable cause factors, and the things from which these factors could result.
(c) Checklist. The last tool is the checklist. Checklists as used to record what has been checked by a sampling guide and to record information on contract items not covered by sampling.
(d) Do Surveillance. The final step is doing surveillance, that is, taking the written surveillance plan and using it on a daily basis. In this step, random samples are drawn and schedules of quality assurance inspections made. Contractor discrepancies are documented and corrective action taken. If appropriate, money is deducted from a contractor’s payment by the contracting officer.

Chapter 2
Job Analysis
2-1. -- Advantages of Job Analysis.
The previous chapter outlined the steps involved in developing a statement of work (SOW) and a quality assurance surveillance plan. This chapter explains job analysis in greater detail. This process enables the analyst to pull together all of the essential information needed to write a performance-oriented SOW. It also helps to build a foundation that will help the government determine the quality of the contractor’s output service. The steps in job analysis are described below.
2-2. -- Organization.
The starting point in looking at a service function is to see how it is organized and what kind of service it provides. This is not to say that the SOW will require that a contractor adopt the government style of organization. Rather, organizational analysis will provide a framework for determining what is done by the organization.
a. To capture this data, use an organizational analysis sheet as shown in figure 2-1. The data gathered and placed on the analysis sheet will show a complete picture of the organization. Of particular importance is the choice of services performed.
b. These services or outputs become the basis for writing the SOW, development of standards, defining performance indicators, and identifying acceptable quality levels of performance. Be as specific as possible when making the entries.

Figure 2-1. -- Organizational Analysis
Name or Organization Transportation
Mission Statement Provide vehicle maintenance, on base vehicular transportation shipment of household goods, etc.
Organizational Elements:
Traffic Management Office Vehicle Maintenance Vehicle Operations Reports and Analysis Normal Taxi Service, U-Drive Service,
Emergency Maintenance, Outbound Personal Property Service -- etc.
Services Performed:
Contingent Vehicle Support for disaster control exercises -- etc.
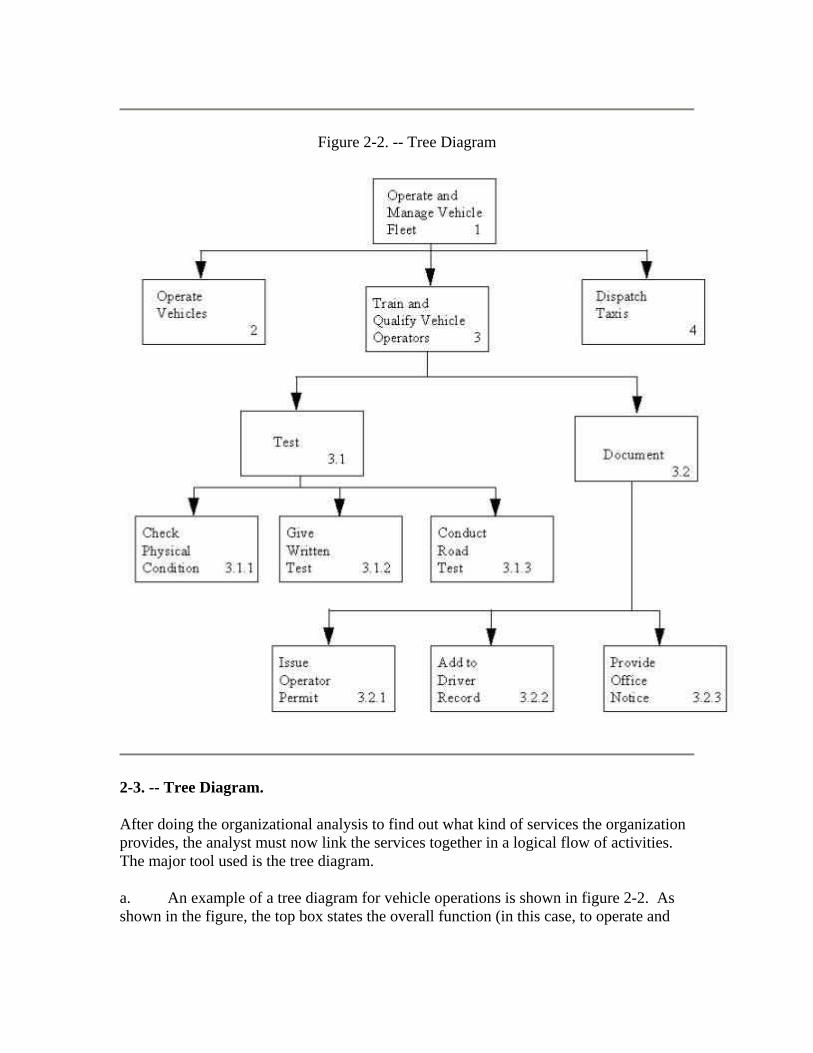
Figure 2-2. -- Tree Diagram
2-3. -- Tree Diagram.
After doing the organizational analysis to find out what kind of services the organization provides, the analyst must now link the services together in a logical flow of activities. The major tool used is the tree diagram.
a. An example of a tree diagram for vehicle operations is shown in figure 2-2. As shown in the figure, the top box states the overall function (in this case, to operate and
manage vehicles). Each of the following levels breaks the job into parts and subparts, to develop a chart that fully describes the job in terms of these parts.
b. The boxes are numbered to show the relationship of the parts back to the higher level part. For example, test is numbered “3.1”, because it relates to train and qualify vehicle operators which is numbered, “3”. These numbers and part boxes provide the start for further analysis.
2-4. -- Activity Analysis.
Prepare a separate activity analysis for each numbered box in the tree diagram. These sheets are used to define the outputs of the process. An example of an activity analysis for dispatching taxis is shown in figure 2-3.
a. The analysis consists of three major sections: input, work and output.
(1) The steps in the work section that are required to perform the work are numbered in sequence.
(2) The input section lists those things that are needed to perform the work steps.
(3) The output section contains those things produced by the work (that is, items or services that the work provides).
b. In the example, the taxi dispatch begins with the input of a request for taxi service, and with documenting the service. The output of the process is a documented form and the movement of the passenger to the desired location.
c. The analyst must complete the analysis in as much detail as is possible. If the tree diagram has been branched out in enough detail (that is, as many sub-parts as possible) the task will be very easy. The analysis does nothing more than state what starts a job, what takes place when a job is done, and the results of the job -- that is, input, work, output. The analysis merely puts this thinking down on paper in a step-by-step fashion.
2-5. -- Classification.
By building the tree diagram and the activity analysis, the analyst knows a great deal about the job. The analyst must now work with management to decide what jobs will be targeted for inclusion in the SOW. For example, the government may decide to retain responsibility for the analysis section in a transportation contract. No further job analysis need be done to jobs not targeted for contract. Decisions reached in this step are recorded on the activity analysis sheets (see figure 2-3). Record the decision for each entry in the output block.

2-6. -- Data Gathering.
After the analyst has identified the services to be provided under contract, workload and resource data must be gathered. The procedure for this is simple.
Figure 2-3. -- Activity Analysis
Activity: Dispatch Service Number 5
Include in Contract?
Input Work Output Yes No Taxi Service Request
Telephone
Walk-in
Written
1. Determine Request Validity.
2. Document Taxi Request.
3. Update Taxi Request.
4. Dispatch Taxi.
5. Pickup Passenger.
6. Deliver Passenger.
7. Complete Form "Request for Motor Vehicle Services"
Form: Request for Vehicle Services Pending
Form: In-work
Passenger Movement
Filled Form
a. Workload. As used here, “workload” refers to the result of the data gathering task which gets information on how often output services are provided. After the jobs and output services are analyzed, it should be much easier to gather the required data. As a rule, this information is available from existing management information systems, but it may need to be restructured, so that it is accumulated by a specific output.
(1) The analyst must find out how often a service will be provided during the proposed contract period. Use historical information plus projected changes, to estimate the service frequency. To gather this data, put it on a sheet as shown in figure 2-4. This sheet shows what service will be provided, and helps in estimating future requirements to be used in sizing the contract effort.

(2) This data will have eventual use in structuring the government estimate and in analyzing the proposed contractor’s bid price. This frequency information is also given to bidders so that they understand the true requirements that will have to be met under the contract. Further, workload data is used in building the surveillance plan.
b. Resources. To provide a service, a job requires the use of physical resources (assets and personnel).
(1) Physical Assets: To write a SOW, gather data about the physical assets required to perform a contract. Gather data concerning physical assets at the specific service output level. (For example, gather data on what physical assets are needed to perform emergency repair service). Sheets as shown in figures 2-5, 2-6, and 2-7 should be used to gather data on the facilities, materiel, and equipment that will be provided to the contractor. Since the SOW must list the assets the government provides, take care to avoid listing items that will not be available for the contractor’s use. The list must show any assets that will be added or deleted during the life of the contract.
(2) Personnel. Data on personnel must also be gathered. For example, a sheet as shown in figure 2-8 can be used for this purpose. Data for this sheet are available from manpower documents on the organization, but the data may need to be restructured to break it out for the specific services provided. For example, a manpower document might show how many people and what skill levels are authorized to operate a vehicle, but not how many people are allocated to perform the vehicle dispatch service. The analyst must extract this data to complete the data analysis (that is, how many government persons would be required if the service remained in-house).
Figure 2-4. -- Workload Analysis
Workload Service Historical Workload Known Change Estimated Workload
Taxi 1200/month -10% 1090/month U-Drive 50/month +20% 60/month
Figure 2-5. -- Facility Analysis
Service: Vehicle Repair Facility
Facility Square Feet Location Bldg. 209 2000 Maxwell AFB Bldg 1024 1500 Gunter AFS

Figure 2-6. -- Material Analysis
Service: Vehicle Repair Material
Name Stock Number Quantity Name Supplied to Contractor
Figure 2-7. -- Equipment Worksheet
Service: Vehicle Repair Equipment
Name Stock Number Serial Number Location Quantity
Flat Top Desk 7100-00-270-9840 Vehicle
Operations 2
Training Aid Driver
6930-00-526-3639 MF270598 Driver Training 1
Figure 2-8. -- Personnel Analysis
Personnel
Service Authorized Grade Number Security Clearance Required
WG-5 1 No WB-4 1 No
Vehicle Dispatch
WB-3 4 No WB-5 1 No Taxi Service WB-3 6 No
2-7. -- Performance Value.
When the government performs a service for itself, it not only generates an output, but it produces that output to meet standards to some acceptable quality level.
a. Example. Let us assume that a taxi pickup is to be provided within four (4) minutes of an agreed upon pickup time ninety percent (90%) of the time (10% error rate).
Taxi pickup is the service, four minutes is the standard, and 10 percent is the acceptable quality level.
b. Minimum Requirements. By law, the SOW must present the actual minimum requirements of the government. Hence, the analyst must avoid demanding more of a contractor than the government would provide if it were performing the service.
c. Performance Output. Performance values enable the analyst to place realistic demands on contractor performance. By the same token, performance values permit the writing of a performance-oriented SOW and eases the development of a quality assurance surveillance plan, for example, see the performance value analysis in figure 2-9. In doing the analysis, the analyst must include each of the output services identified for inclusion in the contract during classification.
d. Standards. In the appropriate box, show the standards that pertain to the services. These standards can be derived from the directives regulating the service, from agency standards, or from work location standards.
e. Measuring Quality. Finally, each service must have an acceptable quality level. This entry can be based on historical records, a poll of managerial desires, or agency imposed acceptable quality levels. An acceptable quality level should rarely be 0 percent, for this indicates perfect performance which is very expensive and nearly impossible to achieve. Acceptable quality levels must equal but not exceed the standards met when the government provides the services in-house, that is, how well the government did the job. However, it must be recognized that some quality levels are purely judgmental, such as appearance, taste, etc.
f. Assigning Values. Performance values need not be assigned for outputs that relate strictly to internal contractor management. For example, work scheduling is required to get the job done; however, the government is interested only in getting the job done, and is not generally concerned with how. The stress is on performance, not procedures. Hence, there is normally no need to assign a performance value to work scheduling. The meaning of each entry is described below.

Figure 2-9. -- Performance Value Analysis
Activity: Taxi Operations Performance Indicator Standard Acceptable Quality Level
Response Time 4 minutes 5%Accidents Per Mile 0 0%Operational Cost Per Mile $0.14 20%Taxi In-Commission Rate 80% 10%
g. Performance Indicator. A performance indicator is a characteristic of an output that can be measured. It may measure quantity a well as quality. By using a performance indicator and its associated standard, one can know if a process is producing a quality output. (For example, the major output of taxi operations is passenger movement).
(1) The question must be asked as to what will allow one to measure how well the process generates that output. To do this the analyst must review each previously identified job to see what measures can be associated with it.
(2) The measures are usually stated as rates (that is, a means of expressing something as it relates to a fixed amount of something else). For example, a rate for taxi service is the cost to run the fleet per mile. The performance indicators that relate to taxi operation are shown in figure 2-9. All of these indicators are rates, except average response time. However, response time is something that can be measured.
(3) In many cases, agency directives specify the performance indicators that will be used to evaluate the process. If the indicators are not prescribed, the analyst must work with management to decide what indicators would help to measure the process. Rates in terms of time and distance and accuracy are particularly useful for this purpose.
(4) The analyst must be careful to choose performance indicators that are realistic. The grams of dust per square centimeter on a vehicle may be a measurable performance indicator for vehicle condition, but it is not a realistic indicator for general use. The analyst may have to use a less satisfactory indicator (such as times washed per month). Or one may have to resort to an even less satisfactory measure (such as cleanliness) which calls for an individual judgment on the part of the person measuring performance.
(5) Whenever possible, however, one must choose a performance indicator that measures the service by a number (that is, quantifies it).
h. Using Standards. A standard is something against which another thing can be measured. Nearly everyone is familiar with standards of some sort. For example, the
standard operating speed for automobiles on highways is 55 miles per hour. In this case the number 55 is the standard, while miles per hour is the performance indicator.
(1) In looking at the processes and the performance indicators chose, non must ask what kind of yardstick will be used to measure the process. In some cases the yardstick or standard is provided by agency authorities.
(a) The standard for average taxi response time of 4 minutes is an example. However, there is no standard for bus service.
(b) In this case, the analyst, with management’s help, will have to find a reasonable standard that bears some relation to the criticality of the service to be provided and how well the government does the job in-house.
(2) A standard for bus service could be stated in terms of timeliness of arrival at a bus stop. Thus, the standard for bus service would be stated: Depart the stop no earlier than scheduled time nor later than scheduled time plus five minutes. An example of the taxi service job and the standard for the performance indicator is shown in figure 2-9.
i. Acceptable Quality Level. The acceptable quality level of a standard tells what variation from the standard (that is, error rate) is allowed. It is used to measure the reliability of the output generating process.
(1) An acceptable quality level is generally used in referring to a production line that produces a tangible object. These products can then be measured to see if they meet the standard within an acceptable quality level.
(2) Service contracts also produce measurable services (even though they are not always tangible) and one can determine how often they meet the standard.
(3) An acceptable quality level is expressed in terms of a percentage of allowable error in a time period. Using the performance indicator with its associated standard, the analyst determines what error rate should be allowed, based on agency directives, historical records of how well the government provided the service, or they can be established by management decision.
(4) Whatever the source of the entry, the analyst must question whether the acceptable quality level is realistic and represents how well the service must be provided under contract. The example of acceptable quality levels shown in figure 2-9 summarizes all the performance information that is generated by job analysis. Charts like this are critical for all further decisions about the SOW and the surveillance plan.
(5) After these charts are filed in, the analyst must cross out the indicators that apply to contractor internal management. What remains will be the performance indicators, standards, and tolerances (acceptable quality level) that tell how well the contractor must provide the output service. In the example in figure 2-9 all values would be eliminated
except average response time. All other times under a firm fixed price vehicle operations and maintenance contract relate strictly to internal contractor management indicators.
2-8. -- Governing Directives.
For each of the services to be provided under contract, the following steps are done:
a. Catalogue. The analyst needs to catalogue all the manuals, regulations, and other higher government agency and local level guidance that pertain to the services. (These documents often refer to other regulations, manuals or technical orders which must also be listed). The list that results should be arranged similar to figure 2-10. List the title and the date of publication. If only parts of the directive apply, Note these parts in the directive column. If the directive has been mentioned in a document previously listed, cite that document in the “Referenced In” column. This data will be needed later in deciding whether a directive or part of a directive applies to the proposed contract effort.
b. Applicability. Each service ordinarily has its basis in some governing directive that tells how the job is to be done, in varying degrees of detail, when it is performed in-house. In other words, directives often specify procedures.
(1) At this point, the analyst must decide whether those procedures are to be mandatory on the contractor (that way the government would do it). To do this, the analyst reviews the list of directives and checks the proper box on the sheet to show whether each directive will be mandatory or advisory upon the contractor.
(2) When only parts of directives appear to be mandatory, the analyst must decide either to reference that part of the directive, or extract the information and place it in the SOW as a procedure. If there is no clear directive, the analyst must decide if a procedure is require for if simply stating the activity and its performance value is sufficient.
(3) As a rule, procedures and directives must not be specified. Reliance must be placed on stating the desired output with a performance value. If a regulation is mandatory, reference it only when it is too bulky to extract and include in the SOW in full text.
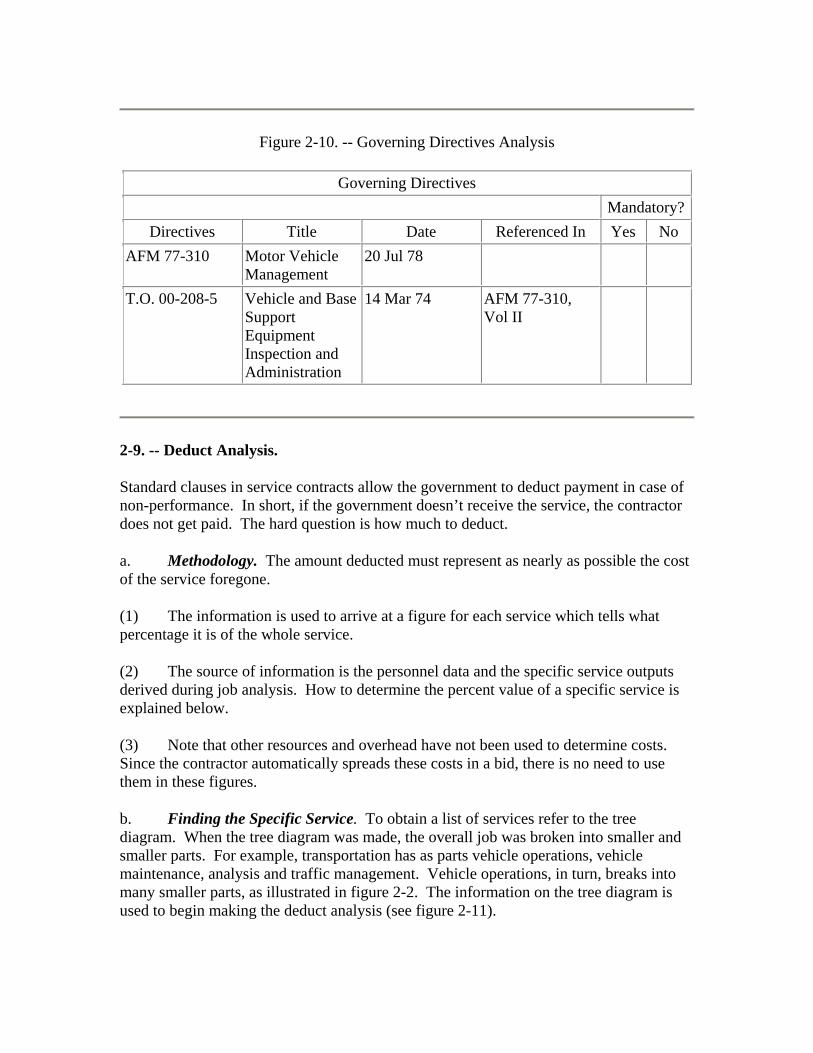
Figure 2-10. -- Governing Directives Analysis
Governing Directives Mandatory?
Directives Title Date Referenced In Yes No AFM 77-310 Motor Vehicle
Management 20 Jul 78
T.O. 00-208-5 Vehicle and Base Support Equipment Inspection and Administration
14 Mar 74 AFM 77-310, Vol II
2-9. -- Deduct Analysis.
Standard clauses in service contracts allow the government to deduct payment in case of non-performance. In short, if the government doesn’t receive the service, the contractor does not get paid. The hard question is how much to deduct.
a. Methodology. The amount deducted must represent as nearly as possible the cost of the service foregone.
(1) The information is used to arrive at a figure for each service which tells what percentage it is of the whole service.
(2) The source of information is the personnel data and the specific service outputs derived during job analysis. How to determine the percent value of a specific service is explained below.
(3) Note that other resources and overhead have not been used to determine costs. Since the contractor automatically spreads these costs in a bid, there is no need to use them in these figures.
b. Finding the Specific Service. To obtain a list of services refer to the tree diagram. When the tree diagram was made, the overall job was broken into smaller and smaller parts. For example, transportation has as parts vehicle operations, vehicle maintenance, analysis and traffic management. Vehicle operations, in turn, breaks into many smaller parts, as illustrated in figure 2-2. The information on the tree diagram is used to begin making the deduct analysis (see figure 2-11).
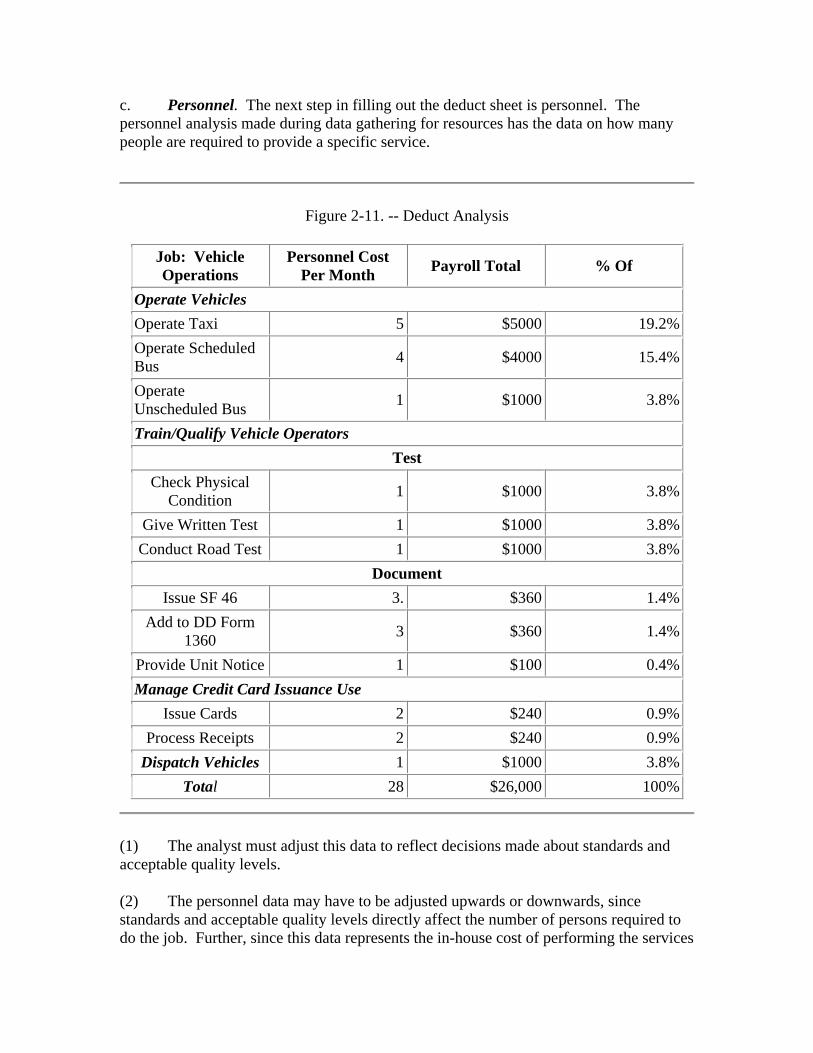
c. Personnel. The next step in filling out the deduct sheet is personnel. The personnel analysis made during data gathering for resources has the data on how many people are required to provide a specific service.
Figure 2-11. -- Deduct Analysis
Job: Vehicle Operations
Personnel Cost Per Month Payroll Total % Of
Operate Vehicles Operate Taxi 5 $5000 19.2%Operate Scheduled Bus 4 $4000 15.4%
Operate Unscheduled Bus 1 $1000 3.8%
Train/Qualify Vehicle Operators Test
Check Physical Condition 1 $1000 3.8%
Give Written Test 1 $1000 3.8%Conduct Road Test 1 $1000 3.8%
Document Issue SF 46 3. $360 1.4%
Add to DD Form 1360 3 $360 1.4%
Provide Unit Notice 1 $100 0.4%Manage Credit Card Issuance Use
Issue Cards 2 $240 0.9%Process Receipts 2 $240 0.9%
Dispatch Vehicles 1 $1000 3.8%Total 28 $26,000 100%
(1) The analyst must adjust this data to reflect decisions made about standards and acceptable quality levels.
(2) The personnel data may have to be adjusted upwards or downwards, since standards and acceptable quality levels directly affect the number of persons required to do the job. Further, since this data represents the in-house cost of performing the services
in the SOW, the analyst must also adjust the data to show what staff the contractor would probably use to perform the service.
(3) This data can not be used for making the deduct analysis. Note that no entry is made on the line of a service that has subparts. Entries are only made for the subparts, since there are specific services. (For example, no entry is made for “operate vehicles’ since this service is made up f the specific services of operate taxi, operate scheduled buses, operate unscheduled buses.
d. Payroll Cost Per Month. Payroll cost per month is the basis for deciding how much each specific service costs in reference to the total job. One need not use exact payroll costs. Rather, use the service contract wage rates appropriate to the service. Again, do not include costs for the services that have subparts. These are noted by X’s on figure 2-11.
e. Percent Of Total. The percent of total column on the deduct sheet tells how much each specific service or part represents in terms of the service contract. To arrive at this percentage, add all the payroll costs to get a total and divide each specific service payroll cost by the total cost. Enter each resulting percentage in the percent of total column.
f. Negotiated Contracts. The cost figures created for deduct analysis can be used to evaluate contractor proposals. The contractor should be asked to make a proposal for each specific service. Once these costs are negotiated, they can be used to adjust the original deduct estimates.

Chapter 3
Writing the Statement of Work
3-1. -- Statements of Work.
Job analysis makes writing a statement of work (SOW) relatively easy. Once data has been gathered and analyzed, only two things remain to be done. The first task consists of actually writing a SOW that states what is required. The second task entails writing a QA surveillance plan that complements the SOW. This chapter addresses the first task.
3-2. -- Writing the SOW.
Considering all the data gathering, analysis, and decisions that have been done to this point, writing the SOW should be easy. All that remains is to use a format or outline the compose words that will be used to express the requirement. Each of these tasks is described below. A note of caution: do not repeat material in the SOW that is already included in other parts of the contract, for example, General Provisions, Special Provisions, etc.
3-3. -- Service Contract Format.
Prior to beginning writing the SOW, an outline must be developed to provide structure for the document. The following major sections provide the basis for an outline and are in Section F in most service contracts. The standard numbering scheme for service contracts is numeric (for example, 1, 1.1, 1.1.1).
a. General (Section F-1). This section provides a broad overview to the SOW. It contains a part describing the scope of work. Personnel related matters come under this heading. Most importantly, this section contains a part that states clearly the contractor’s specific responsibility for quality control. (This quality control part is in addition to what may be in the standard clauses in the general provisions of a given contract). This part of the SOW tells the contractor what specific kind of quality control is required for the contract.
b. Definitions (Section F-2). A definitions section includes all special terms and phrases used in the SOW. The definitions must clearly establish what is meant so that disinterested parties will fully understand them.
c. Government-Furnished Property and Services (Section F-3). If the Air Force will provide any of these for the contractor’s use in providing the required services, use this section to describe what will be given. If the list(s) is fairly extensive, make it into a technical exhibit(s) and include at the end of the SOW, rather than in the main body. Use
the data gathered concerning facilities, equipment, and material as the basis for these lists.
d. Contractor-Furnished Items (Section F-4). In this section the analyst describes material and equipment that the contractor must provide. As with government furnished property, if the lists are lengthy, they are made a technical exhibit and referenced in this section.
e. Specific Tasks (Section F-5). Specific tasks are the heart of the SOW. All of the work done under job analysis will find its way into this section. To write this section, go back to the tree diagrams and activity analysis sheets which were made in chapter 2.
(1) After the activities that were selected for contracting have been grouped and arranged as they appear in the tree diagram, writing this section is simply a matter of putting the activities down in a logical sequence.
(2) At the same time this is being done, group the performance indicators, standards and acceptable quality levels together in the same logical way for inclusion on a Performance Requirements Summary. Include them as a technical exhibit to the SOW. (See figure 3-1 for an example of this technical exhibit). At this time, all of the columns can be filled in except the method of surveillance, which is not filled in until the surveillance plan has been developed. The other entries come from performance analysis and the deduct analysis (figures 2-9 and 2-11).
f. Applicable Technical Orders, Specifications, Regulations, and Manuals (Section F-6). During job analysis, the analyst produced a list of applicable directives. Include the list in this section; include the dates of the directives. Tell what happens when a directive changes during the life of the contract. Also, state whether each directive is mandatory or advisory on the contractor.
g. Technical Exhibits. Some items are too bulky to include in the main body of the SOW. Also, the analyst may want to include information helpful to the contractor. Technical exhibits are used for both these purposes.
3-4. -- Composition.
The SOW becomes a part of the contract and is a contractually binding document on both the contractor and the Government. Since the written words translate into cost and profit, every word will be scrutinized, and, if each requirement so that the contractor’s advantage does not become the government’s disadvantage.
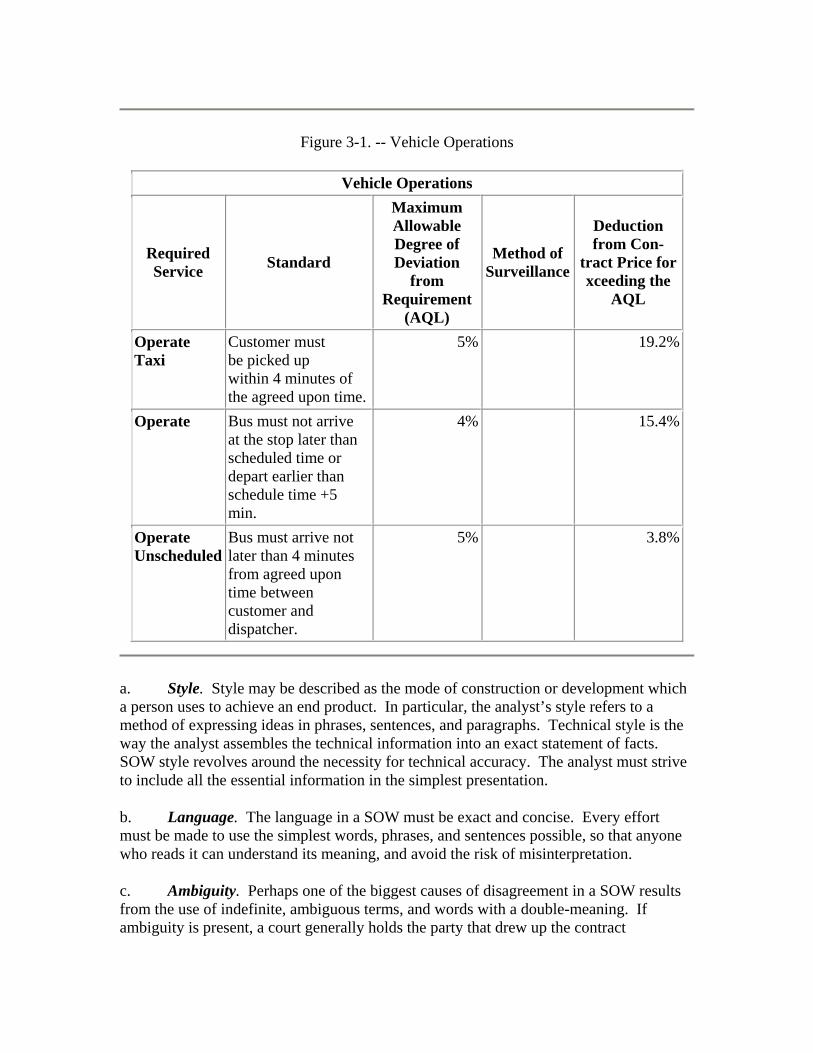
Figure 3-1. -- Vehicle Operations
Vehicle Operations
Required Service Standard
Maximum Allowable Degree of Deviation
from Requirement
(AQL)
Method of Surveillance
Deduction from Con-
tract Price for xceeding the
AQL
Operate Taxi
Customer must be picked up within 4 minutes of the agreed upon time.
5% 19.2%
Operate Bus must not arrive at the stop later than scheduled time or depart earlier than schedule time +5 min.
4% 15.4%
Operate Unscheduled
Bus must arrive not later than 4 minutes from agreed upon time between customer and dispatcher.
5% 3.8%
a. Style. Style may be described as the mode of construction or development which a person uses to achieve an end product. In particular, the analyst’s style refers to a method of expressing ideas in phrases, sentences, and paragraphs. Technical style is the way the analyst assembles the technical information into an exact statement of facts. SOW style revolves around the necessity for technical accuracy. The analyst must strive to include all the essential information in the simplest presentation.
b. Language. The language in a SOW must be exact and concise. Every effort must be made to use the simplest words, phrases, and sentences possible, so that anyone who reads it can understand its meaning, and avoid the risk of misinterpretation.
c. Ambiguity. Perhaps one of the biggest causes of disagreement in a SOW results from the use of indefinite, ambiguous terms, and words with a double-meaning. If ambiguity is present, a court generally holds the party that drew up the contract

responsible. Since the government writes its contracts, it is responsible for any ambiguity that may arise.
d. Misused Words and Phrases. Often the analyst inadvertently changes an intended meaning in the SOW through the misuse of certain words and phrases. The following are designed to eliminate some of the misuse.
(1) Use of “shall” and “will”. The term “shall” is used to specify that a provision is binding. The word “will” is used to express declaration of future action on the part of the purchaser.
(2) Use the emphatic form of the verb. That is, tell the contractors they must or must not do something. The emphatic form of the verb will insure that one is giving directions, not suggestions, to the contractor.
(3) Do not use “any”, “either”, “and/or”. These words imply a choice that the contractor may take. It is better to avoid them unless a choice is to be made. The word “both” can often be substituted for those words.
(4) Use of Pronouns. The use of pronouns is usually regarded as dangerous in the SOW. It is better to repeat the noun and avoid misinterpretation.
(5) Consistent Terminology. The same words and phrases must be used throughout the SOW. This is especially true when referring to technical terms and items; for example, always refer to a particular part by the same name.
(6) Numerals. When numerals are used on the drawings and illustrations, use them in the SOW, rather than spelling out the number.
e. Spelling. Most words have only one acceptable spelling; however, throughout the English language there are words that can be spelled several ways. To avoid misunderstanding, adopt the standard spelling.
f. Punctuation. To keep the SOW clear, use simple, short, and concise sentences, so that only the minimum punctuation is needed. A well-planned word order will require a minimum of punctuation. A rule for the analyst should be: When extreme punctuation is necessary, rewrite the sentence.
g. Abbreviations. For the analyst, abbreviations serve as a form of shorthand. Abbreviations can make complex terms easy and precise. However, many misunderstandings also arise from the use of abbreviations because the reader is not always familiar with them. The first time an abbreviation is used in text, show it in parenthesis immediately after the spelled-out word or phrase. This readily defines the abbreviation for further use.

h. Sentences. Sentences in a SOW are often spiced with legal phraseology and high sounding words. This type of writing is difficult to read and understand. Clarity is the analyst’s overriding concern. The analyst must try to construct logical sentences that which are exact and concise. It is better to eliminate a long and involved sentence by rearranging it into two or three short, simple sentences limited to a single idea or thought. Good writing of any type is dependent upon natural order. The word order of a sentence tells the reader the function of each word in the sentence. The simple sentences one strives for in a SOW are based on the traditional order of subject-verb-complement or object.
i. Paragraphs. Use a paragraph to state a single idea and elaborate on it. Even though it may appear anywhere in the paragraph, it is best to state the idea (topic sentence) at the beginning, so that the reader can grasp it immediately. The topic sentence, then, is the framework to which other sentences are added to develop and support the original idea. The ideal length of a paragraph will vary; however, it is generally accepted that the maximum should be from 80 to 100 words.
3-5. -- Data Submissions.
Service contracts often require the contractor to submit data, forms, and other reports. These requirements are included as an exhibit to the statement of work. Use a DD Form 1423, Contract Data Requirements List to list them. Include the description of a data item on DD Form 1664, Data Item Description (see examples in figures 3-2 and 3-3). Other agencies must use their forms that are equivalent to the DD Forms 1423 and 1664.
Note: Working Copies of DD Form 1423 and DD Form 1664 are included in the Forms Document, See Hardcopy to view sample forms.

Chapter 4
The Surveillance Plan
4-1. -- Basic Approach.
This chapter describes the major contents of a surveillance plan. There are three key ideas that are the basis for a surveillance plan.
a. Management By Exception. Quality assurance relates to the output service provided by the contractor. As pointed out earlier, the output service can result either from a contractor-developed procedure or from a government specified procedure. When the procedure is specified by the government, compliance with the procedure is the desired output service.
(1) When the output is based on a contractor developed procedure, the procedures are only looked at on a by-exception basis; that is, satisfactory performance of the output service as specified in the contract normally indicates that the contractor is using satisfactory procedures. The government should be concerned only when services are not adequately performed.
(2) In this case, the inspector looks beyond the level of services provided only to determine if the problem is caused by the government or the contractor. If government provided items to the contractor’s operation (such as, parts, equipment, or facilities) are at fault, action must be taken through government channels to correct the problem. No action will be required of the contractor. When the problem is the contractor’s fault, the contractor is told to take corrective action.
b. Performance Indicator. The level of contractor provided services is monitored by checking the performance values in the statement of work (SOW). As described in chapter 2, a performance value is a feature of the service that can be measured by a number. For example, two important performance values in vehicle maintenance and vehicle operations are vehicle out-of-commission (VOC) rate and taxi response time.
c. Problem Location. When performance values show that the service is not adequately performed, the QAE uses decision tables to locate the problem. The tables provide a logical sequence to find the problem cause. Basically, they are a set of pointers which should find the problem’s source in a step-by-step fashion. The construction and use of decision tables re described in paragraph 4-4b.
4-2. -- Surveillance Information Sources.
There are four principal sources of information for surveillance: management information systems, random sampling, checklists, and formal customer complaints. The following sections describe the information sources in detail.
a. Management Information Systems. In a few instances, an existing management information system (MIS) may be available as a means of surveillance. When a MIS is available, as in the case of the Air Force’s vehicle integrated management system (VIMS) in the vehicle maintenance area, it can collect information on performance values which can be used instead of random sampling data.
(1) Management information systems usually collect information for 100 percent of the activities for a specified period of time. This information can be compared to a contract standard. On the basis of this comparison, performance can be judged and performance for the specified period accepted or rejected.
(2) For example, the vehicle out-of-commission (VOC) rate is computed every month by the VIMS. A simple comparison of the VOC rate with the maximum acceptable VOC in the SOW explains a great deal about the level of maintenance service supporting the base vehicles and organizations.
(3) By way of caution, however, one must check the data input into a MIS if the system is maintained by the contractor. If one is going to use a MIS to check the contractor, make sure the MIS contains reliable data.
b. Random Sampling. The most frequently used way of service contract surveillance is random sampling. Services are sampled by the QAE to determine if the contractor’s level of performance is acceptable. Acceptance sampling is done, basically, to determine a course of action: that is, whether to accept or reject the contractor’s level of performance during a given period of time. If it rejects performance, certain actions are started. If it accepts performance, no action is taken.
(1) The basis for doing random sampling is MIL-STD-105D, Sampling Procedures and Tables for Inspection by Attributes which is widely understood and used by both the government and contractors. It is based on the concept of an attribute. An attribute is a feature of a service which either does, or does not, match a standard (For example, a taxi is on time or it is not on time).
(2) When sampling by attributes, a certain number of observations will match the standards and the remaining number will not match. Therefore, attribute sampling is useful for describing how a job is done, in terms of defects per hundred observations, or percent defective. Using this concept, sampling for a performance indicator can be developed by proceeding through a number of formal steps based on MIL-STD-105D. The use of these concepts is described in paragraph 4-3, Sampling Plan.
c. Surveillance Checklists. Checklists are also used to check contract performance. They must be used sparingly, however. The use of the MIS and random sampling are preferred information sources. Checklists help in surveillance of contract requirements that happen infrequently. (For example, if a contractor is required to perform a service once a month, this service would be included on a checklist). Any service that is not provided on a daily basis should be considered for inclusion on a checklist unless a MIS can be used to determine the quality of the service.
d. Formal Customer Complaints. Even the best surveillance plan will not allow the QAE to check all aspects of the contractor’s performance.
(1) Formal customer complaints are a means of documenting certain kinds of service problems. The way to get and document customer complaints needs to be carefully planned by the persons checking the service contract.
(2) Customer complaints are not truly random. They are seldom used to reject a service or deduct money from the contractor.
(3) When random sampling is the chosen method of surveillance, a customer complaint cannot be used to satisfy a random observation. However, it can be used as further evidence of unsatisfactory performance if random sampling shows that the specific service is unsatisfactory. These complaints can be used to decide if action other than a deduction should be taken.
(a) Getting Customer Complaints. An aggressive customer complaint program, once established, needs to be briefed to every organization that receives the contractor’s services. An operating instruction should be given to each organization outlining the customer complaint program, the format and the content of a formal customer complaint, and the actin which can be expected from those assigned to watching and managing the service contract.
(b) Documenting the Customer Complaint. Normally, each customer complaint is brought, either in person or by telephone, to the person checking contract performance. Enter information about the complaint into a Customer Complaint Record, similar to the sample shown in figure 4-1. The record contains the following information:
1 Date and time of complaint. 2 Source of complaint -- organization and individual. 3 Nature of complaint (narrative description) 4 Contract reference of complaint related services. 5 Valid complaint (Yes or No). 6 Date contractor informed of complaint. 7 Action taken by contractor. 8 Signature of person receiving and validating the complaint.

4-3. -- Sampling Plan.
As a rule, a plan contains information on the acceptable quality level, lot size, sample size, and rejection level. It states the number of units form each lot to be inspected (that is, the sample size). It also states the criteria for determining the acceptability of the lot (acceptance and rejection numbers). This information is used to build the sampling guide which are the major products in a surveillance plan for a service contract.
a. Beginning the Plan. To begin building a sampling plan, go to the Performance Requirements Summary developed during the “Write Statement of Work” step, chapter 3, figure 3-1.
(1) This chart contains the required services, the standards, and acceptable quality levels. At this time decide how the services will be checked (what information source or method of surveillance will be used).
(2) Show these decisions on the chart. For each service where random sampling is used, complete the steps described below.
Figure 4-1. -- Customer Complaint Record
Customer Complaint Record Date and time of Complaint: 21 Jan 1979 /:1005
Source of Complaint:
Organization: 382 Bomb Wing/LGC
Individual: Capt. John Murry Nature of Complaint: Called wrecker and it did not arrive until 3 hours after the request. Contract Reference: F5, para. 5.1.1.2.5 and Performance Requirements Summary Validation: Contract requires a 1 hour response time. complaint is valid Date and Time Contractor Informed of Complaint: 21 Jan 79/: 1030 Action Taken by Contractor:
Contractor had a person out sick and did not have a back up driver. He now has not developed a roster of back up drivers who can operate a wrecker. Received and Validated By: H. Smyth/QAE

b. Deciding on the Acceptable Quality Level (AQL). The AQL is the highest number of defects per hundred, highest percent defective or highest number of defects that can be allowed for any service performance indicator. There are only a limited number of AQLs listed in MIL-STD-105D but, in virtually all cases, one will be close enough to control the contractor’s level of service.
(1) The first step in designing a sampling plan under MIL-STD 105D is the selection of a realistic AQL. No service can be perfectly performed. The AWLs placed on the Performance Requirements Summary in figure 3-1, must be adjusted at this time.
(2) Find the closest AQL from figure 4-2 and use it to replace the original AQL on the Performance Requirement Summary. For example, the AQL for taxi service might have been 5 percent. This would be changed to 4 percent of 6.5 percent since 5 percent does not appear in the figure.
c. Determining the Lot Size. To determine the sample size, the lot size must be known. the lot is how often the contractor provides the service in a period of time.
(1) To determine the lot size, estimate (or count) the frequency of the service to be sampled, during the period it is to be sampled. Thus, if scheduled bus service timeliness is the service being sampled, and a sample is taken each month, the lot size is the number of times that are available during the month to observe bus timeliness. In this case, it would be the number of times the buses go around all the routes each day, multiplied by the number of days in each moth on which the bus routes operate.
(2) In the case of workorders, the monthly lot size can be estimated from historical information on file. The projected workload data gathered in chapter 2 is used to help determine lot sizes.
d. Determining the Sample Size. Use figure 4-3 to identify an appropriate sample size for a given lot size.
(1) Use the normal sample size column u unless there is a limited number of QAEs or unless the cost of an inspection suggests the use of the medium or small sample size column.
(2) Use the medium or small sample size, if inspections for a particular service are lengthy or hinder the contractor’s ability to provide service to customers.

Figure 4-2. -- List of MIL-STD-105D Acceptable Quality Levels
Allowable Acceptable Quality Levels 0.010% 1.0% 0.015% 1.5% 0.025% 2.5% 0.040% 4.0% 0.065% 6.5% 0.10% 10.% 0.15% 15.% 0.25% 25.% 0.40% 40.% 0.65% 65.%
Figure 4-3. -- Sample Size
Lot Size Normal Sample Medium Sample Small Sample 2-8 2 2 2 9-15 3 2 2 16-25 5 3 3 26-50 9 5 5 51-90 13 5 5 91-150 20 8 8 151-280 32 13 13 281-500 50 20 13 501-1.200 80 32 20 1,201-3,200 125 50 32 3,201-10,000 200 80 32 10,001-35,000 315 125 50 35,001-150,000 500 200 80 150,000-500,000 800 315 80 500,000 and over 1250 500 125

e. Selecting the Rejection Level. Use MIL-STD-105D to identify the acceptance and rejection level for the sample size (see figure 4-4. To use the figure, begin with the known values for the AQL and the sample size.
(1) Find the selected sample size (in the sample size column) and read across that line to the column for the selected AQL. At that point there will either be two numbers or an arrow pointing up or down.
(2) If there is an arrow, follow the direction of the arrow until it leads to a pair of numbers. Of the two numbers at the intersection or at the end of the arrow, the number on the left (AC or accept) indicates the maximum number of defects which can occur in a sample and still permit the total size of 20, the sample size would become 32.
(4) The number on the right (Re or reject) indicates the minimum number of defects that occur in a sample which causes the total group or lot to be judged unacceptable. For example, suppose the sample size is determined to be 32 and the AQL has been set at 6.5 defects per hundred. Find the number 32 in the sample size column and read across that line until the AQL column for 6.5 has been reached. The two numbers at that intersection are 5 and 6.
(a) In other words, the number on the left, 5, is the number of defects which can be found in a sample and still permit acceptance of the lot.
(b) The number 6, to the right of 5, is the smallest number of defects needed to declare the lot unacceptable and subject to further check, using the decision tables.
4-4. -- Developing the Sampling Method.
The final thing to be decided in sampling is how the sample will be drawn. The objective in the method is to insure that the sample is random (that is, that all services have an equal chance of being selected). To achieve random selection, use a random number table, as explained in the following examples (see attachment 1 for the whole table). Most items will fall into one of these examples.
Figure 4-4. -- MIL-STD-105D Acceptance, Rejection Levels for Normal Inspection
Note: See Hardcopy for figure 4-4

Figure 4-5. -- How to Use a Random Number Table

a. Use of the Random Number Table. The random numbers in figure 4-5 are arranged in groups of five numbers (51259, 77452, and so on).
(1) To use the table, begin by picking at random a group of numbers on any page of the table. This is usually done by closing the eyes and pointing with a pencil or finger to some initial group.
(2) To identify additional random numbers, follow a pattern. Go along a given line to its end and then along the next line to its end and so on through the table until enough numbers have been selected or until the table ends.
(3) If the table ends and there are still more numbers to select, go back to the beginning of the table and continue using the same pattern. Use various patterns alternately; for example, use lines for one sample, use columns for the next sample, and use a diagonal pattern for the third sample.
b. How to use the Random Number Table to Identify a Random Sample of Consecutively Numbered Workorders. Suppose one has to identify a random sample of 3 workorders for inspection. This can be done at the beginning of the month (before the workorders are written) or at the end of the month (to select workorders already on file).
(1) If there are, or might be, 200 workorders to select from, then one begins by listing the lowest workorder number (known or projected). This could be #001 or possibly #743, for example.
(a) List the highest workorder number (known or projected); in this case, it could be #200 or #943. With these boundaries now enter the random number table to the first group of numbers. For this example, use workorders numbered #743 to #943.
(b) If the last three digits in the first group of random numbers is not between 743 and 943, discard that group of numbers and go to the next group.
(2) Again, using figure 4-5, if one starts at the initial 77452, disregard the two numbers to the left of the three significant digits, or in this case, 77. The remaining number is 452. Since this is not between 743 and 943, go to the next group in the same line which is 16308, again, discard the leftmost two numbers, and the number is 308. This is again too low.
(3) Go to the next number, 60756. The last part of this number, 756, falls within the brackets one is looking for, so workorder 756 is selected to be sampled. The next random number group is 92144. Since 144 is not within the brackets, move to the next group 49442. Again, 442 is not within the brackets and therefore is not selected to be sampled.
(4) Tlected.his process would be continued until three workorders are se

c. How to Use The Random Number Table to Identify Random Sample From a List. If a number of items need to be sampled that are not consecutively numbered, the simplest solution is to list the identifiers, for all the items in the lot, in a column, on a piece of lined paper.
(1) Next, number the lines consecutively, beginning with the number one hundred. Now use the random number table to draw the sample from the line numbers. A selected line number leads to the identifier located on that line and that identifier tells which item to sample. For example, if one chooses to sample a set of workorders with attached sales slips, one is not going to have to have a set of consecutively numbered workorders because not every workorder has a sales slip attached.
(2) List the workorders with sales slips in a column, number each line in the column, and randomly select enough line numbers to make up the sample.
d. How To Use The Random Number Table to Identify a Random Sample of Days. Suppose one wants to identify 4 days in the month on which to sample something. The days of the month can be numbered 01 to 31 (or less, as appropriate). Begin in the random number table in figure 4-5 at 77452.
(1) It is best to use a starting point different from the one used in the previous example but for the purpose of this example it is being used again.
(2) One can move down the column from random number group to random number until the first number between 01 and 31 is spotted. In this case, it is 23216 or, using the rule to discard the numbers to the left of the number or digits, simply 16. Thus the 16th day of the month is selected for sampling.
(3) Continuing in this fashion, one discovers that 58731, or simply 31, or the 31st, is the next day for sampling. Proceed in this manner until the four days for sampling have been identified
(4) If it is not desirable to sample on weekends, discard those days selected that happen to fall on a weekend and continue that selection until the proper number of days has been selected.
e. How to Use the Random Number Table to Identify a Random sample of Times of Day. If one wants to select random times of day to sample a service such as taxi or bus service, use the 24 hour clock.
(1) If there are any constraints during each 24-hour period, take them into consideration. For example, suppose that base bus service operates between 0700 and 2345. In this case, go through the number table until one finds a group of four numbers that correspond to an acceptable time between 0700 and 2345. Again, using figure 4-5, and proceeding across the line from the initial number, one comes to 60756 or 0756 hrs as the first random time.

(2) The next random number 92144 or 2144 hrs. The number is good and so one schedules an observation for 2144 hrs.
(3) Proceed in this manner until the desired number of sample time shave been identified.
f. How to Insure Variety in the Use of the Random Number Table. The use of variety in the random table ensures that detectable patterns do not occur.
(1) Besides starting at different random points and alternating the patterns for finding a string of random numbers, the user may, at some point in time, wish to use the first significant digits instead of the last.
(2) For instance, in the random number group 77452 one has customarily used the last three digits (that is, 452) when looking for a random number with three digits. But there is no reason why one could not for a period of time use the first three digits, of 774.
(3) Success in using the tables requires consistency but also variety. the above information should ensure that the tables are properly used and that the sample is randomly drawn.
4-5. -- Surveillance Plan Products.
Several written documents are included in a surveillance plan:
a. Sampling Guides. A sampling guide is used for surveillance. It is used in a surveillance plan to present the information needed to sample the performance of a particular service. Information for the sampling guide is developed while the sampling information is being derived for the sampling plan. The steps involved in developing sampling information are described in paragraph 4-3. As shown in figure 4-6, a sampling guide has these sections:
(1) A statement of the AQL and its meaning in layman’s terms.
(2) The lot size for sampling.
(3) The sample size.
(4) A description of the sampling procedure which tells how the service will be sampled.
(5) An explanation of the inspection procedure which tells what will be checked during the inspection of the sample.
(6) Acceptable performance criteria which states the acceptance and rejection levels.

b. QAE Decision Tables. Once a problem has been discovered, the inspector must turn to a decision table and use the information in that table to aid him in finding the source of the problem. The decision table lists the symptoms of the problem and identifies the possible sources of the problem. Questions are established for each potential source to determine the contributing factors. A decision logic entry is worked up for each required service. As soon as it is considered satisfactory, the information is transferred to the decision table. An example of a decision logic entry is shown as part of a decision table in the sample in figure 4-7.
c. Checklists. There are two main uses for checklists.
(1) Tally Checklists. Tally checklists are used to document all sample observations made during a sampling period. Checklists may be preprinted with any format which contains the following information:
(a) Contract requirements -- a statement of the service being inspected.
(b) Date, time, entry for each observation.
(c) Observation identifier of applicable workorder number, bus stop, or sales slip number, meal period, etc.
(d) Result of observation -- satisfactory or defective.
(e) Any pertinent comment for an observation. An example of a checklist for sampling is shown in figure 4-8.
(2) Surveillance Activity Checklists. When a specific service or procedure occurs rarely or is not important enough to survey on a continuing basis, use a Surveillance Activity Checklist. This type of checklist must be prepared and included in the surveillance plan. An example of this kind of checklist is shown in figure 4-9.

Figure 4-6. -- Sampling Guide
VO Sampling Guide #3 Vehicle Condition Monitoring
1. Acceptable Quality Level (AQL): TO%
In the long run there must be no more than 10 defects per hundred vehicles.
2. Lot Size: _____ vehicles operated by the contractor.
3. Sample Size: _____ vehicles operated by the contractor.
4. Sampling Procedure:
At the beginning of the month, list the registration numbers of all contractor operated vehicles on a sheet of ruled paper. Beginning with the number 100, number the lines on the paper to correspond with the vehicle registration numbers. Using the random number table select line numbers equal to the sample size. The vehicle registration numbers on these lines indicate the vehicles to be sampled during the month. Schedule the inspections evenly over the month.
5. Inspection Procedure:
Inspect the vehicles using vehicle/equipment discrepancy and maintenance report as a guide (see AFM 77-310, Vol II, Chap 6). Record defects per vehicle for each of the inspected vehicles. Any defects found not already noted by the contractor shall cause the observation to be recorded as unsatisfactory.
6. Performance Criteria:
a. Performance is acceptable when _____ or less defective vehicles are discovered per month. b. Performance is unacceptable when _____ or more defective vehicles are discovered during a month.
7. Phase-In-Period: During the first two months of the contract the following AQL’s (paragraph 1) and performance criteria (paragraph 5) apply:
a. AQL: 15%. b. Performance is acceptable if _____ or fewer defects are discovered per month. c. Performance is acceptable if _____ or more defects are discovered per month.

Figure 4-7. -- QAE Decision Table
If the Contractor’s Deficiency is:
Probable Cause Factors/Impacting
Conditions are:
Which CouldResult From:
Suggested Review Procedures and/or
Preventive Measures is/are:
Vehicle out of commission hours too high
High vehicle downfor maintenance hours (VDM)
Poor control over work documentation
Review PCNs N310032, N310030, or N310031 for individual vehicles reflecting VDM hours in excess of the reporting period available hours. If this condition exists, it is usually found that two or more work orders were in “open” status for the same vehicle at the same time. Normally results from failure to ensure “close” of a particular work order, and not reviewing the PCN N310018, Work Order Master File Status Report Previous to initiating a new work order. (Frequently noted when two or more work orders were required to satisfy contract maintenance work requirements). Are changes from VDM to VDP status accomplished in a timely manner?
Insufficient manning
Review PCN N310032 for individual vehicle data reflecting a very low ratio of direct labor compared to VDM hours accrued. One prime indicator of this problem prevailing is when “Estimated Times in Commission” (ETIC), is constantly slipped. (When work is hardly ever completed within time-frame allotted by labor hour

estimates.
Improper control over work flow
Determine the appropriateness of workflow prioritizing and the disruptive effect caused by over-reacting to unrealistic application of priorities, such as shifting technicians from one vehicle to another, shuffling vehicles from one location to another for shop spaces, etc.
4-6. -- Contract Administrators Plan.
The contract administrator has an obligation to see how well the QAE is doing the job. The contract administrator must also make some independent checks of contractor performance, preferably by using the same techniques that go into the design of the QA surveillance plan. (This plan is completed at the same time as the surveillance plan). As a minimum this plan must call for a quarterly review of the QAE’s use of sampling guides and an annual review of surveillance activity checklist items.
Figure 4-8. -- Sample Tally Checklist
Vehicle Operations Sampling Guide #3 Vehicle Conditioning Monitoring
Registration Number Date Time Satisfactory Unsatisfactory Remarks
B 7305 2 Oct 1530 X
B 9763 2 Oct 1540 X Hood latch KLG
B 8764 2 Oct 1545 X B 0010 5 Oct 0900 X B 8764 5 Oct 0915 X B 7707 5 Oct 1345 X B 7706 5 Oct 1400 X B 9654 8 Oct 1000 X
B 8752 8 Oct 1025 X Door handle KLG

B 3103 8 Oct 1045 X B2758 8 Oct 1600 X
Figure 4-9. -- Surveillance Activity Checklist
Surveillance Activity Checklist (To be performed (Daily)(Weekly)(Monthly), etc.) Vehicle Authorization Utilization Board (VAUB)
Contract Requirement
Contract Paragraphing
Method ofSurveillance
Date Accomplished
Where Accomplished
Compliance
The contractor is required to hold a Vehicle Authorization Utilization Board (VAUB) quarterly.
F-5.5.1.2.3 The contractor should have in his possession a copy of the VAUB minutes. There is no specific format for these minutes in AFM 77-310 but should conform to the standard format in AFR 10-1. Minutes should adequately describe and document actions taken by VAUB.
The contractor is required to develop a vehicle priority list
F-5.5.1.2.3.5 Verify approved priority list. It should have the board

for VAUB approval.
president’s signature and date.

Chapter 5
Doing Surveillance
5-1. -- Surveillance Methods.
This chapter tells how to do surveillance once the plan is written. It tells how to build a monthly schedule, how to use the surveillance plan, and what to do when there is poor contractor performance. This chapter applies to Quality Assurance Evaluators (QAEs) and contract administrators.
5-2. -- Building a Schedule.
A surveillance plan is organized to facilitate use by the QAE. The QAE is responsible for developing a monthly schedule for activities, based on the surveillance plan’s requirements. Complete the Quality Assurance Evaluator Schedule by the last workday of the preceding month and send a copy to the contract administrator and the functional area chief for their information and review. Each QAE builds a schedule by filling in the blocks on the schedule. Specific instructions for filling out the schedule are provided below.
a. Quality Assurance Evaluator Schedule. An example of a surveillance schedule is shown in figure 5-1. The left-hand side of the schedule divides the sheet into days of the week. This example shows only a 7-day schedule. The QAE must make up enough sheets to include each day of the moth. Along the top of the schedule, insert the items to be checked during the month. Along the bottom of the schedule, indicate the number of observations to be made during the month (that is, how often a MIS is checked, how many samples will be taken, how often a surveillance checklist will be used).
b. Filling In And Updating the Schedule. To fill in the inspection schedule, the QAE refers to the sampling guide for each service being monitored. The sampling guide is used with the random number table to determine the inspections (observations) to be made during the month (see chapter 4, paragraph 4-4).
(1) Contract surveillance must cover all hours of operation. Random observations are scheduled at night, on weekends and holidays when services are performed during these periods. Areas that are monitored on a set schedule (for example, VIMS standards and analysis reports) are included in the monthly schedule. This monthly schedule shows where and what the QAE is monitoring at all times.
(2) Post any changes to the schedule weekly and send copies to the contract administrator and to the functional area chief. Document and explain the reasons for each change. Actual surveillance activity recorded on the surveillance checklist must be comparable to the monthly schedule.
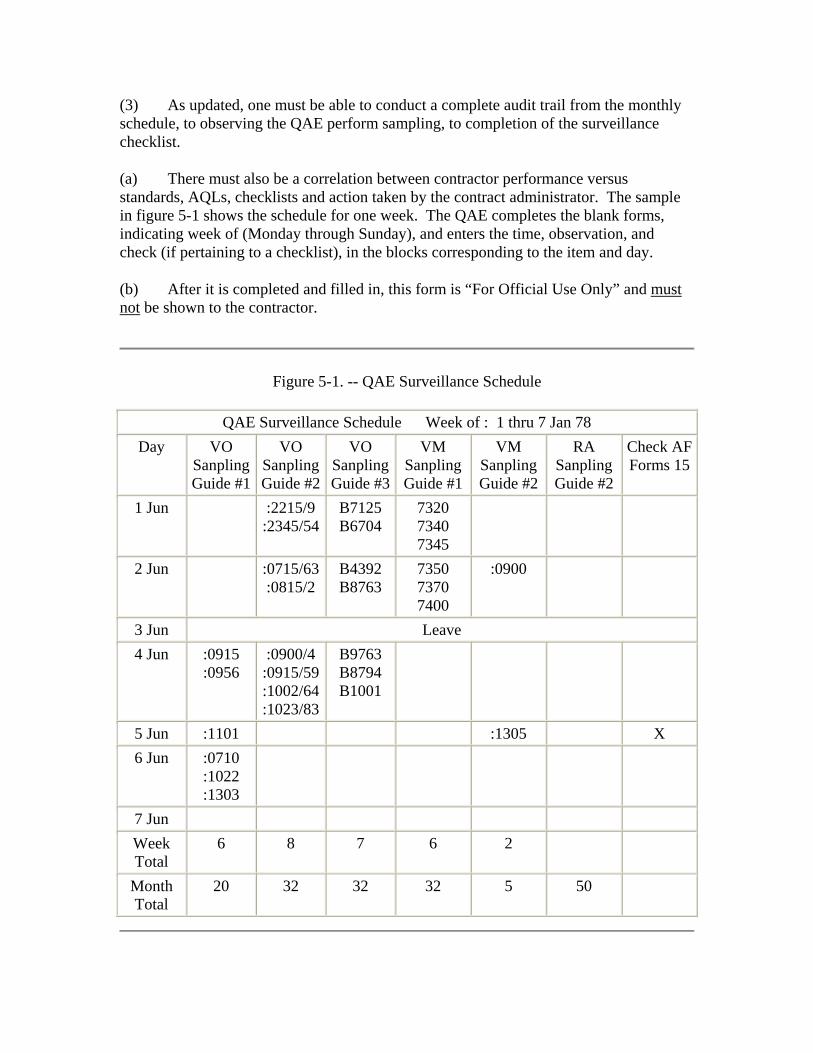
(3) As updated, one must be able to conduct a complete audit trail from the monthly schedule, to observing the QAE perform sampling, to completion of the surveillance checklist.
(a) There must also be a correlation between contractor performance versus standards, AQLs, checklists and action taken by the contract administrator. The sample in figure 5-1 shows the schedule for one week. The QAE completes the blank forms, indicating week of (Monday through Sunday), and enters the time, observation, and check (if pertaining to a checklist), in the blocks corresponding to the item and day.
(b) After it is completed and filled in, this form is “For Official Use Only” and must not be shown to the contractor.
Figure 5-1. -- QAE Surveillance Schedule
QAE Surveillance Schedule Week of : 1 thru 7 Jan 78 Day VO
Sanpling Guide #1
VO Sanpling Guide #2
VO Sanpling Guide #3
VM Sanpling Guide #1
VM Sanpling Guide #2
RA Sanpling Guide #2
Check AF Forms 15
1 Jun :2215/9 :2345/54
B7125 B6704
7320 7340 7345
2 Jun :0715/63 :0815/2
B4392 B8763
7350 7370 7400
:0900
3 Jun Leave 4 Jun :0915
:0956 :0900/4 :0915/59 :1002/64 :1023/83
B9763 B8794 B1001
5 Jun :1101 :1305 X 6 Jun :0710
:1022 :1303
7 Jun Week Total
6 8 7 6 2
Month Total
20 32 32 32 5 50

5-3. -- Doing Surveillance.
Doing surveillance involves using the surveillance plan called for in the monthly schedule. Use the following procedure to record observations and take action when the contractor’s defects exceed the allowable number.
a. Recording Observations. Monthly tally and surveillance checklists are used for each sampling guide and less frequently checked services. They are used to tally information on scheduled observations and defects noted. Each observation in the sample is recorded on the checklists, and the documents then become a formal government record for later reference.
(1) When random sampling guides are used, the tally of observations and defects at the end of each month are compared to the acceptable number of defects appearing in the sampling guide.
(2) The contractor is told each time an error is found during scheduled observations and asked to initial the observation recorded on the checklist.
(3) Errors found in services not scheduled for observation should be brought to the contractor’s attention but not used to count as a defect for determining if the AQL has been met.
(4) Checks done with a surveillance activity checklist are likewise recorded.
b. Potential Unsatisfactory Performance. If the sampling guide or surveillance activity checklist indicates that the number of defects is too high, the QAE goes to the decision table for that service indicator.
(1) The QAE must locate the specific service that is unsatisfactory. The table will identify the possible causes of the unsatisfactory performance and list a number of questions which, if answered, will probably pinpoint the source of the problem.
(2) The decision table helps the QAE identify the problem so that, among other things, a meaningful evaluation can be made of the contractor’s explanation and corrective action. For example, if the contract specifies a maximum out-of-commission rate for vehicles of 8 percent, and the rate was 10 percent, examination may reveal the excess was caused by excessive vehicle down for parts (VDP). This could have been caused by the government’s inability to provide timely parts support.
(3) In such a situation, the contractor may not be at fault. If, on the other hand, the excessive VDP was created because the contractor ordered the parts on a routine priority rather than priority, it might be the contractor’s fault. The decision tables will assist the QAE in making such a determination.

c. Documenting Unsatisfactory Performance. If performance in any area is judged unsatisfactory, the contractor is required to respond to a Contract Discrepancy Report (CDR). See sample in Figure 5-2.
(1) The QAE prepares the form and sends it to the contracting officer, who signs and sends it to the contractor.
(2) When completed and signed, the report, along with the tally checklist or surveillance activity checklist become the documentation supporting payment, nonpayment, or other necessary action.
5-4. -- Taking Action.
The QAE may check the contractor’s performance and document any non-compliance, but only the contracting officer may take formal action against the contractor for unsatisfactory performance.
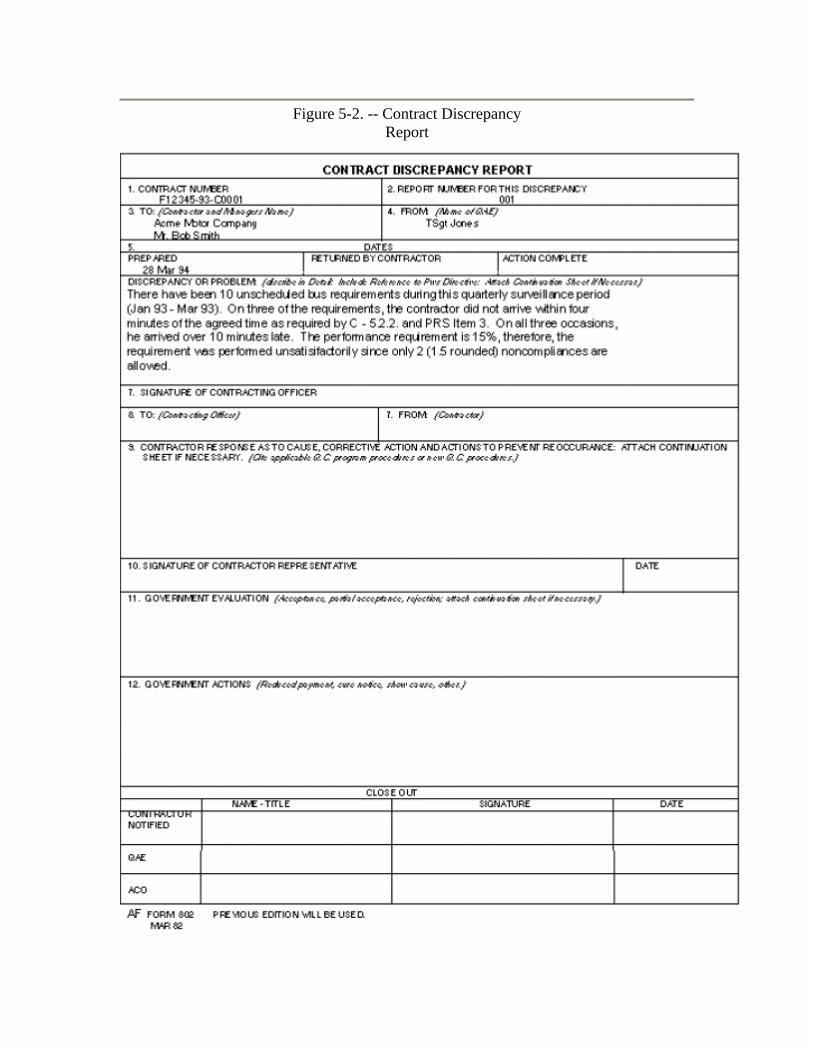
Figure 5-2. -- Contract Discrepancy Report

a. Ground Rules. This section lists the normal steps to be taken by contract administration when the QAE reports these deficiencies. The actions listed are not hard-and-fast rules, and are a minimum. More serious action can be taken sooner.
(1) When the contractor’s performance is unsatisfactory as defined in the surveillance plan and a formal action is indicated, the QAE, the functional area chief, and the contract administrator meet to determine what action is appropriate for the specific circumstances.
(2) If a decision is reached not to take a monetary deduction, the reasons are documented. The contracting officer must indicate agreement with the decision by signing the contract discrepancy report or other decision documentation.
b. Actions. Following are the actions normally taken when poor performance is found.
(1) As a rule, the QAE tells the contractor’s site manager, in person, when discrepancies occur and asks the contractor to correct the problem. The QAE makes a notation on the tally or surveillance checklist, of the date and time the deficiency was discovered, and has a contractor representative initial the entry on the checklist.
(2) If the number of discrepancies found exceeds the level for satisfactory performance, the QAE uses the decision tables in the surveillance plan to determine the cause(s).
(a) If the government created any of the discrepancies, these are not to be counted against the contractor’s performance.
(b) When the government has caused the contractor to perform in an unsatisfactory manner. the QAE prepares a letter to be sent to the responsible organization requesting corrective action be taken. The QAE sends it to the organization through the contracting officer.
(3) When the contractor is responsible for exceeding the limits of satisfactory performance, the contracting officer issues a contract discrepancy report (CDR) to the contractor (see paragraph 5-3c). If the failure is serious enough, issue the CDR at the time of the unsatisfactory performance, rather than at the end of the month.
(4) When a CDR is issued for a specific service the contracting office deducts from the month’s payment, an amount up to the percentage indicated in the Performance Requirement Summary exhibit of the contract. Do not delay the deduction until the contractor responds to the CDR. If surveillance was done right and the decision tables used, the unsatisfactory performance is clearly the fault of the contractor. For a specific example of a deduction, see paragraph 5-5.

(5) If the contractor does not achieve satisfactory performance in that specific service by the end of the next month, the contracting officer issues another CDR and deducts the appropriate amount from the contractor’s payment.
(6) If a third CDR must be issued, consider issuing a cure notice. (However, a cure notice can be issued sooner, if necessary).
(7) Depending on the contractor’s overall performance, the government may issue a Show Cause letter if the reply to a cure notice is unsatisfactory; next consider terminating the contract.
Figure 5-3. -- Deducting for Non-Performance
Deduct Formula (Example) If: and: and: and: and:
Quality of completed work is unsatisfactory (AQL of 6.5% exceeded) Contract Price is $100,000 per month Quality of completed work deduct percentage is 10% Sample size is 50 Number of defects in the sample is 10 (Reject number is 8)
Then: Deduction from the current month’s invoice is: Contract price
X Deduct Percentage X Percent of sample defective Deduction
= =
=
$100,000 .10$10,000
.20$2,000
5-5. -- Deductions For Non-Performance.
Through the Inspection of Services clause, the government can deduct from a contractor’s payment an amount equal to the services not provided.
a. To do this, the contract administrator must know the major cost categories in the contract and the percentage of cost each service output represents. The percentage cost of each service is found in deduct analysis; see chapter 2, paragraph 2-9. An example of how the deduct formula works is shown in figure 5-3.
b. Suppose the bid schedule showed the monthly contract price for vehicle operations, maintenance, and analysis as shown. The percentage cost of the service output is then found by looking at the Performance Requirements Summary Technical Exhibit in the contract statement of work. In the example, the percentage cost of quality

of completed work is 10 percent. This is then multiplied by $100,000 to obtain the maximum amount of deduct.
c. If completed work was unsatisfactory during the month (that is, did not meet performance values) and the percent of the sample found bad was 20 percent, $2000 would be deducted from the payment normally due the contractor.
d. This amount for quality of completed work is deducted because the contractor failed to provide reliable, uniform services within the assigned performance values. Although some completed work may have met the standard during the month, the acceptable quality level was not met and at least 20 percent of the observations were defective. Hence, the total quality performance requirement has not been achieved. As a consequence, the service output is unsatisfactory.
5-6. -- Good Performance.
When a contractor’s quality control program works, good performance results. If the result of a QAE’s surveillance shows consistently good performance, the amount of surveillance can be decreased.
a. Reduced Inspection. Inspection can be reduced when the following conditions have been met for a sampling guide.
(1) The preceding 4 lots (that is, the last 4 months) have all been acceptable.
(2) The number of defects in each of the preceding 4 lots is less than one half of the acceptance number. For example, with an AQL of 6.5 percent and a sample size of 32, the acceptance number is 5. If two or less defects ere found in each of the last 4 lots, reduced inspection could be used.
(3) The normal sample size is being used.
(4) The functional area chief and the contract administrator agree to use reduced inspection.
b. Reduced Sample Size and Acceptance or Rejection Numbers. Reduced inspection decreases the sample size as shown in figure 5-4. In addition, the acceptance and rejection numbers change as shown in figure 5-5. To make the changes to the existing sampling guide, take the following steps.
(1) Make sure that the original sampling guide was using the normal sample size. To determine this, see Chapter 4, figure 4-3 and compare the lot size with the sample size in the sampling guide.
(2) Find the new sample size by using figure 5-4. Take the lot size and find the new reduced sample size.
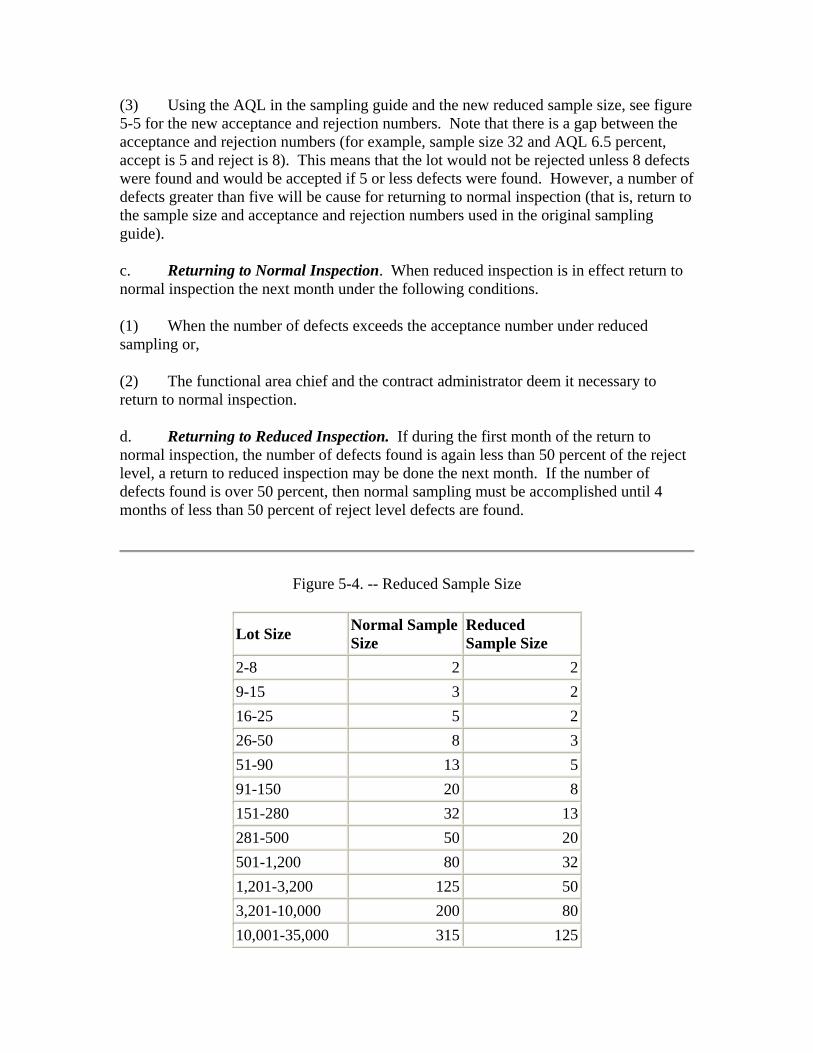
(3) Using the AQL in the sampling guide and the new reduced sample size, see figure 5-5 for the new acceptance and rejection numbers. Note that there is a gap between the acceptance and rejection numbers (for example, sample size 32 and AQL 6.5 percent, accept is 5 and reject is 8). This means that the lot would not be rejected unless 8 defects were found and would be accepted if 5 or less defects were found. However, a number of defects greater than five will be cause for returning to normal inspection (that is, return to the sample size and acceptance and rejection numbers used in the original sampling guide).
c. Returning to Normal Inspection. When reduced inspection is in effect return to normal inspection the next month under the following conditions.
(1) When the number of defects exceeds the acceptance number under reduced sampling or,
(2) The functional area chief and the contract administrator deem it necessary to return to normal inspection.
d. Returning to Reduced Inspection. If during the first month of the return to normal inspection, the number of defects found is again less than 50 percent of the reject level, a return to reduced inspection may be done the next month. If the number of defects found is over 50 percent, then normal sampling must be accomplished until 4 months of less than 50 percent of reject level defects are found.
Figure 5-4. -- Reduced Sample Size
Lot Size Normal Sample Size
Reduced Sample Size
2-8 2 2 9-15 3 2 16-25 5 2 26-50 8 3 51-90 13 5 91-150 20 8 151-280 32 13 281-500 50 20 501-1,200 80 32 1,201-3,200 125 50 3,201-10,000 200 80 10,001-35,000 315 125

35,001-150,000 500 200 150,001-500,000
800 315
500,001 and over
1250 500
Figure 5-5. -- MIL-STD-105D Acceptance Rejection Levels for Reduced Inspection
Note: See Hardcopy for MIL-STD-105D Acceptance Rejection Levels for Reduced Inspection
5-7. -- Documentation.
During the course of the contract the QAE retains a copy of all inspection schedules, tally checklists, and surveillance activity checklists. At the end of the contract period, the QAE forwards these records for inclusion in the contract file. However, when a specific service becomes unsatisfactory during a surveillance period, the inspection documentation supporting the contract discrepancy report is forwarded to the contracting officer no later than 5 days after the end of the previous performance period.

Chapter 6
Quality Control and Preaward Surveys
6-1. -- Quality Control Clause.
Each standard SOW contains a contractor quality control clause. This clause provides specific implementation of the standard Inspection of Services clause normally present in service contracts.
a. Contracting officers must pay particular attention to this requirement during the preaward survey and must make sure that the contractor provides a written quality control program prior to the contract start date.
b. To aid contractors in developing a quality control program, the contracting officer must provide the government Quality Assurance (QA) Surveillance plan along with the Invitation for Bids or Request for Proposal.
c. Make sure to mark the QA surveillance plan with the following statement: “For Information Purposes Only. This Quality Assurance surveillance plan is not part of the Request for Proposal or Invitation for Bids not will it be made part of any resulting contract.” Use this statement since the government must retain the right to change or modify inspections methods.
d. An example of a clause is as follows:
Quality Control
a. Quality Control. The contractor shall establish a complete quality control program to assure the requirements of the contract are provided as specified. One copy of the contractor’s basic quality control program shall be provided to the Contracting Officer at the preaward survey conference or not later than at the pre-performance conference if a preaward survey is not conducted. An updated copy must be provided the Contracting Officer on contract start date and as changes occur. The program will include, but not be limited to the following:
(1) An inspection system covering all the services stated in the Performance Requirements Summary of the Statement of Work. It must specify areas to be inspected on either a scheduled or unscheduled basis and the individuals who will do the inspection.
(2) A method of identifying deficiencies in the quality of services performed before the level of performance is unacceptable.
(3) A file of all inspections conducted by the Contractor and the corrective action taken. This documentation shall be made available to the Government during the term of the contract.
b. Quality Assurance. The Government shall monitor the Contractor’s performance under this contract using the quality assurance procedures specified in the Performance Requirements Summary of the Statement of Work.
6-2. -- Preaward Survey (PAS).
A SOW and a sound quality assurance surveillance plan go a long way toward making sure that quality results come from a contract. The other essential ingredient is a good contractor. The preaward survey helps the government insure that it awards the contract to a qualified bidder. In other words, the contractor must be responsible as well as having the lowest price (or lowest evaluated price) before the government makes award. The preaward survey is a method to determine responsibility.
6-3. -- Preaward Survey Clause.
Include a clause like the following, but adapted to the specified SOW:
Financial and Technical Ability.
a. If a bid submitted in response to this solicitation is favorably considered, a two part preaward survey may be conducted to determine the bidder’s ability to perform. Part One will be conducted by (Insert name of office) who may contact you to determine your financial capability to perform. Current financial statements and pertinent data should be available at that time. Part Two of the survey will be conducted at (Name/Location) shortly after bid opening by government personnel.
b. If a preaward survey is conducted, you will be requested to have management officials, of the appropriate level, represent your firm. In addition, your proposed project manager should be available to respond to questions raised during the preaward survey. You should also be prepared to present a briefing regarding the manner in which you intend to accomplish your contractual obligations. As a minimum, you should address the following items of information in your presentation (a written copy of the presentation with the backup data below must be submitted to the contracting officer 5 work days before the presentation):
(1) Startup and phase-in schedule.
(2) Key personnel letters of intent and resumes.
(3) Availability of labor force, plan for recruiting, type and extent of training.
(4) The role of the project manager and the extent of his/her authority.
(5) Organizational and functional charts reflecting line of management responsibility.
(6) Manning charts in a format requested by the contracting officer (only to be used to ensure that you understand the workload).
(7) Plans and management procedures for logistical administrative support of all functions; that is, contractor furnished supplies and equipment and procedures for timely payment of personnel.
(8) Procedures to be used to ensure contract requirements are met (quality control program).
(9) Corporate experience, as evidenced by past and present contracts.
(10) Other purchases for which you have bid and for which you are apparent low bidder.
Some negotiated and two-step forms of contracting use technical proposals to determine how well someone understands the statement of work. Adapt the clause above and include it as evaluation factors in the solicitation.
6-4. -- Preaward Survey Method.
The contracting officer makes the decision to conduct a preaward survey based on knowledge of the bidder’s past performance. When the contracting officer decides to conduct a preaward survey the guidelines in paragraphs 6-5 to 6-8 apply. These guidelines are not hard and fast procedures and the contracting officer must adapt them to the specific survey requirements.
6-5. -- Preaward Survey Team.
This team can be composed of either acquiring activity or outside office support such as the Defense Contract Administration Service (DCAS) in the Department of Defense or both. The PAS has two parts; that is, financial and technical. The acquiring activity or the outside office can run the technical part, the acquiring activity should supplement the team with appropriate persons, such as the buyer, functional experts, etc.
6-6. -- Outside Office and the Acquiring Activity Perform the PAS.
The buyer takes the following actions as soon after bid opening as possible when an outside office performs the financial PAS and the acquiring activity performs the technical PAS:
a. Request the outside office to perform that part of the PAS that is to be done by them (financial).
b. Request information required by Financial and Technical Ability clauses from the bidder. See paragraph 6-3 above.
c. Send blank manning charts to the bidder for submission during the PAS.
d. Emphasize to the bidder the importance of having a detailed quality control program for presentation at the PAS.
e. Remind the functional person to have estimated manning charts available for the PAS. These charts must estimate what contractor manning would be required to perform the requirement. They may not estimate what it would take government personnel to accomplish the tasks.
f. Coordinate the date of the PAS with the technical PAS team chief and the contractor. Notify the contractor of the finalized date and location of the PAS.
g. Perform the PAS. Do all tasks in paragraph 6-7a thru d6-7g.
6-7. -- Technical Evaluation.
Perform the following tasks.
a. Evaluate the adequacy of the financial PAS performed by the outside office. Check the bidder’s financial statements if they are submitted.
b. Thoroughly analyze manning charts submitted by the bidder. The following procedures apply:
(1) First, validate the government prepared contractor manning estimates. Make sure the government did not overestimate.
(2) Next, compare the bidder’s charts to the government estimate. Insure that:
(a) Bidder’s total manning is comparable to the estimate. A variance of more than twenty percent should be considered suspect.
(b) The bidder has the right classes of employees on duty at the appropriate times.

(c) The bidder has sufficient personnel on duty during peak or key workload periods.
(3) Next, analyze the contractor’s net bid to see if it will support the level of manning proposed. Use the following procedures.
(a) Compute total man-hours for each labor category in the wage determination.
(b) Use a format similar to the following to compute the estimate of the contract price:
Labor Category
Total Hours
x x x
Hourly Rate
$ ---- $ ---- $ ----
= = =
Personnel Cost
$ ---- $ ---- $ ----
Supervisory Costs Leave Costs
Total Direct Labor Cost Total Labor Cost
$ ---- $ ---- $ ---- $ ----
Payroll Tax & Insurance Health & Welfare (Hours times dollar rate) Material, Supplies & Equipment Total Direct Costs Overhead General & Administrative Costs
$ ---- $ ---- $ ---- _______ $ ---- $ ---- $ ---- _______
Profit
Total Costs Total Estimated Price
$ ---- $ ---- _______ $ ----
(4) The bid price frequently may not support the total number of direct labor hours proposed by bidder on the manning charts. Ask to see the bidder’s bid preparation sheets. The bidder doesn’t have to show them but usually will if one explains the data is needed to verify that direct costs (labor, material, etc.) are not underestimated. Once this information has been provided, retain it. It may be helpful in the event of future negotiations.

c. Make sure to have the latest supply consumption data if the bidder is going to furnish the supplies. Compare this with bidder’s information (when provided) to insure that the bidder has not underestimated supplies.
d. A serious underestimation of total costs, or a serious misapplication of the man-hours proposed, indicates a lack of understanding of contract requirements. This is where the technical representative goes to work. Interview the bidder and find out whether or not the bidder understands the job.
e. Besides the total estimate, financial PAS and general evidence of competence, the next most important factor is the bidder’s proposed quality control plan. This plan should be detailed enough for the PAS team to evaluate and determine that the bidder actually knows what to do.
f. The bidder’s performance history is also a very important subject to be thoroughly covered by the PAS team. Establish complete and thorough documentation if a determination of nonresponsibility is going to be based upon lack of tenacity, perseverance or integrity.
g. PAS reports must state the facts, draw a conclusion based upon those facts and end with a recommendation to the contracting officer.
6-8. -- Outside Office Performs the PAS.
If an outside office such as DCAS is going to perform the financial and technical PAS, the buyer does the following:
a. Ask the office to perform the PAS. Indicate which particular acquiring activity will assist in the PAS. Name the personnel in the request; for example, buyer, food services officer, etc.
b. Provide all acquiring activity team members written guidance as to duties and responsibilities. Provide it in enough time for members to study and fully understand their responsibilities.
c. Insure that acquiring activity team members realize that the outside office is running the PAS, and that they understand that they have a very important input (the outside office may be lacking in a particular area of expertise that the acquiring activity provides).