offshore drilling vs.tourism€¦ · offshore drilling vs.tourism revenue projected for south...
TRANSCRIPT
Munson
McLaren
Stickler
OFFSHORE DRILLING
VS.TOURISM
9/7/2015 Projected Revenue for South Carolina

Offshore Drilling vs.Tourism
Page 2
The series of procedural
steps that must take
place before an oil rig
can be operational and
therefore offer
occupational opportunity
for local residents is
nearly two decades. The
job benefits that the Gulf
States enjoy were
generations in the
making, and still those
states rank alongside
South Carolina in their
levels of poverty… our
citizens will be
competing nationally for
the most dangerous, low
skill… positions. If they
succeed they will join an
industry whose
employees are seven
times more likely to die
on the job than the
average American
worker. ―Mayor
Scoville of Georgetown
South Carolina (4-9-15)
Offshore Drilling vs.Tourism
P R O J E C T E D R E V E N U E F O R S O U T H
C A R O L I N A
PREAMBLE
Offshore oil does not mix well with coastal tourism.
Anyone who believes it does is encouraged to recall
examples of oil communities where they have
personally enjoyed the beaches. Still, it is difficult not
to consider oil and natural gas as potential sources of
state revenue. Supporters of offshore drilling believe
that they have found a shortcut to the prosperity that
some coastal counties have long sought. But a close
analysis of the financial tradeoffs as they pertain to
the proposed venture to drill for oil in the Atlantic
Ocean off the South Atlantic States, suggests that
such an effort would most likely cause a significant
loss in state income and economic activity. This
paper looks critically at the numbers provided
predominantly by the government or by petroleum
industry consultants. The question raised here is
whether the state can afford to take the financial risks
that accompany oil drilling off the SC coastline.
No assumptions are made concerning the probability
of an oil spill. However, this analysis concurs with the
belief, historically well substantiated, that drilling for oil in deep water cannot be
undertaken without assuming some risk. Senator Graham supports that statement
Offshore Drilling vs.Tourism
Revenue Projected for South Carolina Page 3
when he defends drilling by saying, “There is risk in everything you do.” Evidence
appears from many directions. For example, revenue sharing, discussed as a major
source of state income, is, at present, solely directed at coastal maintenance,
undoubtedly for a reason. BP has recently agreed to pay the last of $62 billion for the
damage done to people, property, and the environment in and bordering on the Gulf
of Mexico just five years ago.
Drilling proponents claim that technology has made the process safer. Courts,
however, have affirmed that human error, not technology was the cause of the Gulf oil
spill. The "safer technology" argument has long been invoked by the oil industry to
argue for permission to pursue efforts, such as deep water drilling in the Gulf of
Mexico, that have proven devastating to state economies and populations. Despite
the efforts of the best and the brightest, human error has proven not fully amenable
to the engineering discipline.
The intent here is to shed light on whether the potential oil revenue is great enough
to pass the risk/reward test that reasonable people would apply before proceeding
with drilling. It is also an effort to help politicians and private individuals consider the
magnitude of the risk to South Carolina’s financial well-being.
Terry Munson, B.A.
Duke University
Systems Engineer, IBM, Retired
Ian McLaren, Ph.D.
MIT Faculty
Physicist and Businessman, Retired
Tom Stickler, B.M.E.
Ohio State University
Mechanical Engineer, IBM, Retired
Offshore Drilling vs.Tourism
Page 4
Table of Contents
EXECUTIVE SUMMARY .......................................................................... 5
Mutually Exclusive Industries ................................................................ 5
Cumulative Contributions ..................................................................... 6
QUEST REPORT VIEW OF REVENUES ....................................................... 6
Revenue Sharing .................................................................................. 7
Revenue Sharing Conclusions ............................................................... 8
INCOME TAX REVENUE TO SC FROM OIL ................................................ 8
Job Caveats .......................................................................................... 8
Number of Jobs .................................................................................... 9
INCOME TAX REVENUE TO SC FROM COASTAL TOURISM......................... 9
Coastal Tourism – Four Counties ........................................................ 10
Coastal Tourism Tax Revenue Table Base (1 Year) Calculation ............. 11
Coastal Tourism Tax Revenue Table Extended Calculation .................. 12
ECONOMIC BENEFITS OF OIL AND TOURISM – NON TAX SOURCES ......... 14
ASSERTION OF DATA AND ALGORITHM VALIDITY ................................ 16
CONCLUSIONS ................................................................................... 22
APPENDIX I ........................................................................................... 26

Offshore Drilling vs.Tourism
Revenue Projected for South Carolina Page 5
EXECUTIVE SUMMARY
An analysis of data provided by government, government-hired contractors, the
South Carolina Department of Parks, Recreation and Tourism, and business sources
was used to determine the ratio of risk to reward associated with the Department of
Interior`s (DOI) proposal for oil and gas drilling off the SC coast.
The data show, indisputably, that the pursuit of oil industrialization would mean that
South Carolina would assume potentially great risks at a highly unfavorable risk-to-
reward ratio.
Both oil and tourism drive multiple revenue streams. First, oil produces some number
of jobs whose workers pay taxes to the state and county; second, a portion of the oil
revenues collected by the federal government and shared with the states, a practice
known as revenue sharing, is calculated; third, people who work in the industry, and
for businesses benefitting from the oil industry, spend salaries that help the economy
grow. Quest calls this “economic benefit,” and that terminology is adopted here.
Tourism’s revenue streams consist of: first, the taxes paid by workers in the industry;
second, the salaries earned and spent by workers in the tourism industry (an economy
driver called “economic benefit”); third, the dollars spent by tourists in the four
coastal counties discussed in this report; fourth, the latter category results in taxes to
the states and the counties, as well as contributing to economic benefit.
A considerable level of detail about how these comparative numbers are derived is
included. We have used figures from the Quest Report of December 2013, in every
case where provided, to show the industry’s claims.
Mutually Exclusive Industries
Before showing the important ratios of revenue provided by the two alternative
approaches to South Carolina’s future, it must be emphasized that tourism and oil are
mutually exclusive economic pursuits. They cannot both exist in a functioning
economy. Those who claim otherwise are asked to visit, or at least watch YouTube
videos, on Port Fourchon, LA. South Carolina’s most avid pro-drillers see a Port-
Fourchon future for South Carolina. Most coastal residents, the city councils of

Offshore Drilling vs.Tourism
Page 6
nineteen communities, and tourists who cherish our beaches don’t share that vision.
The objective numbers make the case quite clear. In many cases the ratios are so
stark that examination of the rest of this short report will be required to assure the
reader of their reliability.
Cumulative Contributions
The report shows the cumulative contributions to South Carolina from 2014 to 2035
for the two industries. In every case, the benefit of the doubt of this analysis has been
given to the oil industry figures.
RATIO OF ECONOMIC BENEFITS – TOURISM TO OIL
TOURISM: $533.5B Oil: $19.4B RATIO – 27.5:1
QUEST REPORT VIEW OF REVENUES
Quest Offshore Resources1, Inc., reports that three revenue streams will flow to the
state of South Carolina2 as a result of petroleum and natural gas production
conducted in one or more of the federally proposed lease3 areas in the Atlantic
Ocean. The potential revenue sources are:
1) Shared federal oil revenue, comprised of three components - leasing,
bonuses, and royalty receipts - which does not exist, but for which the
South Atlantic states are currently pleading their case to Congress. Quest
Resources assumes that 37.5 percent of the total federal revenue, if
approved by Congress, would be shared with the states.
2) The income taxes paid by South Carolina residents newly employed by the
petroleum company or companies making successful bids for oil field leases.
3) The economic benefit of worker salaries plus oil company expenditures
related to drilling and maintenance of facilities.

Offshore Drilling vs.Tourism
Revenue Projected for South Carolina Page 7
Revenue Sharing
The prospects for revenue sharing appear uncertain.4,5 Despite threats to cut DOI
funding by Senator Lisa Murkowski (R. Alaska), Secretary of the Interior Sally Jewell
has said that, “The outer continental shelf is owned by all Americans. There is a small
portion of the Gulf where there is revenue sharing proposed for certain Gulf States.
We believe that needs to be reexamined to look at what is a fair return to taxpayers
across the whole United States.”6 Jewell’s statement expresses not only the
administration’s opposition to revenue sharing in the Atlantic Outer Continental Shelf
(OCS) project, but appears to dim the prospects for continued sharing in the Gulf of
Mexico states as well. In addition, Abagail Ross Harper, Director of the Bureau of
Ocean Energy Management (BOEM), the DOI agency in charge of the proposed drilling
projects, has said that the administration objects to the three bills introduced in the
Senate to compel federal sharing.7 That statement appears to foreshadow a veto of
any revenue sharing legislation.
Since few decisions prove to be as final as they may appear in Washington, revenue
sharing cannot be ruled out. There is a strong lobbying effort in the U.S. Senate to re-
authorize sharing. However, it has been capped at $375 million annually for the Gulf
States, a limit which would presumably apply to OCS states as well. OCS production in
the planned Atlantic lease areas is not expected to equal that in the Gulf, however, so
any revenue sharing could reasonably be expected to be subject to lower ceilings,
either legal or de facto, than those previously imposed on the Gulf States.
Page 3 of Quest’s Economic Benefits study, Table 25, specifies one possible revenue–
sharing scenario. Quest makes it clear, however, that there is no revenue sharing
taking place at this time.
An important point, often missed, is that past revenues shared with Gulf States were
earmarked for beach/shoreline restoration, preservation and maintenance and were
restricted from becoming part of the states’ general funds. It is a reasonable
assumption that if revenue sharing were reinstituted, that restriction would once
more apply.

Offshore Drilling vs.Tourism
Page 8
Revenue Sharing Conclusions
Pending the outcome of US Congressional and gubernatorial efforts to persuade or
compel the federal government to share oil revenues, South Carolina will receive
either zero dollars, some unknown amount allocated among the 50 states (the Obama
option), or the hypothetical amount shown in Quest Report Table 25.
INCOME TAX REVENUE TO SC FROM OIL
The Quest Report cited below shows a total of 279.6 thousand jobs across the U.S.
resulting from Atlantic drilling by the year 2035, of which 121 thousand are in the
four participating Atlantic states. Quest Table 21 shows 35,569 as South Carolina
jobs. This constitutes a mere 13% of the 2035 total. If the 13% ratio holds, then 4,624
SC jobs would be direct oil jobs and 30,945 presumably lower paying indirect and
induced jobs. It is perhaps worth noting that these rather precise projections are
made without benefit of knowing the quantity of fossil fuels that lie offshore, the
amount of fossil fuel pre-processing which would be undertaken at the rigs or on
Floating Production Storage and Offloading (FPSO) ships, or how broadly onshore
facilities would be distributed (a factor which plays a large role in generating indirect
and induced jobs). Added to the considerable uncertainty of fossil fuel prices in the
years 2016 through 2035, it is not unreasonable to question the accuracy of the job
numbers cited. The 6.7:1 ratio of indirect to direct jobs appears realistic.
Job Caveats
Placing confidence in the job predictions by Quest Resources is problematic in light of
the scant knowledge of the amount of petroleum/natural gas reserves present in the
South Atlantic OCS. Other influences such as per barrel prices, product demand, oil
industry efficiency improvements, technology, wage rates, the outcome of industry
efforts to market crude oil overseas, well production quantities and flow rates, natural
gas versus oil yields at the wellhead, etc., cast doubt on the validity of these figures.
However, Quest Resources has estimated job prospects and we will make our
comparisons on that basis.
Offshore Drilling vs.Tourism
Revenue Projected for South Carolina Page 9
Number of Jobs
For purposes of this study, and for revenues anticipated by the state of South
Carolina, what matters is the number of jobs resulting from oil industry activities
versus the number of jobs (discussed in next section) placed at risk by drilling. How
that might that adversely affect state income from tourism, an industry growing at
more than 5% in recent years, is what is under study.
INCOME TAX REVENUE TO SC FROM COASTAL TOURISM
Tourism drives four separate revenue streams. Unlike the uncertain petroleum
revenue, these figures are either accurate or err on the conservative side. Stream One
is the 7% to 11% (8% is used in all report calculations) that tourists pay for goods and
services obtained during vacations along the coast. Stream Two is the 4.5% income
tax that will be paid to the state by employees in the tourism industry. Tourism
income uncertainty could result from a recession, but that would likely affect both
petroleum and tourism equally. The total number of tourism employees fluctuates
from high season to low season, but likewise the number of petroleum workers
fluctuates (100,000 unemployed in North Dakota)8 as a result of high or low demand,
price per barrel, ratio of gas to oil (unknown), other supply sources coming online,
success or failure in industry efforts to sell American crude overseas, etc. Such
fluctuations tend to counter-balance each other. Stream Three is the economic
benefit of spending by the burgeoning number of tourism workers. Stream Four is
created by tourist spending at hotels, restaurants, sightseeing venues, and by
admissions to entertainment events, etc .
Tourism is a major source of revenue for South Carolina. Based on a 2015 U.S. Travel
Association report9 (done for the South Carolina Department of Parks, Recreation and
Tourism) using 2013 tourism statistics, “Spending on travel or on behalf of tourism in
Offshore Drilling vs.Tourism
Page 10
“I find it ironic that, in a
state that has rejected
poker machines, pari-
mutuel betting, horse
and dog tracks, jai alai
and gambling casinos,
all of which would
complement our tourist
economy and create
thousands of jobs, our
legislators and governor
would rather take the
biggest gamble of all,
by jeopardizing our
beaches, inlets and
waterways, the
hundreds of thousands
of jobs that exist in our
coastal tourism
economy, and all the
tax base that creates, to
welcome the accident -
prone oil industry to
our state.”
― Rick Bauman,
Murrell’s Inlet Seafood
Founder & Owner
South Carolina totaled $18.1 billion in 2013.” The report added, “Tourism generated
more than $1.3 billion in state and local tax revenues for South Carolina.”
Consequently, each South Carolina taxpayer was relieved of a $742 burden in state
and local taxes. It is generally accepted10 that tourism
jobs account for over ten percent of the state’s
employment.
Coastal Tourism – Four Counties
Coastal tourism is a significant part of the South
Carolina tourism trade. To derive coastal visitor
statistics, this report aggregates11 the total of visitors
to Horry, Georgetown, Charleston, and Beaufort
Counties. These are four of the twenty-two South
Carolina counties designated by the U. S. National
Oceanographic and Atmospheric Administration
(NOAA) as coastal counties12. NOAA applies two
criteria. Either the county must have 15% of its
territory “within the nation’s coastal watershed, or a
portion of or an entire county accounts for at least
15% of a coastal cataloging unit.” This analysis uses
only the four coastal counties which most South
Carolinians would agree provide the bulk of coastal
tourism revenue. A more complete approach would
have been to include all 22 counties which NOAA
designated as “coastal”, thus resulting in a larger
coastal tourism total.

Offshore Drilling vs.Tourism
Revenue Projected for South Carolina Page 11
Coastal Tourism Tax Revenue Table Base (1 Year) Calculation
The following South Carolina, four-county visitor statistics model, showing related
expenditures and their sources, is a single-year example for 2014 which explains the
derivation of key statistics in the extended calculation :
County Source of
Statistics
Base
Year
Number of
Visitors
A
Expenditure Per
Visitor
B
Tax Revenue
Yield @ 8%
A * B * 8%
Horry SCPRT 2014 7,790,000 $689 $429 million13
Georgetown SCPRT 2014 552,475
$551
(80% * $689)
$24 million14
Charleston SCPRT 2014 5,740,000
$689
(100% * $689)
$319 million15
Beaufort SCPRT 2014 2,767,500
$827
(120% * $689) $183 million16
Grand Total Four Counties For Single Year
$953 million
The numbers used in this analysis are not the only ones available, but they are among
the most conservative. This report’s approach to selecting data sources is that in
every assumption we have given the benefit of the doubt to petroleum projections
and held tourism projections to the minimum credible. Footnote 13 clarifies this point.
Statistically summarizing the tax-related (state/county/local income) risk-reward
case for drilling in the Atlantic OCS off South Carolina produces the following table:

Offshore Drilling vs.Tourism
Page 12
Coastal Tourism Tax Revenue Table Extended Calculation
Year Hypothetical
Revenue
Sharing17
(Millions)
Projected
Oil Jobs1
Taxes Paid by
Holders of
Oil Jobs18
(Millions)
Tourism
Job
Growth19
Taxes Paid by
Holders of
Tourism Jobs20
(Millions)
Number of
Visitors
(Millions)
Four County
Tourism Tax
Revenue21
(Millions)
2014 $0 0 $0 126,112 $79.5 16.85 953.2 2015 $0 0 $0 128,319 $80.8 17.27 1001.4
2016 $0 0 $0 130,565 $82.3 17.70 1052.1
2017 $0 169 $0.53 132,849 $83.7 18.15 1105.4
2018 $19 667 $2.1 135,174 $85.2 18.60 1161.4
2019 $20 735 $2.3 137,540 $86.7 19.06 1220.2
2020 $29 1,014 $3.2 139,947 $88.2 19.54 1281.9
2021 $30 1,282 $4.0 142,396 $89.7 20.03 1346.8
2022 $32 1.622 $5.1 144,888 $91.3 20.53 1415.0
2023 $31 2,607 $8.2 147,423 $92.9 21.04 1486.7
2024 $31 3,688 $11.6 150,003 $94.5 21.57 1561.9
2025 $30 5,274 $16.6 152,628 $96.2 22.11 1641.0
2026 $34 8,658 $27.3 155,299 $97.8 22.66 1724.1
2027 $72 11,907 $37.5 158,017 $99.6 23.23 1811.3
2028 $115 15,387 $48.5 160,782 $101.3 23.81 1903.0
2029 $170 18,929 $59.6 163,596 $103.1 24.40 1999.4
2030 $225 22,115 $69.7 166,459 $104.9 25.01 2100.6
2031 $308 25,514 $80.4 169,372 $106.7 25.64 2206.9
2032 $418 27,781 $87.5 172,336 $108.6 26.28 2318.7
2033 $604 30,602 $96.4 175,352 $110.5 26.94 2436.1
2034 $712 31,840 $100.3 178,421 $112.4 27.61 2559.4
2035 $848 35,569 $112.0 181,543 $114.4 28.30 2689.0
Total $3.7B $773
$2,030 $36,022
Offshore Drilling vs.Tourism
Revenue Projected for South Carolina Page 13
Column by column explanation of the statistical summarization table by column
heading (see footnotes for additional details):
Year – 2035 was chosen as the cutoff year because it is the end point of Quest
projections.
Hypothetical Revenue Sharing – President Obama, Secretary Jewell, and BOEM Director
Abagail Ross Hopper have all stated that there will be no sharing of federal oil
payments with the Atlantic OCS states. The Quest Report clearly states that there is
currently no revenue sharing in the Atlantic OCS, However, the OCS Governors’
Coalition continues to pursue lobbying and legislative efforts to achieve revenue
sharing exclusively for their states. The figures shown are derived from the Quest
Report, Tables 12 and 25.
Oil Jobs Projected – The numbers are extracted from the Quest Report (Table 21) done
for BOEM under contract. From 2036 on there are no BOEM assumptions of greater or
lesser oil/gas production, so we have not made any.
Oil Jobs Tax Revenue Growth – We have assumed a $45,000 average annual salary
taxed at 7% (a combination of sales and income taxes) to produce these figures.
Tourism Job Growth – Assumes a growth rate of 2.5% intentionally conservative.
Taxes Paid by Holders of Tourism Jobs – This is the previous column multiplied by an
assumed annual salary of $20,000 then multiplied by 4.5% (a combination of sales
and income taxes). The taxes are reduced 30% for seasonal workers when summed
with other revenue streams.
State Tourism Revenue – This additional component of state income from tourism
represents the amount of taxes paid directly by tourists on rooms, admissions, meals,
etc., at an 8% tax rate. The algorithm is number of tourists X 689 X .08. The assumed
annual growth rate is 2.5% in both tourists and their spending from base year 2014.
Offshore Drilling vs.Tourism
Page 14
Tourism/Oil Tax Revenue Yield Ratios – 2014 - 2035
The following ratios reflect the cumulative tax/revenue sharing amounts from 2014
through 2035 from the table above:
Petroleum Probable Tax Revenue: 773M Taxes (No Revenue Sharing (RS))
Petroleum Possible Tax Revenue: $3.7B RS + $773M Taxes = $4.47Billion
Tourism Assured Tax Revenue: $2.03B Taxes + $36.02B Taxes = $38.05 Billion
Tourism Possible Tax Revenue: Driven by growth assumptions.
RATIO: Guaranteed Tourism Tax $ to Probable Oil Tax $ = 49 to 1
RATIO: Guaranteed Tourism Tax $ to Oil Tax $ + RS $ = 8.5 to 1
Perhaps the clearest way to characterize these two ratios is: The ratio of tourism to oil
tax revenue is 49 to 1. Contingent on unpredictable events in Congress, that ratio
could change, and in one hypothetical scenario could go as low as 8.5 to 1.
Economic Benefits of Oil and Tourism: Non-Tax sources
In the preceding analysis the discussion was limited to benefits to South Carolina’s
treasury resulting from taxes paid by workers and tourists. Also included was the
hypothetical amount the state might receive if proposed legislation in Congress becomes
law, a component known as “revenue sharing.”
The remainder of the analysis relates to the non-tax economic benefits (Quest appears to
use this term synonymously with “contributions”) of spending by workers and tourists
and a calculation of the tourism-to-oil revenue ratios from both tax and non-tax
sources. We take Quest to mean the sum of the salaries generated by oil-related jobs,
purchases of products (oil and non-oil related) in the state, oil infrastructure installed in
the state, and any other economic activity due to oil and natural gas development. In
spite of a number of telephone requests left with Quest, we were unable to confirm that
this was indeed correct.
Before computing their ratios, we present two spreadsheets for oil for non-tax revenue;
the Quest Report’s economic benefit amounts and the shared revenue. The latter is for
Offshore Drilling vs.Tourism
Revenue Projected for South Carolina Page 15
clarification purposes only, and is not used in ratio calculations since that number is
presumably contained in the $18.6 billion of economic benefit. We then show two
spreadsheets; first the salaries earned and spent by tourism workers, then the cumulative
expenditures of tourists to the four largest coastal counties - for tourism revenue.
Finally, the ratio of tourism revenue to oil revenue is calculated, using both tax and non-
tax (economic benefit) sources.
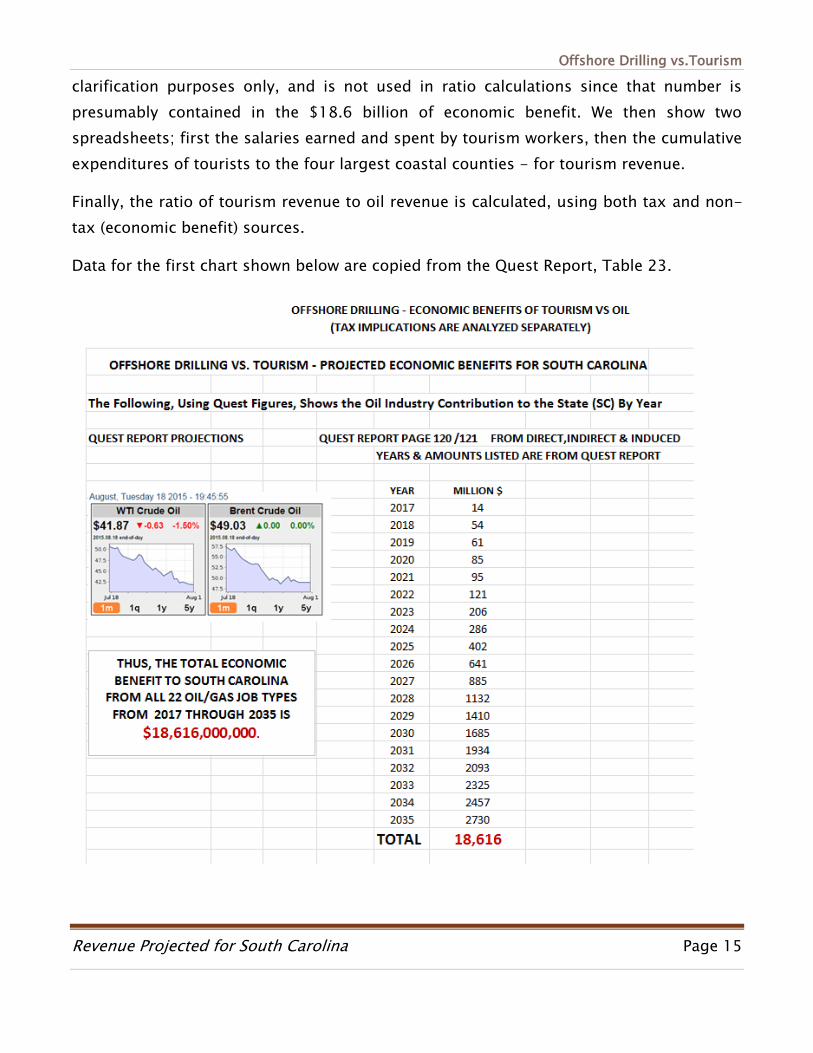
Data for the first chart shown below are copied from the Quest Report, Table 23.
Offshore Drilling vs.Tourism
Page 16
ASSERTION OF DATA AND ALGORITHM VALIDITY
Because of the flood of contradictory data available on the tourism topics discussed in
this study, arguments intended to invalidate its conclusions should be anticipated. In
point of fact, there is little tourism-related data that is entirely free from controversy.
However, to make his case, the critic must first counter the following facts reflecting
the ultra-conservative nature of the statistics used to analyze the two cases, oil and
tourism. These include:
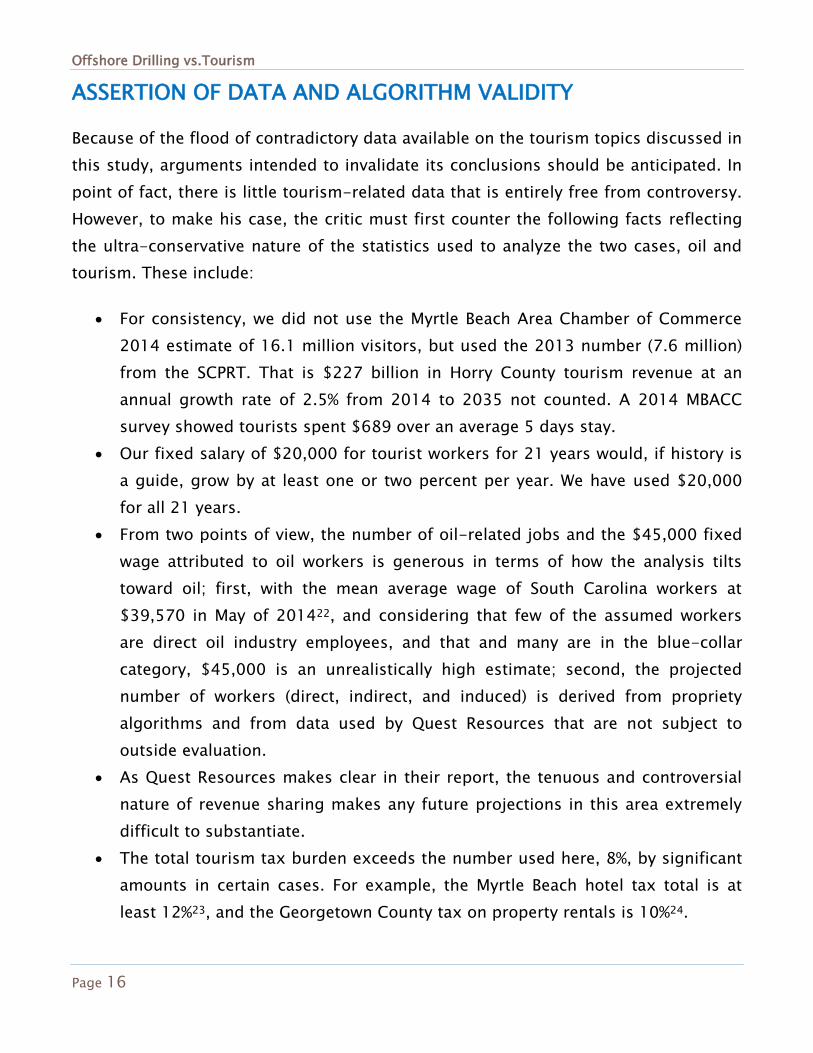
For consistency, we did not use the Myrtle Beach Area Chamber of Commerce
2014 estimate of 16.1 million visitors, but used the 2013 number (7.6 million)
from the SCPRT. That is $227 billion in Horry County tourism revenue at an
annual growth rate of 2.5% from 2014 to 2035 not counted. A 2014 MBACC
survey showed tourists spent $689 over an average 5 days stay.
Our fixed salary of $20,000 for tourist workers for 21 years would, if history is
a guide, grow by at least one or two percent per year. We have used $20,000
for all 21 years.
From two points of view, the number of oil-related jobs and the $45,000 fixed
wage attributed to oil workers is generous in terms of how the analysis tilts
toward oil; first, with the mean average wage of South Carolina workers at
$39,570 in May of 201422, and considering that few of the assumed workers
are direct oil industry employees, and that and many are in the blue-collar
category, $45,000 is an unrealistically high estimate; second, the projected
number of workers (direct, indirect, and induced) is derived from propriety
algorithms and from data used by Quest Resources that are not subject to
outside evaluation.
As Quest Resources makes clear in their report, the tenuous and controversial
nature of revenue sharing makes any future projections in this area extremely
difficult to substantiate.
The total tourism tax burden exceeds the number used here, 8%, by significant
amounts in certain cases. For example, the Myrtle Beach hotel tax total is at
least 12%23, and the Georgetown County tax on property rentals is 10%24.

Offshore Drilling vs.Tourism
Revenue Projected for South Carolina Page 17
The income tax rates shown, 4.5% for tourism workers and 7.0% for higher paid
oil workers, may not be exact. However, apart from income taxes, no other tax
benefits to the economy have been claimed. Thus, if the tax rates are high, they
are proportionately so, and will cause no distortion in the results. By adding the
amounts these workers pay in sales, property and other taxes, it is probable
that amounts exceeding the rates shown are paid to local, county, and state
taxing authorities.
Reduce by 30% to account for seasonal workers = $45.12B
Workers' taxes calculated at 4.5% effective rate for sales and income = $2.03 Billion
Tourism
Workers Coastal Workers
YEAR 4 Counties Salary Aggregate Salary
2015 128,319 $20,000 $2,566,380,000
2016 130,565 $20,000 $2,611,300,000
2017 132,849 $20,000 $2,656,980,000
2018 135,174 $20,000 $2,703,480,000
2019 137,540 $20,000 $2,750,800,000
2020 139,947 $20,000 $2,798,940,000
2021 142,396 $20,000 $2,847,920,000
2022 144,888 $20,000 $2,897,760,000
2023 147,423 $20,000 $2,948,460,000
2024 150,003 $20,000 $3,000,060,000
2025 152,628 $20,000 $3,052,560,000
2026 155,299 $20,000 $3,105,980,000
2027 158,017 $20,000 $3,160,340,000
2028 160,782 $20,000 $3,215,640,000
2029 163,596 $20,000 $3,271,920,000
2030 166,459 $20,000 $3,329,180,000
2031 169,372 $20,000 $3,387,440,000
2032 172,336 $20,000 $3,446,720,000
2033 175,352 $20,000 $3,507,040,000
2034 178,421 $20,000 $3,568,420,000
2035 181,543 $20,000 $3,630,860,000
$64.5 Billion
The Assumed Salary Growth is Zero, thereby Making this Estimate Highly Conservative
Economy for the Four Largest Coastal Counties(1.75% is the Assumed Year-over-Year Growth Rate of Tourism Jobs)

Offshore Drilling vs.Tourism
Page 18
The Following Calculations Show the Amount Spent by Tourists in the
Four Biggest Coastal Resort Counties (the next two pages comprise one
spreadsheet):
In terms of demonstrating SC's total economic result from tourism in a way that is analogous to the Quest figure above, it is necessary to include tourist expenditures for the four largest
coastal counties.
YEARVISITORS
MILLIONS
$ PER
VISITOR$MILLION YEAR
VISITORS
MILLIONS
$ PER
VISITOR$MILLION
2015 7.98 706 5,639 2015 0.57 565 320
2016 8.18 724 5,925 2016 0.58 579 336
2017 8.39 742 6,224 2017 0.59 594 353
2018 8.60 761 6,540 2018 0.61 608 371
2019 8.81 780 6,871 2019 0.63 624 390
2020 9.03 799 7,218 2020 0.64 639 410
2021 9.26 819 7,584 2021 0.66 655 430
2022 9.49 839 7,968 2022 0.67 672 452
2023 9.73 860 8,371 2023 0.69 688 475
2024 9.97 882 8,795 2024 0.71 706 499
2025 10.22 904 9,240 2025 0.72 723 524
2026 10.48 927 9,708 2026 0.74 741 551
2027 10.74 950 10,200 2027 0.76 760 579
2028 11.01 974 10,716 2028 0.78 779 608
2029 11.28 998 11,258 2029 0.80 798 639
2030 11.56 1023 11,828 2030 0.82 818 671
2031 11.85 1048 12,427 2031 0.84 839 705
2032 12.15 1075 13,056 2032 0.86 860 741
2033 12.45 1101 13,717 2033 0.88 881 778
2034 12.76 1129 14,412 2034 0.91 903 818
2035 13.08 1157 15,141 2035 0.93 926 859
$202,839 $11,509TOTAL
HORRY GEORGETOWN
Offshore Drilling vs.Tourism
Revenue Projected for South Carolina Page 19
Coastal Counties Calculation (Continued)
QUEST'S DATABASE AND ALGORITHM FOR PROJECTING INDIRECT AND INDUCED JOBS ARE PROPRIETARY AND ARE NOT AVAILABLE FOR OUR USE. AS A RESULT, WE PROJECT ONLY KNOWN NUMBERS OF DIRECT TOURISM EXPENDITURES AT A 2.5% YEAR-OVER-YEAR GROWTH RATE. THE 2.5% GROWTH FACTOR IS APPLIED BOTH TO THE NUMBER OF VISITORS AND THE AMOUNT THEY SPEND.
YEARVISITORS
MILLIONS
$ PER
VISITOR$MILLION YEAR
VISITORS
MILLIONS
$ PER
VISITOR$MILLION
2015 5.88 706 4,155 2015 2.84 847 2,404
2016 6.03 724 4,365 2016 2.91 869 2,526
2017 6.18 742 4,586 2017 2.98 890 2,654
2018 6.34 761 4,819 2018 3.05 913 2,788
2019 6.49 780 5,063 2019 3.13 935 2,929
2020 6.66 799 5,319 2020 3.21 959 3,077
2021 6.82 819 5,588 2021 3.29 983 3,233
2022 6.99 839 5,871 2022 3.37 1007 3,397
2023 7.17 860 6,168 2023 3.46 1033 3,569
2024 7.35 882 6,480 2024 3.54 1058 3,749
2025 7.53 904 6,809 2025 3.63 1085 3,939
2026 7.72 927 7,153 2026 3.72 1112 4,139
2027 7.91 950 7,515 2027 3.82 1140 4,348
2028 8.11 974 7,896 2028 3.91 1168 4,568
2029 8.31 998 8,296 2029 4.01 1197 4,800
2030 8.52 1023 8,716 2030 4.11 1227 5,043
2031 8.73 1048 9,157 2031 4.21 1258 5,298
2032 8.95 1075 9,620 2032 4.32 1290 5,566
2033 9.18 1101 10,107 2033 4.42 1322 5,848
2034 9.41 1129 10,619 2034 4.53 1355 6,144
2035 9.64 1157 11,157 2035 4.65 1389 6,455
$149,459 $86,473
Four County Total = $203 +$12 + $149 + $86 = $450 BillionVISITOR EXPENDITURES 2014 - 2035
BEAUFORTCHARLESTON
Offshore Drilling vs.Tourism
Page 20
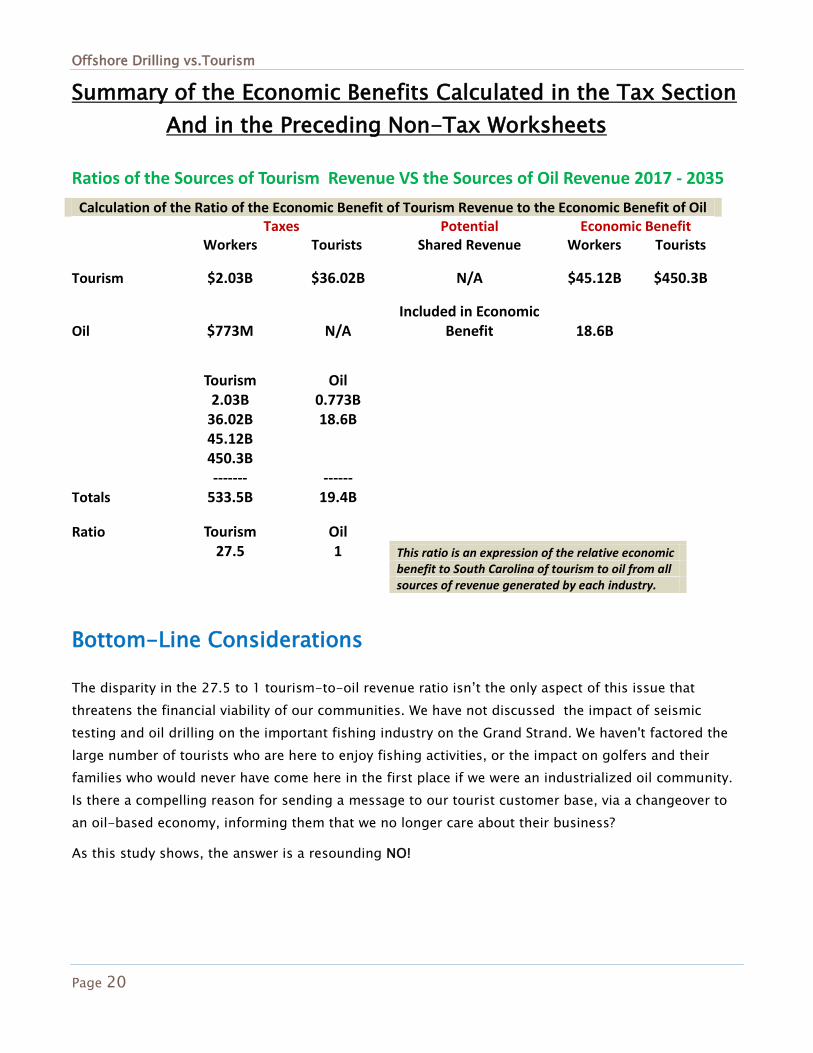
Summary of the Economic Benefits Calculated in the Tax Section
And in the Preceding Non-Tax Worksheets
Ratios of the Sources of Tourism Revenue VS the Sources of Oil Revenue 2017 - 2035
Calculation of the Ratio of the Economic Benefit of Tourism Revenue to the Economic Benefit of Oil
Taxes Potential Economic Benefit
Workers Tourists Shared Revenue Workers Tourists
Tourism $2.03B $36.02B N/A $45.12B $450.3B
Oil $773M N/A Included in Economic
Benefit 18.6B
Tourism Oil
2.03B 0.773B
36.02B 18.6B
45.12B
450.3B ------- ------
Totals 533.5B 19.4B
Ratio Tourism Oil
27.5 1 This ratio is an expression of the relative economic
benefit to South Carolina of tourism to oil from all
sources of revenue generated by each industry.
Bottom-Line Considerations
The disparity in the 27.5 to 1 tourism-to-oil revenue ratio isn’t the only aspect of this issue that
threatens the financial viability of our communities. We have not discussed the impact of seismic
testing and oil drilling on the important fishing industry on the Grand Strand. We haven't factored the
large number of tourists who are here to enjoy fishing activities, or the impact on golfers and their
families who would never have come here in the first place if we were an industrialized oil community.
Is there a compelling reason for sending a message to our tourist customer base, via a changeover to
an oil-based economy, informing them that we no longer care about their business?
As this study shows, the answer is a resounding NO!
Offshore Drilling vs.Tourism
Revenue Projected for South Carolina Page 21
What the ratio shows, in indelibly stark numbers, is that there is no economic interest of the State of
South Carolina or of its residents that is served by such a risky business strategy -- one that
superimposes an oil venture on a secure, tourism-based economy.
Nor is it apparent what national interest might be served in the face of an on-going oil glut that drives
Exxon-Mobil and Chevron to lobby hard to gain the right to sell crude extracted from America’s oceans
to overseas customers. Even American refineries lose under that scenario. While long-range planning is
normally advantageous, few of the benefits of the oil proposal are realized prior to 2026, or possibly
much later if oil prices remain at current levels, as is projected for the foreseeable future.
While the Outer Continental Shelf Governors Coalition is working to turn their Gulf Coast fantasy into
an Atlantic Coast reality, none have yet made their constituents aware that all revenues (if any are
legislated) go into a fund for coastal maintenance, not into the general fund. That has been the law in
the Gulf of Mexico, and it may well survive Congressional tinkering this time around.
Oil is yesterday’s energy source. By exhausting limited fossil-fuel resources, South Carolina
consciously chooses to forego the enormous opportunities, profits, and job numbers that would result
from refocusing on renewable energy. Its universities are poised to lead. Its entrepreneurs began
blazing trails years ago. Its climate is ideal to make it the R&D hub of alternative fuel research and
manufacturing.
Instead, its leaders choose to remain mired in a technology that offers only a single discernible
advantage – large campaign contributions – to a small group of leaders who appear to place their
personal interests above those of the state they were elected to serve.
Abbreviations and Acronyms
B – Billion(s)
BOEM – Bureau of Ocean Energy Management (Part of the DOI)
DOI – Department of the Interior
FPSO - Floating Production Storage and Offloading
M – Million(s)
NOAA – National Oceanographic and Atmospheric Administration
OCS – Outer Continental Shelf
OCSGC – Outer Continental Shelf Governors Coalition
R - Republican
RS – Revenue Sharing
R&D – Research & Development SC – South Carolina SCPRT – South Carolina Department of Parks, Recreation, and Tourism
Offshore Drilling vs.Tourism
Page 22
CONCLUSIONS
The risk/reward ratio of offshore drilling is daunting. Very little would be gained even if
there were no adverse impacts from deep water extraction of fossil fuels. No casino
owner, or state budget, could long survive by offering the odds indicated by the two
competing revenue sources. Officials in South Carolina, by volunteering to participate in
the federal leasing program, have unknowingly exposed state and county (not limited to
coastal counties) revenues to unsustainable shocks such as oil price fluctuations25,
uncertainty of revenue sharing income, job insecurity (e.g., 100,000 recent oil worker
layoffs in North Dakota), threatened marine mammal takings, coastal blight from oil
infrastructure and the impact that poses to property values23, unavoidable reductions in
tourist traffic to locations associated with oil production, and the undeniable risk of an oil
spill26.
To date, no pro-drilling officials have said “It can’t happen here.” The most frequently
offered reasons for assuming these risks are energy independence, lower gasoline prices,
and jobs. Each argument has repeatedly been shown to be without merit, although each
is often put forth in public venues. In a sense, this study closes the discussion by showing
that adhering to the virtually risk-free policy of aggressively growing South Carolina’s
vital tourism business holds vastly more promise for statewide economic prosperity.
Yet policy and political changes to eliminate the risks are not out of reach. If officials at
the gubernatorial, senatorial, and congressional level voiced opposition to continuing
with this reckless experiment and used their influence to withdraw South Carolina from
the program, a portion of the risk would be mitigated. But only by convincing the leading
political representatives of the three other participating states can the danger be fully
averted.

Offshore Drilling vs.Tourism
Revenue Projected for South Carolina Page 23
ENDNOTES:
1 The oil-related projections shown are from a December 2013 report by Quest Offshore Resources Inc.
entitled The Economic Benefits of Increasing U.S. Access to Offshore Oil and Natural Gas Resources in
the Atlantic. http://www.api.org/~/media/Files/Oil-and-Natural-
Gas/Exploration/Offshore/Atlantic-OCS/Executive-Summary-Economic-Benefits-of-Increasing-US-
Access-to-Atlantic-Offshore-Resources.pdf. This study was prepared for the American Petroleum
Institute (API) with assistance from the National Ocean Industries Association.
2 The question of what proportion of the shared money goes to which states is largely a federal
decision. See recent OCSGC letter: http://ocsgovernors.org/wp/wp-
content/uploads/2015/04/FINAL-OCSGC-Letter-on-DPP-2017-2022-03-30-15.pdf
3 Atlantic OCS lease map. See link at: http://www.boem.gov/Oil-and-Gas-Energy-
Program/Leasing/Five-Year-Program/2017-2022/2017-2022-DPP-Mid-Atlanticand-South-
Atlantic.aspx Also see: BOEM’s 2017-2022 Draft Proposed Lease Schedule Table S-1, Page S-3
http://www.boem.gov/2017-2022-DPP/
Cap is $375 million: http://fuelfix.com/blog/2015/05/14/coastal-states-launch-new-bid-for-
offshore-drilling-dollars/
4 http://www.doi.gov/news/upload/Interior-Fact-Sheet-Budget-2016.pdf;
http://bakken.com/news/id/233547/what-does-obamas-budget-mean-for-gulf-revenue-sharing/,
et al. “In his $4 trillion budget request to Congress, Obama also says he wants to change the way
money from offshore oil and gas production is shared with Gulf Coast states, by diverting more of
those dollars to national programs with “broad” natural resource and conservation benefits.”
5 http://fuelfix.com/blog/2015/02/02/obama-budget-would-slash-oil-tax-breaks-while-boosting-
renewables/
6 http://www.blm.gov/or/news/files/Interior_Disburses_13.4_Billion_in_FY14_Energy_Revenues_12-
14_.pdf; and http://www.eenews.net/stories/1060018851 “To hear your comments that effectively
the way you want to work with us is to redirect existing revenue payments ... not to the states that
are impacted, but basically to pull the rug out from under the promise that was already made, is a
little bit disconcerting, Murkowski said.”
7 http://fuelfix.com/blog/2013/11/08/report-royalty-revenue-sharing-plan-carries-high-pricetag/
“Existing law will give four coastal states — Alabama, Louisiana, Mississippi and Texas — 37.5
percent of oil and gas royalty revenue on most Gulf of Mexico leases beginning in 2017, but it is
capped at $375 million annually.”

Offshore Drilling vs.Tourism
Page 24
8 100,000 Layoffs And Counting: Is this the New Normal? http://www.wsj.com/articles/oil-layoffs-hit-
100-000-and-counting-1429055740
9 Direct, Indirect and Induced Impacts of Tourism in South Carolina.”
https://www.scprt.com/files/Research/SC%20TSA%202013%20Report%20-%20Final.pdf
10 http://www.palmettoinstitute.org/client_resources/bethea%20-%20tourism-%20manifesto.pdf
11 https://www.scprt.com/files/Research/County%20Level%20Visitation%20Estimates.pdf
12 NOAA List of coastal counties in U.S:
https://www.census.gov/geo/landview/lv6help/coastal_cty.pdf
13 South Carolina Department of Parks, Recreation and Tourism 2013 tourism visitor numbers updated
by 2.5% for 2014.
Horry County Formula is [# of visitors X expenditure per visitor X 8% tax] = (7790000 X 689 ) X .08 =
$429 million for 2014. The number most often seen for Horry County is not 7.6 million visitors in
2013, but 14 million in 2010 and 16.1 million visitors (supported by the Myrtle Beach Chamber of
Commerce) in 2014. Horry County Government puts this number at 14 million for 2013 on page 32
of their Annual Financial Plan for Fiscal Year July 1, 2014 To June 30, 2015:
(http://www.horrycounty.org/Portals/0/Docs/BudgetAndRevenue/budgetFY2015.pdf) However, we
concluded that the requirement for a consistent reference source (SCPRT) for all four counties
overrode the use of the more commonly referenced number and so we used the lower number. The
Chamber of Commerce per tourist revenue calculation uses the formula $2755/4 = $689 per tourist:
page 29). Median Party Size = 4 people. Avg. Length of Stay = 5 nights in 2014
(http://www.myrtlebeachareachamber.com/research/docs/2014MyrtleBeachEconomicImpactStudy.pd
f,
14 Georgetown County Formula is [# of visitors X Expenditure per visitor X 8% tax] = 552,475 X 551 X
.08 = $24 million for 2014. Our reasoning for using 80% of the Horry County rate is that there are
fewer tourist attractions in Georgetown County.
15 Charleston County Formula is [# of visitors X Expenditure per visitor X 8% tax] = 5,740,000 X 689 X
.08 = $316 million for 2014.
16 Beaufort County Formula is [# of visitors X Expenditure per visitor X 8% tax] = 2,767,500 X 827 X .08
= $183 million for 2014. The assumed expenditure is 120% of the Horry County figure since Hilton
Head constitutes much of this revenue and the typical visitor is presumed to be more affluent than
the typical Horry County visitor.
Offshore Drilling vs.Tourism
Revenue Projected for South Carolina Page 25
17 API TABLES ON REVENUE SHARING, etc., TABLE 2: http://www.api.org/~/media/Files/Oil-and-
Natural-Gas/Exploration/Offshore/Atlantic-OCS/Executive-Summary-Economic-Benefits-of-
Increasing-US-Access-to-Atlantic-Offshore-Resources.pdf
18 Assumes a $45,000 salary and 7% income tax rate. The total jobs projection of the API report (Table
2) shows 6,057 for the year 2020, 37,751 for 2025, and 215,612 (contradicting the text, which
claims “nearly 280,000 jobs”) for 2035. All job numbers are rounded.
19 For the Grand Strand - Coastal Carolina Univ.:
http://www.tourismworksforus.com/economic_impact.html and Dr. Robert Salvino BB&T, May 2012:
http://www.tourismworksforus.com/docs/TourismImpactStudyCCI_5-16-12_final.pdf . In
November of 2014, “The rate of job growth along South Carolina's Grand Strand has been one of the
fastest in the nation during recent months.” 73,500 tourism employees.
For Charleston County - 35,000 direct employees (2012)
http://www.charlestoncounty.org/files/AnnualReport2012.pdf
For Beaufort County/Hilton Head - 17,612
http://www.thinkhiltonheadisland.org/article-details?hhaid=345 (Click on Download Files)
20 Taxes paid = number of jobs * $20,000 (assumed salary) * .045 (effective sales + income tax rate)
21 “Tourism job growth” sum (73500 + 35000 + 17612) = 126112 Coastal Tourism Jobs starting figure
2014. $2,030,432,648 is the sum of the four counties’ tourism workers' tax revenue paid to the
state. The extrapolation assumes an annual growth rate of 2.5%
22 US Bureau of Labor Statistics. http://www.bls.gov/oes/current/oes_sc.htm#00-0000
23 City of Myrtle Beach Local Government: http://www.cityofmyrtlebeach.com/didyouknow2.html
24 The Lachicotte Company Policies – General Information: http://www.lachicotte.com/pawleys-island-
vacation-rentals/rental-policies
25 Houston Outlook Grows Darker as the Oil Downturn Becomes Deeper and Longer:
http://www.bauer.uh.edu/centers/irf/houston-updates.php
26 The real estate industry along the Gulf Coast was hit disproportionally hard by the BP oil spill:
http://www.floridalegalrights.com/About-The-BP-Settlement/Real-Estate.shtml
http://usatoday30.usatoday.com/money/economy/housing/2010-08-19-
gulfrealestate19_ST_N.htm

Offshore Drilling vs.Tourism
Page 26
APPENDIX I
Showing projected contribution to South Carolina's economy from oil drilling in the
Atlantic compared to:
The projected contribution to South Carolina's economy from tourist spending and
tourism workers' wages in Horry, Georgetown, Charleston and Beaufort Counties in
Billions of Dollars year-by-year from 2015 to 2035.
To download a copy: http://www.sodasc.com/facts
0
5
10
15
20
25
30
35
40 2
01
5
20
16
20
17
20
18
20
19
20
20
20
21
20
22
20
23
20
24
20
25
20
26
20
27
20
28
20
29
20
30
20
31
20
32
20
33
20
34
20
35
Tourism $
Oil $