offshore & onshore wind energy in the usa - ahk usa & onshore wind energy in the usa . 3rd...
TRANSCRIPT

Offshore & Onshore Wind Energy in the USA
3rd German-American Wind Energy ConferenceJune 28, 2011
Randall SwisherSenior Executive AdvisorAmerican Wind Energy Association

American Wind Energy Association
AWEA is the trade association for the wind energy industry• 2,500 business members including manufacturers,
developers, transportation, utilities, construction, insurers, financial community and technical support representing 75,000
wind jobs • Develops policies and conducts analysis to support wind
industry growth• Execute wind industry’s legislative agenda• Promotes wind energy through advocacy, advertising and
media relations• Convenes conferences and workshops to educate the public
and bring industry members together.www.PowerofWind.com www.awea.org

The Wind Market in the U.S. – Setting the Context
• The Numbers• Leading States• Market Drivers• Challenges & Strategies• Moving Offshore
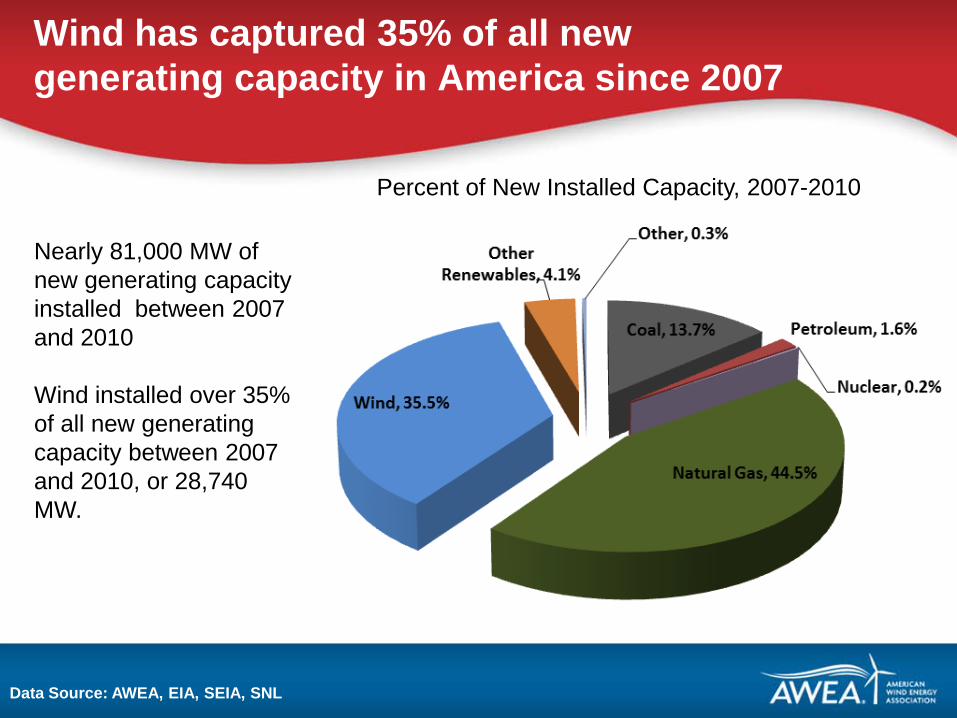
Wind has captured 35% of all new generating capacity in America since 2007
Data Source: AWEA, EIA, SEIA, SNL
Nearly 81,000 MW of new generating capacity installed between 2007 and 2010
Wind installed over 35% of all new generating capacity between 2007 and 2010, or 28,740 MW.
Percent of New Installed Capacity, 2007-2010

Coal Market Share,Drop Since 2003
- 6.0 percentage pts
Renewable Market Share,Increase Since 2003+ 2.0 percentage pts
Natural Gas Market Share Increase Since 2003+ 7.0 percentage pts
Source: EIA, Net Generation All sectors*All Renewables does not include hydro
U.S. Electric Power Markets are Getting Cleaner
Wind today provides about 2.3% of the nation’s electricity
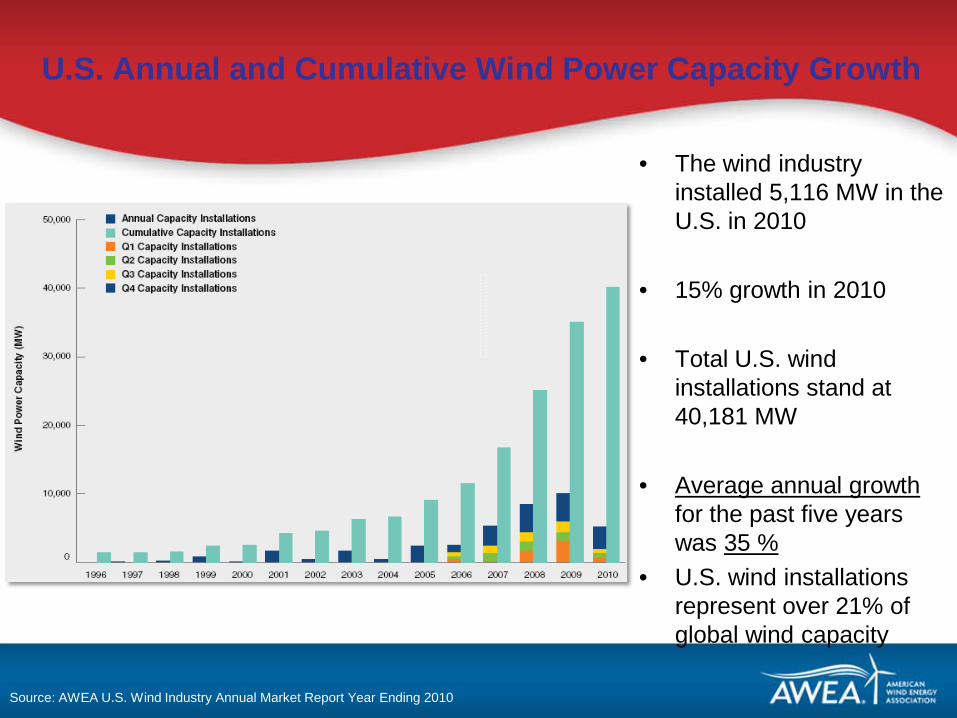
U.S. Annual and Cumulative Wind Power Capacity Growth
• The wind industry installed 5,116 MW in the U.S. in 2010
• 15% growth in 2010
• Total U.S. wind installations stand at 40,181 MW
• Average annual growthfor the past five years was 35 %
• U.S. wind installations represent over 21% of global wind capacity
Source: AWEA U.S. Wind Industry Annual Market Report Year Ending 2010

U.S. Market Stronger in 2011
• 1Q 2011 – more than 1,100 MW installed, more than double the capacity brought online in 1Q 2010
• At the end of 1Q 2011, more than 5,600 MW remains under construction

American Wind Energy Association * 4th Quarter 2010 Market Report
Wind Installations by State
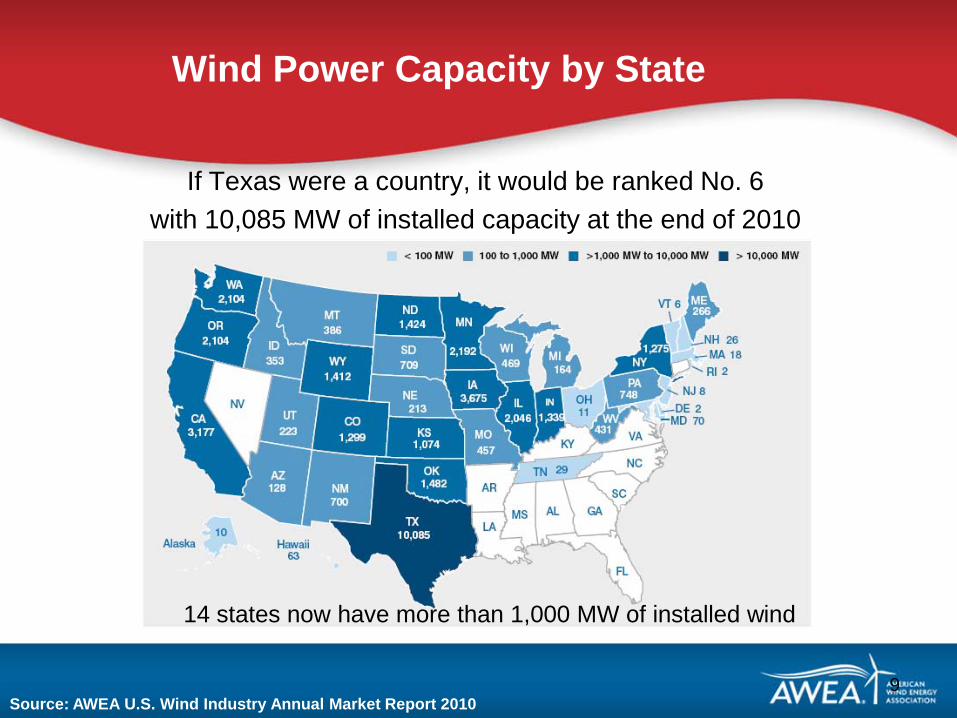
Wind Power Capacity by State
If Texas were a country, it would be ranked No. 6 with 10,085 MW of installed capacity at the end of 2010
9Source: AWEA U.S. Wind Industry Annual Market Report 2010
14 states now have more than 1,000 MW of installed wind
What are the Market Drivers for Wind?
• Competitive Economics• Popular Support • Supportive Policy • The New Energy Economy – Jobs! • Carbon Risk• Constraints on Coal and Nuclear
– 50 GW of coal retirements in next decade (ICF)Let’s look more closely at a few of the key drivers . . .
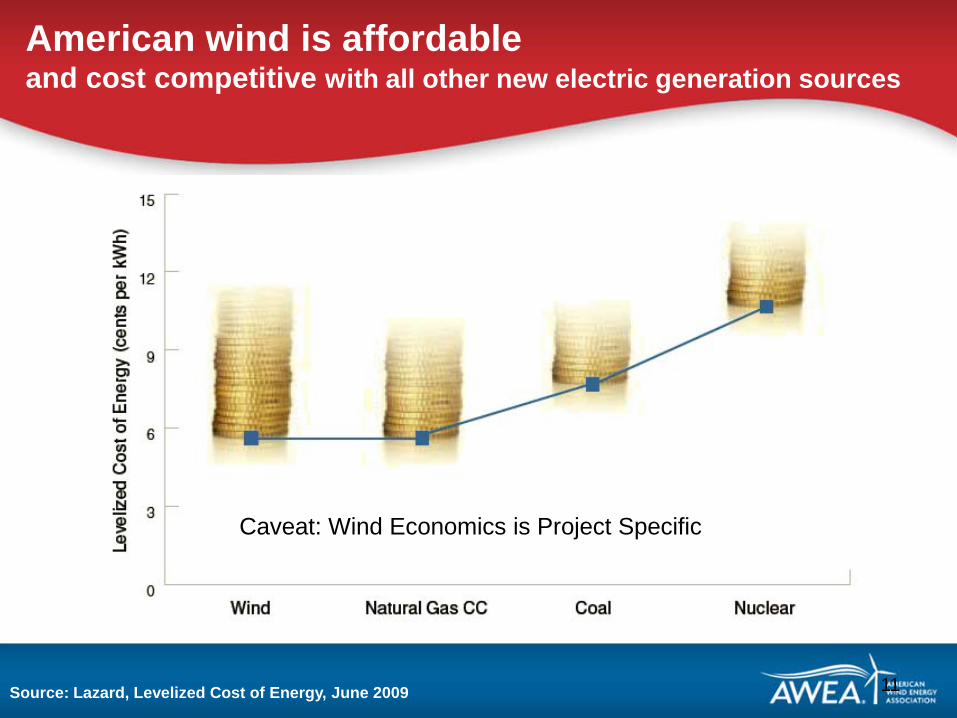
American wind is affordableand cost competitive with all other new electric generation sources
Source: Lazard, Levelized Cost of Energy, June 2009 11
Caveat: Wind Economics is Project Specific
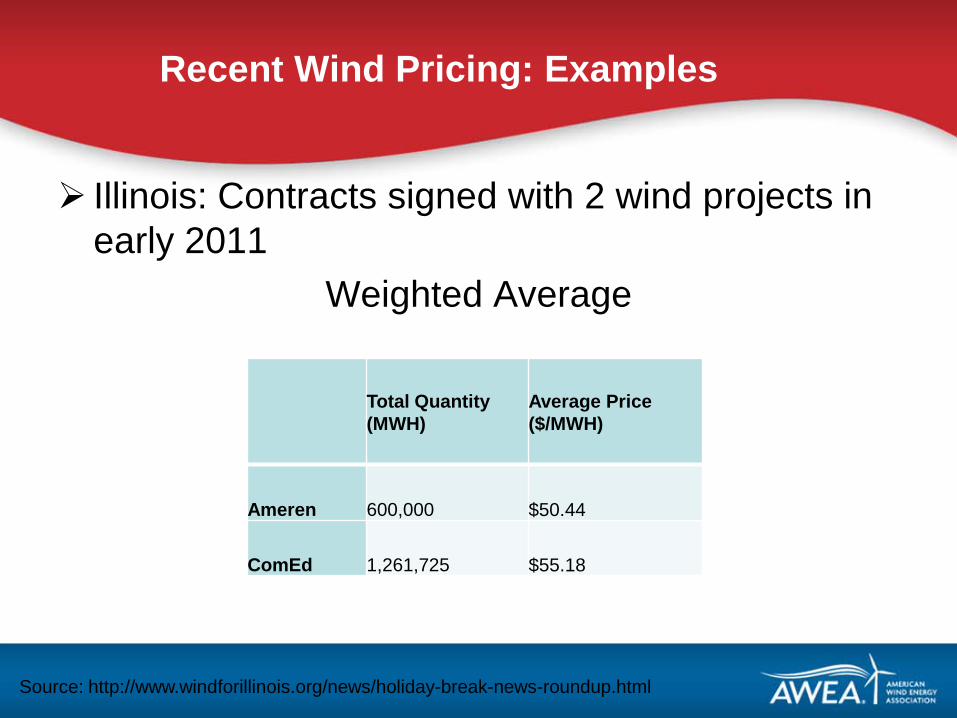
Recent Wind Pricing: Examples
Illinois: Contracts signed with 2 wind projects in early 2011
Weighted Average
Total Quantity (MWH)
Average Price ($/MWH)
Ameren 600,000 $50.44
ComEd 1,261,725 $55.18
Source: http://www.windforillinois.org/news/holiday-break-news-roundup.html

Wind Power: America’s Choice
Source: March 2010 survey by Public Opinion Strategies and Bennett, Petts & Normington
Policy status & path forwardU.S. “Portfolio Approach” to policy
• U.S. approach to energy policy involves a portfolio of policies at the state and national level:
• AWEA’s continued national focus: – to pass a long term renewable energy policy – Long-term tax policy that encourages investment
• 1603 tax credit refundability was extended for another year complementing the option to use the PTC through 2012.
– provisions that expedite transmission build.
• Greater focus by AWEA on state jurisdiction over power generation through state regulatory process. States like California, Colorado increasing targets so new opportunities. Look for tweaks in state RES and tax policy to drive demand.

Growth of OEMs in US Market
Source: AWEA, U.S. Wind Industry Annual Report, Year Ending 2009
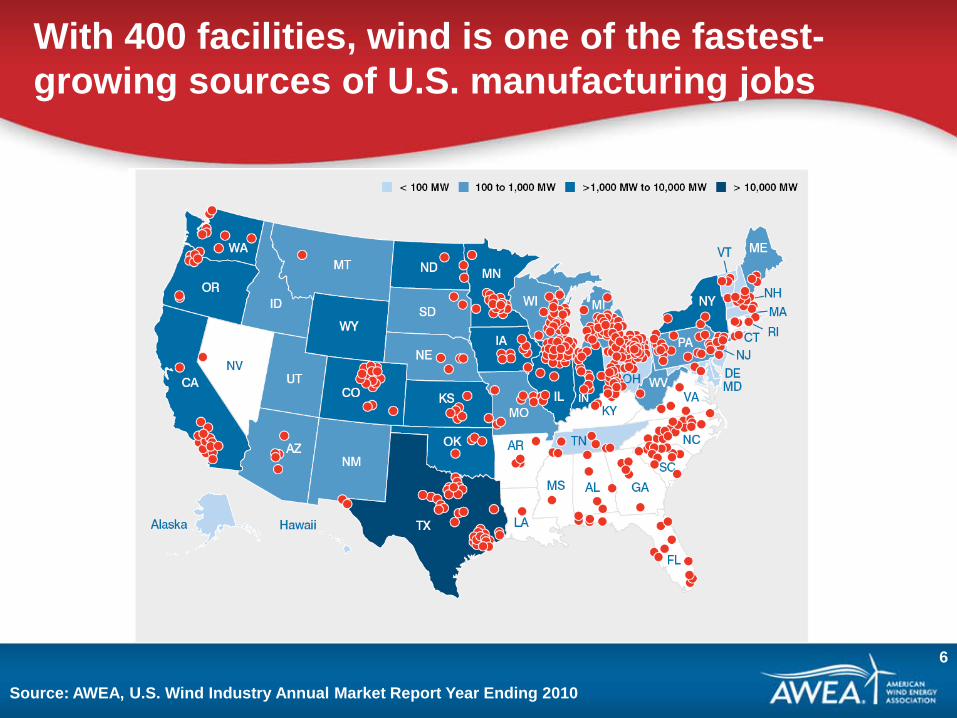
With 400 facilities, wind is one of the fastest-growing sources of U.S. manufacturing jobs
6
Source: AWEA, U.S. Wind Industry Annual Market Report Year Ending 2010

20% Wind Energy by 2030DOE Report Identifies the Path
• U.S. Department of Energy:“The U.S. possesses sufficient and affordable wind resources to obtain at least 20% of its electricity from wind by the year 2030.”
20% wind represents about 300 GW of capacity

The Challenges
• Near-term: Impact of Recession • Need for Stable, Long-term Policy• Low Gas Prices• Need for Transmission Infrastructure
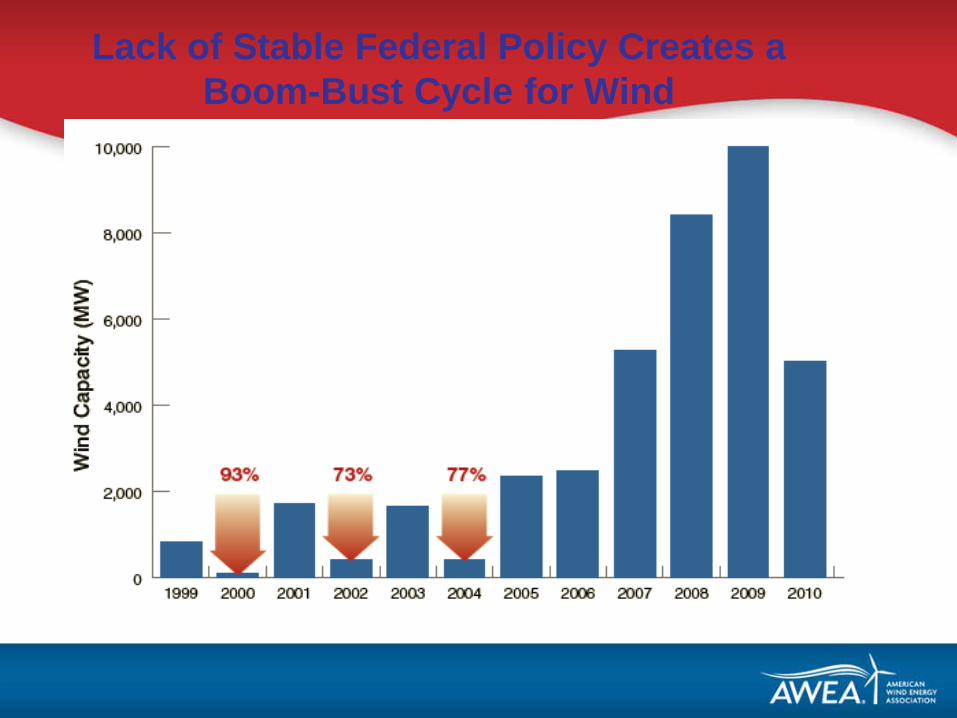
Lack of Stable Federal Policy Creates a Boom-Bust Cycle for Wind
0
2
4
6
8
10
12
14
16
1990
1991
1992
1993
1994
1995
1996
1997
1998
1999
2000
2001
2002
2003
2004
2005
2006
2007
2008
2009
2010
2011
2012
2013
2014
2015
2016
2017
2018
2019
2020
2021
Nom
inal
$/M
MB
tu (H
enry
Hub
)
0
2
4
6
8
10
12
14
16
Nom
inal
$/M
MB
tu (H
enry
Hub
)
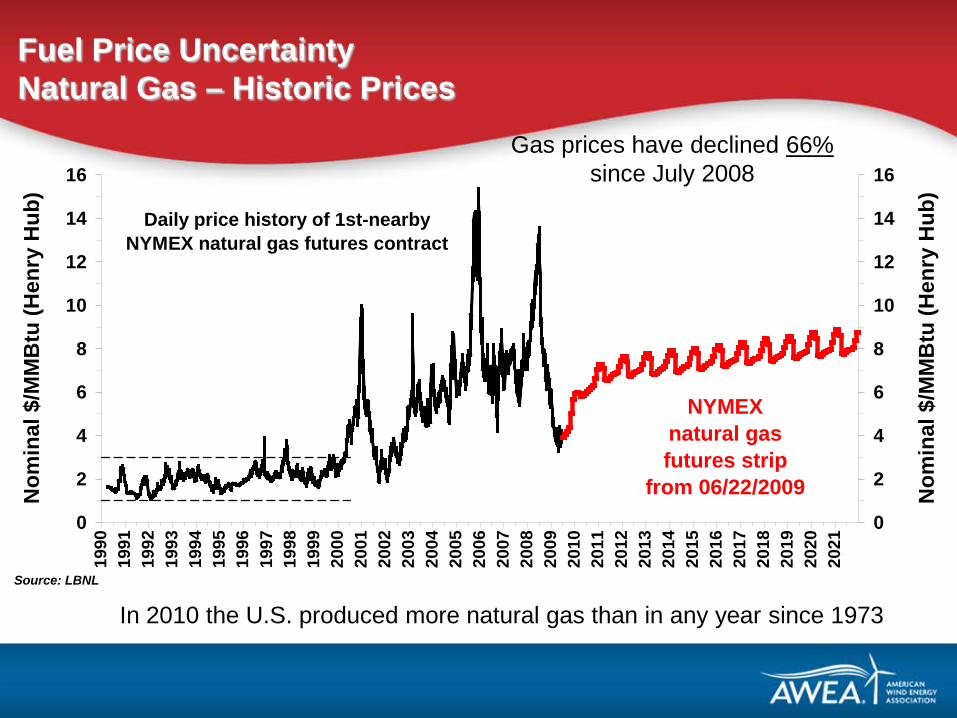
Source: LBNL
NYMEXnatural gas futures strip
from 06/22/2009
Daily price history of 1st-nearby NYMEX natural gas futures contract
Fuel Price UncertaintyNatural Gas – Historic Prices
In 2010 the U.S. produced more natural gas than in any year since 1973
Gas prices have declined 66%since July 2008
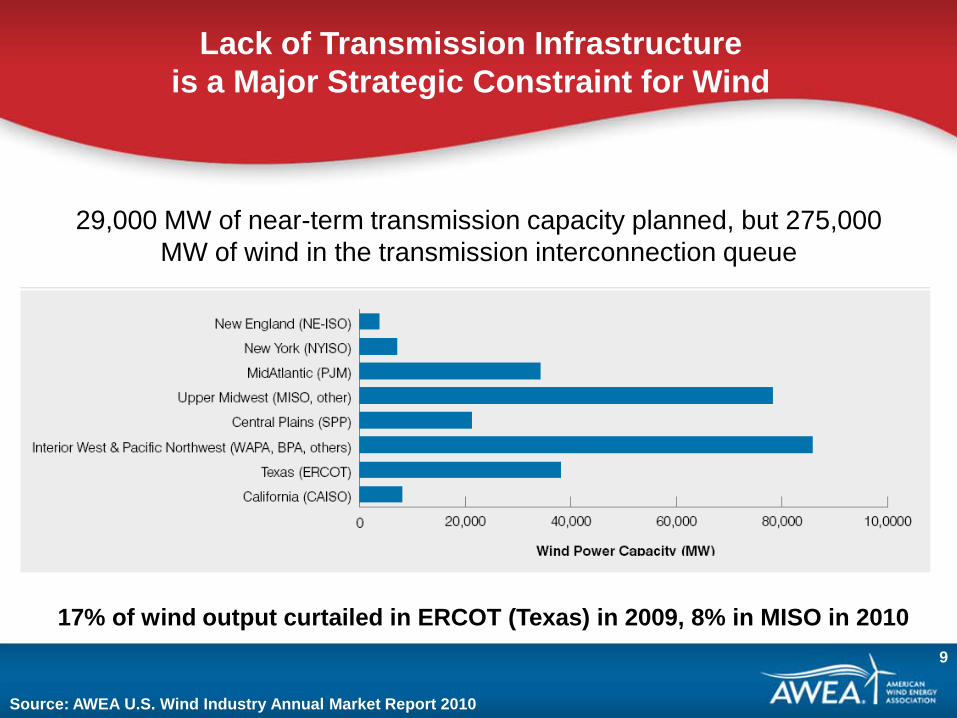
Lack of Transmission Infrastructure is a Major Strategic Constraint for Wind
9
29,000 MW of near-term transmission capacity planned, but 275,000 MW of wind in the transmission interconnection queue
Source: AWEA U.S. Wind Industry Annual Market Report 2010
17% of wind output curtailed in ERCOT (Texas) in 2009, 8% in MISO in 2010

Transmission Investment Pays for Itself
• Transmission is essential for competition and economic growth.
→The most competitive electricity market in the world is Texas, where all beneficiaries pay a share of the grid.
→Transmission development has been a bipartisan initiative.
• The opponents of FERC’s initiatives are trying to protect their generation market power through a congested inefficient grid.
Texas Grid Operator analysis of transmission benefits and costs

The Vision: Green Power Superhighways
• Link areas with vast supplies of renewables to areas of high electricity demand - green power superhighways
• Improve grid operations
Example: Clean Line Energy

• Policy reforms needed to allow new transmission construction to proceed:– Planning (pro-active planning)– Paying (broad regional cost allocation)– Permitting (streamlined siting)
• AWEA-SEIA white paper at http://www.awea.org/GreenPowerSuperhighways.pdf
Transmission Policy Reform Needed: The Three P’s

Offshore Wind: The New Frontier
Does Offshore Wind Have a Future in the U.S.?

Graphic Credit: Bruce Bailey AWS Truewind
Why Offshore Power ?
US Population Concentration U.S. Wind Resource
28 coastal states use 78% of the electricity in US
U.S. Population Density
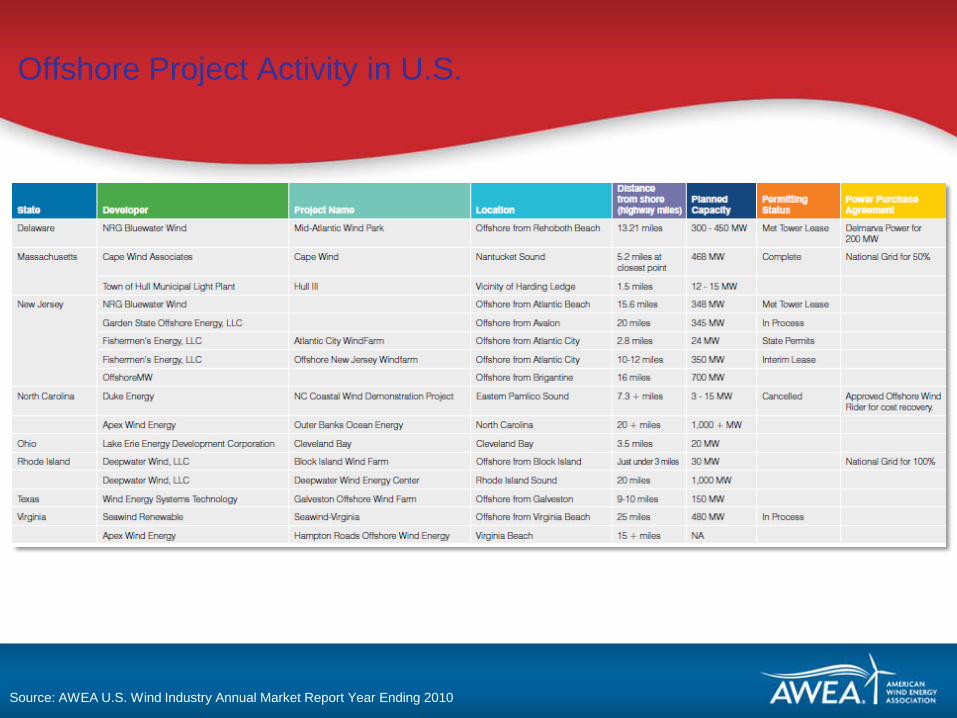
Offshore Project Activity in U.S.
Source: AWEA U.S. Wind Industry Annual Market Report Year Ending 2010
Offshore – How Big Could It Be?
• (NREL) estimates that U.S. offshore winds have a gross potential generating capacity four timesgreater than the nation’s present electric capacity
• Under conservative assumptions about transmission, fossil fuel supply, and supply chain availability, the United States could feasibly build 54 GW of offshore wind power by 2030 - 20% Wind Energy by 2030, U.S. Department of Energy, July 2008

A Few Offshore Wind Challenges
• Economics, economics, economics• Long development / permitting cycle
– Regulatory uncertainties• Obama Administration making progress
• Policy uncertainties – need long-term incentives in place
• Infrastructure bottle necks• Transmission policy• Industry “roadmap”

Questions?