offsite detection of insider abuse and bank fraud … · offsite detection of insider abuse and...
TRANSCRIPT
PRELIMINARY DRAFT – DO NOT CITE OR DISTRIBUTE WITHOUT AUTHORS’ PERMISSION
Offsite Detection of Insider Abuse and Bank Fraud
among U.S. Failed Banks 1989 - 2015
John P. O’Keefe Federal Deposit Insurance Corporation
550 17th Street, NW Washington, DC 20429
And
Chiwon A. Yom Federal Deposit Insurance Corporation
550 17th Street, NW Washington, DC 20429
September 21, 2017
Key words: Bank Supervision, Bank Failure Prediction
JEL classification code: G21, G22, G28
_____________________
* Disclaimer -The analysis, conclusions, and opinions set forth here are those of the author(s) alone and do not necessarily reflect the views of the Federal Deposit Insurance Corporation.
DRAFT – DO NOT QUOTE OR DISTRIBUTE WITHOUT AUTHORS PERMISSION
1
Abstract
We find evidence that material insider abuse and internal fraud were present in approximately 457 (37
percent) of the 1,237 U.S. failed commercial and mutual savings banks (hereafter, banks) between 1989
and 2015. Using a unique dataset of the incidence of insider abuse and internal fraud among U.S. failed
banks we analyze the characteristics of these banks with the ultimate goal of developing fraud detection
models—parametric (logistic regression, Benford digit analysis) and non-parametric (neural networks).
We obtain information on the incidence of insider abuse and internal fraud among failed banks from
failing bank cases prepared for the FDIC Board of Directors, restitution orders (fines) supervisors
assessed for bank employee fraud, and bond claims the FDIC made to recover fraud-related losses on
failed banks. The supervisory data we use to quantify fraud among failed banks has not been used
previously in published research and, we feel, provides more comprehensive information on fraud
among failed banks than that available to academic researchers. This data allows us to better quantify
the role of internal fraud among bank failures and model the likelihood of insider abuse and internal
fraud. Our results suggest that material insider abuse and fraud at banks is detectable using Benford
digit analysis of bank financial data for a period one-to-four years prior to failure. Specifically, we use a
recently developed second order Benford digit test to identify those banks whose financial statements
suggest tampering and purposeful misstatement. Unfortunately, we are unable to develop an accurate
neural network model for fraud prediction. Finally, regression analysis of the determinants of failure
among banks with insider abuse and fraud compared to other types of failed banks are in agreement
with the literature on fraud in banking, which finds banks with insider abuse and fraud present will
overstate income and asset values, under-report losses and consequently overstate capitalization.

DRAFT – DO NOT QUOTE OR DISTRIBUTE WITHOUT AUTHORS PERMISSION
2
ABBREVIATIONS AND ACRONYMS
BC Bond Claim
FDIC U.S. Federal Deposit Insurance Corporation
RO Restitution Order
SEC Securities and Exchange Commission

DRAFT – DO NOT QUOTE OR DISTRIBUTE WITHOUT AUTHORS PERMISSION
3
Table of Contents
1. Introduction .......................................................................................................................................... 4
2. Previous Literature on Fraud ................................................................................................................ 5
3. Proposed Fraud Detection Framework ............................................................................................... 13
4. Previous Literature on Fraud Detection .............................................................................................. 14
4.1. Law of Anomalous Numbers ....................................................................................................... 16
4.1.1. Fraud Detection Using the Law of Anomalous Numbers .................................................... 20
4.1.2. Benford Law Second Order Test ......................................................................................... 22
5. Data ..................................................................................................................................................... 23
6. Model Calibration and Results ............................................................................................................ 27
6.1. Law of Anomalous Numbers ....................................................................................................... 27
6.2. Logit Regression .......................................................................................................................... 34
6.3. Neural Networks ......................................................................................................................... 37
7. Conclusions ......................................................................................................................................... 37

DRAFT – DO NOT QUOTE OR DISTRIBUTE WITHOUT AUTHORS PERMISSION
4
1. Introduction
Insider abuse and fraud committed by bank employees can be difficult to detect, especially fraud
committed by senior bank officers who have access to all areas of bank operations.1 Insider abuse and
internal bank fraud often contribute to bank failures. We estimate that of the 1,237 commercial and
mutual savings banks (hereafter, banks) that failed between 1989 and 2015, approximately 457 (37
percent) had material insider abuse and/or internal fraud that was detected by bank examiners.2
We use three sources of information on the incidence of internal fraud at failed banks—FDIC failing bank
board cases, restitution orders and bond claims. FDIC failing bank board cases are prepared by the
FDIC’s Division of Resolutions and Receiverships for the FDIC Board of Directors to assist the Board in
determining the most appropriate method to resolve bank failures. The failing bank board cases contain
safety and soundness examination histories and describe events at banks that preceded bank failures,
including insider abuse and internal fraud. Bank regulators can issue restitution orders with monetary
fines on bank employees for fraud. Restitution orders can be issued before, during or after bank failure.
Finally, for banks with bond insurance, the FDIC, in its role as failed-bank receiver, may file claims with
failed-bank insurers to recover losses caused by bank employee fraud—bond claims.3
It is important to point out that our measures of bank insider abuse and fraud include instances where
bank regulators suspected fraud, as well as instances of confirmed criminal activity. Section (8) (b) (6) of
the Federal Deposit Insurance Corporation Act (FDI Act) authorizes the FDIC to issue restitution orders.
Under FDI Act Section (6) (b) (6) (A) there are two statutory factors the FDIC must meet:
1 We include in this definition of fraud behavior by bank employees that while deceptive, dishonest and costly to
the bank, did not necessarily lead to criminal court convictions. 2 Banks that received open bank assistance are not included in our failed-bank sample.
3 Between 1989 and 2015 FDIC failing bank board cases identified 202 banks with material insider abuse and/or
internal fraud, typically involving senior bank officers. Over this same period the FDIC made bond claims for bank employee fraud for 205 failed banks and bank supervisors issued material restitution orders on 213 failed banks; resulting in 457 banks with fraud-related penalties and/or insurance claims. Restitution orders can be for very small amounts, hence, we use a materiality threshold that requires the sum of restitution orders issued to a bank’s employees (before, during and after failure) to be at least 25 percent of FDIC resolution costs for the bank and use the 213 material restitution order cases to obtain our total fraud-related bank failure count. We point out there is substantial overlap among our three fraud-related failed-bank flags—FDIC failing bank board cases, restitution orders and bond claims.

DRAFT – DO NOT QUOTE OR DISTRIBUTE WITHOUT AUTHORS PERMISSION
5
1) the bank was unjustly enriched through a violation of law, regulation or unsafe and unsound practice,
2) the act or practice involved a reckless disregard for the law or regulation.4 Many restitution orders
the FDIC issues are the result of criminal activity in which the defendant has been found guilty or plead
guilty in court. Bond claims are based on dishonest and fraudulent activity by bank employees that may
or may not have resulted in criminal court convictions. Finally, FDIC failing bank board cases discuss
insider abuse, violations of bank regulation and instance of suspected criminal activity. Since we are
interested in approaching the problem of insider abuse and internal bank fraud as a risk to the deposit
insurer we do not limit our analysis to instances where fraudulent activity was confirmed by the courts.
To acknowledge this approach, we use the terms insider abuse and bank fraud to include instances
where dishonest and deceptive behavior by bank insiders were found by bank regulators regardless of
the criminality of that behavior.
U.S. bank supervisors focus their surveillance programs on financial risks—credit, concentration,
country, liquidity and market risks. U.S. bank supervisors also conduct onsite inspections of bank
controls for money laundering and suspicious activity; however, these inspections are aimed at
fraudulent activity by bank customers who may be acting with or without the cooperation of bank
employees. The fraud detection framework we propose in this paper is designed for offsite detection of
material insider abuse and fraud by bank employees and senior management.
The remainder of the paper is organized as follows. Section 2 reviews the literature on fraud and bank
fraud in particular. Section 3 presents our proposed framework for detecting insider abuse and internal
bank fraud. Section 4 discusses the literature on offsite detection of fraud. Section 5 discusses our data
on insider abuse, internal bank fraud and fraud risk indicators, followed by model calibration and results
in Section 6. Section 7 concludes.
2. Previous Literature on Fraud
Fraud is defined as “a deliberate deception practiced so as to secure unfair or unlawful gain”.5 Cressey
(1951) interviewed violators of financial trust, e.g., embezzlers, at the Illinois state penitentiary at Joliet
to understand the reasons why individuals in trusted positions committed fraud, i.e., became trust
violators. Cressey (1951) found three conditions motivate all trust violations: 1) individuals must
4 See “Formal and Informal Action Procedures (FIAP) Manual, (December 21, 2015). FDIC, chapter 10.
5 See “Webster’s II New Riverside University Dictionary”, The Riverside Publishing Company, Boston MA (1984).

DRAFT – DO NOT QUOTE OR DISTRIBUTE WITHOUT AUTHORS PERMISSION
6
perceive they are under some form of financial pressure they cannot share with others, 2) be able to
rationalize fraud with their trusted position and 3) have the opportunity to resolve their financial
problems through fraud. Cressey (1951) found that all three of these conditions must be present for
trust violations to occur. Cressey’s scientific approach to understanding financial crime is a departure
from moralistic explanations that the causes of trust violation are individuals’ bad habits, e.g., gambling,
and personal and business failures. In Cressey’s model, these habits, personal and business failures
create financial pressure; the trusted position provides opportunities for fraud and an individual’s
decision to not seek help in resolving financial pressure are the conditions necessary for trust fraud to
occur.6 Trust violators may feel perfectly legal and ethical failings, e.g., business losses, indicate personal
deficiencies of such magnitude they will not share the financial pressure with anyone. The inability to
share the financial pressure is based on the trust violator’s perception; as Cressey (1951) points out,
where one banker might seek help for his failing bank another might be too ashamed to seek help.
Wheeler (1982) examines the nature of white-collar crime using information from pre-sentencing
investigations (PSI) for eight categories of white-collar crime—antitrust violations, securities fraud,
postal and wire fraud, false claims, credit and lending institution fraud, bank embezzlement, tax evasion,
and bribery. The PSI sample covers fiscal years 1976 through 1978 and includes a national sample of
antitrust and securities crimes and a sample of cases from seven federal district courts for the remaining
six categories of white-collar crimes. The PSI data provide descriptions of the fraud and the context in
which it was carried out, as well as details on individuals charged with the fraud. Wheeler (1982), using
the PSI data, categorized offenders into three types—individual, occupational and organizational.
Individual offenders committed the crime alone and did not use their occupation or an organization to
carry out the crime. Occupational offenders may have committed the crime alone or with others and
their occupation played a role in the crime. Finally, organizational offenders worked alone or with others
in carrying out the crime and their occupation and organization both played a role in the crime.7
Wheeler’s main hypothesis is that white-collar criminals can use the organization as a tool with which to
carry out the crime. Wheeler (1982) found that organizational crimes occurred more frequently, lasted
over longer time periods, had wider geographic scope, and had a greater impact in terms of both dollars
6 Cressey (1951) reports that many trust violators he interviewed stated they did not spend stolen money on
gambling or other illicit activity but were pressured by police to come up with a better explanation of where the money went than what they initially (truthfully) told police. Cressey (1951) also suggests courts anxious for conviction preferred low moral character as a factor in trials since it made convictions easier for prosecutors. 7 Wheeler combined occupational and organizational attributes of offenders because the nature of organizational
offenders made it impossible to separate the two attributes.

DRAFT – DO NOT QUOTE OR DISTRIBUTE WITHOUT AUTHORS PERMISSION
7
stolen and number of victims adversely affected by the crime than did frauds carried out by individual
and occupational offenders. Organizational offenders tended to be older, better educated, hold higher
positions in companies and have fewer, if any, prior criminal offenses than did occupational and
individual offenders.8 Wheeler (1982) suggests that organizational offenders’ relatively impeccable
credentials allowed them to gain the trust that permits fraudulent activity to be more lengthy and
widespread. The organization also allows offenders to hide the crime through falsification of documents.
Wheeler (1982) concludes the organization is used by the offender to carry out a much grander crime
than would be otherwise possible. While Wheeler (1982) found convicted organizational offenders
served somewhat longer prison sentences than did occupational and individual white-collar offenders,
the difference was small, suggesting less punishment relative to damage done compared by other white-
collar criminals.9
Albrecht (1991) examines fraud in government entities and private companies. Albrecht (1991) explains
that those who commit fraud are typically perceived to be honest and have earned trust in the
organization. Albrecht (1991) introduced the term “fraud triangle” to combine the three conditions
Cressey (1951) found necessary to motivate fraud—perceived pressure, opportunity and
rationalization.10
Figure 1. Fraud Triangle
Albrecht (1991) comments that of the two most general ways to obtain money from organizations
illegally—simple theft and theft by deception—the vast majority of crimes against organizations are
8 Wheeler (1982), pp. 1419–1420.
9 Wheeler (1982) acknowledged that since organizational criminals tended to have higher rates of representation
by private lawyers (over 90 percent of court cases) compared to other white-collar criminals, this may have also been a factor in length of incarceration. 10
Albrecht (1991) states the fraud triangle is similar to the fire triangle in which oxygen, heat and fuel are necessary for a fire to exist and if any of these three factors is missing, fire cannot exist.
Opportunity
DRAFT – DO NOT QUOTE OR DISTRIBUTE WITHOUT AUTHORS PERMISSION
8
thefts by deception and fraud carried out by employees of the organization. In terms of the mechanics
of frauds committed against organizations, Albrecht (1991) states there are three main approaches: 1)
receipts fraud, 2) theft of assets and 3) disbursements fraud. There are many ways in which frauds are
carried out within each of these three general approaches. Receipts fraud can be accomplished by
stealing duplicate payments, stealing payments on bad debt, or crediting accounts while stealing
receipts, to name just three examples.11 Theft of assets can be accomplished by, for example, theft of
cash, inventory and fixed assets, as well as using company assets for personal use.12 Perhaps the most
elaborate frauds are designed to steal using disbursements made by the company and may involve
collusion with individuals outside the company being defrauded. Examples of disbursements fraud
include vendor fraud in which an employee arranges to overpay a vendor in return for cash kickbacks
and/or other gifts from the vendor, payroll frauds in which ghost employees are paid, and health claims
fraud. 13 In terms of impact, Albrecht (1991) states that business losses due to disbursements fraud
exceeded the combined losses from receipts fraud and asset theft. Frauds against organizations can be
prevented by reducing each of the three incentives for fraud—perceived pressure, opportunity and
rationalization. Albrecht (1991) comments that a healthy work environment that encourages employee
and management communication can reduce fraud by addressing low employee moral that can lead
employees to rationalize fraud, as well as giving employees legal ways to address financial pressures.
Finally, while improvements in companies’ internal controls can reduce fraud, Albrecht (1991) states
that internal control systems are not designed to catch frauds involving collusion with other employees
and individuals outside the organization.
Akerlof and Romer (1993) develop a theory of fraud to explain four financial crises that followed
economic boom–bust cycles during the 1980s—U.S. savings and loan associations (S&Ls) crisis, Texas
real estate market collapse, junk bond market collapse and the financial crisis in Chile. Akerlof and
Romer (1993) model a firm whose owners have limited liability, i.e., owners can at most lose their
ownership stake in the firm. Under normal circumstances firm owners will seek to maximize firm value,
V, since their earnings from the firm, i.e., dividends, increase with V. Thus, under normal circumstances
firms owners seek investments in projects with positive net present value. Normal circumstances are
defined here as periods where V exceeds the maximum dividends owners can extract from the firm, M*.
11 Albrecht (1991), p. 29.
12 Albrecht (1991), p. 29.
13 Albrecht (1991), p. 29.

DRAFT – DO NOT QUOTE OR DISTRIBUTE WITHOUT AUTHORS PERMISSION
9
Akerlof and Romer (1993) point out that the maximum amount of dividends that can be extracted from
a bank or S&L is limited by regulatory minimum capital requirements. Under most circumstances it is
unlikely that M* can exceed V since capital requirements are set high enough to prevent this from
occurring. In the 1980s, however, the S&L industry suffered a severe decline in capitalization due to a
spike in short-term interest rates that resulted in negative net interest income generated by a severe
mismatch in the maturities of S&Ls’ assets and liabilities—S&Ls lent long on 30 year mortgages with
fixed interest rates but borrowed short, relying on deposits with short-term maturities.14 The result of
the Treasury yield curve shock was most S&Ls had negative market value. S&L regulators—state and
federal—permitted regulatory accounting rules that masked losses and allowed S&Ls to record false
profits and high capital.15 S&L regulatory capital requirements were also reduced.16 The result was that
M* exceeded V for most S&Ls, hence thrift owners sought ways to extract funds from S&Ls, extracting
enough to drive S&Ls into bankruptcy. Akerlof and Romer (1993) explain that the types of projects
ideally suited to extracting M* are those that allow a S&L to record paper profits even when the project
generates no cash flow to the S&L. With a limited set of positive NPV project available, thrift owners
turn to a much larger set of negative NPV projects that boom-bust cycles provide. Many types of
negative NPV projects were ideally suited to generating false revenues and profits that S&L owners
could extract from the thrift while still recording high S&L profits and capital under lax accounting rules.
Akerlof and Romer (1993) point out that losses generated by the purposeful bankruptcy strategy greatly
exceed what owners were able to extract from thrifts, banks and other financial organizations during the
four 1980s financial crises they studied, due in part to spillover effects on firms still pursuing firm value
maximization and in part due to the bankruptcy for profit strategy’s fueling of the economic boom–bust
cycle. For these reasons, Akerlof and Romer (1993) characterize the bankruptcy for profit strategy as
looting. In terms of the regulatory environment, Akerlof and Romer (1993) explain that in addition to
reduced regulation and supervision and lax accounting standards there were changes to market
regulation that allowed for increases in the concentration of S&L ownership which also contributed to
the S&L crisis.17 Akerlof and Romer (1993) comment that regulation that allowed for sole ownership of
S&Ls made it easier for an owner to run the thrift for personal benefit.18 Further, relaxed S&L regulation
in two states—California and Texas—lead to a competition in laxity, and further fueled the boom–bust
14 Akerlof and Romer (1993), p. 23.
15 Akerlof and Romer (1993), p. 25.
16 Akerlof and Romer (1993), p. 25.
17 Akerlof and Romer (1993), pp. 24–25.
18 Akerlof and Romer (1993), p. 25.

DRAFT – DO NOT QUOTE OR DISTRIBUTE WITHOUT AUTHORS PERMISSION
10
cycle in those states as S&Ls changed from federal to state charters to take advantage of lax state
regulation.19
In the case of the Texas real estate crisis the bankruptcy for profit strategy Akerlof and Romer (1993)
describe was achieved by making loans for the acquisition, development and construction of commercial
and residential real estate (hereafter, ADC loans). ADC loans are ideally suited to internal bank and thrift
fraud since the true value of the project won’t be known until it is completed three-to-five years after
the lending begins. During the Texas real estate crisis ADC loans were made with no equity interest
required of borrowers (real estate developers) and interest payments and fees borrowers “paid” to
banks were made through interest reserves bank established (lent) for borrowers.20 GAAP and
regulatory accounting rules allowed banks and thrifts to record ADC loan interest and fees as income
and effectively pay themselves all reported profits on the ADC loan during the real estate development
period.21 ADC loans were also often made with no property purchase or take-out financing
commitments but rather were made on a speculative basis. 22 ADC loan growth was widespread during
the 1980s Texas real estate sector boom period, allowing banks and thrifts to report high profits and
growing capital. During the 1980s crisis, Texas ADC lending persisted as real sector indicators, such as
commercial property vacancy rates and home sales, deteriorated.23 As the real estate sector
deteriorated many lenders tried to hide problem loans through various schemes such as making loans to
real estate developers to purchase projects from the initial developer to hide defaults and manipulate
real estate prices.24 The junk bond market collapse and Chilean financial crisis also followed the
bankruptcy for profit strategy according to Akerlof and Romer (1993); for brevity we do not discuss
those crises here.
Green and Reinstein (2004) examine financial statement fraud among publicly traded banks and savings
and loan associations (S&Ls) that was detected by the Securities and Exchange Commission (SEC). Green
and Reinstein (2004) use a sample of 64 banks and S&Ls that the SEC identified as releasing fraudulent
19 In addition to charter changes, studies have shown there was a substantial increase in new bank charters (de
novo banks) during the 1980s banking crises; see for example, O’Keefe (1990), FDIC (1997). New bank charters also increased prior to the 2007–2009 financial crises, as shown by Lee and Yom (2016). 20
Akerlof and Romer (1993), pp. 27–28. 21
Akerlof and Romer (1993), pp. 27–28. 22
See, for example, O’Keefe (1990) and FDIC (1997). 23
See, for example, O’Keefe (1990) and FDIC (1997). 24
Akerlof and Romer (1993), p 17.

DRAFT – DO NOT QUOTE OR DISTRIBUTE WITHOUT AUTHORS PERMISSION
11
financial statements between 1979 and 1996.25 This sample allowed Green and Reinstein (2004) to study
how management fraud changed over time and to investigate the impact of changes in economic
conditions, regulation and public scrutiny of bank and S&L financial statements, on the types of fraud
that occurred. There were a number of changes to oversight and regulation of public accounting
between 1979 and 1996 that tightened public scrutiny. Green and Reinstein (2004) find that increased
regulation and scrutiny did not change the frequency of financial statement fraud but did alter how it
was carried out. Specifically, the authors conclude that banks and S&Ls became more willing to withhold
information than alter information in the latter part of their sample period. Green and Reinstein (2004)
examine the frequency of fraud by audit area—Accounts Receivable, Cash, Investments, Loans
Receivable, Reserves for Loan Losses, and Revenues, Gains and Losses. For both the 1979–1987 and
1988–1996 sub-periods the authors find the majority of frauds occurred in Investments, Reserves for
Loan Loss reporting and Loans Receivable. The tenor of the financial reporting fraud in the Green and
Reinstein (2004) sample was failure to recognize deterioration in asset value, e.g., overstate the value of
investments and include uncollectable loans among loans receivable, and understate loss reserves.26 In
terms of the methods used to misstate financials, Green and Reinstein (2004) find inadequate or
misleading disclosures and inaccurate accounting estimates comprised over 50 percent of the instances
of fraudulent activity in their sample.27 Other methods used to misstate financials in the Green and
Reinstein (2004) sample include early recognition, fictitious documents, unsupported journal entries,
lack of detail books, and entry misclassification of accounts.28
Black (2005) provides a detailed accounting of the S&L crisis of the 1980s and attributes the S&L failure
waves to widespread internal bank fraud, specifically fraud carried out by the most senior bank officers,
which Black (2005) calls control fraud. Black (2005) finds that insider abuse and internal bank fraud by
senior bank officers occurs more frequently during economic growth periods when banks increase
lending to support the real sector growth. During the early phases of the economic cycle bank loan
growth rates accelerate and loan concentrations in risky loan types increase as well. Black (2005)
observes that loan growth is aided by relaxed internal lending standards, weak risk management and
ineffective oversight by thrift boards of directors. According to Black (2005), during the economic
25 The SEC issues enforcement actions against banks and S&Ls that SEC examiners found to be issuing fraudulent
financial statements. The enforcement actions are available in the SEC’s Accounting and Auditing Enforcement Releases (AAER). 26
Green and Reinstein (2004), p. 96. 27
Green and Reinstein (2004), p. 99. 28
Green and Reinstein (2004), p. 99.

DRAFT – DO NOT QUOTE OR DISTRIBUTE WITHOUT AUTHORS PERMISSION
12
growth phase the regulatory environment is characterized by lax bank supervision (de-supervision),
accommodating bank regulation (de-regulation) and a supportive political environment. New lending is
typically concentrated in those products where loan collateral value and loan repayment risk are difficult
to estimate.29 As the economic cycle slows fraudulent activity becomes increasingly difficult to hide as
many frauds were Ponzi schemes that depended on loan growth for cash flow.30 At the end of the
economic cycle loan collateral value deteriorates rapidly when the bubble in asset prices (collateral
values) bursts. These market conditions also occurred during the 2007–2009 U.S. financial crisis;
therefore, Black (2005, 2009) finds increases in bank and thrift fraud during financial crises in general.31
Povel, Singh and Winton (2007) develop a theoretical model of corporate financial statement fraud
designed to explain the increase in the frequency of fraud that tends to be revealed toward the end of
economic boom periods in many industries.32 Povel, Singh and Winton (2007) model the fraud that
poorly performing firms might engage in to mask their true condition so as to attract investors. In the
model invested funds allow for project finance that also confers benefits to the firm manager. Investors
can choose to rely on publicly available information or more costly monitoring of firms when deciding
whether or not to invest in firms. In the model, investors are more willing to rely on public information
when overall economic conditions are good because they base their prior beliefs about firms’ conditions
on the average number of financial sound firms, i.e., become optimistic.33 Since investors will monitor
companies with poor performance and are less likely to invest in these firms, poorly performing
companies have an incentive to misrepresent their financial condition when overall economic conditions
are good. 34 Conversely, investors become pessimistic when economic conditions are bad, i.e., average
company performance is poor, and will rely on monitoring to assess companies’ conditions during these
periods, thereby reducing incentives for financial statement fraud. 35
29 Black (2005), pp. 48–50.
30 Black (2005), pp. 48–50.
31 See, for example, O’Keefe (1990) and FDIC (1997).
32 Previous studies have documented increases in bank fraud toward to end of economic boom periods that are
followed by bank failure waves. See, for example, Akerlof and Romer (1993) and Black (2005, 2009). 33
Povel, Singh and Winton (2007), p. 1220. 34
Povel, Singh and Winton (2007), p. 1220. 35
Povel, Singh and Winton (2007), p. 1220.

DRAFT – DO NOT QUOTE OR DISTRIBUTE WITHOUT AUTHORS PERMISSION
13
Finally, Black (2009, 2010) uses a medical analogy to describe internal bank fraud.36 Black (2009, 2010)
states that the occurrence of internal thrift financial fraud is akin to the spread of infectious diseases
that require an environment conducive to the pathogen (i.e., a virus or bacteria), a vector (i.e.,
mechanism that spreads the pathogen) and a host (i.e., infected individual). The environment,
pathogens, vectors and hosts Black (2009) describe are based on the S&L crisis of the 1980s which Black
(2009) argues was repeated during the 2007–2009 U.S. financial crisis.
3. Proposed Fraud Detection Framework
The findings of the academic literature on financial fraud are consistent with what bank examiners
observed at FDIC-insured failed banks between 1989 and 2015. We next present a fictional failing bank
board case that is designed to reflect the discussions of insider abuse and fraud we read in FDIC failing
bank board cases:
The bank departed from the business plan approved by supervisors when its charter was
approved in 2004. The bank’s original business plan was to concentrate on local consumer and
small business lending. In 2006 the bank changed its focus to lending for real estate acquisition,
construction and development (ADC loans), as well as sub-prime residential real estate. Loan
growth and loan concentrations have increased the bank’s risk exposure substantially as the
ADC loan-to-equity ratio increased from 50 percent to 600 percent between 2004 and 2008.
Bank management has not put in place proper risk controls, used weak lending standards and
questionable real estate appraisals. The bank’s ADC loans allow for 100 percent financing with
interest reserves, and a majority of the ADC and residential real estate lending has been well
outside the bank’s branch and office market area. The bank’s board of directors has not
exercised proper oversight of the bank and bank management. The bank’s CEO and president
holds a majority interest in the bank and dominates decision making at the bank. Examiners
identified conflicts of interest for the CEO and two board members. Lending limits to insiders
have been exceeded, resulting in the FDIC filing a notice of Reg. O violation. FDIC also issued a
Section 8.e “removal of officers” enforcement action in 2008 to remove the bank CEO after
examiners found loan files had been altered by the CEO to mask non-performing status. In
addition, examiners identified potential fraudulent loans to real estate development companies
in which the CEO had a business interest and FDIC has referred the matter to the Department of
Justice. The bank’s financial statements are not reliable since the bank has under-reported asset
quality problems and overstated earnings and capital. The new CEO, who joined the bank in
2009, has little previous experience in banking and has been unable to obtain new capital to
cover loan losses, reduce the nonperforming ADC and residential mortgage loan exposures and
36 Black (2009) credits the now defunct regulator of savings and loans associations, the Federal Home Loan Bank
Board, for applying the “health sciences metaphor” to describe internal bank fraud.

DRAFT – DO NOT QUOTE OR DISTRIBUTE WITHOUT AUTHORS PERMISSION
14
has been otherwise unable to turn the bank around. The bank was declared insolvent and closed
by the Georgia Department of Banking and Finance on “failure date” 2009.
As this illustrative example case makes clear, many 1989–2015 failed banks exhibited the characteristics
of fraudulent organizations described by Wheeler (1982), Albrecht (1991), Akerlof and Romer (1993),
Green and Reinstein (2004), Black (2005) and Povel, Singh and Winton (2007). We now combine the
previously discussed characteristics of the environment, vectors and hosts associated with insider abuse
and internal fraud at failed banks to develop a framework for fraud detection (hereafter, proposed fraud
detection framework). Figure 2 uses Black’s (2009, 2010) health sciences metaphor to illustrate our
proposed fraud detection framework. We use this framework to identify risk indicators that will serve as
inputs for fraud detection models (section 6).
Figure 2. Bank Control Fraud: Health Sciences Metaphor
4. Previous Literature on Fraud Detection
Fraud has been a constant force historically and, according to Bolton and Hand (2002), is expanding in
frequency and severity with societies’ increased reliance on technology. There is a correspondingly
growing literature on fraud detection. In this section, we discuss commonly used empirical approaches
Environment: Economic expansion, high-growth in bank lending and concentrations of
credit associated with de-regulation, de-supervision and lax bank risk management
Vector: Loan Securitization Market
Host: Money Center Bank
Host: Regional Bank
Vector: Brokered Deposit Market
Host: Community Bank
Host: De Novo Bank
Vector: Mortgage Brokers
Host: Community Bank
Host: Community Bank
Pathogen: Control Fraud

DRAFT – DO NOT QUOTE OR DISTRIBUTE WITHOUT AUTHORS PERMISSION
15
for fraud detection.37 Since there are a large number of diverse approaches for fraud detection we focus
on those approaches that have been successfully applied to detecting financial fraud in banks.
Bolton and Hand (2002) review the literature on the detection of several types of fraud, such as credit
card, money laundering, e-commerce, computer intrusion and telecommunications fraud. Bolton and
Hand (2002) describe two general statistical methods for fraud detection—supervised and unsupervised
methods. Supervised methods use datasets where instances of fraud have been confirmed to train
models that distinguish fraudulent from non-fraudulent patterns in the data.38 Supervised statistical
models such as linear discriminant analysis, logistic regression, neural networks and a variety of machine
learning algorithms have been successfully used to develop empirical fraud detection models by looking
for patterns in the data on observations with fraud present and applying this information to classify new
data as having high potential to be fraudulent or not.39 Bolton and Hand (2002) state some types of
fraud typically involve more than one individual—e.g., telecommunications fraud and money
laundering—and that analyses such as record link and social network analysis have been used to relate
individuals involved in fraud together. Unsupervised methods can be applied to datasets where
instances of fraud need not be known a priori since the methods rely of pre-identified rules for detecting
fraud (i.e., do not need to be trained on fraud data). Unsupervised methods look for outliers in the data
relative to expected values. A widely used method of unsupervised fraud detection is statistical digit
analysis based on the Law of Anomalous Numbers (aka, Benford’s Law). Bolton and Hand (2002) point
out that since statistical fraud detection can at best point to the likelihood of fraud, the output of these
models is a suspicion score that indicates the likelihood an observation in the data represents an
incidence of fraud.40 Given the wide variety of statistical fraud detection approaches, there can be a
correspondingly wide variety of suspicion scores. Bolton and Hand (2002) discuss using suspicion scores
to rank order observations and focusing investigative efforts on those entities with the highest rank-
ordered scores.41 We next discuss popular approaches for statistical fraud detection, starting with
unsupervised methods—Law of Anomalous Numbers—followed by supervised methods—logistic
regression and neural networks.
37 Fraud prevention is outside the scope of this paper.
38 Bolton and Hand (2002), p. 236.
39 Bolton and Hand (2002), p. 237.
40 Bolton and Hand (2002), p. 237.
41 Bolton and Hand (2002), p. 236

DRAFT – DO NOT QUOTE OR DISTRIBUTE WITHOUT AUTHORS PERMISSION
16
4.1. Law of Anomalous Numbers
Newcomb (1881) and Benford (1938) are credited with independently discovering the Law of
Anomalous Numbers; since Benford’s exposition of the Law is more comprehensive than Newcomb’s,
we next discuss Benford’s seminal paper on the Law of Anomalous Numbers. Benford (1938) was a
physicist working for General Electric Company when he presented his paper on the Law of Anomalous
Numbers at a meeting of the American Philosophical Society.42 Benford (1938) states, “It has been
observed that the pages of a much used table of common logarithms show evidences of a selective use
of the natural numbers.”43 More specifically, the observation was that the first pages of a table of
common logarithms (base 10 logarithms) show more wear and tear than do subsequent pages. Benford
(1938) refers to the Arabic numerals 1 through 9 as the natural numbers. The first pages of the common
logarithm table cover numbers that begin with the digit 1, and show for example, the log of 1.10 is
0.0414 while the last pages of the table cover numbers that begin with the digit 9. Benford surmised
that this reflected the possibility that engineers, mathematicians and scientists who used logarithmic
tables to make calculations involving items that can be represented by numbers—e.g., areas around
lakes, populations, death rates and air pressure—used numbers that began with the digit 1 more than
they used numbers that began with the digit 9.44 To be clear, a number is a measure such as the
population of a city, e.g., 230,456, while the first digit is the specific Arabic numeral that appears at the
beginning of the number, here “2”, and the second digit appears second, here “3”, and so on.45
Benford (1938) investigated his “selective use of natural numbers” hypothesis by obtaining 20,229
samples for 20 very different categories of measures—areas of rivers, size of populations, death rates,
air pressure and atomic weights, to name but five measures.46 The number of observations by
measurement category varied from a low of 91 (Atomic Weight) to a high of 5,000 (mathematical
functions of digits, e.g., square root). Benford (1938) measured the frequency of the first digit for the
42 Benford (1938).
43 Benford (1938), p. 551.
44 Benford (1938), p. 551.
45 We would like to point out that logarithm table wear and tear could simply reflect the fact that English language
books are read from left to right, so that individuals flipping through a book or tables will naturally include the initial pages of the book or tables in their search for specific pages more often then they reach the end of the book or table. Benford’s (1938) research on digit frequency, however, lends credence to the logarithmic table hypothesis. 46
Benford (1938) provides very little information about the 20 categories of measures, and does not define all of them; hence, categories such as “Design” and “Drainage” remain a mystery.

DRAFT – DO NOT QUOTE OR DISTRIBUTE WITHOUT AUTHORS PERMISSION
17
Arabic numerals 1 through 9 for all 20,229 observations. Table 1 shows the average frequency of the
first digit for Benford’s full sample.47
Table 1. Digit Frequency for a Set of 20,229 Measures
First Digit Frequency as a Percent of Total Number of Observations
Number 1 2 3 4 5 6 7 8 9
Average 30.6 18.5 12.4 9.4 8.0 6.4 5.1 4.9 4.7
Benford (1938) imposed four restrictions on his experiment on digit frequency. First, the 20 categories
of measures were unrelated to one another, e.g., population versus atomic weight. Second, for any
number preceded by a decimal or a zero, preceding zeros were ignored and only the first digit between
1 and 9 was considered; hence for a number such as 0.01256 the first digit was taken as “1”. Third, only
measures with four digits or more were included in the sample; hence our prior example qualifies—
1256. Fourth, Benford (1938) selected ...”data that is not too restricted in numerical range, or
conditioned in some way too sharply…”48 Benford (1938) did not give any examples of the measures in
his sample and did not explain what “conditioned too sharply” means. We will assume Benford (1938)
was explicitly acknowledging the possibility of some potential truncation and rounding of numbers in his
sample but that the overall alteration of numbers was minimal. We return to this topic later in this
section.
Benford (1938) does not address the treatment of negative numbers. Clearly, one cannot directly apply
negative numbers to a logarithmic distribution function so absolute values of negative numbers would
need to be taken before applying digit analysis. The Association of Certified Fraud Examiners (ACFE)
recommends doing separate digit analyses on negative and positive numbers because the incentive to
manipulate numbers works in opposite directions for negative versus positive numbers. ACFE explains
that for measures such as net income, a company’s management has an incentive to overstate positive
net income, however, if net income is negative managements’ incentive is to report as small a loss as is
possible or understate losses.49
47 Benford (1938), p. 553.
48 Benford (1938), p. 552.
49 See Association of Certified Fraud Examiners.

DRAFT – DO NOT QUOTE OR DISTRIBUTE WITHOUT AUTHORS PERMISSION
18
Benford (1938) made a deliberate effort to collect data from as many fields as was possible and to use
measures with “various degrees of randomness”.50 Some of the measures, such the street address
numbers of the first 342 people mentioned in one issue of American Men of Science magazine, are
arguably random numbers.51 At the other extreme, Benford (1938) points out that some measures in his
sample follow fixed laws or are otherwise closely related, such as …“Molecular Weights, Specific Heats,
Physical Constants and Atomic Weights”.52
Benford (1938) observed that for the random numbers in his sample, the first digit frequencies closely
follow a logarithmic distribution function:
“The frequency of first 1's is then seen to be 0.306, which is about equal to the common
logarithm of 2. The frequency of first 2's is 0.185, which is slightly greater than the logarithm of
3/2. The difference here, log 3 - log 2, is called the logarithmic integral. These resemblances
persist throughout, and finally there is 0.047 to be compared with log 10/9, or 0.046.”53
Based on these findings, Benford (1938) proposes that for sets of unrelated, random measures the
frequency of the first digit, “a”, follows a logarithmic function, Fa, as shown is equation 1.54
𝐹𝑎 = 𝑙𝑜𝑔 (𝑎 + 1
𝑎) (1. )
Benford (1938) observed that a nonrandom numbers’ first digit frequencies show the most divergence
from the logarithmic distribution, hence he calls the logarithmic distribution rule the Law of Anomalous
Numbers. Benford (1938) also finds that numbers with fewer than four digits do not follow the
logarithmic distribution rule but rather follow a different, geometric distribution.55 Benford (1938)
points out that the Law of Anomalous Numbers is about events, i.e., frequencies of digits, and not about
natural numbers and digits themselves.
50 Benford (1938), p. 552.
51 Benford (1938), p. 560.
52 Benford (1938), p. 557.
53 Benford (1938), p. 553.
54 Benford (1938), p. 554.
55 Benford (1938), p. 554.

DRAFT – DO NOT QUOTE OR DISTRIBUTE WITHOUT AUTHORS PERMISSION
19
Following the logic of the logarithmic distribution function, that second place digit frequencies must
take the first digit into account. To see this, consider a two digit number, “ab”, where “a” is the first digit
and “b” is the second digit. The frequency of second digit “b” occurring in otherwise random sets of
numbers, Fb, given first digit "a" occurred, is shown in equation 2:56
𝐹𝑏 = 𝑙𝑜𝑔 (𝑎𝑏 + 1
𝑎𝑏) 𝑙𝑜𝑔 (
𝑎 + 1
𝑎)⁄ (2. )
Summing equation 2 over all possible combinations of a specific second digit, a, and the nine possible
first digits, b, yield the probability of second digit b occurring.
We would like to point out that equation 2 follows Bayes’ Theorem, where the conditional probability of
“b” occurring given “a” has occurred is equal to the ratio of the joint probability of “a” and “b” to the
probability of “a” occurring.
𝑃(𝑏|𝑎) = 𝑃(𝑏 𝑎) 𝑃(𝑎)⁄ (3. )
The logarithmic distribution functions can also be used to generate expected digit frequencies for higher
order of digits, e.g., third, fourth, and fifth digit, as well as combinations of digits, e.g., first two digits,
that follow Benford’s Law. For brevity we do not derived those frequency functions here.
Benford (1938) shows the first digit frequencies for random numbers follows the logarithmic distribution
function well but that numbers that follow fixed rules, e.g., scientific constants, have first digit
frequencies that diverge the most from the logarithmic distribution among the 20 measurement
categories. Benford (1938) concludes, “these facts lead to the conclusion that the logarithmic law
applies particularly to those outlaw numbers that are without known relationship rather than to those
that individually follow an orderly course; and therefore the logarithmic relation is essentially a Law of
Anomalous Numbers.”57 Benford (1938) next investigates the causes of the Law of Anomalous Numbers,
and studies natural phenomena, such as individual’s reactions to external stimuli. Benford (1938)
explains that individual’s reactions to light, sound, radiation and toxins closely follow a logarithmic
56 Benford (1938), p. 555.
57 Benford (1938), p. 557.

DRAFT – DO NOT QUOTE OR DISTRIBUTE WITHOUT AUTHORS PERMISSION
20
distribution law.58 Conversely, man-made measures or scales for fields such as music and mechanical
devices, such as drill bits and light bulb wattage, follow a geometric distribution.59
4.1.1. Fraud Detection Using the Law of Anomalous Numbers
Newcomb (1881) and Benford (1938) do not mention the application of the Law of Anomalous Numbers
to fraud detection; however, its application to fraud detection and financial fraud in particular, has been
widespread. Durtschi, Hillison and Pacini (2004) review the literature on Benford’s Law, focusing on the
application of the Law to detecting fraud in accounting data. Durtschi, Hillison and Pacini (2004)
conclude that it is appropriate to apply Benford’s Law to accounting data since studies by Carslaw
(1988), Boyle (1994), Hill (1995), Nigrini (1996, 1999), Nigrini and Mittermaier (1997) and others show
that most accounting numbers result from combining different, independent random data in several
ways (addition, subtraction and division) and behave as anomalous numbers. Durtschi, Hillison and
Pacini (2004) also point out that certain accounting numbers do not follow Benford’s Law but rather
follow an orderly course as evidence of human thought, such as assigned numbers, e.g., check numbers,
order numbers, and other numbers resulting directly from human thought, e.g., ATM withdrawals.
Further, Durtschi, Hillison and Pacini (2004) describe the prices of goods and services as reflecting
“psychological barriers” that affect digit frequencies, and do not follow Benford’s law. For example,
retailers often prefer to price products at the next lowest price, e.g., $1.99 versus $2.00, apparently
because shoppers place disproportionate significance on immaterially lower prices. Before applying the
Law of Anomalous Numbers to financial fraud detection we consider two possible avenues for bank
financial statements to reflect an orderly course—fraudulent and non-fraudulent.60
Fraudulent Orderly Courses
A bank employee who issues loans to fictitious borrowers is likely adding non-naturally occurring
numbers to the bank’s loan portfolio. Other examples of bank employee fraud include schemes to
refinance nonperforming loans to hide defaults, using fictitious real estate appraisals and other fictitious
documentation to get loans approved and altering past-due loan customers’ records to make account
payment status current. In the case of frauds committed by bank senior officers it is also possible that
58 Benford (1938), p. 562.
59 Benford (1938), p. 563.
60 The empirical literature on financial fraud that we are aware of does not consider the possibility of non-
fraudulent factors, other than number rounding and truncation, which might result in non-random financial statement entries.

DRAFT – DO NOT QUOTE OR DISTRIBUTE WITHOUT AUTHORS PERMISSION
21
the bank financial statements are directly altered to mask the fraud. Whether these frauds are
detectable from analysis of banks’ balance sheet and income statements depends on the duration and
materiality of the fraud. Our main hypothesis is that material internal fraud is detectable by observing
significant deviations in digit frequencies from the logarithmic distributions posited by Benford (1938)
for relevant balance sheet and income statement entries. We will quantify what we mean by relevant
entries and significant deviations in section 6.1.
Non-fraudulent Orderly Courses
To begin, consider the dominant activity at banks—lending. The amounts that bank customers seek to
borrow largely depend on loan purpose and borrowers’ ability to repay the loan. Banks approve loan
applications based on customer credit worthiness, bank credit policies, bank condition, local economic
conditions and bank regulation. The degree of randomness in loan amounts will depend on these
demand- and supply-side factors. The influence of these factors on loan amounts might also vary across
loan categories. For this reason, our second hypothesis is that the degree of randomness in loan
amounts and related financial variables—loan charge-offs, recoveries and nonperforming loans—can
vary across loan categories for reasons unrelated to fraud. Specifically, we hypothesize that certain
categories of loans reflect an orderly course that is non-fraudulent while other categories of loans
reflect random processes from a digit perspective. Two potential sources of non-fraudulent, non-
random digits in bank financial statements are retail pricing and negotiated prices.
Retail Pricing
To understand the “physiological price barriers” described by Durtschi, Hillison and Pacini (2004),
consider retail automobile prices. The manufacturer suggested retail price (MSRP) as of February 2017
for a Jeep Cherokee was $23,595 and a Cadillac CT6 Sedan listed for $53,795; the authors found similar
pricing for other models of automobiles. The MSRP is a starting point in a sales price negotiation, so why
not set the MSRP at $23,600 for the Jeep and $53,800 for a Cadillac? A Northern Virginia Ford dealership
listed the “easy price” of a Ford F150 truck as $18,999. The “easy price” is a price one can lock in and is
not a starting point for price negotiation; so why not round up to $19,000? Does a 0.005% difference in
price really matter to consumers? Automobile dealers apparently think it does and appear to manage
the digits in prices to the lowest digit “available” in the price. That is, the Ford F150 “easy price” of
$18,999 suggests second digit management perhaps because the automobile features do not qualify it
for first digit management that might move the price into the $20,000 price range. Similarly, the MSRP’s

DRAFT – DO NOT QUOTE OR DISTRIBUTE WITHOUT AUTHORS PERMISSION
22
of the Jeep Cherokee and Cadillac suggest the dealerships are also managing prices to the second digit
since customers rarely pay more than MSRP.
Asking prices for automobiles are just that, starting points for price negotiations. What are the
implications of digit-managed asking prices on final sales prices? Automobile price negotiations are a not
random process, rather both participants in the negotiation—automobile salesperson and customer—
seek to get the most favorable price from their perspectives. We hypothesize negotiations of sales
prices that start with digit-managed asking prices can only lead to digit-managed final sales prices.
The same retail pricing phenomenon is seen in the list prices for residential properties. A random
selection of residential home listing prices in Northern Virginia as of February 2017—$1,599,000;
$899,000; $449,900; and $729,000—suggests realtors, like automobile dealerships, are managing listing
prices at the second digit. As was the case for automobiles, mortgage loans will reflect not only list
prices but final negotiated prices. We believe our previous conclusion about the cost of automobiles also
applies to the cost of residential housing, i.e., it is a digit-managed number.
4.1.2. Benford Law Second Order Test
The existence of non-fraudulent, orderly courses in data from bank financial statements contributes to
type 1 error in the application of the Law of Anomalous Number to fraud detection. In our empirical
approach we control for this possibility by testing for fraud across different segments of the loan
portfolio, as well as areas of the balance sheet and income statement we believe are not driven by non-
fraudulent, digit-managed processes. We also apply a recently developed second-order test of Benford’s
Law that greatly reduces the likelihood of type 1 error, which we describe next.
Nigrini and Miller (2009) introduce a second-order test of Benford’s Law that greatly reduces the large
type 1 error rate associated with standard first-order digit tests of Benford’s Law. Miller and Nigrini
(2008) provide mathematical analysis of the differences between adjacent ordered random numbers
that follow Benford’s Law and show the digits of these differences “approximately” follow Benford’s
Law. Nigrini and Miller (2009) provide empirical examples that show that an important advantage of
using the differences of order-ranked random numbers for Benford digit analysis is that the differences
in digits tend to follow Benford’s Law for most statistical distributions of numbers, including many that
do not follow Benford’s Law, e.g., normal and uniform distributions. Nigrini and Miller (2009) conclude

DRAFT – DO NOT QUOTE OR DISTRIBUTE WITHOUT AUTHORS PERMISSION
23
that one can expect Benford’s Law to “almost” apply to most random number data distributions or
mixture of distributions, although the usual caveats about numbers altered by human intervention still
apply. Nigrini and Miller (2009) provide empirical case studies of the second order test, applying the test
to a corporation’s accounts payable data, corporate journal entry data, franchise restaurant data on
food sales and cost data (cost done separately) for approximately 5,000 restaurants, and tests of annual
food costs-to-sales ratios by restaurant.
Since the second order tests are conducted on difference values that “almost” follow Benford’s Law for
all digits and two-digit combinations, there will be small differences between the Benford expected digit
frequencies the frequencies one observes even when the underlying data are truly random. Nigrini and
Miller (2009) therefore suggest that one should apply statistical tests of expected and observed digit
frequencies, such as Chi Square tests, with caution since statistical tests may tend to reject the null
hypothesis that the data follow Benford’s Law due to the inexact following of Benford digit frequencies.
Nigrini and Miller (2009) suggest one can supplement statistical tests of digit frequencies departure
from the Benford’s distribution with graphical analysis of observed digit frequencies and simple
measures of divergence in distributions, such as the mean absolute deviation between expected and
observed digit frequencies. We apply the second order Benford test in section 6.
5. Data
Our measure of whether there was insider abuse or fraudulent activity in a failed bank is compiled from
three sources. The first source is the FDIC Board of Directors failing bank cases (FBC). Before a bank is
closed by the state or national bank chartering authority, the FDIC Division of Resolutions and
Receiverships prepares a failing bank case to request the authority to choose the least costly method for
resolving the bank failure from the FDIC Board of Directors. The failing bank case states the reasons why
the bank should be closed and a preliminary, model-based estimate of the cost of the failure to the FDIC
Deposit Insurance Fund (DIF). In many cases the least costly resolution method is not known at the time
the failing bank board case is prepared. To utilize the FBC for this paper, the FBC for each failed bank
was reviewed by three FDIC staff that made independent judgments on whether insider abuse and/or
fraud played a role in the bank’s failure. For each failed bank, a final decision was made on whether
insider abuse and/or fraud was present if at least two staff agreed on that finding. This process served as
a control on the potential subjectivity in fraud assessments.
DRAFT – DO NOT QUOTE OR DISTRIBUTE WITHOUT AUTHORS PERMISSION
24
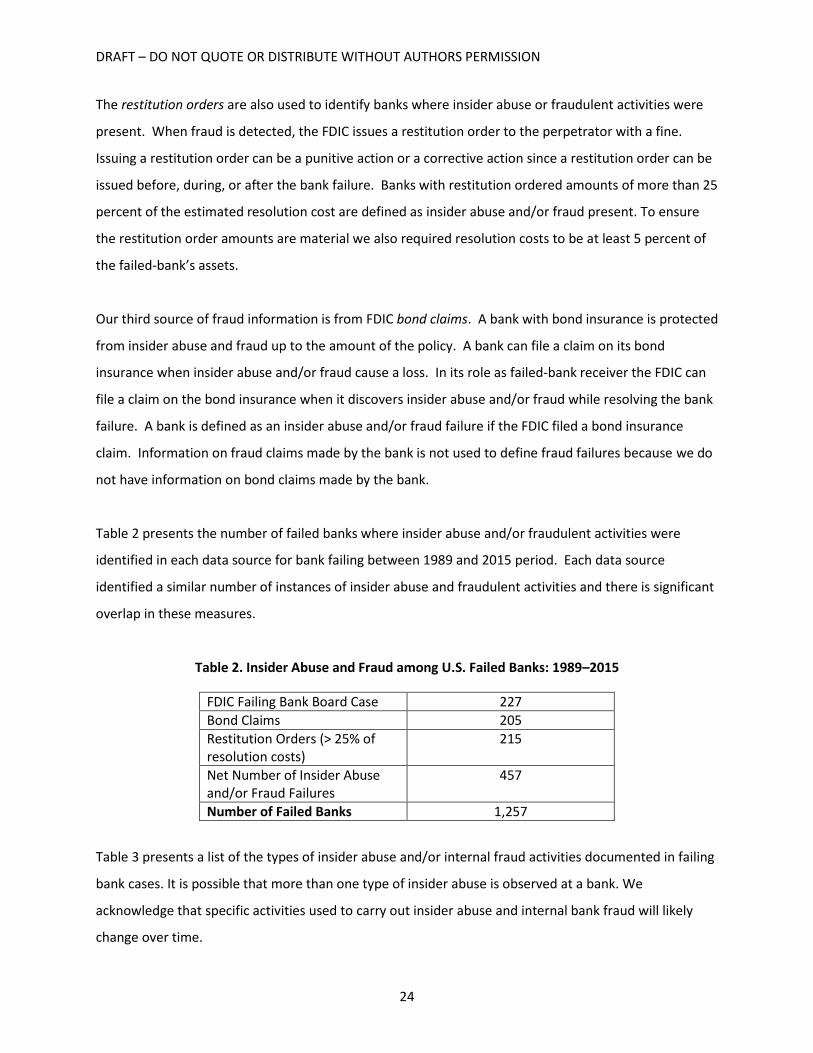
The restitution orders are also used to identify banks where insider abuse or fraudulent activities were
present. When fraud is detected, the FDIC issues a restitution order to the perpetrator with a fine.
Issuing a restitution order can be a punitive action or a corrective action since a restitution order can be
issued before, during, or after the bank failure. Banks with restitution ordered amounts of more than 25
percent of the estimated resolution cost are defined as insider abuse and/or fraud present. To ensure
the restitution order amounts are material we also required resolution costs to be at least 5 percent of
the failed-bank’s assets.
Our third source of fraud information is from FDIC bond claims. A bank with bond insurance is protected
from insider abuse and fraud up to the amount of the policy. A bank can file a claim on its bond
insurance when insider abuse and/or fraud cause a loss. In its role as failed-bank receiver the FDIC can
file a claim on the bond insurance when it discovers insider abuse and/or fraud while resolving the bank
failure. A bank is defined as an insider abuse and/or fraud failure if the FDIC filed a bond insurance
claim. Information on fraud claims made by the bank is not used to define fraud failures because we do
not have information on bond claims made by the bank.
Table 2 presents the number of failed banks where insider abuse and/or fraudulent activities were
identified in each data source for bank failing between 1989 and 2015 period. Each data source
identified a similar number of instances of insider abuse and fraudulent activities and there is significant
overlap in these measures.
Table 2. Insider Abuse and Fraud among U.S. Failed Banks: 1989–2015
FDIC Failing Bank Board Case 227
Bond Claims 205
Restitution Orders (> 25% of resolution costs)
215
Net Number of Insider Abuse and/or Fraud Failures
457
Number of Failed Banks 1,257
Table 3 presents a list of the types of insider abuse and/or internal fraud activities documented in failing
bank cases. It is possible that more than one type of insider abuse is observed at a bank. We
acknowledge that specific activities used to carry out insider abuse and internal bank fraud will likely
change over time.

DRAFT – DO NOT QUOTE OR DISTRIBUTE WITHOUT AUTHORS PERMISSION
25
Table 3. Types of Insider Abuse or Fraudulent Activity, Post 2006
(Identified in FDIC Failing Bank Board Cases)
Types of Insider Abuse or Fraudulent Activity Frequency
Alteration of financial statements / manipulation of records / concealing information from BoD or regulator / inflated appraisals / inflated financial statements
20
Loans to insiders / Violation of Reg O 9
Transactions with affiliates (BHC, mortgage affiliate, etc.) / Violation of Reg W Section 23A
4
Self-dealing, e.g. excessive compensation, nepotism 8
Embezzlement 1
Fictitious loans or generating loans for inappropriate usage or forgery on loan documentation
11
Inappropriate transactions such as check-kiting, money-laundering, withdrawal of funds from customer accounts
7
Bank’s inappropriate transaction with a firm affiliated with a bank owner, officer, director, or employee
2
All Other 6
Total 68
We use banks’ income statement and balance sheet data reported quarterly to their primary federal
regulator (aka, Call Reports) to detect fraud. The following financial ratios are used to measure a bank’s
financial condition in the fraud failure model.
Equity is a ratio of equity capital to total assets which measures the shareholders’ ownership of the
bank.
Bank’s liquidity is measured by Liquid assets ratio. Liquid assets ratio is a sum of securities and
federal funds sold divided by total assets. Nonperforming loans ratio is the sum of past due loans
90+ days and nonaccruals divided by total assets and measure a bank’s asset quality.
Income earned but not collected ratio is a bank’s interest earned or accrued on earning assets that
has not yet been collected to total assets. This includes accrued interest receivable on loans, leases,
debt securities, and other interest-bearing assets.
One-year asset growth rate is a change in bank’s merger-adjusted asset size from one year ago.
Investments in a bank’s subsidiaries are a bank’s investments in subsidiaries, associated companies,
joint ventures, and partnerships where the bank exercises significant influence.
Earnings is a ratio of income before taxes to total assets and measures a bank’s profitability. It is not
clear whether reported earnings of a bank close to failing with fraudulent activities would differ
from that of those without fraud. Although actual earnings of a bank with fraudulent activities may
be lower, it might hide its true condition by reporting higher earnings.

DRAFT – DO NOT QUOTE OR DISTRIBUTE WITHOUT AUTHORS PERMISSION
26
The financial ratios control for differences in bank performance and evidence of insider abuse and/or
fraud. Table 4 presents the mean and median financial ratios of fraud and non-fraud banks two years
prior to failure. Among failures, banks with insider abuse and/or fraud have a higher average loss rate
compared to all other failed banks. For instance, the mean loss rate for bank with insider abuse and/or
fraud is 23.9% compared to 20.2% for all other failed banks.
On average, banks with insider abuse and/or fraud (hereafter, fraud banks) reported better financial
condition and performance, e.g., higher equity and lower nonperforming loans than other failed banks
(hereafter, non-fraud banks). Two years prior to failure, both fraud and non-fraud banks have negative
earnings but fraud banks lose less money, on average. Overall, fraud banks report better financial
condition than do non-fraud banks two years prior to failure. At the same time, fraud banks also display
greater risk-taking with higher asset growth.
Table 4. Descriptive Statistics of Failed Institutions 2 Years Prior to Failure
Insider abuse and/or fraud not detected by regulators
Insider abuse and/or fraud detected by regulators
Insider abuse and/or fraud not detected by regulators
Insider abuse and/or fraud detected by regulators
MEAN MEAN MEDIAN MEDIAN
Loss rate1 20.17 23.91*** 19.01 21.51
Equity 7.24 8.35*** 6.75 7.94
Nonperforming loans
3.96 3.05*** 3.25 1.89
Income earned but not collected
0.80 0.77 0.68 0.61
One year asset growth
8.05 11.49** 1.99 7.22
Liquid assets 26.12 21.40*** 23.45 19.09
Investment in subsidiaries
0.05 0.03 0.00 0.00
Earnings -1.41 -0.50*** -0.96 0.32
No. of observations 758 451 758 451 1Loss rate is a ratio of cost of a bank resolution to total assets as of quarter before failure. ***Indicate that the mean value for banks with insider abuse/fraud present differs from banks without insider abuse/fraud with statistical significance at 1 percent.

DRAFT – DO NOT QUOTE OR DISTRIBUTE WITHOUT AUTHORS PERMISSION
27
6. Model Calibration and Results
We next present the results for alternative fraud-detection approaches—Benford digit analysis, logistic
regression and neural network analysis—followed by a discussion of how these various models might be
used in a fraud-detection framework.
6.1. Law of Anomalous Numbers
Following the conclusions of section 4.1.2 we conduct second order Benford digit tests of bank Call
Reports. Based on Nigrini and Miller (2009) we feel it is appropriate to apply the second order test to
financial data from multiple balance-sheet and income statement entries for a bank over time.
Specifically, we use eight consecutive calendar quarters of financial data for certain areas of bank
financial reports that previous research suggests might be manipulated by fraudulent banks—loans past
due 30-89 days, loans past due 90 days or more, nonaccrual loans and gross loan charge-offs for six
categories of loans—1-4 family residential mortgages, loans for multifamily properties, loans for
nonfarm, nonresidential properties, loans for real estate construction and development, consumer
loans and commercial and industrial loans. We conduct the second order tests on banks individually and
group our results based on bank status in terms of whether regulators detected material insider abuse
and/or internal fraud by bank employees or not. To that end we have three groups of banks: 1) failed
banks where insider abuse and/or fraud was detected by regulators, 2) failed banks where no insider
abuse and/or fraud was detected by regulators, and 3) non-failed banks where no insider abuse and/or
fraud was detected by regulators. For the non-failed bank group, we use a random sample of 300 banks
for the second order tests.
First Digit Tests
We chose to apply the second order test to the first digit frequencies (1 through 9) since the data
requirements for a first digit test are much lower than for a first-two digit test where there are 89
possible digit combinations. To ensure there are sufficient data to observe all nine first digits we
require there be at least 40 observations on some portion of the previously discussed financial variables
(bank variable-quarter observations) to compute banks first digit frequencies and we all require that
each of the nine first digits be observed at least once. This later requirement is intended to give
acceptance of the null hypothesis that the digits follow the Benford distribution the greatest chance of
being accepted, thereby reducing type 1 error. We focus on type 1 error because the burden on
regulators of conducting a follow-up investigation for potential bank fraud is likely to be high. Finally,
DRAFT – DO NOT QUOTE OR DISTRIBUTE WITHOUT AUTHORS PERMISSION
28
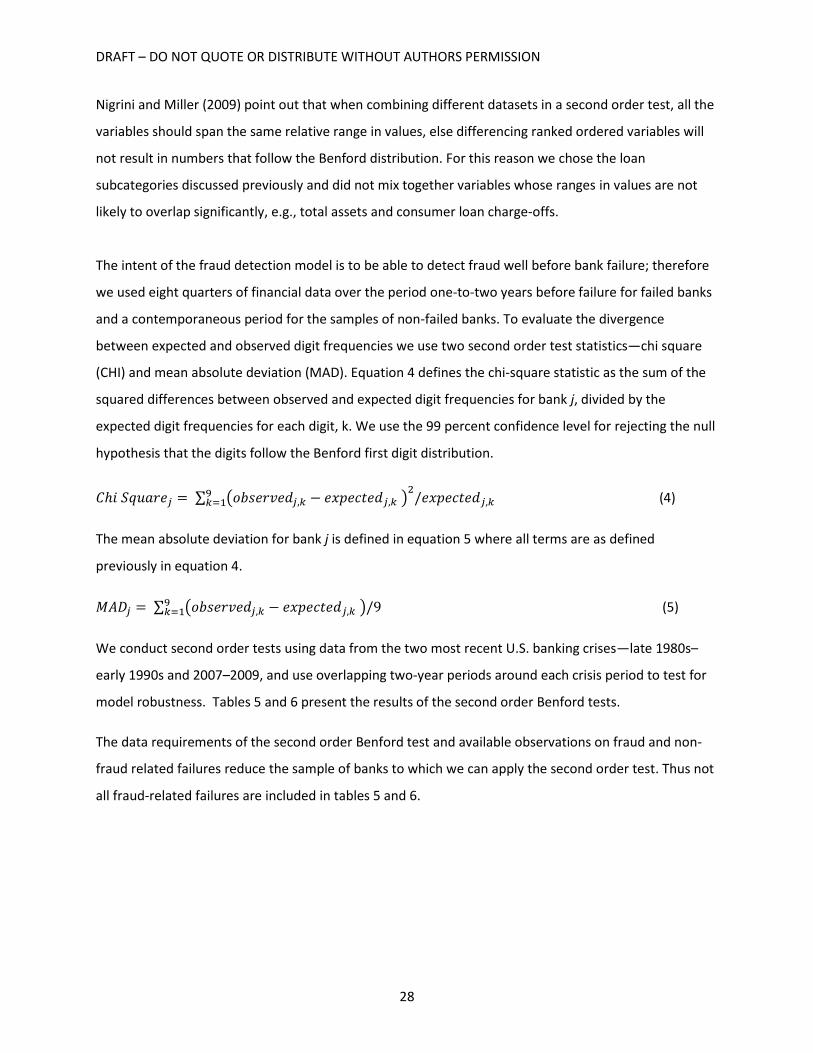
Nigrini and Miller (2009) point out that when combining different datasets in a second order test, all the
variables should span the same relative range in values, else differencing ranked ordered variables will
not result in numbers that follow the Benford distribution. For this reason we chose the loan
subcategories discussed previously and did not mix together variables whose ranges in values are not
likely to overlap significantly, e.g., total assets and consumer loan charge-offs.
The intent of the fraud detection model is to be able to detect fraud well before bank failure; therefore
we used eight quarters of financial data over the period one-to-two years before failure for failed banks
and a contemporaneous period for the samples of non-failed banks. To evaluate the divergence
between expected and observed digit frequencies we use two second order test statistics—chi square
(CHI) and mean absolute deviation (MAD). Equation 4 defines the chi-square statistic as the sum of the
squared differences between observed and expected digit frequencies for bank j, divided by the
expected digit frequencies for each digit, k. We use the 99 percent confidence level for rejecting the null
hypothesis that the digits follow the Benford first digit distribution.
𝐶ℎ𝑖 𝑆𝑞𝑢𝑎𝑟𝑒𝑗 = ∑ (𝑜𝑏𝑠𝑒𝑟𝑣𝑒𝑑𝑗,𝑘 − 𝑒𝑥𝑝𝑒𝑐𝑡𝑒𝑑𝑗,𝑘 )2
/𝑒𝑥𝑝𝑒𝑐𝑡𝑒𝑑𝑗,𝑘9𝑘=1 (4)
The mean absolute deviation for bank j is defined in equation 5 where all terms are as defined
previously in equation 4.
𝑀𝐴𝐷𝑗 = ∑ (𝑜𝑏𝑠𝑒𝑟𝑣𝑒𝑑𝑗,𝑘 − 𝑒𝑥𝑝𝑒𝑐𝑡𝑒𝑑𝑗,𝑘 )/99𝑘=1 (5)
We conduct second order tests using data from the two most recent U.S. banking crises—late 1980s–
early 1990s and 2007–2009, and use overlapping two-year periods around each crisis period to test for
model robustness. Tables 5 and 6 present the results of the second order Benford tests.
The data requirements of the second order Benford test and available observations on fraud and non-
fraud related failures reduce the sample of banks to which we can apply the second order test. Thus not
all fraud-related failures are included in tables 5 and 6.

DRAFT – DO NOT QUOTE OR DISTRIBUTE WITHOUT AUTHORS PERMISSION
29
Table 5. Second Order Benford Tests: Late 1980s–Early 1990s Banking Crisis
Benford Second Order Tests
Bank Group
Financial Data
Period # Banks
Screened
# Banks w/ Benford Rejected
Chi-Square test (p-value
1%)
# Banks w/ Chi-Square > 30 and Mean
Absolute Deviation > 4
Failed Banks
Insider Abuse and/or Fraud Detected by Regulators
1988–1989 28 5 (18%) 1 (4%)
1987–1988 25 4 (16%) 0 (0%)
1986–1987 23 4 (17%) 1 (4%)
Insider Abuse and/or Fraud Not Detected by Regulators
1988–1989 126 15 (12%) 3 (2%)
1987–1988 107 24 (22%) 6 (6%)
1986–1987 126 15 (12%) 3 (2%)
Non-failed Banks
(Random Sample)
Insider Abuse and/or Fraud
Not Detected by Regulators
1988–1989 67 13 (19%) 3 (4%)
1987–1988 52 7 (13%) 1 (2%)
1986–1987 71 15 (21%) 4 (6%)
Table 6. Second Order Benford Tests: 2007–2009 Banking Crisis
Benford Second Order Tests
Bank Group
Financial Data
Period # Banks
Screened
# Banks w/ Benford
Rejected Chi-Square test
(p-value 1%)
# Banks w/ Chi-Square >
=30 and Mean Absolute
Deviation >= 4
Failed Banks
Insider Abuse and/or Fraud
Detected by
Regulators
2008–2009 73 6 (8%) 1 (1%)
2007–2008 97 12 (12%) 1 (1%)
2006–2007 80 6 (8%) 0 (0%)
Insider Abuse
2008–2009 60 10 (17%) 5 (8%)

DRAFT – DO NOT QUOTE OR DISTRIBUTE WITHOUT AUTHORS PERMISSION
30
and/or Fraud Not Detected
by Regulators
2007–2008 61 9 (15%) 3 (5%)
2006–2007 42 2 (5%) 2 (5%)
Non-failed Banks
(Random Sample)
Insider Abuse and/or
Fraud Not Detected
by Regulators
2008–2009 155 8 (5%) 2 (1%)
2007–2008 127 7 (6%) 0 (0%)
2006–2007 118 9 (8%) 0 (0%)
Tables 5 and 6 show that a typical statistical threshold for rejecting the null hypothesis that the data
follow the first digit Benford distribution, i.e., 1 percent significance level, results in relatively high
rejection rates. If we were to apply the second order test to all banks, a 1 percent significance level
would likely lead to over 8 percent of all banks or over 400 banks failing the test and requiring follow-up
analysis by regulators. Nigrini and Miller (2009) suggest the “almost” Benford characteristic of first
differences in ranked data contributes to false positives in the second order test. To limit the burden of
unnecessary follow-up analysis by regulators we consider a simple threshold test based on both chi
square statistics and MAD; if a bank’s chi square is 30 or more and MAD is 4 or more then the bank fails
the second order test for random numbers. This latter, simpler test is much more restrictive and
generally results in 1 percent of banks or less (40 or less banks) failing the second order test.
As we discussed previously, our fraud suspicion flag includes activities that may not have resulted in
banks altering their financial statements. We therefore investigated banks that failed the chi-square test
using a p-value of 1 percent, as well as banks that failed the chi square and MAD thresholds test. Among
all screened banks with suspected fraud in tables 5 and 6, 37 banks failed the chi-square test using a p-
value of 1 percent and 33 of those banks had significant restitution orders and/or FDIC bond claims.
Among all banks with suspected fraud in tables 5 and 6 that failed the chi-square and MAD thresholds
test, we find that in all cases the banks had indications of material internal fraud due to FDIC bond
claims, restitution orders and/or news reports of deliberate financial misstatements. We believe
material restitution orders and bond claims are tangible proof of internal bank fraud. Failing bank case
discussions of suspected internal bank fraud are not tangible proof of fraud.
As a check on the second order test accuracy we compared the first digit frequencies of banks with
insider abuse and/or fraud against those where no fraud was suspected graphically. While Nigrini and

DRAFT – DO NOT QUOTE OR DISTRIBUTE WITHOUT AUTHORS PERMISSION
31
Miller (2009) recommend one use graphical analysis to confirm non-Benford behavior, visual inspection
may not be practical for large samples of banks regulators wish to screen. Figures 3 and 4 show the
expected and observed second order test digit frequencies for a failed bank where insider abuse and/or
fraud was detected by regulators, and statistical test statistics support that finding, versus those of a
non-failed bank. The graphical analysis agrees our simple threshold second order test base in a chi
square of 30 or more and MAD of 4 or more. Figures 3 and 4 are representative of those for the
population of banks.
Figure 3.
Figure 4.
0.00
10.00
20.00
30.00
40.00
50.00
60.00
70.00
1 2 3 4 5 6 7 8 9
Fre
qu
en
cy o
f 1
st D
igit
First Digit
Failed Bank with Fraud Suspected Second Order Benford Test
Expected Observed
Chi Square = 2.1 Mean Absolute Deviation = 1.4
Chi Square = 45.4 Mean Absolute Deviation = 6.8 Failed in 2010, Significant Restitution Orders Issued

DRAFT – DO NOT QUOTE OR DISTRIBUTE WITHOUT AUTHORS PERMISSION
32
Combined First and Second Digit Tests
Another approach to reducing type 1 error is to combine tests of first and second digit frequencies. The
tests of the distribution of the 10 possible second digits (i.e., 0 through 9) can be made using the same
approach as was used to test first digit frequencies. By combining first and second digit tests we hope to
increase the accuracy of fraud detection while reducing the potential number of banks regulators would
need to analyze in subsequent screening processes.
Tables 7 and 8 presents results for the combined first and second digit tests for the late 1980s–early
1990s banking crisis and 2007–2009 global financial crisis period, respectfully, using digits from the
second order Benford test. To enhance the comparability of results we only include those banks where
both first and second digit chi square tests of digit frequencies could be estimated. Tables 7 and 8 show
that banks fail the second digit test at much higher rates than for the first digit test, suggesting that
banks manage the second digit more often than the first digit. Further, our results show that combining
first and second digit tests reduces the pool of potential fraud candidates to a manageable number of
banks.
We investigated the role that insider abuse and fraud played in the failure of the seven banks in table 8
where regulators detected insider abuse and/or fraud that did not pass both the first and second digit
tests. For these seven banks, five banks had bond claims and six banks had substantive restitution
orders. We also conducted an internet search for news reports on these seven failed banks and found
five had news reports of substantive insider fraud and/or charges of insider fraud.
Table 7. Second Order Benford Tests of First and Second Digits: Late 1980s–early 1990s Banking Crisis
Benford Second Order Tests
Bank Group
Financial
Data Period # Banks
Screened
# Banks Failing 1st Digit Chi- Square Test (p-value 1%)
# Banks Failing 2st Digit Chi- Square Test (p-value 1%)
# Banks Failing 1st and 2nd Digit Chi-Square Test
(p-value 1%)
Failed Banks
Insider Abuse and/or Fraud
Detected by
Regulators
1988–1989 16 1 (6%) 6 (38%) 0 (0%)
1987–1988 13 0 (0%) 4 (31%) 0 (0%)
1986–1987 7 2 (29%) 2 (29%) 0 (0%)
Insider Abuse
1988–1989 33 5 (15%) 15 (45%) 2 (6%)

DRAFT – DO NOT QUOTE OR DISTRIBUTE WITHOUT AUTHORS PERMISSION
33
and/or Fraud Not Detected
by Regulators
1987–1988 49 12 (24%) 18 (37%) 6 (12%)
1986–1987 62 7 (12%) 27 (43%) 6 (10%)
Non-failed Banks
(Random Sample)
Insider Abuse and/or
Fraud Not Detected
by Regulators
1988–1989 33 7 (21%) 17 (52%) 4 (12%)
1987–1988 20 3 (15%) 12 (60%) 2 (10%)
1986–1987 22 5 (23%) 12 (55%) 1 (5%)
Table 8. Second Order Benford Tests of First and Second Digits: 2007–2009 Banking Crisis
Benford Second Order Tests
Bank Group
Financial
Data Period # Banks
Screened
# Banks Failing 1st Digit Chi- Square Test (p-value 1%)
# Banks Failing 2st Digit Chi- Square Test (p-value 1%)
# Banks Failing 1st and 2nd Digit Chi-Square Test
(p-value 1%)
Failed Banks
Insider Abuse and/or Fraud
Detected by
Regulators
2008–2009 60 6 (10%) 17 (28%) 2 (3%)
2007–2008 129 13 (10%) 3 (2%) 2 (2%)
2006–2007 62 6 (10%) 20 (32%) 3 (5%)
Insider Abuse and/or
Fraud Not Detected
by Regulators
2008–2009 46 7 (15%) 14 (30%) 4 (9%)
2007–2008 38 7 (18%) 11 (29%) 2 (5%)
2006–2007 24 0 (0%) 13 (54%) 0 (0%)
Non-failed Banks
(Random Sample)
Insider Abuse and/or
Fraud Not Detected
by Regulators
2008–2009 84 2 (2%) 29 (34%) 1 (1%)
2007–2008 73 2 (3%) 31 (42%) 0 (0%)
2006–2007 53 6 (11%) 18 (34%) 3 (6%)

DRAFT – DO NOT QUOTE OR DISTRIBUTE WITHOUT AUTHORS PERMISSION
34
6.2. Logit Regression
In this section, we estimate a parametric model to predict bank failures where insider abuse and/or
fraud was detected by regulators. We denote bank failures where insider abuse and/or fraud were
detected by regulators by y=1 and all other failures by y=0 and model the probability of a insider abuse
and fraud-related bank failure as a function of bank’s balance sheet and income statement variables
previously discussed in section 5.
iii xy (6)
In equation 6, is a vector of regression coefficients, Xi, is a vector of variables measuring bank
characteristics and μi is the regression error term. The probability of bank failure is modelled by bi-
variate logistic regression.
Regression Results
Table 9 reports the results of the logit models using banks’ last financial ratios before failure. Columns
(1), (2), and (3) of table 8 report the estimates of the models using the full (1989-2015), early (1989-
2004), and the recent (2007-2015) periods, respectively. Table 9 shows that banks with insider abuse
and/or fraud detected by regulators reported higher equity on their last call reports compared to failing
banks without insider abuse and/or fraud. Fraud failures also tended to report lower earnings compared
to non-fraud failures. In the full and early periods, fraud failures are characterized by higher asset
growth and lower liquid assets. In contrast, the fraud failures in recent periods reported higher income
earned but not collected. According to McDill (2004), a high level of income earned but not collected is
an indication that loans have gone bad but have not been written off.
Table 9. Logistic Regression of Fraud vs. Non-fraud failures using Last Financial Ratios before Failure
(1) (2) (3)
Full (1989-2015) Early (1989-2004) Recent (2007-2015)
Intercept -0.859*** -0.774** -1.524***
Equity 0.118*** 0.090*** 0.077**
Nonperforming loans 0.017* 0.003 0.012
Income earned not collected 0.036 0.097 1.674***
One year asset growth 0.017*** 0.020*** 0.005
Liquid assets -0.016*** -0.021*** -0.0002
Investment in subsidiary 0.187 0.219 0.545

DRAFT – DO NOT QUOTE OR DISTRIBUTE WITHOUT AUTHORS PERMISSION
35
Income before taxes -0.113*** -0.099*** -0.092***
Likelihood ratio 106.42*** 50.94*** 35.84***
Number of observations 1,236 718 518
*** Indicates statistical significance at 1%. ** indicates statistical significance at 5%. * indicates statistical significance at 10%.
Table 10 reports the estimation results using data four quarters prior to failure. For full, early, and
recent periods, banks with insider abuse and/or fraud reported higher equity. In full and early periods,
banks with insider abuse and/or fraud grew more rapidly. Due to rapid growth, the banks may outgrow
their rules, procedures, or internal control systems and make it easier for an insider abuse.
Moreover, banks with insider abuse and/or fraud had lower liquid assets ratio and invested more in the
bank’s subsidiaries in full and early periods. In recent periods, failed banks with insider abuse and/or
fraud had higher income earned but not collected. Banks with insider abuse and/or fraud reported
higher earnings one year before failure. This differs from the results in Table 9 where banks with insider
abuse and/or fraud reported lower earnings on their last call reports.
Table 10. Logistic Regression of Fraud vs. Non-fraud failures using Financial Ratios 4 Quarters before
Failure
(1) (2) (3)
Full (1989-2015) Early (1989-2004) Recent (2007-2015)
Intercept -0.136 0.023 -1.100**
Equity 0.071*** 0.034** 0.074**
Nonperforming loans 0.006 -0.027 0.006
Income earned not collected 0.010 0.094 1.388***
One year asset growth 0.007** 0.014*** -0.003
Liquid assets -0.027*** -0.034*** 0.0002
Investment in subsidiary 0.369* 0.423** 0.594
Income before taxes 0.064*** 0.051 0.056
Likelihood ratio 96.25*** 60.96*** 30.19***
Number of observations 1,228 710 518
*** Indicates statistical significance at 1%. ** indicates statistical significance at 5%. * indicates statistical significance at 10%.
Table 11 reports the estimation results using data eight quarters prior to failure. Banks with insider
abuse and/or fraud reported lower nonperforming loan ratios than did banks without insider abuse

DRAFT – DO NOT QUOTE OR DISTRIBUTE WITHOUT AUTHORS PERMISSION
36
and/or fraud for the full and early periods. While the estimated coefficient is negative, it is not
statistically significant for the recent period. This finding is consistent with banks with insider abuse
and/or fraud failing to recognize deterioration in the bank assets (Green and Reinstein (2004)).
Similarly, fraud failures reported lower liquid assets but the estimated coefficient is significant only for
the full and early periods. Higher reported earnings are also observed at fraud failures but the estimated
coefficient is statistically significant only for the full sample. For the recent period, income earned but
not collected to total assets ratio is positive and statistically significant.
Table 11. Logistic Regression of Fraud vs. Non-fraud failures using Financial Ratios 8 Quarters before
Failure
(1) (2) (3)
Full (1989-2015) Early (1989-2004) Recent (2007-2015)
Variable Fraud failure Fraud failure Fraud failure
Intercept 0.168 -0.065 -0.486
Equity 0.028* 0.025 -0.015
Nonperforming loans -0.060** -0.098*** -0.017
Income earned not collected -0.029 0.095 1.307***
One year asset growth -0.002 0.001 -0.003
Liquid assets -0.026*** -0.028*** -0.001
Investment in subsidiary -0.250 -0.589 0.600
Income before taxes 0.059** 0.036 0.054
Likelihood ratio 65.13*** 36.36*** 23.71***
N 1,203 689 514
*** Indicates statistical significance at 1%. ** indicates statistical significance at 5%. * indicates statistical significance at 10%.
The findings that banks reporting higher equity, lower nonperforming loans, and higher earnings are
consistent with banks with insider abuse and/or fraud reporting numbers that are more favorable than
banks without insider abuse and/or fraud. Possibly, these findings are a reflection of banks with insider
abuse and/or fraud reporting fictitious accounting numbers at higher frequency. The exception is liquid
assets which are negatively related to fraud failures. Plausibly, it is more difficult to report false level of
liquid assets. Loan quality is not readily observable which makes it easier for the bank to hide problems.
In contrast, it is more difficult to hide in treasury or other liquid securities.

DRAFT – DO NOT QUOTE OR DISTRIBUTE WITHOUT AUTHORS PERMISSION
37
6.3. Neural Networks
Our third approach to developing an off-site fraud detection model was to us a neural network pattern
recognition algorithm supplied by Matlab. Published research has found that neural network analysis
can successfully detect the types of outliers in data that insider abuse and fraud might produce in bank
financial statements. We trained neural network models using the same financial data as we used in the
Benford digit analysis and logit models of fraud-related bank failures. We also trained neural network
models using data from the same two pervious banking crises as we used for the Benford and logit
models. The majority of our results showed the neural network model trained very accurately on failed
banks where fraud was not detected by bank regulators, but did not accurately detect failed banks
where insider abuse and/or fraud was detected by bank regulators. In our attempts to train the neural
network model on the population of banks, the results were similar, with the model being unable to
detect banks with insider abuse and/or fraud. Given the lack of positive results we will not present
results here for brevity. We will continue to explore the potential for machine learning algorithms to
detect bank insider abuse and fraud, however.
7. Conclusions
Our results suggest that material insider abuse and/or fraud at banks is detectable using Benford digit
analysis of bank financial data for a period one-to-four years prior to failure. Specifically, we use a
recently developed second order Benford digit test to identify those banks whose financial statements
suggest tampering and purposeful misstatement. Unfortunately, we are unable to develop an accurate
neural network model for fraud prediction. Finally, regression analysis of the determinants of failure
among banks with insider abuse and/or fraud compared to other types of failed banks are in general
agreement with the literature on fraud in banking, which finds banks with insider abuse and fraud
present will overstate income and asset values, under-report losses and consequently overstate
capitalization.

DRAFT – DO NOT QUOTE OR DISTRIBUTE WITHOUT AUTHORS PERMISSION
38
References
Akerlof, George A and Paul M. Romer. Looting: The Economic Underworld of Bankruptcy for Profit.
Brookings Papers on Economic Activity, No. 2 (1993).
Albrecht, Steve W. Fraud in Government Entities: The Perpetrators and the Types of Fraud. Government
Finance Review, Vol. 7, No. 6 (December 1991) pp. 27–30.
Association of Certified Fraud Examiners. Using Benford’s Law to Detect Fraud. Sample Chapter from
Course on Fraud Detection, undated.
Benford, Frank. The Law on Anomalous Numbers. Proceedings of the American Philosophical Society,
Vol. 78, No. 4 (March 1938), pp. 551–572.
Black, William K. The Best Way to Rob a Bank is to Own One: How Corporate Executives and Politicians
Looted the S&L Industry. University of Texas Press, Austin, Texas (2005).
_____________. Those Who Forget the Regulatory Successes of the Past are Condemned to Failure.
Economic and Political Weekly, (March 28–April 3, 2009), Vol. 44, No. 13, pp. 80–86.
_____________. Why Regulators Must Fight ‘Control Fraud’ Like Public Health Specialists (January 14,
2010). Working Paper available at SSRN https://ssrn.com/abstract=1536527
Bolton, Richard J. and David J. Hand. Statistical Fraud Detection: A Review, Statistical Science, Vol. 17,
No. 3 (2002), pp. 235-255.
Cressey, Donald R. “Why Do Trusted Persons Commit Fraud? A Social-Psychological Study of
Defalcators”, Journal of Accountancy, Vol. 92, No. 5 (November 1951), pp. 576–581.
FDIC staff study. History of the Eighties – Lessons for the Future. (1997).
FDIC (2015).Formal and Informal Action Procedures (FIAP) Manual, (December 21, 2015).
Green, Brian Patrick and Alan Reinstein. Banking Industry Financial Statement Fraud and the Effects of
Regulation Enforcement and Increased Public Scrutiny. Research in Accounting Regulation, Vol. 17
(2004), pp. 87–106.
Lee, Yan and Chiwon Yom. The Entry, Performance, and Risk Profile of De Novo Banks, FDIC CFR WP
2016-03, (April 2016).
Newcomb, Simon. Note on the Frequency of Use of the Different Digits in Natural Numbers American
Journal of Mathematics, Vol. 4, No. 1. (1881), pp. 39-40.
Mark J. Nigrini and Steven J. Miller (2009). Data Diagnostics Using Second‐Order Tests of Benford's Law.
Unpublished Working Paper (June 1, 2006) and AUDITING: A Journal of Practice & Theory: November
2009, Vol. 28, No. 2, pp. 305-324.

DRAFT – DO NOT QUOTE OR DISTRIBUTE WITHOUT AUTHORS PERMISSION
39
Steven J. Miller and Mark J. Nigrini (2008). Order Statistics and Benford’s Law. International Journal of
Mathematics and Mathematical Sciences, Vol. 2008, article ID 382948, pp. 1-19.
McDill, Kathleen. Resolution Costs and the Business Cycle, FDIC Working Paper 2004-01, (March 2004).
O’Keefe, John. The Texas Banking Crisis: Causes and Consequences 1980–1989. FDIC Banking Review,
Vol. 3, No. 2. (Winter 1990).
Povel, Paul, Rajdeep Singh and Andrew Winton. Booms, Busts and Fraud. The Review of Financial
Studies, Vol. 20, No. 4 (July, 2007), pp. 1219–1254.
Wheeler, Stanton. The Organization as Weapon in White-Collar Crime (1982). Faculty Scholarship Series.
Paper 4128. http://digitalcommons.law.yale.edu/fss_papers/4128
Durtschi, Cindy, William Hillison and Carl Pacini. The Effective Use of Benford’s Law to Assist in Detecting
Fraud in Accounting Data. Journal of Forensic Accounting, 1524-5586/Vol.V (2004), pp. 17-34.