ofwat the use of revealed customer behaviour in future
TRANSCRIPT

Ofwat The Use of Revealed Customer Behaviour in Future Price Limits Final Report 08 April 2011
In Association with

Client: Ofwat Title: The Use of Revealed Customer Behaviour in Future Price
Limits Project No: CC422 Date of Issue: 8th April 2011 Status: Final Report Version No: V1 Produced By Authorised for Release By
……………………………….. ……………………………………
Allan Provins Topsy Rudd
Technical Director (eftec) Director
CONTACT DETAILS
CASCADE CONSULTING
Enterprise House
Manchester Science Park Lloyd St North Manchester M15 6SE
Tel: 0161 227 9777 Fax: 0161 227 1777

Ofwat The Use of Revealed Customer Behaviour in Future Price Limits Final
Cascade Consulting in association with eftec
Contents Executive Summary ............................................................................................ i 1 Introduction .............................................................................................. 1 1.1 Backround ............................................................................................................ 1 1.2 Objective and scope .............................................................................................. 2 1.3 Report structure .................................................................................................... 3 2 Revealed preference valuation ................................................................... 4 2.1 Conceptual overview ............................................................................................. 4 2.2 Avertive behaviour ................................................................................................ 7 2.3 Travel cost model .................................................................................................. 9 2.4 Discrete choice model ......................................................................................... 12 2.5 Hedonic pricing .................................................................................................. 15 2.6 Limitations .......................................................................................................... 18 3 Scope of revealed customer behaviour ..................................................... 21 3.1 Identify the range of customer behaviours ......................................................... 21 3.2 Assessing potential use of revealed customer behaviour ................................... 31 4 Recommendations for future use ............................................................. 43 Acknowlegements ............................................................................................ 46 References ....................................................................................................... 47 Appendix 1 ....................................................................................................... 53

Ofwat The Use of Revealed Customer Behaviour in Future Price Limits Final
Cascade Consulting in association with eftec i
EXECUTIVE SUMMARY
OBJECTIVE
The objective of this study is ―To understand the opportunities and practical constraints in
using revealed customer behaviour to assess customer priorities in setting future price
controls‖1. The specific aims are to:
1. Review empirical literature, primarily in relation to the application of RP methods to
the water and wastewater service attributes and environmental amenities relevant to
the water industry.
2. Advise on the water, wastewater and environmental service areas where different types
of revealed customer behaviour information could be applied by companies. This is to
include an assessment of the strengths, weaknesses and opportunities of the potential
approaches that are identified.
3. Provide recommendations as to further research that may be needed and the key
requirements for the water industry to successfully implement the potential
approaches identified.
In all of the above, the focus is on how information on revealed customer behaviour can be
applied within cost-benefit analysis (CBA) to support investment planning by water
companies.
The term ‗revealed customer behaviour‘ is defined to encompass both conventional revealed
preference methods and more general customer behaviours that can be observed in relation
to water, wastewater and environmental services. This permits the identification of a range
of sources of information that have the potential to help companies and regulators better
understand customer preferences.
REVEALED PREFERENCE VALUATION
Revealed preference methods focus on certain relationships that exist between the demand
for some market-priced goods and preferences for related non-market goods and services. By
observing particular household and business customer behaviours it is possible to infer their
preferences for levels of provision related to water, wastewater and environmental services.
There are three basic relationships of interest, which centre on the ‗benefit‘ that customers
receive from these services:
1 Ofwat Terms of Reference: The use of revealed customer behaviour in future price limits; Project Ref:
PROC.01.0217 (February 2011).
Ofwat The Use of Revealed Customer Behaviour in Future Price Limits Final
Cascade Consulting in association with eftec ii
A ‘substitute’ relationship: in this case a customer can derive the same benefit
from consumption of either a market good or the services provided by a water
company. For example bottled water is a substitute for tap water, and in response to a
service failure related to drinking water quality customers can switch to consuming
bottled water. The substitute relationship provides the basis for ‗avertive behaviour
approaches‘.
A ‘complement’ relationship: in this case a customer requires the joint
consumption of both the market good and the services provided by a water company to
derive the benefit. A classic example is recreation benefits associated with the water-
environment (e.g. swimming, fishing, walking, etc.). Here the market good comprises
of the costs incurred in undertaking water-related recreation activities (e.g. travel,
accommodation, food and other expenses). This is the underlying principle for the
‗travel cost method‘, which examines demand for visits to recreation sites where time
and money spent on travel to a site is complementary to recreational services of the
water environment.
An ‘attribute’ relationship: in this case the service provided by a water company is
a characteristic or an ‗attribute‘ of a marketed good. The common example is demand
for housing, where along with the characteristics of properties, the attributes of the
local neighbourhood and environment (e.g. water quality, disamenity from treatment
works, etc.) are key determinants of demand. This relationship provides the basis for
‗hedonic pricing approaches‘ and ‗discrete choice models‘.
Section 2 of the main report reviews the methods identified above, including recent
examples of application.
OPPORTUNITIES FOR USE OF REVEALED CUSTOMER BEHAVIOUR
The main findings from the study are summarised in Table ES.1; this is based on the
discussion of opportunities and constraints for applying different methods and data in
Section 3 of the main report. In most instances companies can make use of surveys of
households and businesses to generate revealed customer behaviour data. It is recognised
that this has the potential drawback in some cases of being based on customer reporting
rather than objective data sets (e.g. market sales data). However, this essentially is the
compromise that is required for easier implementation (both in data collection effort and
cost).
There are also wider opportunities to use revealed customer behaviour data to improve the
evidence base for investment planning. This includes scrutiny of customer complaints data,
more general visitor survey data (with respect to open access sites that are managed by water
companies) and potential refinements to wider customer surveys (e.g. tracking surveys).

Ofwat The Use of Revealed Customer Behaviour in Future Price Limits Final
Cascade Consulting in association with eftec iii
Table ES.1: Summary of scope for use of revealed preference methods
Service attribute Method Data Water services Drinking water aesthetics (taste, odour, appearance)
Avertive behaviour model Household survey Business survey
Drinking water health risks Avertive behaviour model Household survey Business survey
Water hardness Avertive behaviour model Household survey Business survey
Interruptions to supply Avertive behaviour model
Business survey
Security of supply Avertive behaviour model
Business survey
Low pressure Avertive behaviour model Household survey Business survey
Wastewater services Odour, disamenity from wastewater treatment
Hedonic property pricing Residential property sales, characteristics etc., GIS
Sewer flooding Avertive behaviour model / defensive expenditure
Household survey Business survey
Private sewer maintenance /adoption
Avertive behaviour model Household survey Business survey
Environmental services River water quality / flow levels (recreation benefits)
Discrete choice model Household survey, env. quality data, GIS data
Bathing water quality Discrete choice model
Household survey, env. quality data, GIS data
RECOMMENDATIONS
The following recommendations are presented for the use of revealed customer behaviour to
assess customer priorities in investment planning and development of business plans:
1. Business cases should be supported by a range of quantitative and
economic value evidence. Companies should review what data are collected (e.g.
through customer contacts) and opportunities that exist for collating more data (e.g.
by reviewing the content of tracking surveys). The objective should be to ensure that
business cases can be supported by an appropriate and sufficient qualitative,
quantitative and valuation evidence base. These assessments should be undertaken
by companies as part of their work to establish a coherent framework for benefits
valuation and applying CBA.
2. Companies should consider the use of avertive behaviour surveys to
understand better the substitution and mitigation actions customers take
in response to service failures. There is a strong case for exploring further the
potential for an avertive behaviour approach. Companies may wish to develop this
work individually or in collaboration. Household and business surveys could be cost-

Ofwat The Use of Revealed Customer Behaviour in Future Price Limits Final
Cascade Consulting in association with eftec iv
effectively implemented and this represents a potential ‗quick win‘ – particularly if
undertaken collaboratively – to advance understanding of avertive behaviours of
customers in relation to service failures.
3. All stakeholders should review the approach to valuing environmental
quality improvements associated with implementation of the Water
Framework Directive. There is considerable merit in taking stock of recent
methodological developments in the use of revealed preference methods and valuing
environmental water quality, particularly in terms of the application of discrete
choice models. This has significant implications for continued WFD implementation.
A practical starting point would be a scoping study including all stakeholders that
establishes the precise requirements for estimating the benefits of continued WFD
implementation.
4. Further scoping is required to establish the role for hedonic property
pricing in relation to valuing disamenity impacts associated with service
failures. There is considerable conceptual appeal in using hedonic pricing
approaches to value disamenity impacts arising from odour and nuisance from
wastewater treatment works. However empirical applications to date show that
successful studies require considerable time, resources, data and expertise.
Judgement is needed to establish if the effort required to deliver a robust study is
warranted.
5. Opportunities to combine revealed preference and stated preference
approaches should be considered. The basis for valuing changes in service
levels associated with water, wastewater and environmental services should not be
viewed as a choice of either revealed preference or stated preference methods2.
Companies need to develop a coherent framework for valuing benefits of service
improvements. Opportunities to apply both revealed and stated preference
approaches can provide a strong grounding in actual and experienced service levels
for resulting stated preference valuations.
2 Stated preference approaches use surveys to assess customer priorities that rely on stated behaviour rather than
actual observed behaviour. See UKWIR (2010) for further discussion of the use of stated preference methods in
water company investment planning.
Ofwat The Use of Revealed Customer Behaviour in Future Price Limits Final
Cascade Consulting in association with eftec 1
1 INTRODUCTION
1.1 BACKROUND
Ofwat (The Water Services Regulation Authority) – under the Future Price Limits
(FPL) project - is currently reviewing the framework within which future price
controls will be set. The review is focusing on the fundamental components of the
regulatory framework: the form of control used to regulate water companies; the
treatment of regulated and unregulated business in setting prices; the allocation of
risk between stakeholders; incentives; and customer engagement.
The purpose of the customer engagement element of the FPL is to establish how
customers‘ views should be taken into account when setting price limits and
establishing investment priorities. Three areas are being explored: (i) different modes
of engagement for different customers at different stages of service delivery; (ii) the
role of customer choice in revealing preferences; and (iii) the role of Ofwat, customer
representatives, and other stakeholders in the engagement process.
The review also follows from the recent experience of the 2009 Price Review (PR09)
where a strong emphasis was placed on the role of customer engagement in the
development of business plans. Water companies were required to use cost-benefit
analysis (CBA) to support investment proposals, with the expectation that they would
assess customer priorities and base benefit valuations on these priorities (Ofwat,
2007). In response companies undertook a considerable amount of work to establish
customer priorities and applied a range of economic valuation methods to estimate
the monetary value of costs and benefits associated with changes in service levels.
The PR09 CBA experience and lessons learnt by regulators and companies are
documented in the recent UKWIR (2010) review. This highlighted that even though
industry guidance was provided, which detailed the ‗valuation hierarchy‘ (market
prices – revealed preference – stated preference) (UKWIR 2007), benefits valuation
was dominated by the use of stated preference (SP) methods. These are survey based
valuation methods that rely on the construction of simulated markets in which
customers can trade-off changes in services levels with changes in household bill
amount. In contrast revealed preference (RP) methods, which infer values for
changes in service levels from actual observed customer behaviour and choices, were
not utilised by companies. Primarily this was due to limited scope for application of
RP methods across all investment areas of interest.
While the UKWIR (2010) review found the reliance on SP methods legitimate and
recommended their continued application to support companies‘ use of CBA, there is
also the need to reconsider the potential role of RP methods, particularly in the
Ofwat The Use of Revealed Customer Behaviour in Future Price Limits Final
Cascade Consulting in association with eftec 2
context of the FPL work. Here Ofwat has stressed the importance of observing
customer behaviour and choices as a powerful form of engagement that can reveal
information about preferences to guide companies‘ investment plans (Ofwat, 2010).
1.2 OBJECTIVE AND SCOPE
1.2.1 Aims and objective
The objective of this study is ―To understand the opportunities and practical
constraints in using revealed customer behaviour to assess customer priorities in
setting future price controls‖3. The specific aims of the work are to:
1. Review empirical literature, primarily in relation to the application of RP
methods to the water and wastewater service attributes and environmental
amenities relevant to the water industry.
2. Advise on the water, wastewater and environmental service areas where different
types of revealed customer behaviour information could be applied by companies.
This is to include an assessment of the strengths, weaknesses and opportunities
of the potential approaches that are identified.
3. Provide recommendations as to further research that may be needed and the key
requirements for the water industry to successfully implement the potential
approaches identified.
1.2.2 Scope of review
In the context of this study, ‗revealed customer behaviour‘ is defined in relatively
broad terms to encompass both conventional RP methods and more general
customer behaviours that can be observed in relation to water, wastewater and
environmental services provided by water companies. This permits the identification
of a range of sources of information that have the potential to help companies and
regulators better understand customer preferences.
In addition, while the main remit for the review is to establish how revealed customer
behaviour can be applied within CBA to support investment planning, there is also
scope to consider how information that is readily available to companies can be used
in an auxiliary manner to improve the investment planning process in general.
3 Ofwat Terms of Reference: The use of revealed customer behaviour in future price limits; Project Ref:
PROC.01.0217 (February 2011).

Ofwat The Use of Revealed Customer Behaviour in Future Price Limits Final
Cascade Consulting in association with eftec 3
1.3 REPORT STRUCTURE
The remainder of this report is structured as follows:
Section 2: reviews the conceptual basis for revealed preference methods and
highlights recent examples of their empirical application, drawing on the
literature review undertaken for this study.
Section 3: establishes the potential range of revealed customer behaviour relevant
to water, wastewater and environmental services areas and then provides a
critical assessment of the opportunities and practical constraints for their
application.
Section 4: presents recommendations for the use of revealed customer behaviour,
focussing on requirements for future research and future application across the
water industry.
In addition, Appendix 1 presents a tabular summary of empirical studies identified in
the literature review.

Ofwat The Use of Revealed Customer Behaviour in Future Price Limits Final
Cascade Consulting in association with eftec 4
2 REVEALED PREFERENCE VALUATION
2.1 CONCEPTUAL OVERVIEW
2.1.1 Valuing investment impacts in CBA
Application of CBA for company investment planning requires that all impacts of
proposals are measured in monetary terms to estimate and directly compare costs
and benefits. Following Young (2005) investment impacts can be classified as:
1. Impacts for which markets exist and market prices reflect economic values;
2. Impacts for which market prices can be observed, but where prices need to be
adjusted to more accurately reflect economic values;
3. Impacts for which market prices do not exist but where ‗surrogate‘ markets and
prices can be identified; and
4. Impact for which market prices and surrogate markets do not exist.
Resource costs associated with investment proposals – i.e. capital, operating and
maintenance expenditure – ordinarily fall into classes (1) and (2); the latter being
instances where distortions such as taxes and subsidies need to be removed from
observed prices such that values reflect opportunity costs. Other relevant market-
based impacts such as disruption from streetworks (e.g. value of losses to businesses)
and physical damage costs from pollution (e.g. fish re-stocking) and sewer flooding
incidents (e.g. damage to building fabrics and material) should also be valued via
market prices4.
Water industry regulation and price controls mean that prices paid by household and
business customers do not reflect the value of water and wastewater services in terms
of a formal competitive market clearing price. Moreover the water, wastewater and
environmental services provided by companies are characteristic of public and non-
market goods, hence the benefits and costs of changes in service levels typically fall
into classes (3) and (4) above.
The distinction between RP and SP methods can also be viewed in terms of the
classification of impact types. Revealed preference methods enable class (3) impacts
to be valued in monetary terms, using observed behaviour in ‗surrogate markets‘ to
infer the value of non-market goods. The basis of these methods is reviewed in
Section 2.2.
4 Note though that there are additional disamenity impacts from flooding (e.g. stress, trauma, etc.) which are not
captured by valuing physical damages in opportunity cost terms, but can be valued using other approaches to
economic valuation.

Ofwat The Use of Revealed Customer Behaviour in Future Price Limits Final
Cascade Consulting in association with eftec 5
In the absence of market prices and surrogate markets, SP methods represent the
only way in which class (4) impacts can be valued. Moreover, while RP methods are
limited to class (3) impacts, application of SP methods can be wider. This is
demonstrated by the widespread use of SP methods in PR09 due to a variety of
methodological and practical reasons (as reviewed in UKWIR, 2010). The general
point though is that the most appropriate method should be used in a given situation;
in some cases this will be RP methods, in others SP methods, and potentially in some
instances both types of method.
2.1.2 Basis for applying revealed preference methods
Revealed preference methods analyse surrogate markets and, in particular, certain
relationships that exist between: (a) the demand for some market-priced goods; and
(b) preferences for related non-market goods and services - i.e. the water, wastewater
and environmental services that are of interest in this study. A classic example is
valuing non-market recreation benefits associated with the water-environment, such
as visits to rivers, lakes, beaches, etc., through the market costs incurred in
undertaking water-related recreation activities (e.g. swimming, fishing, walking, etc.).
These market costs include travel (fuel, fares, etc.) and time (value of leisure time)
expenditures.
The basic requirements for using revealed preference methods are that (Young,
2005):
A. Changes in the provision of the non-market good (water, wastewater or
environmental service levels) actually influence some observable customer
behaviour (i.e. demand for the market good);
B. Changes in customer behaviour that are at least partly (and to an observable
extent) responses to changes in the provision of the non-market good; and
C. The market good is ‗non-essential‘ such that there is a price for the good at which
demand becomes zero (this is termed the ‗choke price‘)5.
These requirements significantly limit the scope for applying RP methods. In practice
there is only a distinct set of circumstances where they are satisfied such that
expenditure on some market good of interest can be observed to vary with the
provision of the non-market good. Without this variation it is not possible to infer the
value of the non-market good. That said information about related customer
behaviour may still be useful in supporting companies‘ investment planning – see
5 The choke price is the minimum price at which there would be no demand for a good. In the recreation
example cited above, this implies that once the travel and time costs incurred in visiting a particular site reach a
certain level, no individuals would visit it.

Ofwat The Use of Revealed Customer Behaviour in Future Price Limits Final
Cascade Consulting in association with eftec 6
Section 3 for further discussion.
2.1.3 Revealed preference methods – exploiting substitute, complement and
attribute relationships
The two most commonly recognised RP approaches are hedonic pricing and travel
cost models. These should however be considered as ‗umbrella terms‘ since specific
empirical applications may entail different methodological approaches. In addition,
further RP approaches such as ‗avertive behaviour‘ methods are also available.
Instead, a more conceptually appealing approach to classifying RP methods is on the
basis of the relationship between demand for the surrogate market good and
preferences for non-market good.
There are three basic relationships of interest, which centre on the benefit6 that an
individual ordinarily derives from the provision of the non-market good:
The market and non-market goods are substitutes: in this case an
individual can derive the same benefit from consumption of either the market
good or the non-market good. For example bottled water is a substitute for tap
water, and in response to a service failure related to drinking water quality
customers can switch to consuming bottled water.
The substitute relationship provides the basis for avertive behaviour approaches,
which may also be referred to as ‗defensive expenditures‘. In some cases the
‗damage cost approach‘ may also be included within the definition of RP methods
that exploit a substitute relationship7.
The market and non-market goods are complements: in this case an
individual requires the joint consumption of both the market good and the non-
market good to derive the benefit. This is the underlying principle for the
‗traditional‘ travel cost method, which examines demand for visits to recreation
sites where time and money spent on travel to a site is complementary to
recreation.
6 Note that in economic jargon interchangeable terms such as ‘utility’, ‘welfare’ or ‘wellbeing’ would be used
instead of ‘benefit’. 7 This section of the report does not consider the damage cost approach further. Where damage costs are based
on market values and are applied to measure the value of market impacts – i.e. class (1) impacts above – this
does not represent a RP approach. Where damage costs based on market prices are used to value a non-market
impact (e.g. using the cost of illness and health service resource costs to value health impacts), the general
understanding is that this represents a lower bound estimate of the value of the impact, such that households
would be willing to pay up to the expected amount of damages to avoid them (Dickie, 2003). More formally,
damage costs do not inform on an individual’s preference towards the changes in the non-market good; rather
just the loss of welfare from its degradation or loss.

Ofwat The Use of Revealed Customer Behaviour in Future Price Limits Final
Cascade Consulting in association with eftec 7
The non-market good is an attribute of the market good: in this case
the non-market good is a characteristic or an attribute of a marketed good. The
classic example is demand for housing, where along with the characteristics of
properties, the attributes of the local neighbourhood and environment are key
determinants of demand.
This attribute relationship provides the basis for hedonic pricing approaches and
discrete choice models8.
The following describes in further detail the application of the methods identified
above, covering both the methodological basis and recent examples of application.
2.2 AVERTIVE BEHAVIOUR
The avertive behaviour approach examines expenditures on substitute market goods
that customers incur in response to service failures. The underlying rationale is that a
household will continue with the averting behaviour so long as the cost of the
defensive expenditure is less than the value of the disamenity that is avoided and
would otherwise by experienced (Courant and Porter, 1981; Dickie, 2003). This
implies that averting behaviour choices in relation to the disamenity can reveal an
individual‘s willingness to pay (WTP) to avoid it. Technically, however, this estimate
will only represent a lower bound WTP (Bartik, 1988)9. In practice estimates of WTP
can be recovered from discrete choice models that examine customer responses to
service failures (see also Section 2.4).
In relation to water services, the most common empirical applications of avertive
behaviour have been in relation to human health impacts. Almost exclusively these
studies have focused on issues concerning household drinking water quality; no
assessments have been made of defensive expenditures that may be incurred by
businesses in response to service failures such as interruptions to supply. While there
are no UK examples, a number of Canadian studies in recent years have applied the
method to estimate the benefits of improved tap water quality. These studies have
been conducted in the context of a series of isolated but high profile E.coli and
cryptosporidium contamination incidents in Canada in the past decade.
Dupont (2005) reports on a pilot household survey that sought to establish use of tap
water and tap water substitutes (bottled water, container/jug filter, in-tap filter)
8 A point to highlight is that application of discrete choice models is analogous to the analysis of choice
experiments undertaken for water companies from PR09 WTP surveys, the only difference being the use of
revealed preference data, rather than stated preference data. 9 As Young (2005) details, defensive expenditures play a complex role in measuring welfare changes related to
environmental or water-pollution damages. In particular the marginal value of pollution damages (or other
service failures) cannot be measured by (marginal) changes in defensive expenditures since environmental or
water quality does not remain constant in relation to averting behaviours.

Ofwat The Use of Revealed Customer Behaviour in Future Price Limits Final
Cascade Consulting in association with eftec 8
along with knowledge of possible contaminants in the water supply, and health
concerns associated with tap water consumption. Based on reporting by respondents,
annual average costs to households of substitutes were estimated to be CAN $35
(approx. £20) for a container/jug filter, CAN $189 (£100) for an in-tap filter and
CAN $180 (£95) for bottled water. These cost were calculated on the basis of an
equivalent annual value for one-off purchases (in-tap filtration device,
container/jug)10, and annual costs incurred in terms of replacement filters or bottled
water purchases.
Similarly Schram et al. (2010) employed a survey format to examine the relationship
between drinking water choices and expenditures and health risks in Canada. Data
collected included the composition of drinking water, with households stating the
proportion of each type of water that they consumed in an average month (bottled,
in-home treated, or regular tap water). Other data included the costs for filtration
and bottled water, quality perceptions, attitudes and experience with water quality
issues, and demographics. For a typical month, households indicated their
expenditure on bottled water. For filtration devices, households were asked to state
the initial cost of the device, the amount of money spent on replacement filters, and
the frequency of replacement. The average monthly cost for 100% consumption of
bottled water and filtration was calculated to be approximately CAN $101 (£55) per
month and CAN $11 (£6) per month, respectively.
Schram et al. used the household survey data to estimate (discrete choice) averting
behaviour models to explain households‘ choice among the three water alternatives,
based on perceived quality characteristics (taste, smell and odour) and health risks,
and socio-economic characteristics. Households‘ perceptions of health risks –
specifically mortality risk from consumption of water - were captured via an
interactive ‗risk ladder‘ on which respondents were asked to plot their perceived level
of risk in relation to a range of other mortality risks (illness, accidents, etc.)11. Latent
class models12 were employed, such that the analysis distinguished between risk
sensitive households who were more likely to choose tap water substitutes and those
who were not risk sensitive. The results confirmed that health risk, in terms of
perceived mortality, was a significant determinant of households‘ water consumption
choice. Taste of water was also found to be a significant determinant of choice, along
with odour and convenience (particularly for risk sensitive households). This result
supported other findings from the study that the greatest dissatisfaction with tap
10
Note though that the calculation of an annual equivalent value is dependent upon the assumed asset life and
discount rate. 11
This element of the study is more indicative of a stated preference approach. However this demonstrates the
potential of combining RP and SP approaches in any application that is reliant on a survey of individuals. 12
Latent class models are an advanced econometric specification for discrete choice models that include the
familiar multinomial and mixed logit specifications from the PR09 experience of econometric analysis of choice
experiment data.

Ofwat The Use of Revealed Customer Behaviour in Future Price Limits Final
Cascade Consulting in association with eftec 9
water arose in relation to the taste of chlorine. The appearance of water was not
found to be a significant determinant of choice.
The averting behaviour models estimated by Schram et al. also permitted the
estimation of a value of statistical life (VSL) of approximately CAN $1.4 million
(approx. £755,000), and monthly marginal willingness to pay (WTP) estimates for
improvements in tap water to the perceived quality of filtered and bottled water
(approximately CAN $3 (£2) and CAN $14 (£8), respectively). The authors note that
these represent lower bound VSL and WTP estimates since they are based on averting
expenditures, and do not capture any consumer surplus above this.
Further studies using the avertive behaviour method include Abrahams et al. (2000)
who found that in Georgia (USA) appearance of tap water and respondent age are
among the most important determinants of bottled water selection; and information
regarding current or prior problems with tap water, perceived risk from tap water
and income are the most important determinants of water filter selection. Outside of
North America, Wu and Huang (2001) compared results from the avertive behaviour
approach and a contingent valuation survey carried out in Taiwan, finding that the
former did indeed provide a lower bound estimate of WTP derived from the latter. A
similar analysis is reported in Rosado et al. (2006) in relation to drinking water
treatment in Brazil.
Studies by McConnell and Rosado (2000) and Larson and Gnedenko (1998) also
include boiling water as an alternative response to drinking water safety concerns.
This action is also examined by Lee and Kwak (2007) who find that households in
Seoul, South Korea, have a preference for the impaired taste of water resulting from
boiling, since it lowers the health risk from potential contaminants of tap water.
2.3 TRAVEL COST MODEL
The term ‗travel cost method‘ refers to analyses that measure demand for visits to
outdoor recreation sites, such as forests, National Parks, beaches, rivers, lakes, etc.
Their application enables the estimation of the non-market benefit derived by visitors
to sites that have no or only a nominal entry fee. The method is reliant on ‗weak
complementarity‘ so that when consumption of the market good (travel) is zero, the
benefit obtained from the non-market good is zero (Maler, 1974; Bockstael and
McConnell, 1999).
Since the cost of travelling to a site will vary among visitors a demand schedule for
recreation at the site can be estimated (Ward and Beal, 2000; Freeman, 2003). The
‗price‘ of a recreational visit is calculated from travel costs (e.g. petrol, fares, etc.),
along with the dis-benefit (or benefit) of actual travel time too, typically valued in
terms of the opportunity cost of leisure time.
Ofwat The Use of Revealed Customer Behaviour in Future Price Limits Final
Cascade Consulting in association with eftec 10
The travel cost approach is survey based, ordinarily requiring data to be collected
from visitors to a recreation site in terms of the purpose of the visit, incurred travel
costs, frequency of visits to the site and similar (substitute) sites over a given period,
and other determining factors such as socio-economic, demographic and attitudinal
information13. This permits estimation of a ‗trip-generating function‘ which explains
the number of visits as a function of travel costs and other relevant explanatory
variables. This can then be used to estimate the demand curve for recreation at the
site and calculation of the non-market value of recreation benefits at the site. Values
are estimated in terms of ‗consumer surplus‘, which in this context is the difference
between an individual‘s WTP and their travel cost expenditure14.
Zonal travel cost model
Early applications of the travel cost approach applied the ‗zonal travel cost model‘
(ZTCM). This was based on visit rates (i.e. the number of visitors from an area
divided by the population of that area) from different geographical ‗zones‘ around a
site, which enabled number of visits per capita for each zone to be calculated.
Results from the ZTCM are in terms of the average behaviour of groups of visitors,
which does not correspond well to the underlying principles of economic analysis
which focus on the choices of individuals. Accordingly the ZTCM is seldom applied in
relation to valuing benefits of non-market recreation. It does however retain useful
properties for estimating trip-generating functions that are transferable between
different recreation sites (Jones et al., 2010). In the context of water company
investment planning, this can be useful where on-site visitor surveys are available for
open-access recreation resources (e.g. reservoirs) 15 and an investment driver such as
the Countryside Rights of Way (CROW) Act.
Individual travel cost model
More widely applied is the individual travel cost model (ITCM), although its use in
recent years has diminished with the increasing application of discrete choice models
(Section 2.4). The ITCM is derived from the number of visits an individual or
household makes to a specific recreation site over some period of time (e.g. a year).
Numerous examples of empirical applications are available in the early
environmental economic literature, including a number of UK studies related to the
water-environment. For example: Willis (1990); Willis and Garrod (1991); and Klein
13
Note also that surveys could instead be conducted ‘off-site’ and still collect data on visits to recreation sites.
An example of this approach is provided by the ChREAM study cited in Section 2.4. 14
Note that for non-market goods, where no entry fees, travel costs, etc. are incurred then consumer surplus is
wholly equal to WTP. 15
For further discussion see eftec (2010) which reviews how recreation survey data currently collected in
England – including the Monitor of Engagement with the Natural Environment (MENE) – could be used for
generating economic valuation evidence for project and policy appraisal purposes.

Ofwat The Use of Revealed Customer Behaviour in Future Price Limits Final
Cascade Consulting in association with eftec 11
and Bateman (1998). Later applications have focused mostly on forest recreation (e.g.
Christie et al. 2006).
Outside of the UK, Corrigan et al. (2007) report results from an ITCM estimated in
relation to visits to Clear Lake, Iowa (USA). Surveying approximately 400 resident
households in Iowa, the average number of trips to Clear Lake was 3 per year.
Average annual consumer surplus – i.e. the benefit derived by households each year
from visits to Clear Lake - was estimated to be approximately US $200 (approx.
£140) per household per year.
Combining ITCM with other revealed and stated preference approaches
Increasingly the ITCM and trip-generating function have been utilised in studies that
combine these with discrete choice models (see Section 2.4) or stated preference
approaches such as contingent behaviour models (following Englin and Cameron,
1996). In particular Corrigan et al. also included a contingent behaviour question to
estimate the value of improved water quality at Clear Lake. In addition to reporting
how many visits they took in the past year, households were also asked how many
trips they would have taken had water quality at the lake been improved, in
accordance with a scenario described in the survey. The inclusion of a contingent
behaviour question permits WTP estimate to be calculated for improvements in
recreation site quality. Since travel cost remains constant between changes in site
quality, WTP is derived from the change in consumer surplus that follows from
increased or decreased visits to the site. In Corrigan et al. average WTP for water
quality improvements at Clear Lake was estimated to be approximately $140 (approx.
£90) per household per year for a small improvement and $350 (£225) per
household per year for a large improvement.
A similar combined ITCM and contingent behaviour application is reported by
Hanley et al. (2003) in relation to improvements in bathing water quality at seven
beaches in Scotland. Using an on-site survey, improvements to the EU Directive
standard were valued at approximately £6 per visitor per year, or £0.50 per trip.
Rolfe and Dyack (2010) present results from an ITCM and contingent behaviour
survey that sought to estimate the value of access to the Coorong, the estuary of the
Murray River, South Australia. Consumer surplus associated with visits to the
Coorong was estimated to be AUS $111 (approx. £50) per visitor per day. The value of
a 1 per cent change in access was estimated to be approximately AUS $17 (£7) per
visitor per day.
Johnstone and Markandya (2006) report on a study that combined a trip-generating
function and discrete choice model (Section 2.4) in the context of river water quality
improvements and angling in England. Approximately 400 anglers were surveyed via
a variety of methods (mail, internet, distribution to angling clubs). The trip-

Ofwat The Use of Revealed Customer Behaviour in Future Price Limits Final
Cascade Consulting in association with eftec 12
generating function was estimated to predict changes in the number of visits made by
an individual to a specific site resulting from marginal changes in river quality
attributes. Data on environmental quality of sites were collated separately from a
variety of habitat, chemical, biological and fish population indicators. Results from
the trip-generating function were then inputted to a discrete choice model so that
both the changes in site quality and visit behaviour could be examined – further
results from this study are reported in Section 2.4.
2.4 DISCRETE CHOICE MODEL
The discrete choice model (DCM) was introduced as an approach to valuation of non-
market goods by Bockstael et al. (1987)16. As described in Section 2.1.3 its application
is based on the ‗attribute relationship‘ that exists between the level of provision of
some non-market goods and demand for particular market goods. The non-market
good is an attribute of the overall good that is consumed, and changes in its quantity
or quality will influence demand for the overall good.
By far the most common application is in relation to recreation demand. In this
context the DCM can be used to estimate the value of changes in the quality of
recreation services by focussing on the decisions of individuals to visit a specific site
rather than alternative substitute sites. The DCM provides a convenient way to
explain the choice among mutually exclusive alternative sites and permits control of
relevant substitution and site quality effects. Typically this represents a more
accurate representation of individual‘s recreation choice behaviour than that of the
ITCM (Phaneuf and Smith, 2005).
Accordingly, the DCM is now the dominant revealed preference method used in
relation to valuing environmental improvements at recreation and other visitor sites,
and much of the academic literature in recent years has focussed on its
methodological development17. The key consideration is that individuals and
households will visit multiple recreation sites over a given period of time. The value
of a change in quality of one site (e.g. an improvement in river water quality) will
depend on the site‘s initial quality, its proximity to where the household resides, and
also on the quality and proximity of the other sites (i.e. other river sites that the
household may visit). Essentially there is an interaction between sites and
16
Unfortunately terminology can be confusing. This approach is also often termed as ‘multi-site recreation
demand models’ or ‘random utility models’ (RUM) after the underlying model of behaviour it utilises. They can
also be grouped with travel cost models since the most common application is the valuation of non-market
recreation benefits based on travel costs incurred in site visits. Models may also be termed as ‘Kuhn-Tucker
models’, which can be seen as an extension of the basic DCM such that choices are modelled over a period of
time (i.e. a recreation season) (Phaneuf and Siderelis, 2003). 17
For a sample see: Phaneuf et al., (2000); von Haefen (2007); Timmins and Murdock (2007); and Bockstael
and McConnell (2007).

Ofwat The Use of Revealed Customer Behaviour in Future Price Limits Final
Cascade Consulting in association with eftec 13
households will value the set of sites, all of which have different qualities and
characteristics. In contrast the ITCM (see Section 2.3) focuses on a ‗continuous‘
choice (annual visit to a specific site) rather than a discrete choice (the decision of
which site, if any, to visit).
Application of DCM requires a survey to collect data on individuals‘ choice of site,
their place of residence, socio-economic and demographic characteristics, attitudinal
information, frequency of visits to the site and other similar sites and trip
information (e.g. purposefulness, length, associated costs etc). This can be collected
from either an on-site or off-site survey. Data are also required on the specific
characteristics of different recreation sites and the level of the quality of these
characteristics. These can either be collected from ‗objective‘ datasets (e.g. river
quality monitoring data), or based on the ‗subjective‘ perceptions of quality by
visitors, or both (Jeon et al., 2005). The latter case of ‗subjective‘ perceptions can
however limit the transferability of results; i.e. ‗objective‘ data on site quality can be
easily collated for out of sample sites, data on individuals‘ perceptions is not usually
readily available.
From the survey data, the choice of which site to visit is modelled as a comparison
between the characteristics of each site that could be visited (known as the ‗choice
set‘)18. The estimated model controls for factors such as income and socio-economic
characteristics, travel costs and travel time, and site quality characteristics to
estimate the benefit derived from a recreation visit. The monetary value of a change
in environmental quality can be calculated by relating the estimated model coefficient
for environmental quality to the ‗price‘ of a visit, which, as in the ITCM, is inferred
from the cost of travel to a site.
The most recent UK application of the DCM in relation to valuing improvements in
water quality is the ChREAM study19 (Bateman et al., 2010). In the context of
implementation of the Water Framework Directive (WFD) this study sought to
examine the relationship between improvements in water quality and increased
recreational visits. A face-to-face survey was carried out in West Yorkshire (Bradford,
Leeds and surrounding areas). A large study area was defined which included
multiple diverse rivers, several hundred urban and rural recreation sites, and
substantial variation in accessibility and river water quality at different sites.
Households were selected from diverse locations across the full study area to provide
variation in socio-economic and demographic characteristics, as well as the quality
and location of recreation and substitute sites. Computerised software was used to
18
In principle the choice set should include all possible recreation sites (i.e. not just all water sites) and the
‘outside good’ (the choice of not visiting anywhere). 19
Catchment hydrology, Resources, Economics and Management (ChREAM).
See: www.uea.ac.uk/env/cserge/research/relu/index

Ofwat The Use of Revealed Customer Behaviour in Future Price Limits Final
Cascade Consulting in association with eftec 14
identify the location of each respondent‘s home address and possible destination
sites, such that geographic information systems (GIS) could be used to calculate
travel times and travel costs between the respondent‘s home and the choice set of
sites. Respondents were asked to identify the location of any water recreation sites
they visited and to rate the water quality at the site. 531 possible sites were identified
on three rivers.
Initial results from ChREAM indicate a significant relationship between
improvements in water quality and increased recreational visits. However this
finding does not apply to all changes: households were found to be insensitive
between different grades of poor quality water, but sensitive to improvements
between medium to good quality water. The implication is that there are non-linear
variations in recreation value as water quality changes, both for single sites, and for
groups of sites. For a specific site, use levels and values may be unresponsive to small
improvements at the poor quality end of the scale, then increase quite rapidly moving
towards the good quality. For groups of sites, the aggregate value of improving water
quality in more populated areas outweighs the benefits of improvements in sparsely
populated areas. Moreover the value of further improvements is lower the closer a
water body is to another high quality substitute water body. Findings of this nature
have significant implications for economic analysis of continued WFD
implementation, particularly where results applied in PR09 and the first round of
river basin management plans were more or less based on linear valuations.
A further UK example of the DCM is provided by Johnstone and Markandya (2006).
As reported above, this applies the approach to value benefits to anglers from
improvements in river water quality. They found that river flow rate, dissolved
oxygen (DO), fish species diversity and fish population sizes were significant
determinants of site choice across upland, lowland and chalk river types. Willingness
to pay for improvements in these quality indicators (assuming linearity) ranged
between £0.00 to approximately £4 per angler per trip.
Beyond the UK numerous empirical applications of the DCM have been undertaken.
Notable examples water related include: Phaneuf and Siderelis (2003) in relation to
canoeing and kayaking in North Carolina (USA); Hunt et al. (2007) in relation to
choice of fishing site by anglers in Canada; and Hynes et al. (2008) in relation to
kayaking in Ireland. Jeon at al. (2005) and Egan et al. (2004) report results from the
Iowa Lakes Valuation project, which surveyed approximately 4,000 households in
Iowa as to their recreation use of 129 of Iowa‘s principle lakes.
Information collected from respondents included their recreation choices over time
(site choice and number of visits), socio-economic data, attitudes towards water
quality issues and travel costs. Data was also collated on the characteristics of sites
Ofwat The Use of Revealed Customer Behaviour in Future Price Limits Final
Cascade Consulting in association with eftec 15
(e.g. visitor facilities). In addition the study ran in parallel to monitoring of water
quality at the same lakes, giving a time series of data on various physical measures of
water quality over a period of five years20. The analysis of the data finds that
households‘ recreation choices are responsive to the physical measures of water
quality, particularly the clarity of water. The authors estimate consumer surplus for a
number of water improvement scenarios, ranging from significant improvements
across all lakes (approximately US $200 (£130) per household per year) to very
focused initiatives on the most quality impaired lakes (approximately US $5 (£3) per
household per year21).
Finally, while application of the DCM is predominantly in the context of
environmental quality and recreation demand, it can also be applied in much broader
settings. This is demonstrated by reporting in eftec (2008) which estimates a DCM to
examine how specific attributes of new cars (e.g. fuel efficiency, CO2 emissions, etc.)
influence overall demand. Other common applications include transport (modelling
transport mode choice) and marketing.
2.5 HEDONIC PRICING
The hedonic pricing method (HPM) also utilises the ‗attribute relationship‘ that exists
between the level of provision of some non-market goods and demand for particular
market goods. The approach is based on the assumption that the price of a marketed
good is a function of its various characteristics, each of which has an ‗implicit price‘22.
Hence it is dependent on weak complementarity such that changes in the provision of
the non-market good change the price of the market good (Maler, 1974).
The most familiar use of HPM is in relation to demand for property (‗hedonic
property pricing‘ – HPP), with the most common application to private house
purchases. It can also be applied to the rental market, commercial property,
undeveloped land and agricultural land. Wider applications include valuing
occupational health and safety through wage-risk premia. Focusing on HPP,
differences in the market price of a property that result from its specific attributes are
termed as ‗price differentials‘. Many attributes of properties command a price
differential, and include the physical characteristics of the property (e.g. number of
rooms, size of garden), proximity to transport links and public services,
environmental quality (e.g. air quality, peace and quiet, availability of green space),
20
Data was collected on: water clarity, chlorophyll, nitrogen, total phosphorus, silicon, acidity, alkalinity,
inorganic suspended solids, and volatile suspended solids. 21
Jeon et al. note that this low value can be reasonably explained by the fact that Iowa has an abundance of
lakes of a reasonable water quality and hence bringing low quality level lakes to this level does not represent
much of a benefit. This finding is consistent with the initial findings from the ChREAM study in relation to river
water quality. 22
Note the distinction between the DCM and HPM; the latter is estimated in terms of the price of a specific
marketed good. In the DCM the analysis is concerned with the choice between alternative goods.

Ofwat The Use of Revealed Customer Behaviour in Future Price Limits Final
Cascade Consulting in association with eftec 16
and other neighbourhood characteristics (e.g. crime rate).
Application of the HPP is data intensive, requiring information on property sales and
prices, along with details of the property characteristics and relevant environmental
and neighbourhood attributes. Econometric analysis of the data requires two stages
of estimation: (i) the hedonic price function, which models property price as a
function of property attributes; and (ii) demand curve for the non-market good of
interest. Few studies in the UK have applied HPP in relation to water or wastewater
services. A dated example is provided by Garrod and Willis (1994) who estimate the
amenity effect of a water-side location on properties, finding a premium on property
values of 1.5% to 5% in locations in London and the Midlands. There are though more
examples in the wider literature. This includes use of HPP in relation to disamenity
from road traffic noise (Bateman et al., 2004; Day et al. 2007) and landfill sites
(Defra, 2003), as well as the value of local amenities, services and green space
(Gibbons, 2001; 20o3; and Gibbons and Machin; Smith, 2010; Gibbons et al. 2011).
The one explicit application in the context of the water industry in England and
Wales is UKWIR (2008a). This study sought to investigate the relationship between
the odour from wastewater treatment works and residential property prices in
surrounding areas, and included both SP and HPP analyses. The HPP element of the
study attempted to model house prices against a small set of property characteristics,
including odour level. This is a partial analysis as it uses only stage 1 of the HPP
methodology. Some statistical associations between house prices and odour levels
were found; however very limited econometric models were estimated with no
control for any other factor than the basic property type. No information on property
characteristics, local services and amenities and other local environmental factors
were included in the analysis. This suggests that the reported results are likely to be
subject to significant omitted variable biases.
Outside of the UK more successful water-related examples of application of the HPP
are available. Gibbs et al. (2002) report on the use of HPP to value the costs of
eutrophication in lakes in New Hampshire, USA. They found that a one-metre
decrease in water clarity can lead to decreases in lake-front property prices of
between 1 – 6%. In a similar context, Leggett and Bockstael (2000) value the impact
of water quality in Chesapeake Bay, Maryland (USA), on residential house prices.
Measuring water quality in terms of faecal coliform count, they found that a 100mL
change results in a 1.5% change in property price. This equated to a change of
approximately US $5,000 – 10,000 (approx. £4,000 - £8,000) per property. Poor et
al. (2007) value the impact of water quality on house prices in the St. Mary‘s
watershed (also in Maryland). They find that higher levels of suspended solids and
dissolved inorganic nitrogen have a negative impact on house prices; a 1 mg/L
increase in total suspended solids reduced average house price by approximately US

Ofwat The Use of Revealed Customer Behaviour in Future Price Limits Final
Cascade Consulting in association with eftec 17
$1,000 (£700), a 1 mg/L increase in dissolved inorganic nitrogen reduced average
house prices by approximately $17,500 (£12,100).
A wider application is presented by MacDonald et al. (2010) who use an HPP
approach to estimate the impact of water restrictions on property values by
examining how they affect preferences for private green spaces and public green
spaces. The authors used housing market data from Adelaide, South Australia, to test
whether increasingly severe water restrictions23 lead home owners to value public
green spaces (public parks, playgrounds, sporting fields and large reserves) more
highly over private green spaces (lawns and gardens), where restrictions result in
overly onerous maintenance efforts for the latter. The HPP model controls for various
housing characteristics, local environmental amenity and neighbourhood
characteristics24.
Results indicate that increased private green space (measured as the ratio of private
green space to property area) adds to the selling price up to a certain point (a ratio of
green space to property area of 0.42) whereupon increasing green space starts to
detract from the value. The authors posit that this may reflect a preference for
smaller gardens which take less time to maintain. Water restrictions are not found to
influence households‘ preferences for private green space. However they have a
changing impact on the relationship between proximity to playgrounds and house
prices. The relationship is insignificant in the absence of restrictions, but when
restrictions are in force, proximity to a playground is valued in the range AUS $4 – 6
(approx. £1.50-£2.50) per metre closer. In contrast large public green spaces, such as
nature reserves are considered disamenities with householders willing to pay more to
live away from them – approximately about AUS $11 (£5) for each additional metre
farther away25. This is interpreted as preference against reserves being left in their
natural state – i.e. brown and dry during summers, with a heightened danger of bush
fires.
23
Restrictions range from relatively minor intended to reduce garden water losses (e.g. time restrictions on
sprinkler systems) to more significant and rigid restrictions on when gardens can be watered (e.g. no watering
during winter). 24
These included: date of sale, lot size, building area, number of main rooms, number of bathrooms, building
age, building condition and the presence of a swimming pool, carport/garage and sheds; proximity to the central
business district, coastline, schools, cemeteries, golf courses, main roads, water bodies, watercourses and
whether houses were in commercial zones, historic residential zones, recreational zones, industrial zones and
hills facing zones. 25
These values are in terms of change in house price (i.e. capital value). Much greater impacts are reported for
aspects such as property characteristics; for example a swimming pool adds AUS $31,400 (£13,500) to house
price.

Ofwat The Use of Revealed Customer Behaviour in Future Price Limits Final
Cascade Consulting in association with eftec 18
2.6 LIMITATIONS
Where there is a genuine choice between RP and SP methods, the general view
appears to be that the former are favoured since they estimate economic values based
on actual observed behaviour. In particular RP methods are not prone to the
potential hypothetical biases that can influence results from SP methods and hence
are usually deemed to be more ‗valid‘. This is based on the assumption that what
individuals do is a more accurate reflection of their preferences than what individuals
say they will do.
In addition some empirical analyses have demonstrated that valuations from SP
methods exceed those from RP methods. Box 2.1 provides a brief summary. Often
such findings are generically interpreted ignoring the context-specific nature of
results and consequently – and often without good reason (for further discussion see
UKWIR, 2010) - commentaries can be prejudiced against the use SP methods.
Crucially these types of characterisations of RP and SP methods miss the important
point that the choice of valuation method is always context-specific and should be
based on both methodological and practical considerations.
Box 2.1 Comparing RP and SP valuations
Differences between actual and stated behaviour were investigated initially by Needleman
(1974) in the context of estimating values of statistical life. However, the widely cited ‗classic‘
reference is Carson et al. (1996) who provided a detailed analysis of 83 studies, with 616
comparisons between contingent valuation (CV) and RP values. They found a mean CV/RP
ratio of 0.89 for the complete data set, with a confidence interval of 0.81-0.96, and a median
of 0.75. Therefore a RP approach might actually produce higher values than using CV.
Wider research however has tended to show that SP choice experiments (CEs) produce higher
WTP estimates than CV, so accordingly there may not be any difference between RP and CE in
many cases. More recently a meta-analysis of the value of marine water quality in the Baltic
Sea by Ahtiainen (2010) found that CE results were higher than CV results, which were higher
than RP results.
The overall conclusion to draw from the empirical value evidence is that an a priori
expectation that RP values will be lower than SP values may not necessarily be borne out in
practice.
Ofwat The Use of Revealed Customer Behaviour in Future Price Limits Final
Cascade Consulting in association with eftec 19
Here then it is important to recognise the limitations that can be associated with RP
methods:
Economic values can only be estimated for readily perceived non-market
impacts: RP methods are limited to changes in service levels that are manifest to
individuals. In relation to the HPP this can include many long standing effects
(e.g. noise and visual intrusion from transport links, local amenities such as
parks) but less ‗visible‘ elements (e.g. risk of sewer flooding) may not be well
perceived. There may also be a poor match between the subjective perception of
a potential impact and objective measures of the impact (e.g. health risks related
to drinking water quality); although this can be true for market goods too.
Economic value estimates are based on historic behaviour: a trade-off in utilising
observed behaviour is that it can only inform on the value of changes in provision
of non-market goods that are currently or have previously been experienced.
Often investment planning is concerned with future levels of service that are ‗out-
of-sample‘, and it may not be possible to infer economic values for such outcomes
using RP methods alone. Combining RP and SP methods can potentially
overcome such obstacles; in particular adding contingent behaviour or contingent
valuation questions to surveys collecting data on avertive behaviour or recreation
demand (e.g. DCM) can be an effective way to ‗ground‘ SP results in observed
behaviour.
RP methods can only estimate use values: by definition RP methods cannot
provide estimates of non-use values, which arise for altruistic, bequest and
existence motives. In some circumstances non-use value may represent a
substantial component of the total economic value derived from a particular non-
market good, and hence reliance on RP approaches could lead to a significant
under-estimation of aggregate costs or benefits.
Application of RP methods can be data intensive: practical implementation of
averting behaviour models, ITCM and trip-generating functions, DCM and HPP
models ordinarily requires detailed and good quality datasets. This can entail
considerable time and effort to collate, which should not be underestimated and
can also have potentially substantial cost implications where data have to be
purchased from third party sources. Robust application also requires advanced
technical skills in econometric estimation. This could be one of the reasons why
there are relatively few recent empirical applications of RP methods in the UK as
the review of studies summarised in Appendix 1 reveals.
Accuracy of estimation and results: the robustness of economic values estimated
by RP methods is dependent on the representativeness and validity of the

Ofwat The Use of Revealed Customer Behaviour in Future Price Limits Final
Cascade Consulting in association with eftec 20
observed data from which they are inferred, and crucially the methodological
techniques used in estimating models (e.g. functional form and fit to data)
(Young, 2005). While there can be a lack of theoretical guidance in this regard,
such issues can largely be addressed empirically by appropriate scrutiny of
econometric results and validity testing.

Ofwat The Use of Revealed Customer Behaviour in Future Price Limits Final
Cascade Consulting in association with eftec 21
3 SCOPE OF REVEALED CUSTOMER BEHAVIOUR
3.1 IDENTIFY THE RANGE OF CUSTOMER BEHAVIOURS
This section sets out the scope of customer behaviour that could potentially be
observed by companies, regulators and other stakeholders, as part of investment
planning and the development of business cases. This scoping exercise has been
informed by:
The methodological and empirical literature reviewed in Section 2 and
summarised also in Appendix 1;
Review of other relevant documents, including selected aspects of companies‘
PR09 final business plans;
Consultation with the representatives of a number of water companies, and
Consideration of practices in other sectors.
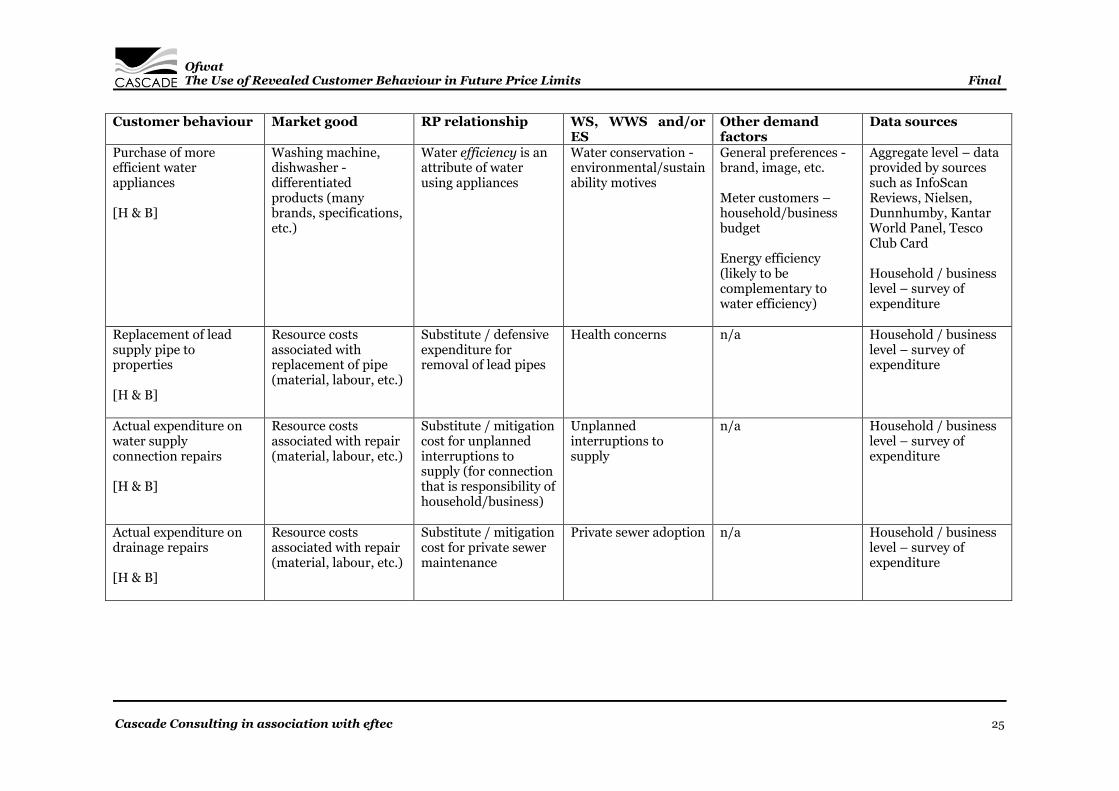
Findings are presented in Table 3.1, which identifies various observable behaviours
by household and business customers. For each behaviour the table establishes the
substitute, complement or attribute relationship that could be utilised for the
purposes of valuing water, wastewater and environmental services provided by
companies. Where relevant other likely determinants of demand for the market and
non-market good are also identified; these are the factors that would need to be
controlled for by any analyses in order to isolate the effect of interest.
Table 3.1 also identifies a set of behaviours that do not accord with the conditions for
using revealed preference methods (as reviewed in Section 2.1). Nevertheless such
quantitative information can be valuable in supporting business cases and this role is
considered further in Section 3.2.4.

Ofwat The Use of Revealed Customer Behaviour in Future Price Limits Final
Cascade Consulting in association with eftec 22
Table 3.1: Identification of customer behaviours [H = Households; B = Businesses]
Customer behaviour Market good RP relationship WS, WWS and/or ES
Other demand factors
Data sources
Purchase of bottled water [H & B]
Bottled water - differentiated product (many brands)
Substitute / defensive expenditure for drinking water
Taste, smell, appearance concerns of tap water Perceived health concerns related to tap water
General preferences - brand, image, etc. Convenience (bottled water is portable)
Aggregate level – data provided by sources such as InfoScan Reviews, Nielsen, Dunnhumby, Kantar World Panel, Tesco Club Card Household / business level – survey of consumption and expenditure
Purchase of water filters (for jugs, kettles, etc.) and replacement cartridges [H & B]
Jugs, kettles, etc. that have a water filter cartridge
Substitute / defensive expenditure for drinking water, or in relation to water hardness
Taste, smell, appearance concerns of tap water Perceived health concerns related to tap water Water hardness
General preferences - brand, image, etc.
Aggregate level – data provided by sources such as InfoScan Reviews, Nielsen, Dunnhumby, Kantar World Panel, Tesco Club Card Household / business level – survey of consumption and expenditure

Ofwat The Use of Revealed Customer Behaviour in Future Price Limits Final
Cascade Consulting in association with eftec 23
Customer behaviour Market good RP relationship WS, WWS and/or ES
Other demand factors
Data sources
Purchase of water filters (plumbed in) and replacement cartridges [H & B]
Water filtration devices that are plumbed into kitchen/drinking water taps
Substitute / defensive expenditure for household drinking water and/or in relation to water hardness
Taste, smell, appearance concerns of tap water Perceived health concerns related to tap water Water hardness
General preferences - image, etc.
Aggregate level – market sales data Household / business level – survey of consumption and expenditure
Purchase of water softeners [H & B]
Devices that are plumbed into mains supply (ion exchangers) or are attached to it (electronic or magnetic descalers)
Substitute / defensive expenditure in relation to water hardness
Water hardness
General preferences Avoided damage to water using appliances Reduced requirement for detergents in cleaning processes
Aggregate level – market sales data Household / business level – survey of consumption and expenditure
Purchase of limescale cleaners [H & B]
Variety of chemical cleaners for water using appliances (kettles, washing machines, dishwashers), taps, showerheads, pipes, and stained baths/sinks etc.
Substitute / defensive expenditure in relation to water hardness
Water hardness General preferences Avoided damage to water using appliances
Aggregate level – data provided by sources such as InfoScan Reviews, Nielsen, Dunnhumby, Kantar World Panel, Tesco Club Card Household / business level – survey of consumption and expenditure

Ofwat The Use of Revealed Customer Behaviour in Future Price Limits Final
Cascade Consulting in association with eftec 24
Customer behaviour Market good RP relationship WS, WWS and/or
ES Other demand factors
Data sources
Replacement of water using appliances [H & B]
Washing machine, dishwasher - differentiated products (many brands, specifications, etc.)
Substitute / defensive expenditure / damage cost in relation to water hardness
Water hardness General preferences - brand, image, etc.
Aggregate level – data provided by sources such as InfoScan Reviews, Nielsen, Dunnhumby, Kantar World Panel, Tesco Club Card Household / business level – survey of expenditure
Storage of water [B]
Water as an input to production processes (manufacturing, agriculture, sports facilities, etc.).
Substitute / defensive expenditure in relation to interruptions to supply
Planned/unplanned interruptions to supply Security of supply
Health and safety regulations
Business level – survey of mitigation measures for service failures and expenditure Water companies key accounts
Purchase of water pump [H & B]
Booster pumps (including power shower fittings) that increase mains water pressure where existing supply is insufficient.
Substitute / defensive expenditure for mains water pressure
Low pressure General preferences Avoided damage to water using appliances
Aggregate level – market sales data Household / business level – survey of expenditure
Ofwat The Use of Revealed Customer Behaviour in Future Price Limits Final
Cascade Consulting in association with eftec 25
Customer behaviour Market good RP relationship WS, WWS and/or
ES Other demand factors
Data sources
Purchase of more efficient water appliances [H & B]
Washing machine, dishwasher - differentiated products (many brands, specifications, etc.)
Water efficiency is an attribute of water using appliances
Water conservation - environmental/sustainability motives
General preferences - brand, image, etc. Meter customers – household/business budget Energy efficiency (likely to be complementary to water efficiency)
Aggregate level – data provided by sources such as InfoScan Reviews, Nielsen, Dunnhumby, Kantar World Panel, Tesco Club Card Household / business level – survey of expenditure
Replacement of lead supply pipe to properties [H & B]
Resource costs associated with replacement of pipe (material, labour, etc.)
Substitute / defensive expenditure for removal of lead pipes
Health concerns n/a Household / business level – survey of expenditure
Actual expenditure on water supply connection repairs [H & B]
Resource costs associated with repair (material, labour, etc.)
Substitute / mitigation cost for unplanned interruptions to supply (for connection that is responsibility of household/business)
Unplanned interruptions to supply
n/a Household / business level – survey of expenditure
Actual expenditure on drainage repairs [H & B]
Resource costs associated with repair (material, labour, etc.)
Substitute / mitigation cost for private sewer maintenance
Private sewer adoption n/a Household / business level – survey of expenditure
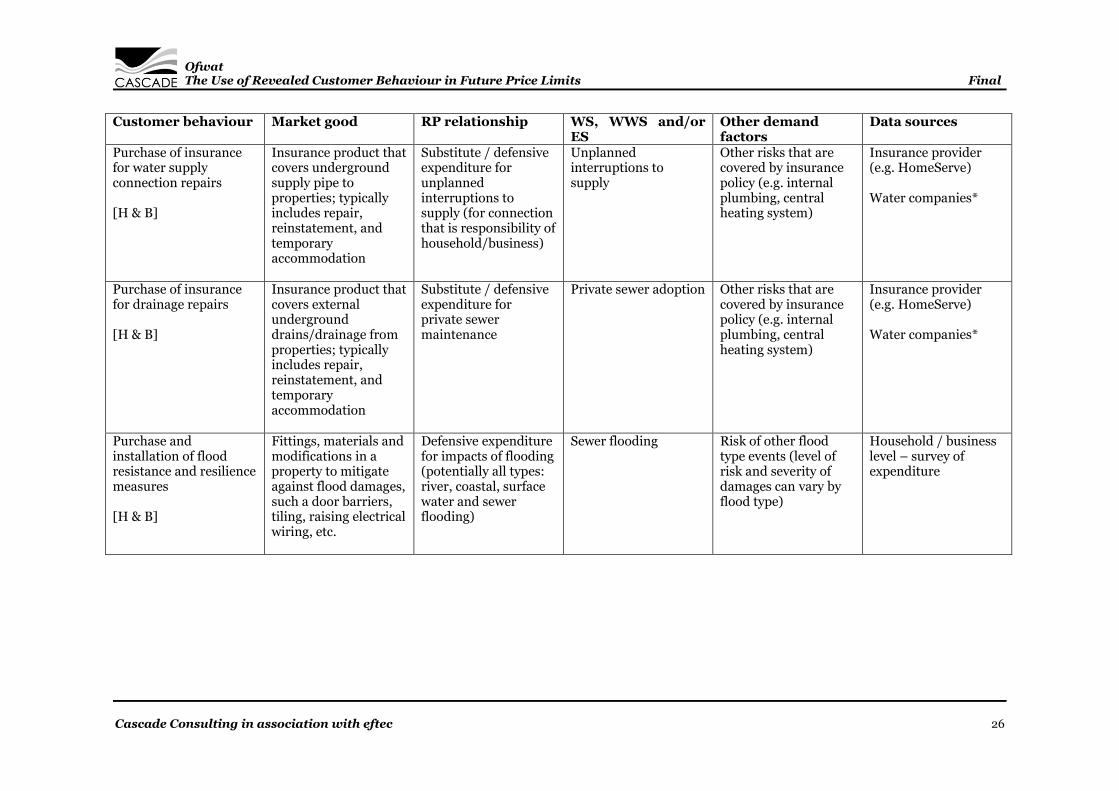
Ofwat The Use of Revealed Customer Behaviour in Future Price Limits Final
Cascade Consulting in association with eftec 26
Customer behaviour Market good RP relationship WS, WWS and/or
ES Other demand factors
Data sources
Purchase of insurance for water supply connection repairs [H & B]
Insurance product that covers underground supply pipe to properties; typically includes repair, reinstatement, and temporary accommodation
Substitute / defensive expenditure for unplanned interruptions to supply (for connection that is responsibility of household/business)
Unplanned interruptions to supply
Other risks that are covered by insurance policy (e.g. internal plumbing, central heating system)
Insurance provider (e.g. HomeServe) Water companies*
Purchase of insurance for drainage repairs [H & B]
Insurance product that covers external underground drains/drainage from properties; typically includes repair, reinstatement, and temporary accommodation
Substitute / defensive expenditure for private sewer maintenance
Private sewer adoption Other risks that are covered by insurance policy (e.g. internal plumbing, central heating system)
Insurance provider (e.g. HomeServe) Water companies*
Purchase and installation of flood resistance and resilience measures [H & B]
Fittings, materials and modifications in a property to mitigate against flood damages, such a door barriers, tiling, raising electrical wiring, etc.
Defensive expenditure for impacts of flooding (potentially all types: river, coastal, surface water and sewer flooding)
Sewer flooding Risk of other flood type events (level of risk and severity of damages can vary by flood type)
Household / business level – survey of expenditure

Ofwat The Use of Revealed Customer Behaviour in Future Price Limits Final
Cascade Consulting in association with eftec 27
Customer behaviour Market good RP relationship WS, WWS and/or ES
Other demand factors
Data sources
Purchase of property/land [H & B]
House, flats, commercial property, land
Various WS, WWS and ES are potential attributes of property/land
Water availability (agriculture/ commercial uses) Security of supply Environmental quality/amenity including river/bathing water quality Odour, nuisance, etc. from treatment works and/or other installations
Various factors, e.g. type of property and physical characteristics, neighbourhood features (schools, transport links, crime) and other environmental factors (e.g. green space)
Land Registry data for house prices and characteristics plus various other sources for environmental and neighbourhood data
Visits to a water-related recreation site (e.g. river, lake, reservoir, canal, beach) [H]
Travel costs: fares, petrol, vehicle depreciation, insurance. Recreation equipment costs (e.g. hire/purchase) Opportunity cost of time (proportion of wage rate)
Complement relationship between visits to a specific water-related recreation site and travel and time costs
Environmental quality/amenity including river/bathing water quality
General preferences Availability of substitutes Proximity to site
Visitor/household survey data plus other sources for costs

Ofwat The Use of Revealed Customer Behaviour in Future Price Limits Final
Cascade Consulting in association with eftec 28
Customer behaviour Market good RP relationship WS, WWS and/or ES
Other demand factors
Data sources
Choice of site for water-related recreation [H]
Travel costs: fares, petrol, vehicle depreciation, insurance Recreation equipment costs (e.g. hire/purchase) Opportunity cost of time (proportion of wage rate)
Environmental quality/amenity including river/bathing water quality is an attribute recreation site quality
Environmental quality/amenity including river/bathing water quality
General preferences Other site quality and environmental characteristics (e.g. facilities) Availability and quality of substitute sites Proximity to sites
Visitor/household survey data plus other sources for costs (e.g. fuel costs)
Water conservation actions [H & B]
Potentially a range of actions related to dev ices such as water butts, cistern devices, more efficient appliances/taps/shower heads, water recycling, etc.
Substitute / defensive expenditures for security of supply risks
Security of supply Water conservation - environmental/sustainability motives
General preferences Aggregate level – potentially data provided by sources such as InfoScan Reviews, Nielsen, Dunnhumby, Kantar World Panel, Tesco Club Card Household / business level – survey of consumption and expenditure Water companies – water audits; provision of devices to customers

Ofwat The Use of Revealed Customer Behaviour in Future Price Limits Final
Cascade Consulting in association with eftec 29
Customer behaviour Market good RP relationship WS, WWS and/or ES
Other demand factors
Data sources
Treatment of effluent [B]
On-site (partial) treatment of effluent discharges by non-household wastewater customers
Substitute / defensive expenditure for pollution incidents and/or environmental quality
Pollution incidents Environmental quality/amenity including river/bathing water quality
Regulatory compliance Business costs
Business level – survey of mitigation measures and expenditure Potentially key account information held by water companies
Complaints to water companies [H & B]
Potentially opportunity cost of time associated with written or telephone complaints (proportion of wage rate)
Potentially captures impact of service failures where customers behaviour does not involve any or little avertive behaviour
Taste, smell, appearance concerns of tap water Planned / unplanned interruptions to supply Low pressure Water hardness Odour, nuisance and other disamenity from treatment works and/or other installations Customer service/contact
Water companies complaints data

Ofwat The Use of Revealed Customer Behaviour in Future Price Limits Final
Cascade Consulting in association with eftec 30
Customer behaviour Market good RP relationship WS, WWS and/or ES
Other demand factors
Data sources
Membership of environmental organisations [H]
Subscriptions paid to organisations Value of volunteer time – opportunity cost of time (proportion of wage rate)
Potentially a proxy for pollution incidents and/or environmental quality but it is not clear that weak complementarity exists
Pollution incidents Environmental quality/amenity including river/bathing water quality Water conservation - environmental/sustainability motives
General preferences – image Altruism
Membership lists of national, regional and local organisations
Charitable donations/legacies to environmental charities [H & B]
Potentially a proxy for pollution incidents and/or environmental quality but it is not clear that weak complementarity exists
Environmental quality/amenity including river/bathing water quality Water conservation - environmental/sustainability motives
General preferences Altruism
Financial accounts of national, regional and local charitable organisations
Notes: H = household customers; B = business customers; WS = water services; WWS = wastewater services; ES = environmental services. n/a = unlikely to be
any other factors that determine demand.
* Data availability may vary between companies – a number have partnerships with insurance companies for services provided.

Ofwat The Use of Revealed Customer Behaviour in Future Price Limits Final
Cascade Consulting in association with eftec 31
3.2 ASSESSING POTENTIAL USE OF REVEALED CUSTOMER BEHAVIOUR
Table 3.1 identifies the potential revealed customer behaviour information that could
be analysed to input to investment planning across the range of water, wastewater
and environmental services. In this section the opportunities and constraints
associated with the use of this information and associated revealed preference
methodologies are assessed.
Key considerations for the assessment include:
Coverage of values: as highlighted in Section 2.6, revealed preference
methods provide estimates of use values only. For some service attributes,
particularly in relation to environmental services, indirect use values and non-use
values may be a significant component of the benefits of improved levels of
service. Where these elements of total economic value are expected to be
significant, then SP methods should be applied to estimate them.
Data availability: data availability is a fundamental issue for RP methods.
While it is relatively easy to identify a market good – non-market good
relationship, collection and analysis of data to examine this relationship could be
prohibitive. Necessary data in a number of instances are not held by companies,
could be fragmented between various sources or not exist at all. This is a
substantial barrier to compiling robust datasets that are required for RP analyses.
Implementation and analysis requirements: robust application of RP
methods requires sophisticated technical analysis and expertise. There may also
be significant costs for the purchase of data held by third parties (i.e. market sales
and volumes data). The likely timescale for the data collection and analysis also
needs to be considered. The effort and cost of any valuation effort should be
weighed against the scale of investment costs (and potential benefits) of the
relevant service area.
Transferability of results: implementation of RP methods may not be limited
to the company level. In some cases collaborative research may be effective,
helping to ensure consistency of approach across companies, or to develop results
that are suitable for value transfer.
A further consideration is the overall valuation framework that companies need to
develop to build an evidence base for CBA. Ultimately there is a risk of double-
counting of benefits for changes in service levels that are derived separately from
several different methodological approaches (i.e. RP, SP and value transfer) and then
Ofwat The Use of Revealed Customer Behaviour in Future Price Limits Final
Cascade Consulting in association with eftec 32
combined in CBA. In addition, the ever-present ‗package issue‘26 also requires
consideration in relation to the overall benefits valuation framework developed by
companies. These points emphasise the need for a robust valuation framework to be
developed by companies to aid the use of CBA in investment planning. This is a key
recommendation in UKWIR (2010).
The following discusses opportunities and constraints for RP methods in relation to
water, wastewater and environmental services. There is though some overlap
between these areas for specific service attributes. The section concludes with overall
remarks that are relevant to all three service areas and the more general role of
revealed customer behaviour.
3.2.1 Water services
In relation to water services, the assessment of opportunities focuses on the potential
role for an avertive behaviour approach.
Opportunities
Table 3.1 suggests that there are a number of opportunities in relation to avertive
behaviour and substitute relationships that are a response to service failures
experienced by households. In particular potential defensive expenditure actions can
be identified for: aesthetic water quality; perceived health risks; water hardness; and
low pressure. In general companies do not collect data from customers in this regard
– most regular tracking surveys and responses to customer contacts focus on
perceptions and ‗customer experience‘ rather than changes in behaviour that result
from service failures.
Recent evidence concerned with the acceptability of drinking water suggests that a
significant proportion of households could be using a water filter, softener or
purchase bottled water in response to aesthetic quality issues (UKWIR, 2008b)27. A
household level survey could be employed by companies to examine in more detail
the significance of these types of avertive behaviour. Such a survey could be focussed
on a specific service failure, or much broader to also capture aspects such as
insurance products, actual repairs and water conservation actions. An advantage of a
household level survey is that motivations for behaviours can be elicited; this would
help control for potential confounding factors that could also be significant
26
This refers to the issue of ‘package effects’ in valuation where the value of the components of an investment
programme (e.g. improvements in service to a range of attributes) is often found to be lower if they are valued in
combination and simultaneously compared to the case if the components are valued separately or individually
and added together later (see UKWIR, 2010). 27
Specifically UKWIR (2008b) states that 55% of sampled respondents (n = 554) reported the use of a water
filter, softener, or purchase of bottled water, with 54% (n = 297) of these doing so for reasons related to the
aesthetic quality of tap water.

Ofwat The Use of Revealed Customer Behaviour in Future Price Limits Final
Cascade Consulting in association with eftec 33
determinants of demand. Box 3.1 sets out a number of considerations with respect
to the application of an avertive behaviour approach in this context.
Box 3.1 Valuing reductions in water hardness via avertive behaviour
Cost-benefit analysis (CBA) of measures to address the hardness of tap water requires
estimates of the costs of those measures and their benefits. As indicated in Table 3.1, avertive
behaviour may be observed from customers via their purchases of ‗substitute goods‘ such as
softeners, filters, cleaning products and replacement of appliances as a result of water
hardness.
On the basis that ‗avoided costs‘ represent a benefit in CBA (see UKWIR, 2010) and following
the discussion in Section 2.2 and 3.2.1, these expenditures can be analysed to provide a lower
bound estimate of WTP for reducing water hardness. For example, where the impact on
customers is measured in terms of ‗properties affected per year‘ (ICS Consulting, 2011) this
implies that aggregate benefit of a water company measure that reduces water hardness can
be estimated as:
WTP per household per year to avoid water hardness
× reduction in properties affected per year
This result could be used as a validity check on values derived from a SP approach. In addition
because of the ‗lower bound‘ nature of the estimation, it could be applied as a conservative
benefit estimate in CBA sensitivity testing.
Importantly analysis undertaken to estimate WTP needs to establish the extent to which
avertive behaviours are attributed to the service failure. For example:
Whether avertive behaviours are a combined response to wider tap water aesthetics and
potential service failures in relation to taste, smell and discolouration as well as hardness;
it may be difficult to estimate values for hardness impacts (or other attributes) in
isolation.
Whether avertive behaviours are a response (or partly a response) to perceived health
risks, a potentially confounding factor (e.g. customers‘ perceptions of risk versus the
‗objective‘ / actual risk).
The importance of preferences concerning water temperature (e.g. bottled/filtered water
that is refrigerated); this is not a reaction to a service failure.
The importance of other factors in determining demand for expenditure on ‗substitute
goods‘; e.g. various image, brand, status and lifestyle factors.
The time frame for responses to service failures; i.e. short term and long term behaviours.
Consequently implementation of an avertive behaviour approach in this context requires
careful design and testing. This is needed to ensure that the analysis is able to control for the
various factors that influence the demand for substitute goods to enable estimation of robust
values for the service attribute of interest.
Ofwat The Use of Revealed Customer Behaviour in Future Price Limits Final
Cascade Consulting in association with eftec 34
As an alternative, aggregate level data28 could also be utilised, drawing on sales data
for substitute goods at the company, region or national level. This would be a more
ambitious and technically involved analysis. The ideal approach would be to link geo-
referenced asset planning data on service failures to postcode data for purchases of
substitute products, along with standard socio-economic and demographic data that
can be obtained at this spatial level. The advantage over the household survey is that
aggregate data are based on recorded sales rather than customer recollection and
reporting. However detail on motivations of households for purchases is unlikely to
be available in aggregate, suggesting that challenges would be faced in establishing
the extent to which observed behaviours can be attributed to impacts of service
failures.
Business customers‘ responses to service failures may be more diverse than
household customers, reflecting the heterogeneous nature of this aspect of
companies‘ customer bases. For customers with supply requirements equivalent to
domestic needs (i.e. tap water, heating), a survey approach would also appear to be
feasible, since the options for avertive behaviours should be the same. While
company accounts would to some extent record relevant expenditure, information
about motivations for avertive behaviour can be sought via a survey29.
For manufacturing customers where the quality and/or quantity of water is a
significant input to production, avertive behaviours may be more varied and more
substantial in scale. It may still be possible to use a survey to identify mitigation
measures these operators have in place, particularly in relation to interruptions to
supply. Water companies may also have knowledge of these measures for large users
and key accounts or through drought planning.
Constraints
The main limitations in relation to applying avertive behaviour approaches to water
services include:
Coverage of values: as noted in Section 2.2, economic values estimated from
avertive behaviour models provide lower bound estimates of WTP. Moreover the
method does not capture non-use values that may be associated with changes in
service levels (i.e. WTP to avoid other customers experiencing service failures, in
relation to localised health impacts). At first glance, this may suggest that the role
of such analysis may be to provide a validity test for SP valuations obtained via a
28
An aggregate level approach would use data on market shares for substitute products. This in contrast to the
household / business level approach which is discussed above that would examine individual choices concerning
substitutes (which could be termed as a ‘disaggregate approach’). 29
For instance surveys of businesses and households supported analysis of the impact of security of supply
failures in Yorkshire in 1995 (Ofwat 1996; 1997).

Ofwat The Use of Revealed Customer Behaviour in Future Price Limits Final
Cascade Consulting in association with eftec 35
‗PR09 style‘ study. Such a comparison would also be an empirical test of the
potential significance of non-use values in driving SP valuations of improvements
in service30.
In addition, Schram et al. (2010) demonstrate how avertive behaviour analysis
can be undertaken such that WTP can be estimated for improvements in service
levels that match perceived quality of substitutes (e.g. bottled or filtered water).
This offers a way in which companies can potentially quantify ‗peace of mind‘
around challenging issues such as the perceived health risk of tap water.
Alternatively a survey-based approach to avertive behaviour could be combined
with either contingent behaviour (i.e. how would your behaviour change if service
levels improved) or contingent valuation questions which would provide
information on the value of improved levels of service.
Data availability: since there is an opportunity to use household level surveys to
examine avertive behaviour in relation to service failures, data availability should
not be a concern, provided the surveys are appropriately designed and
implemented. Business customers may represent more of a challenge, with the
ever-present issue of identifying the appropriate contact point, along with
potential confidentiality issues concerning the disclosure of cost information.
However, if respondents are willing to participate, it should be easier for them to
report what actions they take or measures they have in place in relation to service
failures (i.e. their actual avertive behaviour), rather than having to consider the
potential implications of hypothetical scenarios concerning service failures.
The alternative of taking an aggregate level approach – using regional or national
sales data for substitute goods – would likely require significant data purchase
and compilation costs and effort.
Implementation and analysis: a fundamental requirement of any avertive
behaviour analysis is to ensure that potentially confounding factors are
adequately controlled for; i.e. other drivers of demand for substitute goods. For a
survey-based approach an objective of the initial testing and piloting would be to
ensure that all of these factors are identified. Also the survey exercise should not
be to simply collect information on purchases of substitutes, but also to produce a
dataset that enables (econometric) avertive behaviour models to be estimated so
that importance of different aspects of service failures and other determinants of
demand can be established. This analysis will provide a much more robust basis
30
This would by no means be a ‘perfect test’, but comparing valuations derived from avertive behaviour models
to choice experiments would be a highly useful exercise given much debate witnessed during PR09 as to the
validity of SP methods. Conceivably WTP, for improvements in say the aesthetic quality of tap water, should
not really be much greater than the costs of purchasing substitutes, unless there is a significant non-use
component in valuations captured by SP methods.

Ofwat The Use of Revealed Customer Behaviour in Future Price Limits Final
Cascade Consulting in association with eftec 36
for interpretation of results.
Transferability of results: in practice the transferability of results will depend on
the nature of the exercise that is undertaken. The first step for using an avertive
behaviour approach could be exploratory research with the aim of establishing
the likely significance of such behaviours based on a nationally representative
study. This could be in relation to either a household/business level approach or
aggregate level approach. The results from this analysis would inform on whether
region or company specific studies are necessary. In particular companies could
use household level surveys to targeted specific sub-populations within a region,
such as those that experience particular service failures more often, along with
those who experience it less often. Such targeting could be based on complaints
data. Valuations generated by this approach would allow for a much richer
assessment of aggregate benefits in CBA than simply assuming a constant unit
value across all customers.
3.2.2 Wastewater services
The avertive behaviour approach also has some potential for wastewater services and
this is considered briefly below. However the main focus of the assessment is the
application of a hedonic property pricing approach (HPP) and disamenity impacts
from wastewater services.
Opportunities
An avertive behaviour approach could also potentially identify actions that are
relevant to some wastewater services (e.g. purchase of insurance, drainage repair
costs). For example an estimate of the avoided cost associated with the maintenance
of drains by private owners and local authorities (approximately £150 – 200 million
per year) was used as a benefit estimate in the impact assessment of the transfer of
private sewers to companies (Defra, 2010). This estimate was based on consultation
with the insurance industry. Therefore in determining the scope for using an avertive
behaviour approach, companies could also consider relevant aspects of wastewater
services in addition to water services.
With respect to opportunities for applying HPP, there is a strong conceptual appeal in
its use if disamenity impacts associated with wastewater services – such as odour and
nuisance from treatment works – are well perceived by households. This is a key
condition and previous assessments suggest that sewer flooding risks are unlikely to
be apparent to prospective house buyers (eftec, 2006), particularly since this risk is
Ofwat The Use of Revealed Customer Behaviour in Future Price Limits Final
Cascade Consulting in association with eftec 37
not identified in the standard environmental search that buyers undertake31.
Odour and other nuisance impacts from treatment works can be intermittent in
nature and are also dependent on factors such as prevailing wind direction and
intervening screening, hence they are recorded as ‗incidents‘ rather than a continuous
disamenity. However it seems plausible that house buyers will at least be aware of the
presence of treatment works, and even if they do not have a full appreciation of the
odour impact, it is likely that their purchasing decisions will be influenced. Coupled
with this, data should be available from companies‘ monitoring and modelling of
odour (e.g. odour contours), along with proximity of treatment works to residential
areas32.
Overall there is a large literature that values the effect on property values of the
proximity to noxious facilities (in particular landfills and incinerators) and this
produces consistent results. In the water sector, there are fewer studies and the
previous UKWIR (2008a) study encountered various challenges. Wider empirical
exercises demonstrate the richness of results that can be derived from a rigorously
implemented HPP study (e.g. Day et al., 2007; Gibbons et al., 2011). The lesson from
these studies is the need for large and good quality datasets that utilise geographic
information systems (GIS). Gibbons et al.‘s analysis in relation to environmental
amenity values is perhaps an extreme example, since it is based on approximately 1
million housing transactions in the UK over the period 1996 – 2008, but it does serve
to highlight that collating as many data observations as possible is of key importance
to any practical application. Use of GIS is particularly fundamental so that property
location and proximity to local services and environmental amenities can be
controlled for, along with proximity to treatment works.
There are also HPP studies that have been used to examine the impact of
environmental water quality on property prices, as well as the effect of water use
restrictions on local environmental amenity33. If relevant and sufficient (time series)
data can be compiled on aspects such as odour, environmental quality, water use
restrictions, and other necessary data (property sales prices, property characteristics,
31
Fluvial and coastal flooding risk is reported in the environmental search. If a property is recorded on the DG5
register (at risk of flooding due to inadequate sewer capacity) it should be reported in a residential drainage and
water search; however the DG5 register does not include all properties that are at risk of sewer flooding. There
is of course also an asymmetry of information between house sellers and buyers, with the former likely to be,
but not always, aware of the sewer flooding risk, particularly if experienced directly. This could be reflected in
their willingness to accept a lower selling price (all else equal). 32
An important point is that the disamenity to be valued is related to the level of odour rather than the proximity
to treatment works (unless the investment context was concerned with the construction of new facilities). Hence
proximity may be considered as proxy for the disamenity from odour but it is invariant to abatement actions
undertaken by companies and so would not provide an indication of the benefits of these investments. 33
A further issue that could be explored via hedonic pricing, but has not been addressed in the literature, is the
presence of lead connection pipes for some properties. This may be revealed in a residential and drainage search
depending on information supplied by water companies.

Ofwat The Use of Revealed Customer Behaviour in Future Price Limits Final
Cascade Consulting in association with eftec 38
local services, other elements of local environmental amenity) and if individuals are
aware of the environmental amenity factors being valued, then HPP can be used.
Constraints
Limitations in relation to applying an HPP approach to disamenity impacts of service
failure include:
Coverage of values: an HPP approach will not capture non-use values associated
with service failures, nor use/non-use values associated with the wider customer
base; for example where odour affects a major arterial road, place of work or
commercial retail area. In this regard empirical evidence is limited as to the
significance of these use and non-use motivations in households‘ valuations.
Results from PR09 SP studies could feasibly be strongly driven by these factors,
particularly in situations where only a relatively small proportion of household
customers are close enough to treatment works to be directly impacted.
Comparative analysis with results from a well-designed HPP study could help
reconcile valuations from SP studies, if this was determined to be a significant
issue.
Another point to note is that business customer valuations would not be captured
by an HPP study which deals with residential sales data34.
Data availability: even when relevant data for HPP exist, the effort, time and cost
required to compile such data for further analyses should not be underestimated.
With the exception of monitoring data on odour, all other data would need to be
purchased from third-party sources. However it may be possible to extend the
dataset collated by Gibbons et al., (2011) to include location of treatment works
and odour levels35. If feasible this would represent a significant opportunity to
develop an HPP approach.
In relation to other service attributes, water quality data would be available to
companies based on the Environment Agency monitoring.
Implementation and analysis: a well-designed and implemented HPP study
would be an ambitious undertaking, requiring considerable input and technical
expertise from leading practitioners. In practice any proposed application would
benefit immensely from an initial scoping study that would explore in more detail
34
Analysis could be undertaken on commercial property sales and lettings with respect to business customers
but this would likely be an ambitious undertaking. 35
Pers. comm. S. Mourato (London School of Economics and Political Science), April 2011. In principle the
Gibbons et al. HPP dataset could be extended to include further environmental (dis)amenities, but such an
undertaking would require more detailed consideration of available odour and treatment works data, plus the
permissions that would be needed to extend the scope of the analysis.

Ofwat The Use of Revealed Customer Behaviour in Future Price Limits Final
Cascade Consulting in association with eftec 39
the key methodological issues around data and estimation. This in particular
would establish if the approach could be successfully implemented on a local
housing market basis, a regional basis, or even at the national level.
Transferability of results: the degree of transferability of results will depend very
much on the specific details of any analyses. Potentially though, ‗generalisable‘
results could be produced if an HPP study was appropriately designed.
3.2.3 Environmental services
Here the assessment focuses on the analysis of household demand for recreation and
how water-environment quality improvements could be valued.
Opportunities
The principle context for valuing water-environment quality is the continued
implementation of the Water Framework Directive. To date valuation effort has
focused on the use of SP methods, via companies‘ PR09 studies and the ‗national
benefits assessment‘, which is reported in Nera (2007). However, discrete choice
models (DCM) are increasingly used to analyse households‘ demand for recreation
sites such as open access rivers, lakes, reservoirs – which is ably demonstrated by the
ChREAM and Iowa Lakes Valuation projects – or for specific user populations such
as anglers. Therefore the DCM approach needs further serious consideration in
relation to its potential role in further valuation efforts.
Bateman et al. (2010) particularly emphasise the need for studies valuing
improvements in water quality to control for scope of environmental improvements,
the availability and quality of substitute sites, spatial variation in household socio-
economic characteristics, their proximity and access to recreation sites. All of these
elements can be accounted for within the DCM approach, particularly when
combined with GIS. The framework for the analysis also provides the basis for
estimating transferable WTP values and functions, which widen the scope for using
results.
Implementation requires a household survey to collate visit data, along with attitudes
towards water quality issues, travel costs to sites visited and socio-economic
characteristics. In addition the GIS element can utilise spatially-referenced national
datasets for household socio-economic characteristics at post-code level, and can also
be used to calculate travel costs and times for all substitute sites (Bateman et al.,
2003). Measures of physical water quality can be sourced from Environment Agency
monitoring.
In practice the survey and analysis could be undertaken at a company level; i.e.

Ofwat The Use of Revealed Customer Behaviour in Future Price Limits Final
Cascade Consulting in association with eftec 40
identifying the main recreation sites and access points for water bodies within a
region or catchment. Collecting visit data over a prolonged period of time would also
enhance the dataset, as water quality would be observed to vary within sites as well as
between sites. Alternatively a national level study could be implemented such that
enough representative sites across the country were identified and surrounding
populations surveyed such that ‗generalisable‘ results could be estimated.
A further point is that a DCM could be combined with contingent behaviour or other
SP approaches to generate wider economic value evidence; i.e. estimating the benefit
of the highest environmental quality possible either by asking how visit behaviour
would change, or what households would be willing to pay to attain those levels.
Constraints
The proposed opportunity for the DCM approach presents a number of potential
limitations:
Coverage of values: DCM approach does not capture non-use values. However it
is arguable that in the first instance a fuller understanding of use values
associated with the water environment (e.g. recreation benefits) is essential to
support continued WFD implementation. For example if the case for
improvements in water bodies can be justified on the basis of robustly estimated
use values alone, then non-use arguments will serve to reinforce the cases for
proposed programmes of measures. If use values cannot justify improvements
(i.e. costs of measures outweigh benefits), then much stronger scrutiny will be
needed on the validity and application of estimates derived from SP studies that
also capture non-use, because of ‗burden of proof‘ considerations.
Data availability: overall, the availability of data should not be a significant
concern for the application of DCM. The ChREAM study demonstrates how the
framework for the analysis can be drawn together, combining household survey
data, with water quality monitoring data and GIS inputs. However, that is not to
say that significant effort would not be required to ensure that the study is well
designed and formulated.
Implementation and analysis: application of the DCM, including the data and
analysis requirements (e.g. using GIS) would be a ‗step-up‘ for companies
compared to experiences at PR09. Practical implementation will require the
necessary technical skills and expertise to deliver what can be considered to be
‗state-of-the-art‘ valuation analysis. As with the potential for applying the HPP
approach, any proposed applications of DCM would benefit from a scoping study
to establish the precise aims and objectives for the work, particularly given the
number of stakeholders engaged in the WFD implementation process.

Ofwat The Use of Revealed Customer Behaviour in Future Price Limits Final
Cascade Consulting in association with eftec 41
Transferability: given that DCM can be designed explicitly to provide
transferable results, this is not a limitation here but a further opportunity.
3.2.4 Further remarks
Sections 3.2.1 – 3.2.3 focus on the main opportunities for applying RP methods to
value changes in the provision of water, wastewater and environmental services. The
main findings are summarised in Table 3.2. Significantly, in most instances
companies can make use of customer surveys to generate data. As noted above, this
has the drawback in some cases of being based on customer reporting (e.g. avertive
behaviour), rather than objective data sets (e.g. market sales data). However, this
essentially is the compromise that is required for easier implementation (both in data
collection effort and cost).
Table 3.2: Summary of scope for use of revealed preference methods
Service attribute Method(s) Data Water services Drinking water aesthetics (taste, odour, appearance)
Avertive behaviour model Household survey Business survey
Drinking water health risks Avertive behaviour model Household survey Business survey
Water hardness Avertive behaviour model Household survey Business survey
Interruptions to supply Avertive behaviour model
Business survey
Security of supply Avertive behaviour model
Business survey
Low pressure Avertive behaviour model Household survey Business survey
Wastewater services Odour, disamenity from wastewater treatment
Hedonic property pricing Residential property sales, characteristics etc., GIS
Sewer flooding Avertive behaviour model / defensive expenditure
Household survey Business survey
Private sewer maintenance /adoption
Avertive behaviour model Household survey Business survey
Environmental services River water quality / flow levels (recreation benefits)
Discrete choice model Household survey, env. quality data, GIS data
Bathing water quality Discrete choice model
Household survey, env. quality data, GIS data
There are also wider opportunities to use revealed customer behaviour data to
improve the evidence base for investment planning. For example:
Customer complaints data: it is essential that any business case put forward for
an investment is justified on all available data. Complaints data are companies‘
primary metric for establishing the significance – in terms of impact on
customers - of many service failures, and as such provide the initial ‗sense check‘

Ofwat The Use of Revealed Customer Behaviour in Future Price Limits Final
Cascade Consulting in association with eftec 42
for results that are estimated from both RP and SP studies; i.e. can the unit and
aggregate benefit estimates be reconciled with the observed number of
complaints, their frequency and distribution across the customer base.
Interpretation of quantitative and monetary evidence in this context also allows
richer qualitative arguments to be put forward to support investment proposal.
‗Valuing’ customer complaints: some service failures may not be significant
enough (in magnitude or frequency) for customers to undertake avertive
behaviours and incur expenditures on substitute goods. However it still can be
inferred that some disamenity is experienced, particularly if customers contact
companies to complain. A proxy value for this disamenity could be estimated by
attributing a monetary value to a complaint that a company receives from either a
business or household customer. In fact Atkinson et al. (2004) consider different
measures of inconvenience in terms of writing letters of complaint, signing
petitions, contacting MPs, and coordinating protest; all of which can be valued in
monetary terms provided assumptions are made as to the time expended on each
action (e.g. 5-10 minutes for a telephone call) and the value of time (e.g. average
wage rate for business contacts).
Visitor survey data: a number of companies manage large open access recreation
sites such as reservoirs. Here there are opportunities to collate data on visitor
numbers, frequency of visits and activities to establish supporting arguments for
the importance of maintaining or improving access to these sites (e.g. in relation
to the CROW act) for local populations. Opportunities could also exist for using
smaller scale travel cost (ITCM), trip-generating functions, and DCM surveys to
examine specific issues.
Wider customer surveys: companies‘ current customer tracking surveys and
other initiatives focus on perceptions of services and customer experience.
Considering the range of behaviours listed in Table 3.1, there are also
opportunities to assess how these types of surveys could be used to generate
wider quantitative data on aspects such as water conservation actions,
recreational visits, and membership of environmental organisations. These could
also seek to elicit information on responses to service failures, such as complaints
or avertive behaviours. This could provide a basis for establishing the need for
further analysis for specific service attributes.

Ofwat The Use of Revealed Customer Behaviour in Future Price Limits Final
Cascade Consulting in association with eftec 43
4 RECOMMENDATIONS FOR FUTURE USE
The following concludes by presenting recommendations for the use of revealed
customer behaviour to assess customer priorities, for the purposes of CBA,
investment planning and development of business plans:
1. Business cases should be supported by a range of quantitative and
economic value evidence
Given certain practical considerations for developing a coherent basis for benefits
valuation, SP methods are likely to continue to be the principal approach to
valuation for companies developing CBAs for investment proposals. However
there is significant scope for data on revealed customer behaviour to provide a
robust validity test for benefit estimates. Moreover in some cases RP methods
may represent the ‗preferred‘ approach; e.g. recreation benefits associated with
water quality improvements.
Added to this, wider revealed customer behaviour evidence could be used as a
sense-check on unit and aggregate values; e.g. comparing complaints data to the
magnitude of benefit estimates. This does not imply that there needs to be a
direct (or indeed any) relationship between behaviour data and valuations but
comparison itself will be a learning experience for companies and stakeholders.
Companies should review what data are collected (e.g. through customer
contacts) and opportunities that exist for collating more data (e.g. by reviewing
the content of tracking surveys). The objective should be to ensure that business
cases can be supported by an appropriate and sufficient qualitative,
quantitative and valuation evidence base. These assessments should be
undertaken by companies as part of their work to establish a coherent
framework for benefits valuation and applying CBA.
2. Companies should consider the use of avertive behaviour surveys to
understand better the substitution and mitigation actions customers
take in response to service failures
There is a strong case for exploring further the potential for an avertive behaviour
approach. This represents a significant opportunity to compare RP and SP
valuations and provide an improved validity test of the latter.

Ofwat The Use of Revealed Customer Behaviour in Future Price Limits Final
Cascade Consulting in association with eftec 44
Companies may wish to develop this work individually or in collaboration.
Household and business surveys could be cost-effectively implemented via an
online survey. This represents a potential ‘quick win’ – particularly if
undertaken collaboratively – to advance understanding of avertive behaviours
of customers in relation to service failures. A minimum of three months should
be allowed for study design, implementation and analysis.
3. All stakeholders should review the approach to valuing
environmental quality improvements associated with implementation
of the Water Framework Directive
There is considerable merit in taking stock of recent methodological
developments in the use of RP methods and valuing environmental water quality,
particularly in terms of the application of discrete choice models. Studies such as
ChREAM and the Iowa Lakes Valuation Project demonstrate how observed
behaviour can provide an appealing analytical framework for establishing robust
economic value estimates, both in terms of unit values and aggregate benefits.
Results from both studies strongly suggest that simply assuming linear WTP from
improvements is inappropriate. This has significant implications for continued
WFD implementation, and a simple repeat and refinement of the ‗PR09
approach‘ is unlikely to result in valuation evidence that can inform decisions
particularly well in this regard.
A practical starting point for this recommendation would be a scoping study
including all stakeholders that establishes the precise requirements for
estimating the benefits of continued WFD implementation. An opportunity to
establish key issues for benefits valuation is provided by the current UKWIR
study ‘RG08 Water Framework Directive (WFD) - Disproportionate Costs’ (May
– December 2011).
4. Further scoping is required to establish the role for hedonic property
pricing in relation to valuing disamenity impacts associated with
service failures
There is considerable conceptual appeal in using hedonic pricing approaches to
value disamenity impacts arising from odour and nuisance from wastewater
treatment works, and potentially also the effect of water use restrictions and
water-environment quality. However empirical applications to date show that
successful studies require considerable time, resources, data and expertise.

Ofwat The Use of Revealed Customer Behaviour in Future Price Limits Final
Cascade Consulting in association with eftec 45
Ordinarily judgement is needed to establish if the ambition and effort required to
deliver a robust study is warranted; i.e. does the uncertainty that may be
associated with SP valuations justify this undertaking. However the potential to
extend the dataset and analysis presented in Gibbons et al. (2011) represents a
significant opportunity to offset much of the data collation effort.
Assessing the potential to develop the Gibbons et al. (2011) dataset is best suited
to a collaborative effort among companies, particularly since this represents a
national level data set with an opportunity to generate ‘transferable’ results. A
staged approach would be most appropriate, with an initial scoping stage
establishing the viability of the proposal by examining the necessary
methodological, data, practical and resource requirements (approximately 1 – 3
months). The actual implementation and analysis in Stage 2 (approximately 3 –
6 months) would be carried out based on the specification produced by Stage 1.
5. Opportunities to combine revealed preference and stated preference
approaches should be considered
The basis for valuing changes in service levels associated with water, wastewater
and environmental services should not be viewed as a choice of either RP or SP
methods. As UKWIR (2010) points out, companies need to develop a coherent
framework for valuing benefits of service improvements. This should account not
only for the ‗hierarchy of valuation methods‘ (market prices – revealed preference
– stated preference), but also the many practical considerations that have to be
weighed up. There are opportunities to apply joint RP and SP approaches. In
particular combining contingent behaviour questions with avertive behaviour
approaches provides a strong grounding in actual and experienced service levels
for SP values elicited from customers; likewise, applying contingent valuation
questions in this format is also appealing.
Companies should develop a coherent framework for benefits valuation and
CBA that utilise a range of valuation evidence, applying the most appropriate
method or combinations of methods. Particular emphasis should be placed on
the need for robust validity testing of valuation results.
Ofwat The Use of Revealed Customer Behaviour in Future Price Limits Final
Cascade Consulting in association with eftec 46
ACKNOWLEGEMENTS
We would like to thank the following individuals who have contributed to the report:
Martin Silcock and Darren Rice (both Anglian Water), Mike King (Bristol Water),
Tim Stephens (Cambridge Water), Chris Smith (Dee Valley Water), Crawford Winton
(Northumbrian Water), Hydreace Ali (Southern Water), Iain McGuffog (South West
Water), Janine White (United Utilities), Martin Edser (Welsh Water), Paul Chapman
(Yorkshire Water) and Thom Harle (Ofwat).
Leading academic experts who responded to our request for latest applications of
revealed preference methods: Prof. Vic Adamowicz (University of Alberta), Prof.
Peter Boxall (University of Alberta), Prof. Roy Brouwer (VU University Amsterdam),
Prof. Catherine Kling (Iowa State University), Prof. Sara Dolnicar (University of
Wollongong), Prof. Diane Dupont (Brock University, Ontario), Dr. Phoebe Koundouri
(Athens University of Economics and Business), Prof. John Rolfe (Central
Queensland University) and Prof. Robert Young (Colorado State University).
Thanks also to Dr. Brett Day (University of East Anglia), Prof. Ric Scarpa (University
of Waikato, New Zealand) and Dr. Rob Tinch (eftec and Environmental Futures Ltd)
for notes they have provided on revealed preference methods.
Finally thanks also to the input and comment from the peer reviewers: Prof. Ian
Bateman (University of East Anglia), Prof. Ken Willis (University of Newcastle upon
Tyne) and Dr. Scott Reid (ICS Consulting).
With apologies to any inadvertent omissions from the above. As ever, any errors are
the responsibility of the authors alone.

Ofwat The Use of Revealed Customer Behaviour in Future Price Limits Final
Cascade Consulting in association with eftec 47
REFERENCES
Abdalla, C.W., Roach, B.A., & Epp, D.J. (1992) ‗Valuing Environmental Quality Changes Using Averting Expenditures: An Application to Groundwater Contamination‘, Land Economics, 68, (2) 163-169
Abrahams, N.A., Hubbell, B.J., & Jordan, J.L. (2000) ‗Joint Production and Averting Expenditure Measures of Willingness to Pay: Do Water Expenditures Really Measure Avoidance Costs?‘ American Journal of Agricultural Economics, 82, (2) 427-437.
Adamowicz, W., Dupont, D., Krupnick, A., & Zhang, J. (2007) Valuation of Cancer and Microbial Disease Risk Reductions in Municipal Drinking Water, Washington DC.
Atkinson, G., Day, B., Mourato, S. and Palmer, C. (2004) 'Amenity' or 'eyesore'? Negative willingness to pay for options to replace electricity transmission towers‘, Applied Economic Letters, 11: 4, 203 — 208.
Ahtiainen, H. (2009) Valuing international marine resources: a meta analysis on the Baltic Sea, MTT Discussion Paper 1. MTT Economic Research, Helsinki.
Bartik, T. (1988) ‗Evaluating the benefits of no-marginal reductions in pollution using information on defensive expenditures‘, Journal of Environmental Economics and Management, 15(1): 111 – 127.
Bateman, I.J., Binner, A., Coombes, E., Day, B., Ferrini, S., Fezzi, C., Hutchins, M. and Posen, P. (2010) Integrated and spatially explicit modelling of the economic value of complex environmental change and its knock-on effects, mimeo.
Bateman, I.J., Day, B.H., and Lake, I. (2004) The Valuation of Transport-Related Noise in Birmingham, Non-Technical Report to Department for Transport.
Bateman, I.J., Lovett, A.A. and Brainard, J.S. (2003) Applied Environmental Economics, A GIS Approach to Cost-Benefit Analysis, Cambridge.
Bockstael, N.E. and McConnell, K. (2007) Environmental and Resource Valuation with Revealed Preferences, Springer.
Bockstael, N.E. and McConnell, K. (1999) The behavioural basis of non-market valuation, in Herriges, J. and Kling, C., Valuing Recreation and the Environment: Revealed Preference Methods in Theory and Practice, Edward Elgar.
Bockstael, N.E., Strand, I. and Hanemann, W.M. (1987) ‗Time and the Recreational Demand Model‘, American Journal of Agricultural Economics, 69(2): 293 – 302.
Boxall, P., Chan, W., & McMillan, M. (2005) ‗The impact of oil and natural gas facilities on rural residential property values: a spatial hedonic analysis‘, Resource and Energy Economics, 27, (3) 248-269.
Brennan, D., Tapsuwan, S., & Ingram, G. (2007) ‗The welfare costs of urban outdoor water restrictions‘, The Australian Journal of Agricultural and Resource Economics, 51, (3) 243-261.
Bruneau, J., Renzetti, S., & Villeneuve, M. (2010) ‗Manufacturing Firms' Demand for Water Recirculation‘, Canadian Journal of Agricultural Economics, 58, (4) 515-530.
Carson, R. T., Koundouri, P., & Nauges, C. (2009) Arsenic Mitigation in Bangladesh: A Household Labor Market Approach.

Ofwat The Use of Revealed Customer Behaviour in Future Price Limits Final
Cascade Consulting in association with eftec 48
Carson, R.T., Flores N.E., Martin K.M. and Wright J.L. (1996) ‗Contingent valuation and revealed preference methodologies: comparing estimates for quasi-public goods‘, Land Economics, 72(1): 80-99.
Christie M., Hanley N., Garrod B., Hyde T., Lyons N., Bergmann A. and Hynes, S. (2006) Valuing forest recreation activities, Report to the Forestry Commission.
Corrigan, J. R., Egan, K. J., & Downing, J. A. (2007) Aesthetic Values of Lakes and Rivers.
Courant, P.N and Porter, R. (1981) ‗Averting expenditure and the cost of Pollution‘, Journal of Environmental Economics and Management, vol. 8(4), 321-29.
Crandall, R. & Ellig, J. (1997) Economic deregulation and customer choice - lessons for the electric industry, The Center for Market Processes, Inc.
Day, B., Bateman, I.J. & Lake, I. (2007) ‗Beyond implicit prices: recovering theoretically consistent and transferable values for noise avoidance from a hedonic property price model‘, Environmental Resource Economics, vol. 37(1), 211-232.
Defra (2010) Impact Assessment of the transfer of private sewers and lateral drains to statutory water and sewerage companies, Department for Environment, Food and Rural Affairs (Defra), March 2010.
Defra (2003) A study to estimate the disamenity costs of landfills in Great Britain, Final Report by Cambridge Econometrics, eftec and WRC.
Dickie, M. (2003) Defensive expenditures and damage cost methods, in Champ, P., Boyle, K. and Brown, T., A Primer on Non-market Valuation, Kluwer.
Dolnicar, S. & Hurlimann, a. (2009) ‗Drinking water from alternative water sources: differences in beliefs, social norms and factors of perceived behavioural control across eight Australian locations‘, Water Science and Technology, 60, (6) 1433-1444.
Dolnicar, S. & Schäfer, A.I. (2009) ‗Desalinated versus recycled water: public perceptions and profiles of the accepters‘, Journal of Environmental Management, 90, (2) 888-900.
Dolnicar, S. (2010), "Desalinated Versus Recycled Water: What Does the Public Think ? Desalinated Versus Recycled Water: What Does the Public Think ?," In Sustainable Water for the Future: Water Recycling versus Desalination, I. Escobar & A. Schafer, eds., Elsevier.
Dupont, D. & Renzetti, S. (1998) ‗Water Use in the Canadian Food Processing Industry‘, Canadian Journal of Agricultural Economics, 46, (1) 83-92.
Dupont, D., Adamowicz, W.L.V., & Krupnick, A. (2009) ‗Differences in water consumption choices in Canada: the role of socio-demographics, experiences, and perceptions of health risks‘, Journal of Water and Health, 8, (4) 671-686.
Dupont, D.P. & Renzetti, S. (2001) ‗The Role of Water in Manufacturing‘, Environmental and Resource Economics, 411-432.
Dupont, D.P. (2005) ‗Tapping into Consumers' Perceptions of Drinking Water Quality in Canada: Capturing Customer Demand to Assist in Better Management of Water Resources‘, Canadian Water Resources Journal, 30, (1) 11-20.
eftec (2006) Developing Cost Benefit Analysis for Sewer Flooding, Report to Thames Water.
eftec (2008) Demand for Cars and their Attributes, Final Report to Department for Transport (DfT).

Ofwat The Use of Revealed Customer Behaviour in Future Price Limits Final
Cascade Consulting in association with eftec 49
eftec (2010) Scoping Study into the Use of Recreational Surveys for Economic Valuation, Final Report to Department for Environment, Food and Rural Affairs (Defra).
Egan, K. J., Herriges, J. A., Kling, C. L., & Downing, J. A. (2004) Recreation Demand Using Physical Measures of Water Quality, Center for Agricultural and Rural Development, Working Paper 04-WP 372.
Englin, J. and Cameron, T. (1996) ‗Augmenting travel cost models with contingent behaviour data‘, Environmental and Resource Economics, 7 (2), 133-147.
Freeman, A.M. (2003) The Measurement of Environmental an Resource Values: Theory and Methods, 2nd Edition, Resources for the Future.
Garrod, G. and Willis, K. (1994) ‗An Economic Estimate of the Effect of a Waterside Location on Property Values‘, Environment and Resource Economics, 4: 209-217.
Gibbons, S., Mourato, S., and Resende, G. (2011) The Amenity Value of English Nature: A Hedonic Price Approach, Spatial Economics Research Centre (SERC) Discussion Paper 74.
Gibbs, J.P., Halstead, J.M., & Boyle, K.J. (2002) ‗An Hedonic Analysis of the Effects of Lake Water Clarity on New Hampshire Lakefront Properties‘, Agricultural and Resource Economics Review, 31, (1l) 39-46
Hanley, N., Bell, D., & Alvarez-Farizo, B. (2003) ‗Valuing the benefits of coastal water quality improvements using contingent and real behaviour‘, Environmental and Resource Economics, 24 (3), 273-285.
Haq, M., Mustafa, U., & Iftikhar, A. (2008) ‗Household's willingness to pay for safe drinking water: A case study of Abbottabad district‘, Pakistan Development Review, 46, (4) 1137-1153.
Hatton, M., Crossman, N.D., Mahmoudi, P., Taylor, L.O., Summers, D.M., & Boxall, P.C. (2010) ‗The value of public and private green spaces under water restrictions‘, Landscape and Urban Planning, 95, (4) 192-200.
Hunt, L.M., Boxall, P.C., & Boots, B. (2007) ‗Accommodating Complex Substitution Patterns in a Random Utility Model of Recreational Fishing Ontario Ministry of Natural Resources‘, Marine Resource Economics, 22, 155-172.
Hurlimann, A. & Dolnicar, S. (2010) ‗When Public Opposition Defeats Alternative Water Projects - the Case of Toowoomba Australia When Public Opposition Defeats Alternative Water Project‘, Water Research, 44, (1) 287-297.
Hurlimann, A., Dolnicar, S., & Meyer, P. (2009) ‗Understanding behaviour to inform water supply management in developed nations--a review of literature, conceptual model and research agenda‘, Journal of Environmental Management, 91, (1) 47-56.
Hurlimann, A. & Dolnicar, S. (2010) ‗Acceptance of water alternatives in Australia – 2009‘, Water Science and Technology, 61, (8) 2137-2142.
Hurlimann, A. & Dolnicar, S. (2010) ‗Australians' water conservation behaviours and attitudes‘, Australian Journal of Water Resources, 14, (1) 43-53.
Hynes, S., Hanley, N., & Scarpa, R. (2008) ‗Effects on Welfare Measures of Alternative Means of Accounting for Preference Heterogeneity in Recreational Demand Models‘, American Journal of Agricultural Economics, 90, (4) 1011-1027.
ICS Consulting (2011) Comm0n Valuation Framework Project, March 2011.
Ofwat The Use of Revealed Customer Behaviour in Future Price Limits Final
Cascade Consulting in association with eftec 50
Jakus, P. M., Shaw, W. D., Nguyen, T. N., & Walker, M. (2009), Risk Perceptions of Arsenic in Tap Water and Consumption of Bottled Water, In Agricultural and Applied Economics Association 2009 AAEA & AACI Joint Annual Meeting, Milwaukee, Wisconsin.
Jeon, Y., Herriges, J. A., Kling, C. L., Downing, J., & Downing, J. (2005) The Role of Water Quality Perceptions in Modeling The Role of Water Quality Perceptions in Modeling Lake, Iowa State University, Ames, Iowa, Working Paper #05032.
Johnstone, C. & Markandya, a. (2006) ‗Valuing river characteristics using combined site choice and participation travel cost models‘, Journal of Environmental Management, 80, (3) 237-247.
Jones, A.P., Wright, J., Bateman, I.J. and Schaafsma, M. (2010) ‗Estimating arrival numbers for informal recreation: A geographical approach and case study of British woodlands‘, Sustainability, 2(2).
Jones, A., Bateman, I. and Wright, J (2002) Estimating arrival numbers and values for informal recreational use of British woodlands. Final Report to the Forestry Commission, CSERGE School of Environmental Sciences, University of East Anglia.
Klein, R.J.T. and Bateman, I.J. (1998) ‗The Recreational Value of Cley Marshes Nature Reserve: An Argument Against Managed Retreat?‘ Journal of Chartered Institute of Water Environmental Management, 12.
Larson, B.A. & Gnedenko, E.D. (1999) ‗Avoiding Health Risks from Drinking Water in Moscow: An empirical Analysis‘, Environment and Development Economics, 4, 565-581.
Lee, C.K. & Kwak, S.J. (2007) ‗Valuing drinking water quality improvement using a Bayesian analysis of the multinomial probit model‘, Applied Economics Letters, 14, (4) 255-259.
Leggett, C. & Bockstael, N. (2000) ‗Evidence of the Effects of Water Quality on Residential Land Prices‘, Journal of Environmental Economics and Management, 39, (2) 121-144.
Majowicz, S.E., McEwen, S.A., Jones, A.Q., Dewey, C.E., & Dore, K. (2006) ‗Drinking water consumption patterns of residents in a Canadian community‘, Journal of Water and Health, 4, (1) 125-138
Maler, K.G. (1974) Environmental Economics: A Theoretical Enquiry, John Hopkins University Press, Baltimore.
Needleman, L. (1976) ‗Valuing other people‘s lives‘, The Manchester School, 44: 309-342.
Nera (2007) Report on The Benefits of Water Framework Directive Programmes of Measures in England and Wales, Final Report to Department for Environment, Food and Rural Affairs (Defra).
Ofwat (2010) Involving customers in the price-setting process – a discussion paper, October 2010.
Ofwat (2007) ‗Further Ofwat guidance on the use of cost-benefit analysis for PR09‘, Letter to all regulatory directors of water and sewerage companies and water only customers, Fiona Pethick, Ofwat Director of Corporate Affairs, 19th December 2007.
Ofwat (1997) The drought of 1995: a quantification study of large business customers in Bradford, Report by Research by Design, January 1997.
Ofwat (1996) The drought of 1995: the customers' perspective in Bradford, Report by Research by Design, May 1996.

Ofwat The Use of Revealed Customer Behaviour in Future Price Limits Final
Cascade Consulting in association with eftec 51
Paccagnan, V. (2007) On combining stated preferences and revealed preferences approaches to evaluate environmental resources having a recreational use, Istituto di Economia e Politica dell'Energia e dell'Ambiente, Working Paper No. 4.
Parshades, P., Koundouri, P., & Hajispyrou, S. (2001) Household Demand and Welfare Implications for Water Pricing in Cyprus, University of Cyprus, Department of Economics, Discussion Paper 2001-03.
Phaneuf, D.J. & Smith, V.K. (2005) Recreation Demand Models. In: Mäler, Karl-Göran and Vincent, Jeffrey R. Handbook of Environmental Economics. Amsterdam: Elsevier. 671-761.
Phaneuf, D.J. & Siderelis, C. (2003) ‗An Application of the Kuhn-Tucker Model to the Demand for Water Trail Trips in North Carolina‘, Marine Resource Economics, 18, 1-14.
Phaneuf, D.J., Kling, C.L. & Herriges, J.A. (2000) ‗Estimation and Welfare Calculations in a Generalized Corner Solution Model with an Application to Recreation Demand‘, The Review of Economics and Statistics, 82, (1) 83-92.
Poor, P., Pessagno, K., & Paul, R. (2007) ‗Exploring the hedonic value of ambient water quality: A local watershed-based study‘, Ecological Economics, 60, (4) 797-806.
Prayaga, P., Rolfe, J., & Stoeckl, N. (2010) ‗The value of recreational fishing in the Great Barrier Reef, Australia: A pooled revealed preference and contingent behaviour model‘, Marine Policy, 34, (2) 244-251.
Renzetti, S. & Dupont, D. (1999) ‗An Assessment of the Impact of Charging for Provincial Water Use Permits‘, Canadian Public Policy. 25(3), 361.
Rolfe, J. & Dyack, B. (2010) ‗Valuing Recreation in the Coorong, Australia, with Travel Cost and Contingent Behaviour Models‘, The Economic Record, 1-12.
Rolfe, J. & Dyack, B. (2010) ‗Testing for convergent validity between travel cost and contingent valuation estimates of recreation values in the Coorong, Australia‘, Australian Journal of Agricultural and Resource Economics, 54, (4) 583-599.
Rosado, M., Cunha-E-Sa, M., Ducla-Soares, M.M., & Nunes, L.C. (2006) ‗Combining averting behavior and contingent valuation data: an application to drinking water treatment in Brazil‘, Environment and Development Economics, 11, (06) 729-746.
Schram, C., Adamowicz, W. & Dupont. D. (2010) At Odds with Water: Perceived Health Risks and Water in Canada, Paper presented at World Congress of Resource and Environmental Economics, Montreal, June 2010.
Statistics Canada (2009) Households and the Environment 2007, Statistics Canada.
Timmins, C. & Murdock, J. (2007) ‗A revealed preference approach to the measurement of congestion in travel cost models‘, Journal of Environmental Economics and Management, 53, (2) 230-249.
UKWIR (2010) Review of Cost-Benefit Analysis and Benefit Valuation – Main Report, Cascade Consulting with eftec and ICS Consulting, Report Ref. No. 10/RG/07/18.
UKWIR (2008a) A Framework for Cost-Benefit Analysis in Odour Control Projects, Ove Arup and Partners, Report Ref. No. 08/WW/13/9.
UKWIR (2008b) Acceptability of Drinking Water – Willingness to Pay, MVA Consultancy and WRc, Report Ref. No. 08/CU/02/4.
Ofwat The Use of Revealed Customer Behaviour in Future Price Limits Final
Cascade Consulting in association with eftec 52
UKWIR (2007) The role and application of cost-benefit analysis: Volume 1 generic guidance, ICF International and Mott MacDonald, Report Ref. No. 07/RG/07/10.
von Haefen, R.H. (2007) ‗Empirical Strategies for incorporating weak complementarity into continuous demand system models‘, Journal of Environmental Economics and Management, Vol. 54 (1), 15-31.
Ward, F.A. and Beal, D. (2000) Valuing Nature with Travel Cost Models, Edward Elgar.
Willis, K. (1990) ‗The individual travel cost method and the value of recreation: the case of the Montgomery and Lancaster canals‘, Environment and Planning C: Government and Policy, Vol. 8.
Willis, K. and Garrod, G. (1991) Valuing open access recreation on inland waterways: on-site recreation surveys and selection effects Countryside Change Working Paper 14, University of Newcastle. Regional Studies Vol. 25 (6) pp 511-524
Whittington, D., Lauria, D.T., Okun, D., & Mu, X. (1989) ‗Water vending activities in developing countries‘, International Journal of Water Resources Development, 5, (3) 158-168.
Wu, P.I. & Huang, C.L. (2001) ‗Actual averting expenditure versus stated willingness to pay‘, Applied Economics, 33, (2) 277-283.
Young (2005) Determining the Economic Value of Water – Concepts and Methods, Resources for the Future, Washington D.C.

Ofwat The Use of Revealed Customer Behaviour in Future Price Limits Final
Cascade Consulting in association with eftec
APPENDIX 1
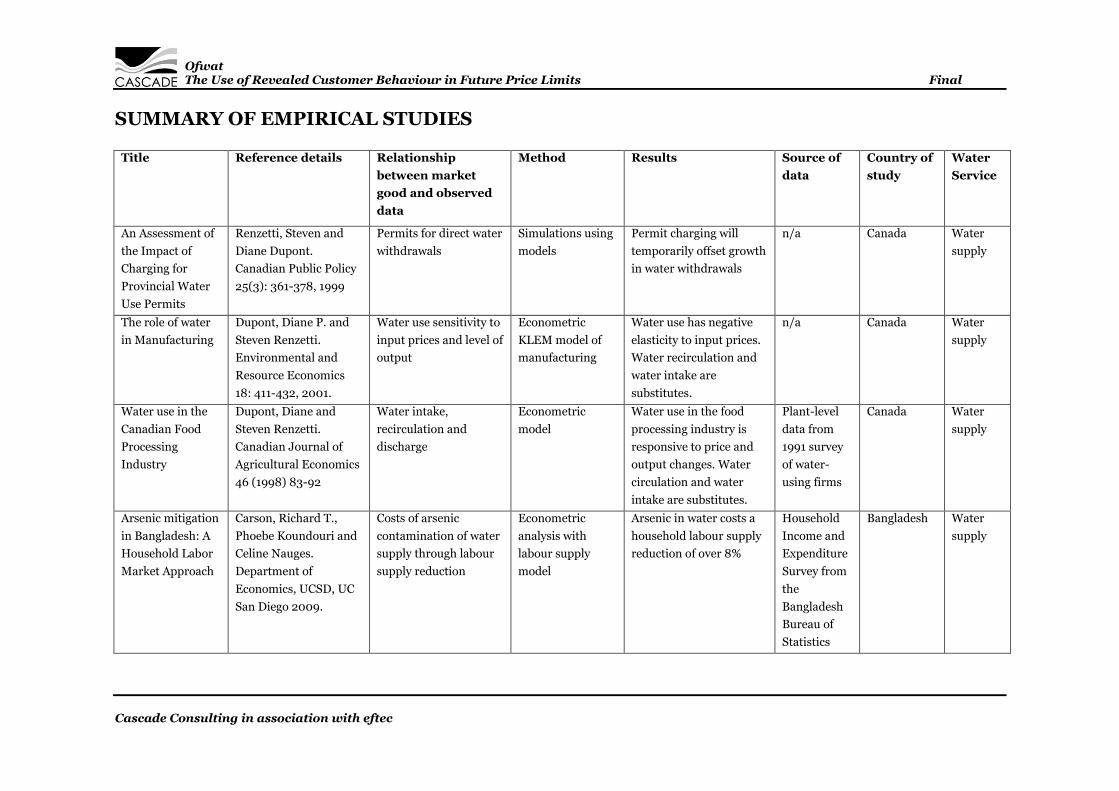
Ofwat The Use of Revealed Customer Behaviour in Future Price Limits Final
Cascade Consulting in association with eftec
SUMMARY OF EMPIRICAL STUDIES
Title Reference details Relationship
between market
good and observed
data
Method Results Source of
data
Country of
study
Water
Service
An Assessment of
the Impact of
Charging for
Provincial Water
Use Permits
Renzetti, Steven and
Diane Dupont.
Canadian Public Policy
25(3): 361-378, 1999
Permits for direct water
withdrawals
Simulations using
models
Permit charging will
temporarily offset growth
in water withdrawals
n/a Canada Water
supply
The role of water
in Manufacturing
Dupont, Diane P. and
Steven Renzetti.
Environmental and
Resource Economics
18: 411-432, 2001.
Water use sensitivity to
input prices and level of
output
Econometric
KLEM model of
manufacturing
Water use has negative
elasticity to input prices.
Water recirculation and
water intake are
substitutes.
n/a Canada Water
supply
Water use in the
Canadian Food
Processing
Industry
Dupont, Diane and
Steven Renzetti.
Canadian Journal of
Agricultural Economics
46 (1998) 83-92
Water intake,
recirculation and
discharge
Econometric
model
Water use in the food
processing industry is
responsive to price and
output changes. Water
circulation and water
intake are substitutes.
Plant-level
data from
1991 survey
of water-
using firms
Canada Water
supply
Arsenic mitigation
in Bangladesh: A
Household Labor
Market Approach
Carson, Richard T.,
Phoebe Koundouri and
Celine Nauges.
Department of
Economics, UCSD, UC
San Diego 2009.
Costs of arsenic
contamination of water
supply through labour
supply reduction
Econometric
analysis with
labour supply
model
Arsenic in water costs a
household labour supply
reduction of over 8%
Household
Income and
Expenditure
Survey from
the
Bangladesh
Bureau of
Statistics
Bangladesh Water
supply

Ofwat The Use of Revealed Customer Behaviour in Future Price Limits Final
Cascade Consulting in association with eftec
Title Reference details Relationship
between market
good and observed
data
Method Results Source of
data
Country of
study
Water
Service
Evidence of the
Effects of Water
Quality on
Residential Land
Prices
Leggett, Christopher G.
and Nancy E.
Bockstael. Journal of
Environmental
Economics and
Management 39: 121-
144, 2000
House prices to
estimate benefits of
noticeable
environmental water
quality
Hedonic pricing Higher levels of fecal
coliform significantly
depress property values.
A change of 100 fecal
coliform counts per
100mL estimated to
produce a 1.5% change in
property prices. Price
impacts range from
$5114 to $9824 per
property
House prices
of waterfront
property
USA Environ
mental
water
quality
At Odds with
Water: Perceived
Health Risks and
Water in Canada
Schram, Craig, W.L.
Adamowicz and Diane
Dupont. Presented at
the World Congress of
Resource and
Environmental
Economics, Montreal
Quebec, June 2010
Expenditures on
drinking water from
perceived health risks
Avertive
behaviour
Monthly marginal WTP
estimates for
improvements in tap
water to the perceived
quality of filtered and
bottled water were $2.96
and $13.97 respectively.
Perceived mortality is a
significant predictor of
water consumption
choices for a large
number of respondents
in the survey.
Internet-
based cross-
Canada
survey.
Sample size
1304
Canada Water
supply
The impact of oil
and natural gas
facilities on rural
residential
Boxall, Peter C., Wing
H. Chan & Melville L.
McMillan. Resource
and Energy Economics
Impact on house prices
of presence of oil and
natural gas facilities
Hedonic pricing
with spatial error
model
Property values are
negatively correlated
with number of sour gas
wells and flaring oil
Residential
property
sales in
Calgary
Canada n/a

Ofwat The Use of Revealed Customer Behaviour in Future Price Limits Final
Cascade Consulting in association with eftec
Title Reference details Relationship
between market
good and observed
data
Method Results Source of
data
Country of
study
Water
Service
property values: a
spatial hedonic
analysis
27: 248-269, 2005. batteries within 4km of a
property
The value of
public and private
green spaces
under water
restrictions
MacDonald, Darla
Hatton, Neville D.
Crossman, Parvin
Mahmoudi, Laura O.
Taylor, David M.
Summers and Peter C.
Boxall. Landscape and
Urban Planning 95:
192-200, 2010
Impact on house prices
of public and private
green spaces under
water restrictions
Hedonic pricing Water restrictions do not
have a significant impact
on the value of outdoor
space on private
properties. Indications
that substitutions may be
occurring with proximity
to playgrounds, which
are watered more
regularly.
Digital aerial
photography
and house
sale prices
between
January
2005 and
November
2007
Australia Water
supply
Accommodating
Complex
Substitution
Patterns in a
Random Utility
Model of
Recreational
Fishing
Hunt, Len M, Peter C.
Boxall & Barry Boots.
Marine Resource
Economics 22:155-172.
2007
Quality of fishing sites
by site choice of anglers
Random Utility
Model
Declines in wall-eye catch
rate and road
degradation negatively
impacted visits to sites.
Welfare losses amounted
to $0.24-$0.27 per day
trip for road degradation
and $0.33-$0.35 per
multiple day trips and
$0.17-$0.30 for decline
to walleye catch rates for
day trips and $1.47-$1.71
for multiple-day trips
655 anglers
agreed to
participate
in an angling
diary
program.
Canada Environ
mental
water
quality
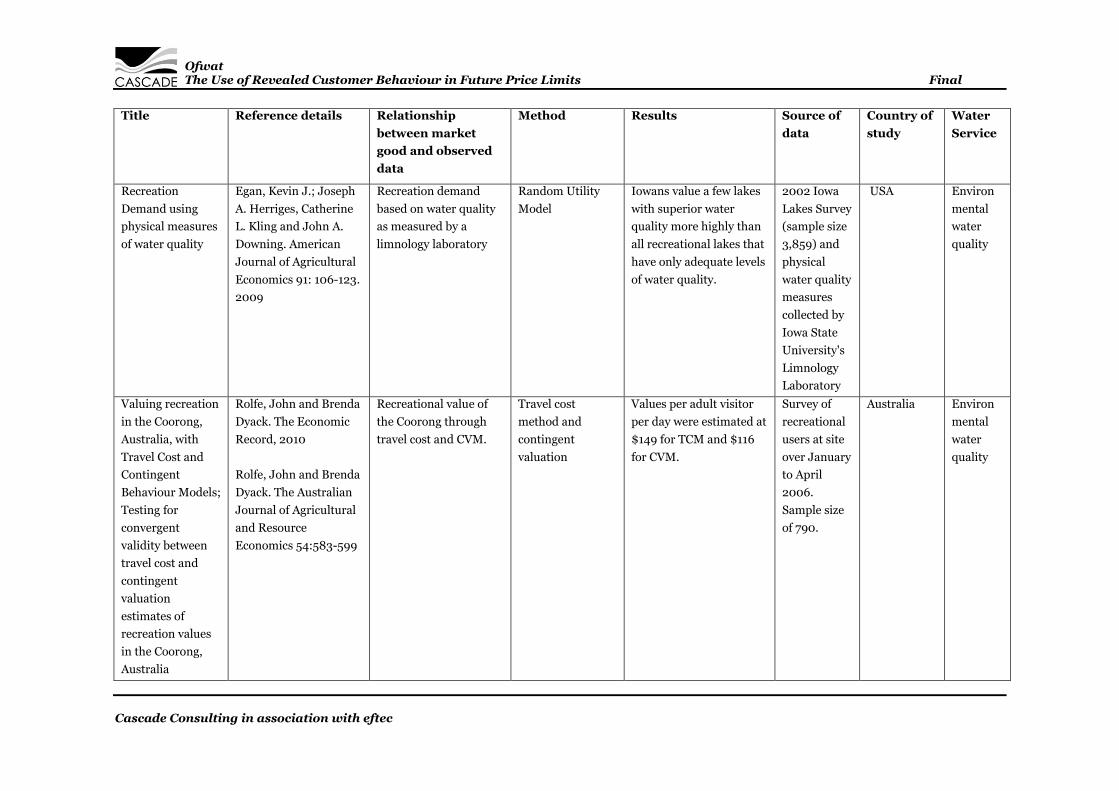
Ofwat The Use of Revealed Customer Behaviour in Future Price Limits Final
Cascade Consulting in association with eftec
Title Reference details Relationship
between market
good and observed
data
Method Results Source of
data
Country of
study
Water
Service
Recreation
Demand using
physical measures
of water quality
Egan, Kevin J.; Joseph
A. Herriges, Catherine
L. Kling and John A.
Downing. American
Journal of Agricultural
Economics 91: 106-123.
2009
Recreation demand
based on water quality
as measured by a
limnology laboratory
Random Utility
Model
Iowans value a few lakes
with superior water
quality more highly than
all recreational lakes that
have only adequate levels
of water quality.
2002 Iowa
Lakes Survey
(sample size
3,859) and
physical
water quality
measures
collected by
Iowa State
University's
Limnology
Laboratory
USA Environ
mental
water
quality
Valuing recreation
in the Coorong,
Australia, with
Travel Cost and
Contingent
Behaviour Models;
Testing for
convergent
validity between
travel cost and
contingent
valuation
estimates of
recreation values
in the Coorong,
Australia
Rolfe, John and Brenda
Dyack. The Economic
Record, 2010
Rolfe, John and Brenda
Dyack. The Australian
Journal of Agricultural
and Resource
Economics 54:583-599
Recreational value of
the Coorong through
travel cost and CVM.
Travel cost
method and
contingent
valuation
Values per adult visitor
per day were estimated at
$149 for TCM and $116
for CVM.
Survey of
recreational
users at site
over January
to April
2006.
Sample size
of 790.
Australia Environ
mental
water
quality

Ofwat The Use of Revealed Customer Behaviour in Future Price Limits Final
Cascade Consulting in association with eftec
Title Reference details Relationship
between market
good and observed
data
Method Results Source of
data
Country of
study
Water
Service
The value of
recreational
fishing in the
Great Barrier
Reef, Australia: A
pooled preference
and contingent
behaviour model
Prayaga, Prabha, John
Rolfe and Natalie
Stoeckl, Marine Policy
34: 244-251, 2010
Recreational value of
fishing in the Capricorn
Coast using travel cost
method
Travel cost
method and
contingent
valuation
High values associated
with recreational fishing
activity along the
Capricorn Coast, and
demand for recreational
fishing is inelastic -
values are relatively
insensitive to changes in
catch rates
Survey of
anglers at
Capricorn
Coast over
period of 28
weeks from
late January
to mid
August
2007.
Sample size
of 311.
Australia Environ
mental
water
quality
Household
demand and
welfare:
Implications for
water pricing in
Cyprus
Hadjispirou, S.,
Koundouri, P. and
Pashardes, P.,
Environment and
Development
Economics 7(4): 659-
685. 2002
Welfare implications of
the price of water
supply
Demand analysis Price elasticity of demand
for water ranges from
between -.4 for
households in the lowest
and -.8 for households in
the highest 10% of
income distribution.
However a move towards
a more uniform marginal
cost pricing system will
be distributed in favour
of the better off
households, while
households in the bottom
10% of the distribution of
income will be net losers.
Family
Expenditure
Survey
1996/97,
surveys 2700
households
on annual
water bill
together
with
expenditure
on a large
number of
other items.
Cyprus Water
supply

Ofwat The Use of Revealed Customer Behaviour in Future Price Limits Final
Cascade Consulting in association with eftec
Title Reference details Relationship
between market
good and observed
data
Method Results Source of
data
Country of
study
Water
Service
An Ecological and
Economic
Approach to
Valuing River
Quality
Johnstone, Claire A.
PhD Thesis, Dept. of
Economics and
International
Development,
University of Bath
River quality measured
by choice of angling site
Random Utility
Model
Consumer surplus per
trip for a 10% change in
river attributers (higher
flow rates, biological
quality and nutrient
pollution levels) ranges
from £0.04 to £3.93.
Survey of
river anglers
between
November
2000 and
April 2001.
Sample size
421
England Environ
mental
water
quality
Exploring the
Hedonic Value of
Ambient Water
Quality: A Local
Watershed Based
Study
Poor, P.J., K. Pessagno
and R.W. Paul.
Ecological Economics,
60:4(797-806), 2007.
Impact of local water
quality on house prices
Hedonic pricing Environmental water
quality affects house
prices. The marginal
implicit price for 1mg per
litre change in total
suspended solid was
estimated to be $1,086
while similar change in
dissolved inorganic
nitrogen was estimated to
be $17,642
Residential
property
sales within
the St Mary's
watershed
between
June 1999 to
May 2003.
Environment
al data was
obtained
from water
monitoring
stations.
USA Environ
mental
water
quality

Ofwat The Use of Revealed Customer Behaviour in Future Price Limits Final
Cascade Consulting in association with eftec
Title Reference details Relationship
between market
good and observed
data
Method Results Source of
data
Country of
study
Water
Service
The role of water
quality
perceptions in
modelling lake
recreation
demand
Jeon, Y., J.A. Herriges,
C.L. Kling and J.
Downing
The role of water
quality perceptions in
modelling lake
recreation demand
Random utility
model
Annual benefit of $12.39
to $73.03 for an
improvement in water
quality for all 130 lakes to
the same water quality as
that of West Okoboji
Lake. For an
improvement of 9 lakes,
benefits are $0.90 to
$8.26 per household per
year, and for
improvement of 65
impaired lakes to the
median water quality of
the 66 non-impaired
lakes, the benefits are
$3.06 to $7.28 per
household per year.
2003 Iowa
Lakes Survey
(sample size
5,281) and
environment
al data from
Iowa State
University
Limnology
laboratory
USA Environ
mental
water
quality
An application of
the Kuhn-Tucker
Model to the
Demand for Water
Trail Trips in
North Carolina
Phaneuf, D.J. and C.
Siderelis. Marine
Resource Economics
18: 1-14. 2003.
Water quality link to
demand for water trail
trips in northern
Carolina (value
measured by travel
cost)
Kuhn-Tucker
recreation
demand model
Mean annual WTP per
individual was US$4.64
for an increase by 100
trail miles and $24.44 for
an improvement in water
quality to at least 2 on the
Index of Watershed
Indicators (IWI) in the
paddling areas.
Mail survey
of canoeing
and kayaking
visitors to
eastern
North
Carolina in
2000.
Sample size
was 491.
USA Environ
mental
water
quality

Ofwat The Use of Revealed Customer Behaviour in Future Price Limits Final
Cascade Consulting in association with eftec
Title Reference details Relationship
between market
good and observed
data
Method Results Source of
data
Country of
study
Water
Service
Valuing River
Characteristics
using combined
site choice and
participation
travel cost models
Johnstone, C. and A.
Markandya. Journal of
Environmental
Management 80: 237-
247. 2006
Impact of river quality
(chemical, biological,
habitat and fish
population) on visitor
numbers. Measured via
travel cost
Travel cost
method
10% change in river
attributes results in
change in consumer
surplus value per trip,
ranging from a low of
£0.04 to a high of £3.93.
Mail and
online
survey of
anglers with
sample size
of 821.
UK Environ
mental
water
quality
The Welfare Cost
of Urban Outdoor
Water Restrictions
Brennen, D. and S.
Tapsuwan. Australian
Journal of Agricultural
and Resource
Economics 51(3): 243-
261. 2007
Water restrictions
(lawn watering
restrictions)
Household
production model
of consumer
choice
A 2 day ban of sprinkler
use has a welfare cost of
$66 to $67. For a full
ban, costs vary between
$347 to $871 depending
on the time cost used.
Interviews
with turf
industry
representativ
es
Australia Water
supply
On combining
stated preferences
and revealed
preferences
approaches to
evaluate
environmental
resources having a
recreational use
Paccagnan, V. IEFE
Working Paper Series,
No. 4. 2007.
Water quality and
recreational demand,
measured by travel cost
Travel cost and
contingent
behaviour
Combined TCM and CB
results to get value of
€134 per trip per
individual
Survey of
visitors to
Idro Lake in
July 2005.
Sample size
of 155
responses.
Italy Environ
mental
water
quality
Effects on welfare
measures of
alternative means
of accounting for
preference
heterogeneity in
recreational
Hynes, Stephen, Nick
Hanley and Riccardo
Scarpa. American
Journal of Agricultural
Economics 90(4):1011-
1027. 2008
Water quality and
recreational demand
(whitewater kayaking)
Random Utility
Model
Increasing water quality
rating at the Liffey
produces a loss for some
and a gain for others, but
gains exceed losses. The
simulated mean is €1.89
per choice and is slightly
Survey e-
mailed out to
Irish kayaker
e-mail lists,
posted on
Irish Canoe
Union
Ireland Environ
mental
water
quality

Ofwat The Use of Revealed Customer Behaviour in Future Price Limits Final
Cascade Consulting in association with eftec
Title Reference details Relationship
between market
good and observed
data
Method Results Source of
data
Country of
study
Water
Service
demand models smaller for skilled (€1.70)
than for unskilled
(€2.20) kayakers.
website, and
administered
to a kayaking
group meet.
Sample size
279
Aesthetic Values
of Lakes and
Rivers
Corrigan, Jay R., Kevin
J. Egan and John A.
Downing. 2007
Improved aesthetic
water quality of lake by
intended visits
Travel cost
method
Visitors place a greater
value on large water-
quality improvements
($347 per visitor per
year) over a small one
($139 per visitor per
year).
Mail survey
with sample
size of 479
USA Environ
mental
water
quality
A framework for
cost-benefit
analysis in odour
control projects
O'Sullivan, F., J Wells
and M Whitbread.
UKWIR, 2008
House prices estimate
the costs of odour from
sewage treatment
plants
Hedonic pricing In one site terraced
housing shows a
significant difference in
prices, but this is not
repeated for semi-
detached housing. For
another two sites, there
was no significant
difference between house
prices before and after
sewage treatment works
were built, although the
study notes there are
relatively few
observations in some
Land
Registry
UK Sewage
treatmen
t

Ofwat The Use of Revealed Customer Behaviour in Future Price Limits Final
Cascade Consulting in association with eftec
Title Reference details Relationship
between market
good and observed
data
Method Results Source of
data
Country of
study
Water
Service
cases. In one of these
sites there is a difference
in house prices which are
and are not affected by
odour. The study
concludes that no
unambiguous patterns in
the findings emerged
from the analysis.
Water vending
activities in
developing
countries
Whittington, Dale,
Donald T. Lauria,
Daniel A. Okun, and
Xinming Mu.
International Journal
of Water Resources
Development 5(3): 158-
168
Market price for clean
water delivered to
homes
Market pricing Benefits of water vending
(as opposed to water
collection) range from
$110 for households with
a higher value of time
($0.50 per hour) to $50
and $30 for households
with a lower value of time
($0.25 per hour).
Fieldwork
carried out
in June and
July 1986,
including
observations
at kiosks,
handpumps
and open
wells,
interviews
with water
vendors and
kiosk
owners.
Kenya Water
supply
Valuing the
benefits of coastal
water quality
Hanley, Nick, David
Bell and Begona
Alvarez-Farizo.
Change in number of
trips and welfare due to
change in water quality
Travel cost
method
Increase in consumer
surplus per individual
per year is valued at
On-site
survey
undertaken
UK Environ
mental
water

Ofwat The Use of Revealed Customer Behaviour in Future Price Limits Final
Cascade Consulting in association with eftec
Title Reference details Relationship
between market
good and observed
data
Method Results Source of
data
Country of
study
Water
Service
improvements
using contingent
and real behaviour
Environmental and
Resource Economics
24(3):273-285. 2003
£5.81, or £0.48 per trip
for improved water
quality.
in 1999 on
seven
beaches in
Scotland.
Sample size
414.
quality
Joint production
and averting
expenditure
measures of
willingness to pay:
Do water
expenditures
really measure
avoidance costs?
Abrahams, Nii Adote,
Bryan J. Hubbell,
Jeffrey L. Jordan.
American Journal of
Agricultural
Economics, Vol. 82, No
2 (May 2000), pp 427-
437
Purchase of bottled
water and/or water
filters to offset possible
contamination risks of
tapwater
Avertive
behaviour
Perceived risk from tap
water, concern about
water quality (taste,
odour and appearance),
race and age are
important determinants
of bottled water selection
while perception of risk,
income, and previous
problems with tap water
are important variables
in the decision to use a
water filter. The estimate
for lower bound
aggregate WTP for safe
water for the state of
Georgia is $346 million
per year, or about $47
per person annually.
Telephone
survey of
Georgia
residents.
Sample size
400.
USA Water
supply
Valuing
environmental
quality changes
Abdalla, Charles W.,
Brian A. Roach and
Donald J. Epp. Land
Respondents to a
survey were asked what
avertive actions they
Avertive
expenditure
Total estimated costs for
avertive expenditures on
increased/new purchases
Postal survey
of sample
size 761 and
USA Water
supply

Ofwat The Use of Revealed Customer Behaviour in Future Price Limits Final
Cascade Consulting in association with eftec
Title Reference details Relationship
between market
good and observed
data
Method Results Source of
data
Country of
study
Water
Service
using avertive
expenditures: An
application to
groundwater
contamination
Economics, 68(2), 163-
69. 1992
took in response to a
contamination event of
groundwater in
Perkasie, Pennsylvania.
These actions included
increased bottled water
purchases, installing
home water treatment
systems, hauling water
from alternate sources
and boiling water.
of bottled water, home
water treatment systems,
hauling water and boiling
water for all Perkasie
households were
estimated to be
$61,313.29 to
$131,334.06 between
December 1987 to
September 1989,
depending on the wage
rate used to reflect lost
leisure time.
a telephone
survey to
check
representativ
eness of
sample.
Actual averting
expenditure
versus stated
willingness to pay
Wu, Pei-Ing and Chu-Li
Huang. Applied
Economics 33: 277-
283. 2001.
Purchasing bottled and
distilled water and
water purifiers for
better water quality.
Avertive
behaviour and
stated willingness
to pay
Households had different
avertive actions to water
quality from
combinations of water
purchase and the use of
water filters and
purifiers. The average
avertive expenditure for
each household is NT
$617.24 every 2 months.
The stated average
willingness to pay was
NT$599.52 and
NT$634.64 depending on
the model used to
Referendum
survey with a
sample size
of 540
households,
54
households
from each
district in
the city of
Kaohsiung,
Taiwan.
Taiwan Water
supply

Ofwat The Use of Revealed Customer Behaviour in Future Price Limits Final
Cascade Consulting in association with eftec
Title Reference details Relationship
between market
good and observed
data
Method Results Source of
data
Country of
study
Water
Service
estimate it.
Combining
Averting
Behaviour and
Contingent
Valuation Data:
An Application to
Drinking Water
Treatment
Rosado, Marcia A.,
Maria A. Cunha-e-Sa,
Maria M. Ducla-Soares
and Luis C. Nunes.
Environment and
Development
Economics 11(6): 729-
746. 2006.
Cost of treating tap
water or buying bottled
water to achieve safe
drinking water.
Avertive
behaviour and
stated willingness
to pay
Households paid an
average of $10 per month
to treat water/buy
bottled water. They were
willing to pay average of
$28 a month for treated
tap water.
Survey of
households
in urban
area of the
state of
Espirito
Santo.
Sample size
791.
Brazil Water
supply
An Hedonic
Analysis of the
Effects of Lake
Water Clarity on
New Hampshire
Lakefront
Properties
Gibbs, Julie P., John M.
Halstead, Kevin J.
Boyle, and Ju-Chin
Huang. Agricultural
and Resource
Economics Review
31(1):39-46. 2002
Cost of eutrophication
in lake water (measured
by secchi readings) as
measured by
differences in value of
lakefront properties
Hedonic pricing A one-meter decrease in
water clarity can lead to
decreases in property
value ranging from 0.9%
to over 6% on average.
Market data
from houses
surrounding
69 lakes in
59 towns in
New
Hampshire.
USA Environ
mental
water
quality

Ofwat The Use of Revealed Customer Behaviour in Future Price Limits Final
Cascade Consulting in association with eftec
Title Reference details Relationship
between market
good and observed
data
Method Results Source of
data
Country of
study
Water
Service
Avoiding health
risks from
drinking water in
Moscow: An
empirical analysis
Larson, Bruce A. and
Ekaterina D.
Gnedenko. Presented at
World Congress of
Environmental and
Resource Economists,
Venice, Italy, June 25-
27, 1998.
Costs of avertive
behaviour (filtering,
settling and boiling
water and buying
bottled water) for good
drinking water quality.
Avertive
behaviour
Time and use of gas for
boiling and settling water
were not measured, only
purchase of filters and
bottled water. Results
were that generally
expenditure on bottled
water and water filters
was under 20,000 Rubles
per week ($3.50 at
exchange rate of 5800
rubles per US Dollar).
Telephone
survey of 615
households
in Moscow
Russia Water
supply
Risk perceptions
of arsenic in tap
water and
consumption of
bottled water
Jakus, Paul M., W.
Douglass Shaw, To N.
Nguyen and Mark
Walker. Presented at
the Agricultural and
Applied Economics
Association 2009 AAEA
& ACCI Joint Annual
Meeting, Milwaukee,
Wisconsin, July 26-29,
2009
The value of
minimising perceived
risk of drinking tap
water through
purchasing bottled
water.
Avertive
behaviour
People who buy bottled
water for perceived
health risks are willing to
spend more than those
people who buy bottled
water for taste reasons.
Of people who buy
bottled water, their mean
expenditure is $27.02 a
month.
Mail survey,
sample size
201.
USA Water
supply
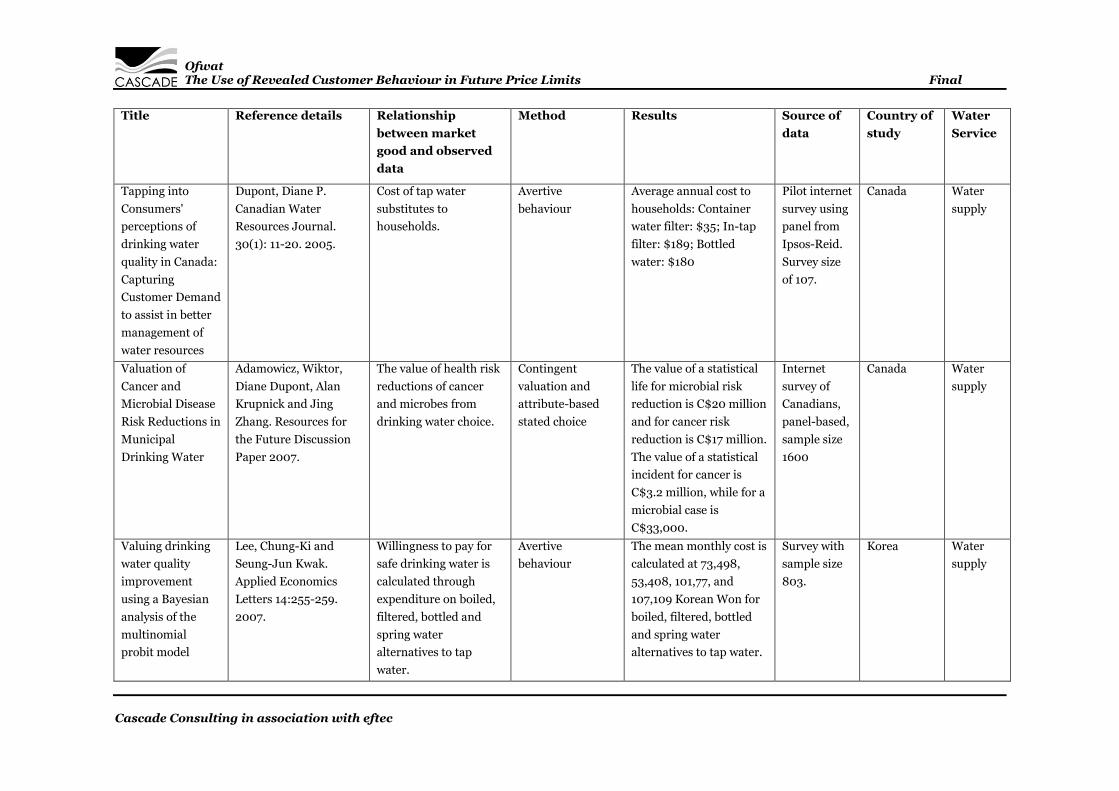
Ofwat The Use of Revealed Customer Behaviour in Future Price Limits Final
Cascade Consulting in association with eftec
Title Reference details Relationship
between market
good and observed
data
Method Results Source of
data
Country of
study
Water
Service
Tapping into
Consumers'
perceptions of
drinking water
quality in Canada:
Capturing
Customer Demand
to assist in better
management of
water resources
Dupont, Diane P.
Canadian Water
Resources Journal.
30(1): 11-20. 2005.
Cost of tap water
substitutes to
households.
Avertive
behaviour
Average annual cost to
households: Container
water filter: $35; In-tap
filter: $189; Bottled
water: $180
Pilot internet
survey using
panel from
Ipsos-Reid.
Survey size
of 107.
Canada Water
supply
Valuation of
Cancer and
Microbial Disease
Risk Reductions in
Municipal
Drinking Water
Adamowicz, Wiktor,
Diane Dupont, Alan
Krupnick and Jing
Zhang. Resources for
the Future Discussion
Paper 2007.
The value of health risk
reductions of cancer
and microbes from
drinking water choice.
Contingent
valuation and
attribute-based
stated choice
The value of a statistical
life for microbial risk
reduction is C$20 million
and for cancer risk
reduction is C$17 million.
The value of a statistical
incident for cancer is
C$3.2 million, while for a
microbial case is
C$33,000.
Internet
survey of
Canadians,
panel-based,
sample size
1600
Canada Water
supply
Valuing drinking
water quality
improvement
using a Bayesian
analysis of the
multinomial
probit model
Lee, Chung-Ki and
Seung-Jun Kwak.
Applied Economics
Letters 14:255-259.
2007.
Willingness to pay for
safe drinking water is
calculated through
expenditure on boiled,
filtered, bottled and
spring water
alternatives to tap
water.
Avertive
behaviour
The mean monthly cost is
calculated at 73,498,
53,408, 101,77, and
107,109 Korean Won for
boiled, filtered, bottled
and spring water
alternatives to tap water.
Survey with
sample size
803.
Korea Water
supply
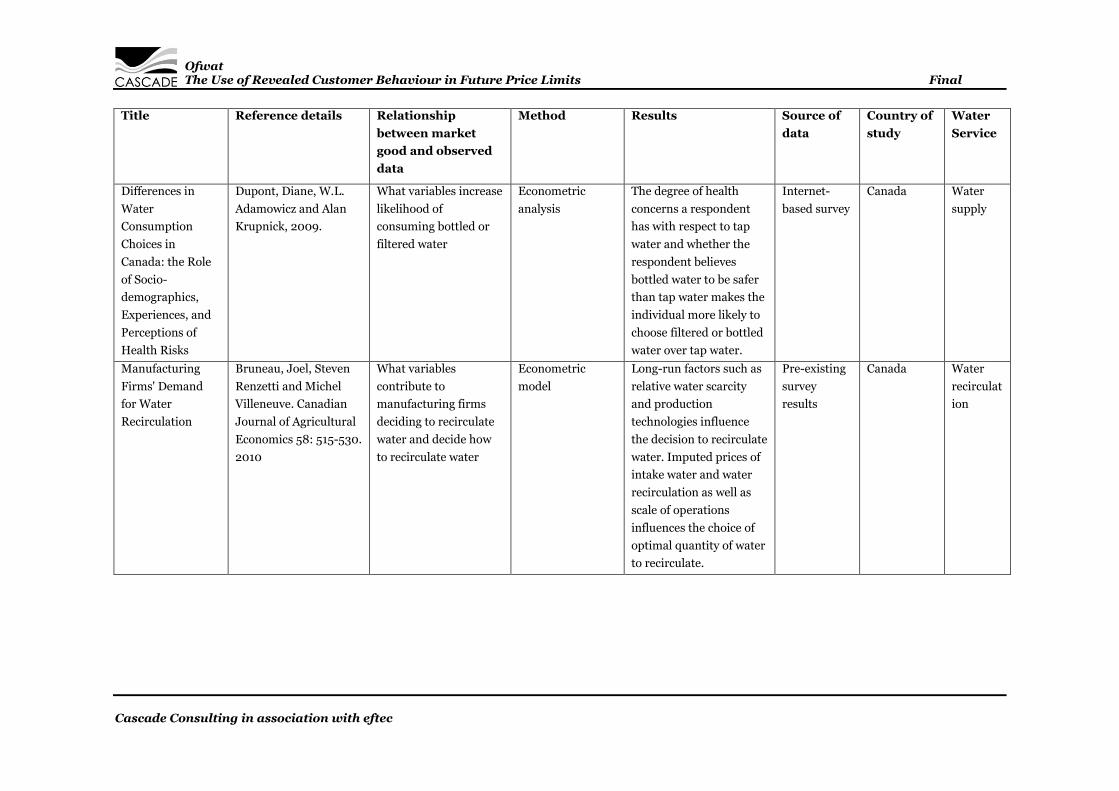
Ofwat The Use of Revealed Customer Behaviour in Future Price Limits Final
Cascade Consulting in association with eftec
Title Reference details Relationship
between market
good and observed
data
Method Results Source of
data
Country of
study
Water
Service
Differences in
Water
Consumption
Choices in
Canada: the Role
of Socio-
demographics,
Experiences, and
Perceptions of
Health Risks
Dupont, Diane, W.L.
Adamowicz and Alan
Krupnick, 2009.
What variables increase
likelihood of
consuming bottled or
filtered water
Econometric
analysis
The degree of health
concerns a respondent
has with respect to tap
water and whether the
respondent believes
bottled water to be safer
than tap water makes the
individual more likely to
choose filtered or bottled
water over tap water.
Internet-
based survey
Canada Water
supply
Manufacturing
Firms' Demand
for Water
Recirculation
Bruneau, Joel, Steven
Renzetti and Michel
Villeneuve. Canadian
Journal of Agricultural
Economics 58: 515-530.
2010
What variables
contribute to
manufacturing firms
deciding to recirculate
water and decide how
to recirculate water
Econometric
model
Long-run factors such as
relative water scarcity
and production
technologies influence
the decision to recirculate
water. Imputed prices of
intake water and water
recirculation as well as
scale of operations
influences the choice of
optimal quantity of water
to recirculate.
Pre-existing
survey
results
Canada Water
recirculat
ion

Ofwat The Use of Revealed Customer Behaviour in Future Price Limits Final
Cascade Consulting in association with eftec
Title Reference details Relationship
between market
good and observed
data
Method Results Source of
data
Country of
study
Water
Service
Australians' water
conservation
behaviours and
attitudes
Dolnicar, Sara and
Anna Hurlimann.
Australian Journal of
Water Resources,
114(1): 43-53. 2010.
Australian attitudes
towards water
conservation and water
conservation
behaviours
Survey Very favourable attitudes
to water conservation
and water efficient
appliances are not always
translated into action.
Most common water
conservation actions are
those that have low effort
required. Main barriers
to adoption of water
saving appliances are
cost, perceived quality,
convenience and
practicality.
Survey of
1495 people
Australia Water
supply
Acceptance of
water alternatives
in Australia
Hurlimann, Anna and
Sara Dolnicar, Water
Science and Technology
61(8): 2137-2142
Likelihood of
Australian residents
relocating due to water
supply.
Survey Likelihood of relocating
is highest when there was
insufficient water to meet
needs, followed by when
recycled water was
introduced into their
supply, then the
introduction of
desalinated water.
Scenario where residents
had to rely on self-
purified rain water from
a tank had the lowest
level of relocation
Survey of
1495 people
Australia Water
supply

Ofwat The Use of Revealed Customer Behaviour in Future Price Limits Final
Cascade Consulting in association with eftec
Title Reference details Relationship
between market
good and observed
data
Method Results Source of
data
Country of
study
Water
Service
intention.
Desalinated versus
recycled water -
public perceptions
and profiles of the
accepters
Desalinated versus
recycled water -
What does the
public think?
Dolnicar, Sara and A.I.
Schafer, Journal of
Environmental
Management, 90: 888-
900, 2009.
Dolnicar, Sara and A.
Hurlimann. In I.
Escobar & A. Schafer
(eds.), Sustainable
Water for the Future:
Water Recycling Versus
Desalination (pp. 375-
388). Amsterdam:
Elsevier. 2010
Public perceptions of
desalinated and
recycled water and
profiles of people
willing to accept
desalinated and
recycled water.
Survey Following five years of
serious drought
accompanied by severe
water restrictions across
most of the country,
Australians show more
acceptance of desalinated
water for close-to-body
uses and less resistance
to recycled water for
garden watering and
cleaning uses.
Stated likelihood of using
desalinated water was
higher than that for
recycled water for all
purposes. Australians
perceive recycled water
as a higher health risk
and desalinated water as
more expensive.
Perceived health risk
appears to dominate
people's perceptions.
Survey of
1495 people
Australia Water
supply
Drinking water
from alternative
Dolnicar, S. & Anna
Hurlimann. Water
Community attitudes to
alternative water
Qualitative
interviews
Australians hold both
positive and negative
66
qualitative
Australia Water
supply

Ofwat The Use of Revealed Customer Behaviour in Future Price Limits Final
Cascade Consulting in association with eftec
Title Reference details Relationship
between market
good and observed
data
Method Results Source of
data
Country of
study
Water
Service
water sources:
differences in
beliefs, social
norms and factors
of perceived
behavioural
control across
eight Australian
locations
Science & Technology,
60 (6): 1433-1444.
2009.
sources. beliefs (mostly cost,
health and
environmental concerns)
about water from
alternative sources,
however nearly all of
them are willing to drink
it if the Australian water
crisis were to deteriorate
further. People also feel
they lack knowledge and
information from
scientists would influence
their decision to drink
recycle and desalinated
water most. Friends and
relatives are most
influential in preventing
people from drinking
recycled water.
interviews at
8 locations
Understanding
behaviour to
inform water
supply
management in
developed nations
- A review of
literature,
Hurlimann, Anna, Sara
Dolnicar and Petra
Meyer. Journal of
Environmental
Management, 91(1): 47-
56. 2009
Review literature to
identify research on
willingness of
consumers to change
behaviour to inform
water supply
management
Development of
conceptual model
of research
required in the
area of water
related public
acceptance studies
and literature
The majority of work
which has been
conducted focused on
personal characteristics
and behavioural
intentions. Significant
gaps exist in relation to
researching the adoption
n/a n/a Water
supply
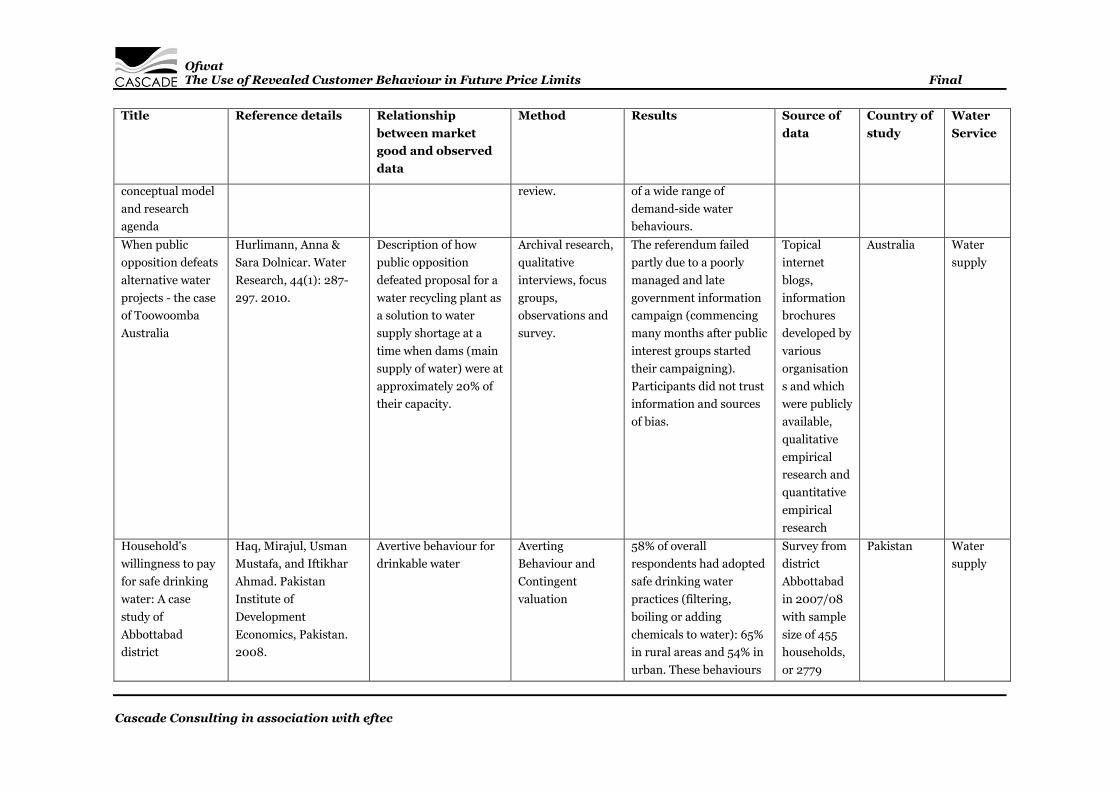
Ofwat The Use of Revealed Customer Behaviour in Future Price Limits Final
Cascade Consulting in association with eftec
Title Reference details Relationship
between market
good and observed
data
Method Results Source of
data
Country of
study
Water
Service
conceptual model
and research
agenda
review. of a wide range of
demand-side water
behaviours.
When public
opposition defeats
alternative water
projects - the case
of Toowoomba
Australia
Hurlimann, Anna &
Sara Dolnicar. Water
Research, 44(1): 287-
297. 2010.
Description of how
public opposition
defeated proposal for a
water recycling plant as
a solution to water
supply shortage at a
time when dams (main
supply of water) were at
approximately 20% of
their capacity.
Archival research,
qualitative
interviews, focus
groups,
observations and
survey.
The referendum failed
partly due to a poorly
managed and late
government information
campaign (commencing
many months after public
interest groups started
their campaigning).
Participants did not trust
information and sources
of bias.
Topical
internet
blogs,
information
brochures
developed by
various
organisation
s and which
were publicly
available,
qualitative
empirical
research and
quantitative
empirical
research
Australia Water
supply
Household's
willingness to pay
for safe drinking
water: A case
study of
Abbottabad
district
Haq, Mirajul, Usman
Mustafa, and Iftikhar
Ahmad. Pakistan
Institute of
Development
Economics, Pakistan.
2008.
Avertive behaviour for
drinkable water
Averting
Behaviour and
Contingent
valuation
58% of overall
respondents had adopted
safe drinking water
practices (filtering,
boiling or adding
chemicals to water): 65%
in rural areas and 54% in
urban. These behaviours
Survey from
district
Abbottabad
in 2007/08
with sample
size of 455
households,
or 2779
Pakistan Water
supply

Ofwat The Use of Revealed Customer Behaviour in Future Price Limits Final
Cascade Consulting in association with eftec
Title Reference details Relationship
between market
good and observed
data
Method Results Source of
data
Country of
study
Water
Service
were correlated to using
tapwater (but not to well)
and to satisfaction of
quality of water,
awareness of waterborne
diseases and level of
education.
household
members.
Bottled water
versus tap water:
understanding
consumers'
preferences
Doria, M. F. 2006.
Journal of Water and
Health: 4(2): 271-276
Why do people choose
bottled water
Literature review Taste and risk/health
concerns are the most
significant factors
influencing bottled water
consumption. Racial
differences have emerged
in the USA, with African
American, Asians and
Hispanic groups drinking
a higher proportion of
bottled water, despite
having lower incomes
than whites, but this
could reflect the
difference in water
supply quality between
living areas or memories
of past problems caused
by deficient tap-water
systems.
n/a n/a Water
supply

Ofwat The Use of Revealed Customer Behaviour in Future Price Limits Final
Cascade Consulting in association with eftec
Title Reference details Relationship
between market
good and observed
data
Method Results Source of
data
Country of
study
Water
Service
Households and
the environment
2007
Statistics Canada,
2009.
What affects drinking
water decisions
Survey Of the 54% of households
with a municipal supply
who treated their water
prior to drinking, 58%
did so to improve
appearance, taste or
odour, 51% treated to
remove water treatment
chemicals such as
chlorine, 40% of
households treated their
water to remove metals
and minerals, and 43%
felt that there was
bacterial contamination
to their water.
Survey of
with initial
sample size
of 29,980
households
who had
previously
responded to
the Canadian
Community
Health
Survey.
Canada Water
supply
Drinking water
consumption
patterns of
residents in a
Canadian
community
Jones, A.Q., C.E.
Dewey, K. Dore, S.E.
Majowicz, S.A. McEwen
and D. Waltner-Toews.
Journal of Water and
Health 04.01, 2006
Associations between
drinking water
consumption patterns
in Canada and various
demographic
characteristics
Survey Age and race were
indicators of bottled
water consumption.
Bottled water
consumption increased
with age to a peak at
approximately 31 years,
which was followed by a
steady decline with
increasing age.
Telephone
survey with
sample size
of 1,757
Canada Water
supply