ogden lidar data acquisition for utah division of ... · ogden lidar data acquisition for utah...
TRANSCRIPT
Ogden LiDAR Data Acquisition for Utah Division of Emergency Management
Box Elder and Weber Counties, Utah
COMPLETION REPORT
1
Utah AGRC
2011 Lidar Acquisition
Table of Contents
Table of Contents .............................................................................................................. 1
SUMMARY OVERVIEW .................................................................................................... 2
Executive Summary ....................................................................................................... 2
Contractor ...................................................................................................................... 2
Scope Overview ............................................................................................................ 2
Specifications for Deliverables ...................................................................................... 3
LiDAR Deliverables .................................................................................................... 3
Grid Model Deliverables ............................................................................................. 3
Miscellaneous Deliverables ....................................................................................... 3
Project Area Extents and Project Tile Index .................................................................. 3
LiDAR DATA REPORT ...................................................................................................... 4
Pre-Flight Planning ........................................................................................................ 4
Control ........................................................................................................................... 4
Final Planning – Procedures and Activities ................................................................... 5
Planning ..................................................................................................................... 5
Summary of Supporting Documents .......................................................................... 5
Data Processing Procedures Report ............................................................................. 6
Data Storage .............................................................................................................. 6
Navigation System ..................................................................................................... 6
LiDAR System ............................................................................................................ 6
LiDAR QUALITY CONTROL REPORT ............................................................................. 9
Methodology .................................................................................................................. 9
Relative Accuracy ...................................................................................................... 9
Within Swath Overlap Accuracy ................................................................................. 9
Fundamental Vertical Accuracy ................................................................................. 9
Vegetation Penetration ............................................................................................ 10
Conclusions ................................................................................................................. 12
FLIGHT REPORT ........................................................................................................... 13
GROUND CONTROL REPORT ...................................................................................... 14
Introduction .................................................................................................................. 14
RTK Ground Control Survey ........................................................................................ 14
Data Collection ............................................................................................................ 14
Data Processing and Analysis ..................................................................................... 14
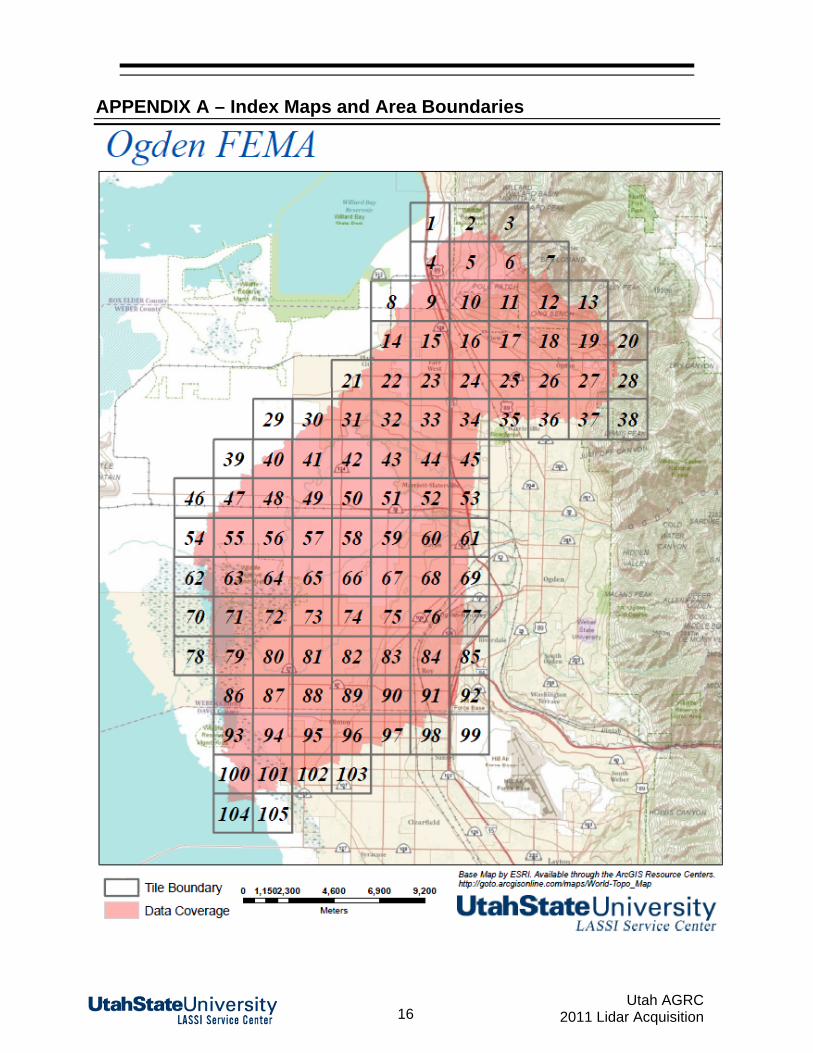
APPENDIX A – Index Maps and Area Boundaries ......................................................... 16
APPENDIX B – Flight Plan Map ...................................................................................... 17
APPENDIX C – Raw Data File Listing ............................................................................ 18

2
Utah AGRC
2011 Lidar Acquisition
SUMMARY OVERVIEW
Executive Summary
This project encompasses an area in two Utah counties and encompasses about 103 square miles shown below. Data was collected in October, 2011. Study Area County Size (mi²)
Desired lidar acquisition area including the re-fly zone
Weber, Box Elder 103
Contractor
This project was completed under contract DEM111019 between Utah Automated Geographic Reference Center (Utah AGRC) and Utah State University (USU) LASSI Service Center. Primary technical point of contact information: Robert T. Pack, Ph.D., P.E [email protected] Utah State University LASSI Service Center 4110 Old Main Hill Logan, UT 84322-4110 PH 1-435-797-7049
Scope Overview
Our responsibilities included: Flight planning; Identification of ground control to be applied as airborne GNSS base stations and
for DEM processing; Aerial data acquisition; Collection of GNSS base station data during flight; Collection of GNSS RTK ground data for application in DEM accuracy testing; Processing, calibration and classification of LiDAR returns; Output of data deliverables including metadata; Compilation of Project Completion Report, including Flight, Data Processing and
LiDAR DEM Accuracy reporting in compliance with National Standards for Spatial Data Accuracy (NSSDA) guidelines.

3
Utah AGRC
2011 Lidar Acquisition
Specifications for Deliverables
The required accuracy and file formats for each delivery was as follows:
LiDAR Deliverables Grid Projection: UTM Zone 12N Horizontal Datum: NAD83(CORS96) Vertical Datum: NAVD88 using GEOID09 Tile Size: 2000 m X 2000 M Average Post Spacing: 0.85 m Average Data Density: 1.37 sh/m2 File Formats: *.las (v. 1.2) Classified Datasets: ASPRS/LAS Default Classes
Grid Model Deliverables File Format: IMG (.img) Grid Projection: UTM Zone 12N Horizontal Datum: NAV83(CORS96) Vertical Datum: NAVD88 using GEOID09 Tile Size: 2000 m X 2000 m Cell Size: 1.00m
Miscellaneous Deliverables Breakpoint Files: LAS 1.2 (.las) on specific code Metadata Files: FGDC compliant XML file. (.xml) Project Tile Index: Portable Document Format (.pdf) Completion Report: Portable Document Format (.pdf) LiDAR data acquisition was performed using a Riegl LMS Q560 airborne laser sensor system capable of up to a maximum 200 kHz pulse repetition rate and collection of full waveform returns.
Project Area Extents and Project Tile Index
The tile layout and project extents for the area surveyed is provided in Appendix A. The number of tiles collected totals 105. Tiles were designed on a 2000 m by 2000 m grid and were automatically generated.

4
Utah AGRC
2011 Lidar Acquisition
LiDAR DATA REPORT
Pre-Flight Planning
Appendix B provides a map showing flightline layout for the subject area. Table 1 provides the pre-flight mission parameters used for the project. Table 1. Pre-flight mission parameters.
Control
The area surrounding the study area was searched for candidate vertical control monuments over which the GNSS ground station could be placed. The goal was to tie to A- or B-order vertical control, while at the same time, be in or within 10 km of the study area. Benchmark WC-108 was used for this study. A GPS base station for this project was established in Weber County on NGS benchmark H 23 and was occupied for several days. This enabled the calculation of a strong static GPS solution which has been compared with the published vertical coordinates. Moreover, this GPS station was active during the lidar flight thereby enabling differential GPS corrections. The RTK GPS base station was set up directly over the this monument and the height to the antenna measured within 1 mm. This was used to compare calculated coordinates with published coordinates. In order to make proper comparisons, the height measured at a previous date needed to be adjusted according to observed HTDP point velocity published by NGS for nearby CORS stations. This point was thereby brought up to date.
Mission Summary 750 m AGL
Metric English
GSD ‐ Cross Track 0.848 m 2.8 ft
GSD ‐ Long Track 0.848 m 2.8 ft
Data Density 1.4 sh/m2 0.13 sh/ft2
Shot/Pixel Size 0.40 m 1.3 ft
Swath Width 866.0 m 2840.6 ft
Flightline Spacing 519.6 m 1704.3 ft
Shot or Frame Rate 67 kHz
Total Numbers 0.55 Gpoints
Riegl Q560

5
Utah AGRC
2011 Lidar Acquisition
Figure 1. Benchmark WC-108 in Weber County.
Final Planning – Procedures and Activities
Planning
Weather forecasts and project schedule identified an aerial acquisition window during the month of October 2011. Prior to each acquisition campaign, the following was completed:
Brief flight crew and ground support personnel on project requirements Investigate PDOP forecast for location (Flights to be conducted with PDOP below 3.0) Decision to mobilize Bob Pack to site to set up targets and GNSS base stations. Complete a reconnaissance of the project area was conducted to report on ground
conditions.
The aircraft was mobilized out of Logan, Utah and the acquisition was completed during a single day.
Summary of Supporting Documents Weber WC-108 DATASHEET.pdf– Supplied by Weber County. PDOP Plots subdirectory – contains PDOP forecasts for periods of data
acquisition. (The above listed documentation is provided in softcopy format only.)

6
Utah AGRC
2011 Lidar Acquisition
Data Processing Procedures Report
Data Storage After each flight, all raw navigation data, raw LiDAR data, raw image data, coverage data, and flight logs were off-loaded to a computer and an additional backup storage copy created.
Navigation System The airborne GNSS data were processed using GrafNet software from NovAtel. Data was also collected from nearby International GPS Service for Geodynamics (IGS) stations for the periods of the flight. Airborne GNSS data was processed based on the ITRF05 Ellipsoid model.
The computed trajectories and the base station coordinates were used in the processing of the IMU data using Inertial Explorer from Waypoint. A smoothed trajectory was produced with error estimates based on the separation between trajectories processed forward and backward in time. The trajectory files were then transformed to the NAD83(CORS96) and NAVD88(GEOID09) project datum and the UTM Zone 12N projection for use in the LiDAR processing.
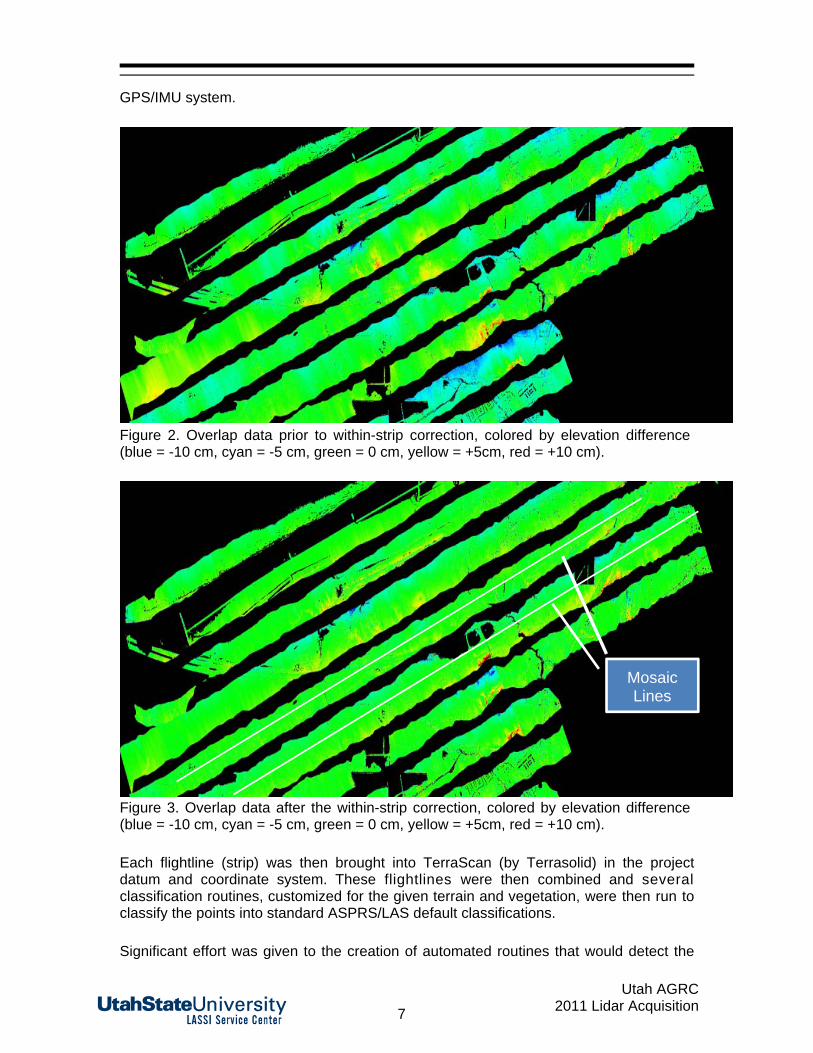
LiDAR System LiDAR waveform files were analyzed using RiAnalyze software to discriminate data points. These points are output in the internal coordinate system of the LiDAR scanner. Each data point is assigned an echo value so it can be used in point classification work. RiProcess then uses the trajectory files created from the raw navigation data to generate XYZ points in a world coordinate system. A boresight calibration and strip (single scan line) adjustment was performed in RiProcess to improve data accuracy. This project’s data were processed in strip form, meaning each flight line was processed independently. Processing the lines individually provides the data analyst with the ability to quality control (QC) the overlap between lines. To assess trajectory integrity, individual flight strips were then checked against adjacent strips to ensure good matching in the dataset. The low gradient terrain within the study area resulted in highly visible manifestations of errors within overlap regions. For example, on some of the shoreline slopes a gradual 10 cm drop in elevation occurs over a distance of 1000 m. Hence a 1 cm contour interval would be 100 m wide and a 2 cm vertical error would result in a 200 m shift in a contour location. It was therefore necessary to develop custom strip overlap adjustment methods that would not only optimize the lidar system calibration but also correct GPS/IMU navigation errors manifested within individual strips. A method has been implemented that corrects for aircraft roll and aircraft altitude error detected by analyzing elevation differences in all overlapping strips simultaneously. Figure 2 shows an example color-coded map of overlapping regions where blue equals a -10 cm difference, cyan a -5 cm difference, green 0 cm, yellow +5 cm, and red +10 cm. Figure 3 shows the same series of strips after adjustment. Because the center of the overlap zone is where adjacent strips are mosaicked via a mosaic line, it is important that these lines are consistently green. As shown in Figure 3 this is the case for all strips which results in smooth contouring across the entire project. This wouldn’t have been the case using traditional methods that ignore within-strip errors associated with the
7
Utah AGRC
2011 Lidar Acquisition
GPS/IMU system.
Figure 2. Overlap data prior to within-strip correction, colored by elevation difference (blue = -10 cm, cyan = -5 cm, green = 0 cm, yellow = +5cm, red = +10 cm).
Figure 3. Overlap data after the within-strip correction, colored by elevation difference (blue = -10 cm, cyan = -5 cm, green = 0 cm, yellow = +5cm, red = +10 cm). Each flightline (strip) was then brought into TerraScan (by Terrasolid) in the project datum and coordinate system. These flightlines were then combined and several classification routines, customized for the given terrain and vegetation, were then run to classify the points into standard ASPRS/LAS default classifications. Significant effort was given to the creation of automated routines that would detect the
Mosaic Lines

8
Utah AGRC
2011 Lidar Acquisition
river banks and lake shorelines within the subject areas. The routine then automatically creates polylines that then serve as breaklines for hydro-flattening. For this work, custom tools were developed using LAS-tools, a set of routines developed by Martin Isenburg (out of Germany), and custom Matlab scripts developed in-house. These breaklines, consisting of a series of closely spaced points were then added to the point cloud LAS files with a unique classification code. When combined in a LAS file with original lidar points, the quality of the hydro-flattening can immediately be exploited as a triangulated irregular network (TIN) in any LAS viewer or GIS system (such as ArcGIS). Using the point classifications and breakline points, digital elevation models (DEMs) of the bare earth and digital surface models (DSMs) of all points were generated for each tile and carefully checked for data quality assurance.

9
Utah AGRC
2011 Lidar Acquisition
LiDAR QUALITY CONTROL REPORT
Methodology
The QC check was intended to ensure that data would meet contractual standards set in FEMA (2003, Section A.8) and USGS NGP Guidelines v.13 (2010). Table 4 provides a summary of their standards for root mean squared error in the z (height) direction (RMSEz): Table 4. Standards for RMSEz used in this project. RMSEz Condition Source 7.0 cm Relative accuracy within individual swaths USGS 10.0 cm Within swath overlap regions USGS 12.5 cm Fundamental vertical accuracy (in the clear) USGS 18.5 cm Under all major vegetation categories in flat areas FEMA 37.0 cm Under all major vegetation categories in hilly areas FEMA
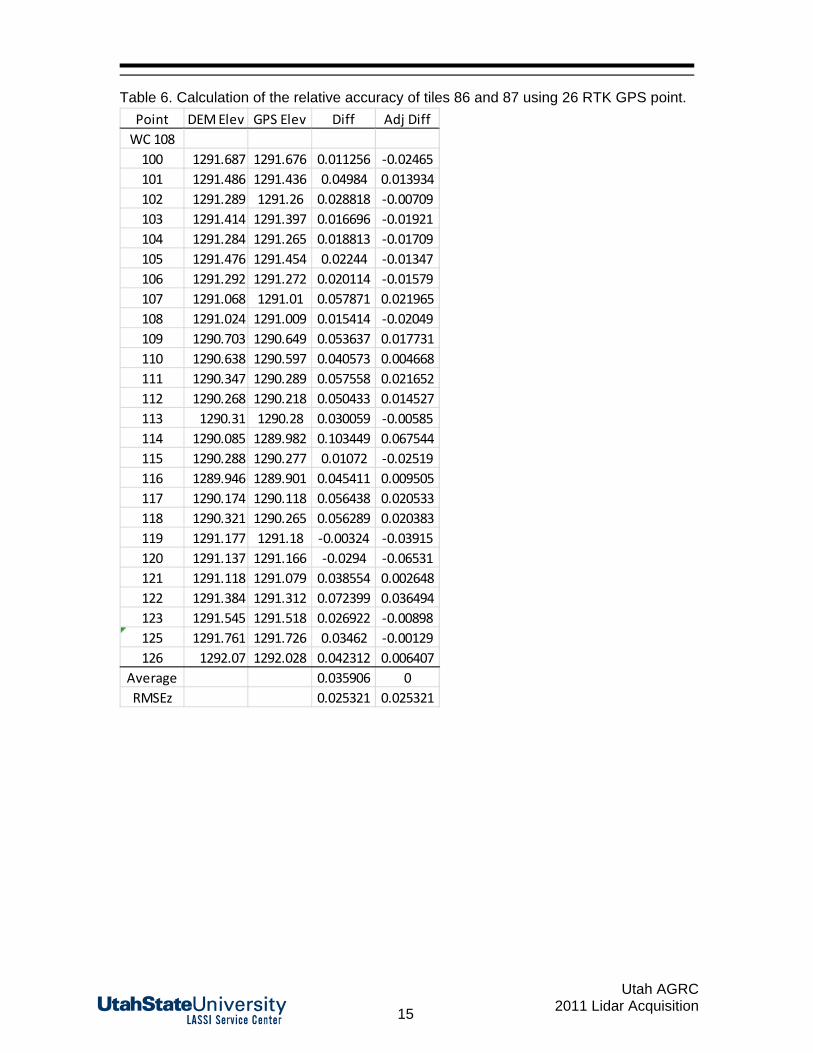
Relative Accuracy Relative DEM accuracy was checked for the urban subdivision terrain type within this project using an RTK GPS surveys. A total of 26 points were collected on streets and curbs within the vicinity of benchmark WC108. The GPS point elevations were then compared with DEM tiles 86 and 87. This resulted in an average difference of 3.5 cm where the DEM is on average higher than the GPS points. A RMSEz of 2.5 cm was determined for these 26 points which is well under the 7.0 cm specification required by the contract.
Within Swath Overlap Accuracy The mean and RMSEz difference between all DEM cells within overlapping regions has been calculated by custom Matlab scripts in USU’s custom strip adjustment software. Systematic shifts within a given overlap region are less than 1 cm and the RMSEz between overlapping surfaces is 4.4 cm These results are within the required 10 cm specification.
Fundamental Vertical Accuracy The results of the relative accuracy assessment given in Table 5 indicate that compared to the RTK points collected, the DEM was an average of 3.5 cm higher than the GPS points. Also, the RMSEz of only 2.5 cm was found. These values indicate that the fundamental vertical accuracy is well within the 12.5 cm specification required for this project. Horizontal positional accuracy was not formally tested in this project and was not a specification of this contract.

10
Utah AGRC
2011 Lidar Acquisition
Vegetation Penetration It is our understanding that this project is to be used in floodplain mapping applications. Therefore we did a check to see how well the lidar shots are penetrating the cottonwood trees that densely occupy some of the floodplain areas. In tile 61 and dense stand of cottonwoods was analyzed. Figure 4 shows a cross-section where penetration to ground is continuous and the bare earth DEM has fine topographic detail. Figure 5 shows a cross-section in tile 52 through a river oxbow. This cross-section also shows excellent lidar point penetration. After some extensive searching in the project area, some cottonwoods were found in tile 51 that could not be penetrated across a gap of about 10 m. Figure 6 shows this case. It is therefore expected that this is a worst case for this project area.
Figure 4. Cross-section through the river floodplain in tile 61.

11
Utah AGRC
2011 Lidar Acquisition
Figure 5. Cross-section through an oxbow in tile 52.
Figure 6. Cross-section showing a 10 m gap in the bare-earth model due to heavy cottonwoods in tile 51. This situation is relatively rare in the study area.

12
Utah AGRC
2011 Lidar Acquisition
Conclusions
Given results given above, the following can be concluded:
There is a tested < 2.5 cm RMSEz relative accuracy, There is a tested < 5 cm RMSEz overlap accuracy, and There is a tested < 3.5 cm RMSEz fundamental vertical accuracy.

13
Utah AGRC
2011 Lidar Acquisition
FLIGHT REPORT
USU’s Cessna 208B Skywagon remote sensing aircraft, N4630F, based out of Logan, Utah was utilized on this project. This aircraft was mobilized out of Logan Municipal Airport, Utah. The actual local flight time and duration of flights were controlled by weather, fuel consumption of the aircraft on the commute from Logan, Utah, and safety of flight operations around Hill Air Force Base. This limited our flexibility in planning for times when the GNSS constellation was most favorable thereby producing the highest number of satellites visible in the best geometric configuration relative to the GNSS receivers onboard the aircraft as well as at the base station on the ground. Two flights were performed on November 18, 2011. The two flights originated from Logan, Utah. At the beginning of the day, a calibration flight pattern was flown over the USU campus. This enabled the improvement of IMU to Lidar alignment which has a tendency to drift in virtually every lidar system. Navigation File(s): A listing GPS base station files and raw flightline (LiDAR) files is given in Appendix C.

14
Utah AGRC
2011 Lidar Acquisition
GROUND CONTROL REPORT
Introduction
A LiDAR survey was conducted for the purposes of developing a high-accuracy digital terrain model (DTM) of the Great Salt Lake Wetlands project area. In support of this work, ground control was established near the project area. This report summarizes the results.
RTK Ground Control Survey
Data Collection
RTK measurements were made with a Topcon GR-5 GNSS (including GLONASS) base/rover pair.
Data Processing and Analysis
Processing steps performed at benchmark WC 108 include ellipsoid to orthometric height conversion, and horizontal time-dependent processing of point velocities for epoch adjustment, and target leveling relative to the benchmark. The benchmark coordinate for the benchmark was provided by Weber County. A summary of their data is given in Table 5. Table 6 provides a listing of the differences in DEM height relative to the GPS points for each of the 27 points measured. Table 5. Ground control data for benchmark WC 108 maintained by Weber County.
Lat LongOgden FEMAWC-108 Weber Co 2000 41 09 50.1 (N) 112 08 33.3 (W) 1292.073 1275.083" 2011 " " 1292.059 1275.069
Ellip.HT (m)
Station NGS PIDEpoch Date
NAD83(HARN/1994) NAVD88 (m)
15
Utah AGRC
2011 Lidar Acquisition
Table 6. Calculation of the relative accuracy of tiles 86 and 87 using 26 RTK GPS point.
Point DEM Elev GPS Elev Diff Adj Diff
WC 108
100 1291.687 1291.676 0.011256 ‐0.02465
101 1291.486 1291.436 0.04984 0.013934
102 1291.289 1291.26 0.028818 ‐0.00709
103 1291.414 1291.397 0.016696 ‐0.01921
104 1291.284 1291.265 0.018813 ‐0.01709
105 1291.476 1291.454 0.02244 ‐0.01347
106 1291.292 1291.272 0.020114 ‐0.01579
107 1291.068 1291.01 0.057871 0.021965
108 1291.024 1291.009 0.015414 ‐0.02049
109 1290.703 1290.649 0.053637 0.017731
110 1290.638 1290.597 0.040573 0.004668
111 1290.347 1290.289 0.057558 0.021652
112 1290.268 1290.218 0.050433 0.014527
113 1290.31 1290.28 0.030059 ‐0.00585
114 1290.085 1289.982 0.103449 0.067544
115 1290.288 1290.277 0.01072 ‐0.02519
116 1289.946 1289.901 0.045411 0.009505
117 1290.174 1290.118 0.056438 0.020533
118 1290.321 1290.265 0.056289 0.020383
119 1291.177 1291.18 ‐0.00324 ‐0.03915
120 1291.137 1291.166 ‐0.0294 ‐0.06531
121 1291.118 1291.079 0.038554 0.002648
122 1291.384 1291.312 0.072399 0.036494
123 1291.545 1291.518 0.026922 ‐0.00898
125 1291.761 1291.726 0.03462 ‐0.00129
126 1292.07 1292.028 0.042312 0.006407
Average 0.035906 0
RMSEz 0.025321 0.025321
16
Utah AGRC 2011 Lidar Acquisition
APPENDIX A – Index Maps and Area Boundaries

17
Utah AGRC 2011 Lidar Acquisition
APPENDIX B – Flight Plan Map
N

18
Utah AGRC 2011 Lidar Acquisition
APPENDIX C – Raw Data File Listing
LIDAR FILES NAVIGATION FILES