oii-0539618 phase i final report -...
TRANSCRIPT
OII-0539618 Phase I Final Report
Three-Dimensional Microscopy of Surfaces by Grazing Incidence Diffraction Phase I SBIR Final Report
OII-0539618 July 14, 2006
DeWitt Brothers Tool Company, Inc.
237 Lafayette St. New York, NY 10012
Thomas D. Ditto, P.I.
Dr. Douglas A. Lyon, Consultant New Light Industries, Ltd., Subcontractor
Table of Contents
Background to the present research………………………………… p. 1 1.0 Research Carried Out……………………………………………….. p. 1 1.1 Efficiency……………………………………………………………. p. 2 1.2 Resolution…………………………………………………………… p. 3 1.3 Laser Illumination…………………………………………………… p. 7 1.4 Models in MathCad and Zemax……………………………………… p. 8 2.0 Obstacles encountered and overcome……………………………… p.11 3.0 Obstacles remaining…………………………………………………. p.12 4.0 Phase II Objectives…………………………………………………… p.13 References…………………………………………………………… p.13 Proprietary information……………………………………………….. p.14
Summary This Report describes a microscope primary objective made from a variable pitch grating in a grazing incidence configuration as used in a 3D profilometer. The primary objective is a surface relief holographic optical element (HOE) fabricated in photo resist and then coated with gold. The microscope was tested for resolution over a range of 5.00 mm. In the far-field, the resolving power was accurate within 10 μm, the limit of spatial sensitivity of our testing equipment. From 0.00 mm to 5.00 mm, an overall range error of 3% was observed. The primary objective HOE has an efficiency of less than 2.5% in its first-order, but 29% first-order efficiency has been demonstrated in a non-imaging test hologram. The footprint of the laser used for structured illumination was shown to vary by less than 50 microns width over the 5.00 mm distance ranged. The laser suffers from mode hops that cause instability. A baseline reference was incorporated into experiments to compensate for this error. Speckle artifacts were endemic. These were dealt with by computer image processing. Mathematical models were developed which guided HOE fabrication at 441 nm for the selected playback wavelength of 635 nm. Zemax® software was used to model a secondary cylindrical lens which overcomes astigmatism found in the primary. Our prototype was tested by ranging a narrow bore that is typical of thread spinnerets, the niche inspection marketplace of a supporting manufacturer. Also, an improvement in the secondary was invented by the P.I. and may be separately patentable.

OII-0539618 Phase I Final Report 1
Background to the present research Range finding by diffraction is a new method for acquiring distance readings
employing a diffraction grating as the primary objective in an optical system. The method converts variations in the radius of a periodic wave front striking the grating into measurable spatial displacements of higher-order diffraction images at a secondary. The method was invented by the P.I. in 1984 and patented in 1987. The first Claim reads:
A method for determining range by correlating the relationship between the distances of a diffraction grating from an illuminated target surface with the respective relative displacements of high order diffraction images from the position of the respective zero order image as observed through said grating.1
During a 1995-97 NSF SBIR Phase II, it was shown that perspective foreshortening in a diffraction range finder could be eliminated with a properly specified variable pitch (chirp) grating.2 A patent application for the variable pitch grating diffraction range finder was filed under the PCT in 1996 and is now in force in Europe and US and is currently being examined in Japan.3 The joint-inventors are the present P.I., Thomas D. Ditto, and his consultant on the present research, Dr. Douglas A. Lyon. The patent is assigned to DeWitt Brothers Tool Company, Inc. (DeWitt) which is performing the present research.
In 1998 a hologram in silver halide on glass with a 70° incidence angle was created for DeWitt by Rudie Berkhout, an artist/holographer. The incidence angle was short of grazing but illustrated the magnification feature predicted by mathematical models. The P.I. delivered an SPIE paper on this research in 20044 and proposed making the microscope primary objective according to his specifications in a 2005 proposal to the NSF. A Phase I SBIR grant was issued in 2006. This is our Report.
1.0 Research Carried Out The proposed project was principally aimed at determining by experiment whether the
anamorphic magnification feature predicted by existing theory could be imaged at an angle of grazing incidence. Questions to be answered empirically covered the topics of grating efficiency at angles of grazing incidence (Section 1.1), the resolving power of the grating (Section 1.2), and artifacts introduced by the laser illumination - both the relatively large laser beam footprint and any coherence speckle (Section 1.3). Also the theoretical behavior was to be tested using the optics software program Zemax-EE which makes predictions of Modulation Transfer Function (MTF) and Point Spread Function (PSF) for optical trains with holographic optical elements (Section 1.4).
The specified grating was a surface relief reflection hologram made by Steve McGrew of New Light Industries (NLI) in Spokane under a subcontract. It was a holographic optical element (HOE) in Shipley photo resist. The holographic plate was manufactured by Towne Technologies on a 3mm glass substrate with a flatness specification consistent with high quality float glass with a deviation less than 0.000150” per linear inch. The 6x6 inch Towne plates have an iron-oxide coating for both blue absorption and internal reflection suppression. The plate was exposed at 441 nm using a 15 mW HeCd gas blue laser.
OII-0539618 Phase I Final Report 2
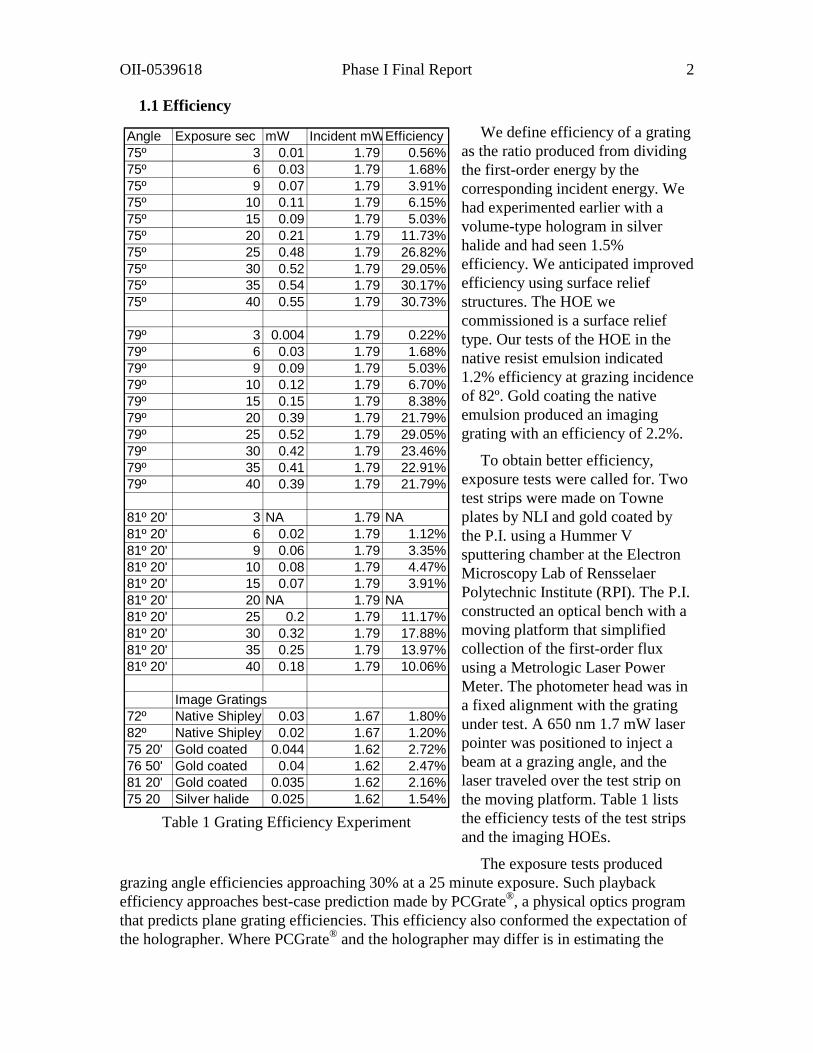
1.1 Efficiency We define efficiency of a grating
as the ratio produced from dividing the first-order energy by the corresponding incident energy. We had experimented earlier with a volume-type hologram in silver halide and had seen 1.5% efficiency. We anticipated improved efficiency using surface relief structures. The HOE we commissioned is a surface relief type. Our tests of the HOE in the native resist emulsion indicated 1.2% efficiency at grazing incidence of 82º. Gold coating the native emulsion produced an imaging grating with an efficiency of 2.2%.
To obtain better efficiency, exposure tests were called for. Two test strips were made on Towne plates by NLI and gold coated by the P.I. using a Hummer V sputtering chamber at the Electron Microscopy Lab of Rensselaer Polytechnic Institute (RPI). The P.I. constructed an optical bench with a moving platform that simplified collection of the first-order flux using a Metrologic Laser Power Meter. The photometer head was in a fixed alignment with the grating under test. A 650 nm 1.7 mW laser pointer was positioned to inject a beam at a grazing angle, and the laser traveled over the test strip on the moving platform. Table 1 lists the efficiency tests of the test strips and the imaging HOEs.
The exposure tests produced grazing angle efficiencies approaching 30% at a 25 minute exposure. Such playback efficiency approaches best-case prediction made by PCGrate®, a physical optics program that predicts plane grating efficiencies. This efficiency also conformed the expectation of the holographer. Where PCGrate® and the holographer may differ is in estimating the
Angle Exposure sec mW Incident mWEfficiency75º 3 0.01 1.79 0.56%75º 6 0.03 1.79 1.68%75º 9 0.07 1.79 3.91%75º 10 0.11 1.79 6.15%75º 15 0.09 1.79 5.03%75º 20 0.21 1.79 11.73%75º 25 0.48 1.79 26.82%75º 30 0.52 1.79 29.05%75º 35 0.54 1.79 30.17%75º 40 0.55 1.79 30.73%
79º 3 0.004 1.79 0.22%79º 6 0.03 1.79 1.68%79º 9 0.09 1.79 5.03%79º 10 0.12 1.79 6.70%79º 15 0.15 1.79 8.38%79º 20 0.39 1.79 21.79%79º 25 0.52 1.79 29.05%79º 30 0.42 1.79 23.46%79º 35 0.41 1.79 22.91%79º 40 0.39 1.79 21.79%
81º 20' 3 NA 1.79 NA81º 20' 6 0.02 1.79 1.12%81º 20' 9 0.06 1.79 3.35%81º 20' 10 0.08 1.79 4.47%81º 20' 15 0.07 1.79 3.91%81º 20' 20 NA 1.79 NA81º 20' 25 0.2 1.79 11.17%81º 20' 30 0.32 1.79 17.88%81º 20' 35 0.25 1.79 13.97%81º 20' 40 0.18 1.79 10.06%
Image Gratings72º Native Shipley 0.03 1.67 1.80%82º Native Shipley 0.02 1.67 1.20%75 20' Gold coated 0.044 1.62 2.72%76 50' Gold coated 0.04 1.62 2.47%81 20' Gold coated 0.035 1.62 2.16%75 20 Silver halide 0.025 1.62 1.54%
Table 1 Grating Efficiency Experiment

OII-0539618 Phase I Final Report 3
requisite groove depth. PCGrate® predicted 50-100 nm groove depths. The 25 minute exposures suggest that groove depths are closer to ½ wavelength of the 650 nm incident radiation or 325 nm suggested by the holographer. Scanning Electron Microscope studies of the groove profiles were being readied at RPI as Phase I ended. Groove profiles of grating segments may yet be recorded prior to filing the Phase II proposal.
1.2 Resolution
We have made public a generalized resolution model for diffraction range finders. 5 The model can be applied to grazing incidence in either telescopic or microscopic regimes and suggests that our instrument can achieve near micron resolution. Empirical evidence to support the conjecture was collected using a bench set up that parallels conventional triangulation range finders. Triangulation has become a defacto industry standard.
laser stripe projector
cameradiffraction grating
target
mirror
β
Figure 1 Combined Triangulation and Diffraction Range Finder Set-Up
To obtain the comparison, we pivoted the HOE on a micro-positioner so that a reflection grating could serve as a mirror in its zero-order for a triangulation image. The set up is illustrated in Figure 1 above. In this set-up, the camera shared a triangulation view of a test fixture with our imaging HOE. A critical parameter for both range methods, triangulation and diffraction, is the occlusion liability angle, β, which measures susceptibility to shadowing artifacts introduced by near-field obstructions. Both methods suffer a trade-off between occlusion liability and range sensitivity tied to angle β.

OII-0539618 Phase I Final Report 4
A standard test target is a 1/10th inch step block. Viewed flat on in ambient illumination, the block contains gray scale but no range information.
Figure 2 Test block viewed flat on without range data
In Figure 3 we show the triangulation image with a 75º occlusion liability, β.
Figure 3 Triangulation range image of test block
Rotating the grating so that first-order diffraction image is reconstructed at the camera, we obtain Figure 4a wherein the excursion of the 1/10th step covers the entire camera field-of-view. By way of comparison, in Figure 4b we show the image of Figure 3 above magnified digitally by a factor of 10 in the y axis.
Both images of Figure 4 achieve the same deflection but they differ distinctly in the
grain artifacts. Speckle in the diffraction image is much greater. The digitally magnified triangulation image suffers from a “fat pixel” effect that coarsens measurements.
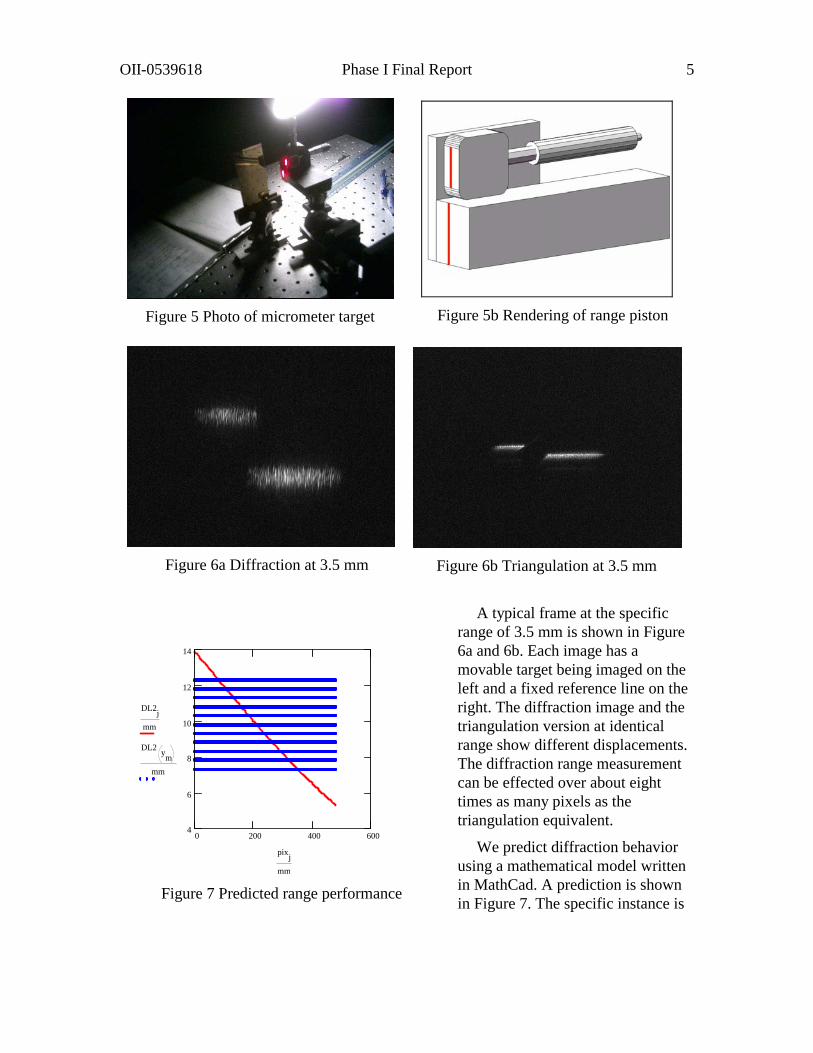
We leave detailed numerical comparison with triangulation for our Phase II proposal. To numerically quantify the behavior of diffraction range finding itself, we employed a micrometer with 10 μm vernier divisions and repositioned a target at 500 micron intervals. Data was taken with an occlusion liability angle β of 48º where 38º was the angle subtended by the incident laser and approximately 10º was the grazing angle from the target to the diffraction grating. The incident angle varies with the target distance, because the change in this angle causes the change in the reconstruction that is the basis of our range measurement. A photograph of test fixture is shown in Figure 5a and a rendering is shown in Figure 5b.
Figure 4b Triangulation stretched 10 times
Figure 4a Diffraction image - unmagnified
OII-0539618 Phase I Final Report 5
A typical frame at the specific
range of 3.5 mm is shown in Figure 6a and 6b. Each image has a movable target being imaged on the left and a fixed reference line on the right. The diffraction image and the triangulation version at identical range show different displacements. The diffraction range measurement can be effected over about eight times as many pixels as the triangulation equivalent.
We predict diffraction behavior using a mathematical model written in MathCad. A prediction is shown in Figure 7. The specific instance is
Figure 5 Photo of micrometer target
Figure 5b Rendering of range piston
Figure 6b Triangulation at 3.5 mm
Figure 6a Diffraction at 3.5 mm
0 200 400 6004
6
8
10
12
14
DL2jmm
DL2 ymmm
pixjmm
Figure 7 Predicted range performance
OII-0539618 Phase I Final Report 6
the excursion over 5 mm with a 7.5 mm stand-off by 0.50 mm steps accurate to within 10 microns per pixel, with an occlusion liability β of 52º. The overall response curve is in red. The measured increments are hashed by the blue lines.
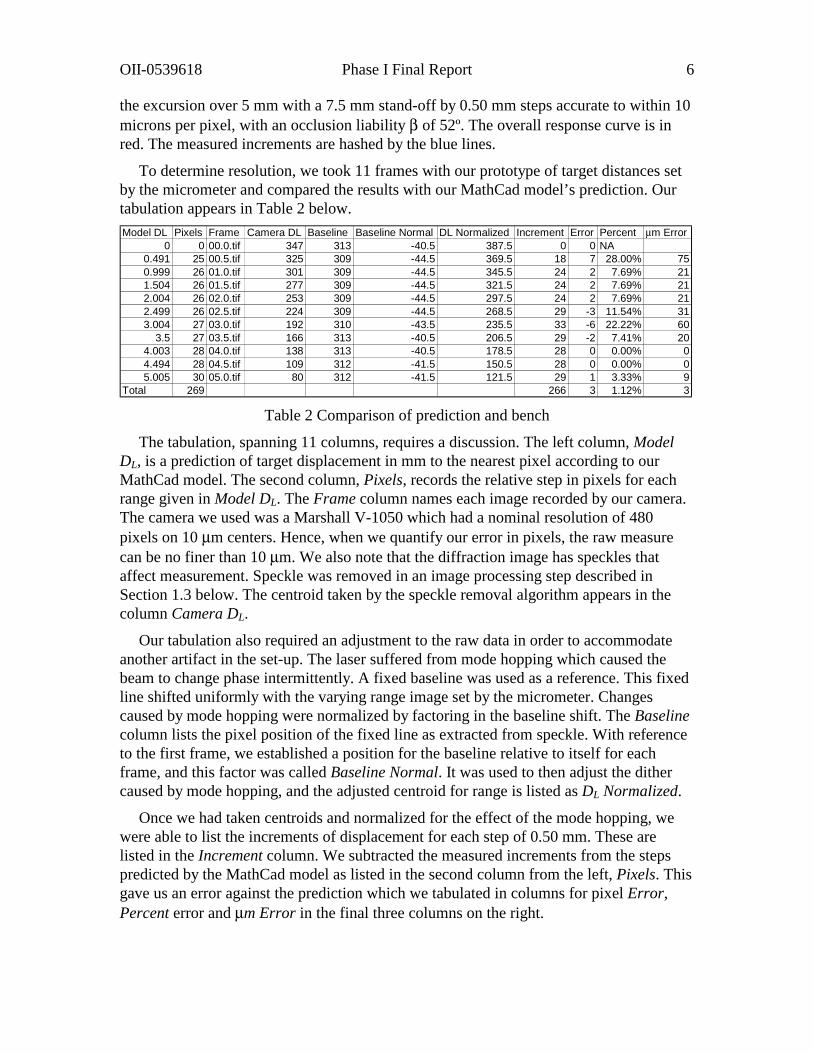
To determine resolution, we took 11 frames with our prototype of target distances set by the micrometer and compared the results with our MathCad model’s prediction. Our tabulation appears in Table 2 below. Model DL Pixels Frame Camera DL Baseline Baseline Normal DL Normalized Increment Error Percent μm Error
0 0 00.0.tif 347 313 -40.5 387.5 0 0 NA0.491 25 00.5.tif 325 309 -44.5 369.5 18 7 28.00% 750.999 26 01.0.tif 301 309 -44.5 345.5 24 2 7.69% 211.504 26 01.5.tif 277 309 -44.5 321.5 24 2 7.69% 212.004 26 02.0.tif 253 309 -44.5 297.5 24 2 7.69% 212.499 26 02.5.tif 224 309 -44.5 268.5 29 -3 11.54% 313.004 27 03.0.tif 192 310 -43.5 235.5 33 -6 22.22% 60
3.5 27 03.5.tif 166 313 -40.5 206.5 29 -2 7.41% 204.003 28 04.0.tif 138 313 -40.5 178.5 28 0 0.00% 04.494 28 04.5.tif 109 312 -41.5 150.5 28 0 0.00% 05.005 30 05.0.tif 80 312 -41.5 121.5 29 1 3.33% 9
Total 269 266 3 1.12% 3 Table 2 Comparison of prediction and bench
The tabulation, spanning 11 columns, requires a discussion. The left column, Model DL, is a prediction of target displacement in mm to the nearest pixel according to our MathCad model. The second column, Pixels, records the relative step in pixels for each range given in Model DL. The Frame column names each image recorded by our camera. The camera we used was a Marshall V-1050 which had a nominal resolution of 480 pixels on 10 μm centers. Hence, when we quantify our error in pixels, the raw measure can be no finer than 10 μm. We also note that the diffraction image has speckles that affect measurement. Speckle was removed in an image processing step described in Section 1.3 below. The centroid taken by the speckle removal algorithm appears in the column Camera DL.
Our tabulation also required an adjustment to the raw data in order to accommodate another artifact in the set-up. The laser suffered from mode hopping which caused the beam to change phase intermittently. A fixed baseline was used as a reference. This fixed line shifted uniformly with the varying range image set by the micrometer. Changes caused by mode hopping were normalized by factoring in the baseline shift. The Baseline column lists the pixel position of the fixed line as extracted from speckle. With reference to the first frame, we established a position for the baseline relative to itself for each frame, and this factor was called Baseline Normal. It was used to then adjust the dither caused by mode hopping, and the adjusted centroid for range is listed as DL Normalized.
Once we had taken centroids and normalized for the effect of the mode hopping, we were able to list the increments of displacement for each step of 0.50 mm. These are listed in the Increment column. We subtracted the measured increments from the steps predicted by the MathCad model as listed in the second column from the left, Pixels. This gave us an error against the prediction which we tabulated in columns for pixel Error, Percent error and μm Error in the final three columns on the right.
OII-0539618 Phase I Final Report 7
We noted the better performance in the far-field. This behavior was corroborated by an experiment using a flat wedge target that was ranged over approximately 1 cm. As shown in Figure 9, the predicted performance for 1 cm is superimposed over the range image. Note that the slope of the curve decreases as measured range increases. The behavior is the inverse of the perspective foreshortening endemic to all triangulation range finders. Pseudoscopic perspective inversion is known to holography. It has a benefit
in a range finder, because it offers resolution proportional to distance. We believe that reverse perspective explains the discrepancy in Table 2 where error in the near-field at 0.50mm was greater than error in the far-field (3.50 -5.00 mm).
1.3 Laser illumination
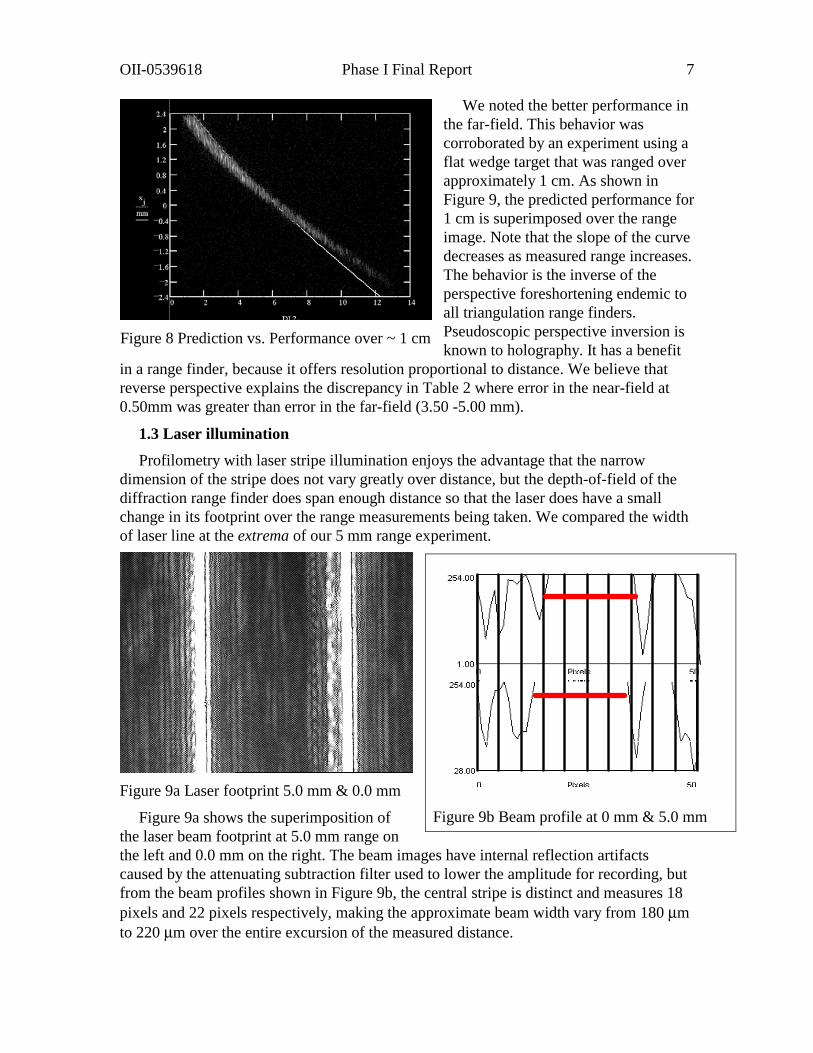
Profilometry with laser stripe illumination enjoys the advantage that the narrow dimension of the stripe does not vary greatly over distance, but the depth-of-field of the diffraction range finder does span enough distance so that the laser does have a small change in its footprint over the range measurements being taken. We compared the width of laser line at the extrema of our 5 mm range experiment.
Figure 9a Laser footprint 5.0 mm & 0.0 mm
Figure 9a shows the superimposition of the laser beam footprint at 5.0 mm range on the left and 0.0 mm on the right. The beam images have internal reflection artifacts caused by the attenuating subtraction filter used to lower the amplitude for recording, but from the beam profiles shown in Figure 9b, the central stripe is distinct and measures 18 pixels and 22 pixels respectively, making the approximate beam width vary from 180 μm to 220 μm over the entire excursion of the measured distance.
Figure 8 Prediction vs. Performance over ~ 1 cm
Figure 9b Beam profile at 0 mm & 5.0 mm
OII-0539618 Phase I Final Report 8
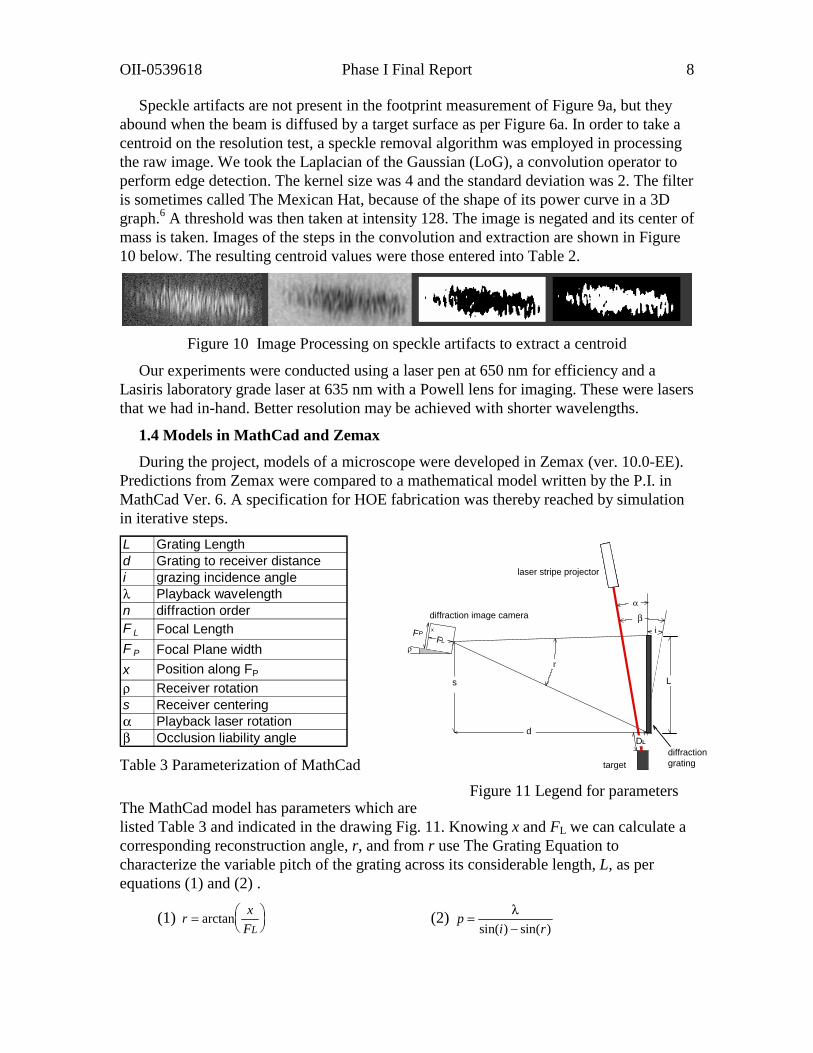
Figure 11 Legend for parameters
Speckle artifacts are not present in the footprint measurement of Figure 9a, but they abound when the beam is diffused by a target surface as per Figure 6a. In order to take a centroid on the resolution test, a speckle removal algorithm was employed in processing the raw image. We took the Laplacian of the Gaussian (LoG), a convolution operator to perform edge detection. The kernel size was 4 and the standard deviation was 2. The filter is sometimes called The Mexican Hat, because of the shape of its power curve in a 3D graph.6 A threshold was then taken at intensity 128. The image is negated and its center of mass is taken. Images of the steps in the convolution and extraction are shown in Figure 10 below. The resulting centroid values were those entered into Table 2.
Figure 10 Image Processing on speckle artifacts to extract a centroid
Our experiments were conducted using a laser pen at 650 nm for efficiency and a Lasiris laboratory grade laser at 635 nm with a Powell lens for imaging. These were lasers that we had in-hand. Better resolution may be achieved with shorter wavelengths.
1.4 Models in MathCad and Zemax
During the project, models of a microscope were developed in Zemax (ver. 10.0-EE). Predictions from Zemax were compared to a mathematical model written by the P.I. in MathCad Ver. 6. A specification for HOE fabrication was thereby reached by simulation in iterative steps.
laser stripe projector
diffraction image camera
diffraction grating target
α
β
r
DL
s
i
d
ρ
L
x
FLFP
The MathCad model has parameters which are listed Table 3 and indicated in the drawing Fig. 11. Knowing x and FL we can calculate a corresponding reconstruction angle, r, and from r use The Grating Equation to characterize the variable pitch of the grating across its considerable length, L, as per equations (1) and (2) .
(1) r xFL
= ⎛⎝⎜
⎞⎠⎟
arctan (2) pi r
=−λ
sin( ) sin( )
L Grating Lengthd Grating to receiver distancei grazing incidence angleλ Playback wavelengthn diffraction orderF L Focal LengthF P Focal Plane widthx Position along FP
ρ Receiver rotations Receiver centeringα Playback laser rotationβ Occlusion liability angle Table 3 Parameterization of MathCad

OII-0539618 Phase I Final Report 9
Our HOE is graphed in Figure 12. Gratings of this type cannot be ruled by engines but are readily fabricated using simple holographic methods from the interference of a plane wave and a spherical wave. The chirp is parabolic over a pitch range that is sub-wave length.
The performance of this range finder can then be predicted by equation
(3) D d r sL = −
−κ
α κ α( tan( ) )
cos( ) sin( ) where
(4) κ
λ
λ=
− +⎛⎝⎜
⎞⎠⎟
+
12
np
r
np
r
sin( )
sin( )
Equations (1) – (4), derived elsewhere,7 were used to generate the predictions of Table 2 and Figures 7, 8 and 12.
The MathCad model played a significant role in specifying the fabrication of HOE commissioned from NLI, because the exposure wavelength was shorter than the playback wavelength. The parameters d and i were affected. For the exposure in blue at 441 nm we determined that d = 295 mm and i = 43.5º. For playback in red at 635 nm we then were able to set d = 200 nm and 81.5º < i < 83.3º. An annotated schematic of the exposure set-up is shown in Figure 13.
HeCd
Parabolic Mirror
Microscope Objective
Flat Mirror Flat mirror
Variable Beamsplitter
Holographic Plate
Microscope Objective
43.5º
295 mm
Figure 13 HOE fabrication bench set-up showing angle i and distance d
The difference between recording and playback wavelengths benefited the holographer, because the reference wave from the parabolic mirror struck the plate with more light than would have been available at an angle of grazing incidence, i ~ 85º.
0 10 20 30 40 50550
600
650
700
750
pjnm
L gjmm
Figure 12 Variable pitch across grating

OII-0539618 Phase I Final Report 10
However, analysis using MathCad suggests that the installation of this grating in a microscope is less tolerant of mechanical positioning errors than it would have been if recording and playback were at the same wavelength. We modeled the response of incidence angle to reconstruction angle under playback of our HOE as compared to a grating where exposure and playback were at the same wavelength, shown in Figure 14.
81 82 83 8420
10
0
10
20
rjdeg
ijdeg
We used the central linear portion of the playback of Figure 14 b for our experiments, but the aberration was readily observed when the set-up was slightly misaligned.
Another aberration, astigmatism, was readily apparent when modeling under Zemax, an optical engineering application. The HOE is an anamorphic magnifier. On the image plane, focus is not possible for both axes at the same time. The spot diagram for three field points, Figure 15, shows this clearly on the left where the scale bar reads 1000 μm in the marked dimension. We modeled a correction using a standard cylinder lens at the exit pupil as shown on the right hand side of Figure 15. The scale bar now reads 40 μm, that is, focus is achieved over four adjacent pixels. This correction is in the modeling state. We did not implement the correction in the prototype itself which suffers from astigmatism.
.
We modeled a complete system under Zemax 10.0 EE which included a pinhole aperture of 500 μm along with the astigmatism correction. Nine ray paths are shown in Figure 16. The Zemax model was particularly important for corroborating the MathCad
80 85 9020
10
0
10
20
rjdeg
ijdeg
Figure 14 b λ = 441 nm exposure & = 635 nm playback
Figure 14a λ = 441 nm for both exposure & playback
Figure 15 The native astigmatism shown by three sample field points above can be corrected with a cylinder lens to the right.

OII-0539618 Phase I Final Report 11
predictions prior to specifying the HOE. Additionally, Zemax provides a host of analytic tools including the MFT and PSF transforms which indicate resolving power and power distribution at the diffraction limit. In an interesting exchange with the software publisher, we were cautioned that our use of the software entered an area that might be “non-physical,” that is, they had no prior knowledge of HOE simulation remotely like ours. So far Zemax predictions have been born out by bench testing.
2.0 Obstacles encountered and overcome A principal obstacle we faced was finding a laser for structured illumination. As we
conceived the project, we would buy a blue laser out-of-pocket, since the item could not be budgeted in Phase I. Steve McGrew at NLI counseled against the purchase, because in a Phase I project, the demonstration of capability with available materials leads to a capital expense line in Phase II. On further review, it turned out that fabrication of the HOE was going to be much easier if it was fabricated in blue and then played back with a red laser such as the one we had in-hand. As a result, we went through the lengthy analysis and rechecking by multiple methods to confirm that the reconfiguration of the NLI bench would produce the specified playback. Our prediction was confirmed with the first test, and the NLI bench set-up geometry never needed to be further adjusted.
Figure 16 System in Zemax with PSF and MTF for selected field points

OII-0539618 Phase I Final Report 12
However, the first test grating was so inefficient that an image was never recorded. Even with a low light level camera, only an experienced eye could detect the sought after magnification feature. The second iteration of fabrication produced gratings in native Shipley resist without reflective coating were no ore efficient than our silver halide hologram from 1998. They needed a reflective coating, but NLI did not have a coating system available during the Phase I period. Fortunately, RPI’s Electron Microscopy Laboratory under the administration of Raymond Dove was made available to the P.I., and they had a Hummer V sputter coating machine. Its 4 inch diameter Bell jar only accommodated one small image grating, and it was the one used for imaging in Phase I. The gold plated reflective HOE also had a dismal efficiency, but at 2.4 % we could form images with our V-1050 CCD. It was mandatory that we improve efficiency, so NLI started making small test exposures running up the clock from 3 minutes to 40 minutes per exposure. At 25 minutes the HOEs exhibited 29% efficiency at nearly 80º grazing incidence. Phase I ran out before an image grating was made to this efficiency, but NLI has committed in writing to both making the HOE and coating it themselves during the next few months, so it can be reported in our Phase II proposal.
Poor HOE efficiency caused us to rethink the microscope secondary. We invented a new element for the secondary which increased available light by an order of magnitude. This invention appears on the proprietary page at the end of this Report. We also learned that the secondary grating reported as proprietary in our Phase I application had been previously patented. However, Zemax allowed us to model the geometry of the secondary optics to avoid the radical Scheimpflug angle we feared, so a patent license to that prior art proved unnecessary in this application.
3.0 Obstacles remaining
First, we do need a better structured illumination laser, even if we remain at 635 nm, because the laser we have is not regulated and exhibits mode hops. Phase errors in our laser resulted in a quantum shifts in the diffraction image position. Also, footprint size should be reduced, since it exceeds depth resolution by over an order of magnitude.
Secondly, we must overcome speckle. There is a direct optical method we would like to employ in the future. If a specimen is shifted laterally and recorded temporally, the speckles overlap and self-cancel. We demonstrated the effect by manually moving our step target during exposure. We need a computer controlled motion platform for either the specimen or the microscope.
We also need a camera with a controllable exposure period. Motorized micropositioners for all bench setups would improve the accuracy of our measurements.
Figure 17 Speckle removal by mechanical motion

OII-0539618 Phase I Final Report 13
A third obstacle is astigmatism in our primary objective. It proved to be a factor when making precise measurements. We were able to remove the effect in our resolution test by relying on one axis of focus and ignoring the second axis entirely. Review Figure 6 to see that the diffraction image does not resolve the spacing between the baseline and the moving micrometer piston as the triangulation image does. Research is needed to select the most effective option for a correction. Cylindrical lenses appear to work when modeled in Zemax, but we must decide where they will appear in the optical train.
The method of magnification we are developing promises a high width-to-depth ratio. To achieve the full potential for 3D inspection, the primary objective needs to be larger, and the broadened laser projection beam needs to be collimated.
Although Zemax offers a facility for setting tolerances of surface flatness, the feature has not yet been invoked. Since the HOE may be formed on anything from plastic substrates to optical flats, we must know how this parameter affects resolving power.
4.0 Phase II Objectives
We are working with a manufacturer of inspection microscopes, Aspex, Inc., which has a need for intra-cavity inspection. We built a jig that duplicated the width and depth of a spinneret hole. We lowered occlusion liability to β = 10º. A resulting image, Figure 18, shows the side wall and the bottom of the well, providing range data suitable for their product line of inspection instruments. We are expecting a Letter of Support from Aspex. In Phase II we will mount our microscope to their Spintrak® inspection microscope. This
will provide both an immediate marketplace for our invention and give us a demonstration unit suitable for presentation to others needing 3D microscopes.
References 1 Thomas D. De Witt, “Range finding by diffraction, US Patent 4,678,324, July 7, 1987 2DMI-9420321 3 Thomas D. Ditto and Douglas A. Lyon, “RESEAU OPTIQUE A PAS VARIABLE POUR SYSTEME DE DETECTION DE PLAGE DE DIFFRACTION”, PCT/US1997/023841, February 9, 1999 4 Thomas D. Ditto, “Three-dimensional microscopy using diffraction grating primary objective” Photonics North 2004, SPIE Vol. 5578 p. B-24 5 http://home.earthlink.net/~scan3d/acrobat/3D_Microscopy.pdf see p. 6 ff 6 Douglas A. Lyon, Image Processing in Java, Prentice Hall, 1999, p. 240-41 7 Thomas D. DeWitt and Douglas A. Lyon “A Range Finding Method Using Diffraction Gratings,” Applied Optics, May, 10, 1995, Vol 34, No. 14, pp. 2510-2521.
Tom Ditto and Douglas A. Lyon, “Moly: a prototype handheld 3D digitizer with diffraction optics,” Optical Engineering, Vol. 39, No. 1, Jan. 2000. pp. 69-78
Figure 18 A 3.3 mm hole penetrated to 17.5 mm