oil and gas 101 training at eic2017 - us epa · artificial lift engines • emissions based on...
TRANSCRIPT

Oil and Gas 101: An Overview of Oil and
Gas Upstream Activities and Using
EPA’s Nonpoint Oil and Gas Emission
Estimation Tool for the 2017 NEI
Jennifer Snyder, U.S. EPA
Regi Oommen and Mike Pring, Eastern Research Group
August 15, 2017
2017 Emission Inventory Conference
Baltimore, MD
8/24/2017 U.S. Environmental Protection Agency 2
Presenters• Mike Pring, Eastern Research Group
• Jennifer Snyder, U.S. EPA
• Regi Oommen, Eastern Research Group
8/24/2017 U.S. Environmental Protection Agency 3
Training Overview• Oil and gas production in the United States
• Upstream oil and gas emission sources
• Data resources
• Oil and gas emission estimates in the NEI
• Future plans
• Use and application of the Nonpoint Oil and
Gas Emission Estimation Tool

8/24/2017 U.S. Environmental Protection Agency 4
Oil and Gas Production in the US• Over 3 billion barrels of crude oil produced in 2016
• ~50% increase since 2011
• Down slightly from 2015
• ~18% of production offshore (was 30% in 2010)
• Texas, North Dakota, California
• Over 28 trillion cubic feet of gas produced in 2016
• ~30% increase since 2009
• ~5% of production offshore
• Texas, Pennsylvania, OklahomaSource: U.S. Energy Information Administration

8/24/2017 U.S. Environmental Protection Agency 5
US Onshore Crude Oil Production
Source: U.S. Energy Information Administration

8/24/2017 U.S. Environmental Protection Agency 6
US Onshore Natural Gas Production
Source: U.S. Energy Information Administration

8/24/2017 U.S. Environmental Protection Agency 7
Natural Gas, NGLs, Condensate, Oil
• Natural Gas (C1 – primarily Methane)
• Natural Gas Liquids (C2 – C4)
• Ethane, Propane, Butane
• Extracted at gas processing plants
• “Wet gas”
• Condensate (~C5+)
• Condenses out of gas stream at surface
• Crude Oil (mixture of heavier hydrocarbons)
• Distilled into gasoline, kerosene, diesel, jet fuel

8/24/2017 U.S. Environmental Protection Agency 8
Eagle Ford Shale Oil and Gas Well Map
Source: U.S. Energy Information Administration
8/24/2017 U.S. Environmental Protection Agency 9
8/24/2017 U.S. Environmental Protection Agency 10
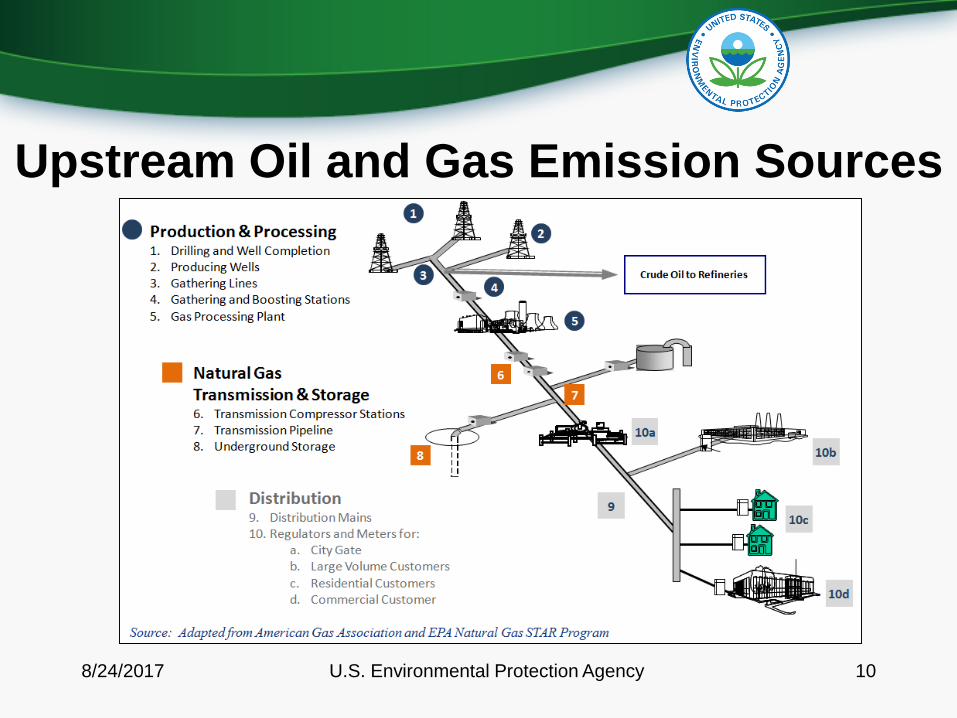
Upstream Oil and Gas Emission Sources
8/24/2017 U.S. Environmental Protection Agency 11
Upstream Oil and Gas Emission Sources
Exploration Sources
• Drilling Rigs
• Hydraulic Fracturing Pumps
• Mud Degassing
• Well Completion Venting
Production Sources (continued)
• Fugitive Leaks
• Gas-Actuated Pneumatic Pumps
• Heaters
• Lateral Compressor Engines
• Liquids Unloading
• Hydrocarbon Liquids Loading
• Pneumatic Devices
• Produced Water Tanks
• Wellhead Compressor Engines
Production Sources
• Artificial Lift Engines
• Associated Gas Venting
• Condensate Tanks
• Crude Oil Tanks
• Dehydrators

8/24/2017 U.S. Environmental Protection Agency 12
Tool Estimation Methodologies
• Area (nonpoint) source methodologies
• Based on point source methodologies averaged
over the population
• Scaled to the county level using activity factors (well
counts, oil production, gas production)
• Refer to “2014 Nonpoint Oil and Gas Emission
Estimation Tool Version 2.2” (June, 2017) for details

8/24/2017 U.S. Environmental Protection Agency 13
Exploration - Drilling Rigs
• Used to drill wellbore to
target formation
• 2 primary rig types
• Mechanical
• Diesel-electric
• Powered by large, diesel
engines (~1,000 – 1,500
HP)
• ~2 – 4 weeksEPA photo.
8/24/2017 U.S. Environmental Protection Agency 14
Drilling Rigs
• Emissions based on cumulative feet drilled
• Process characteristics needed to estimate
emissions
• Engine size and type (HP)
• Operating hours (hr/spud)
• Emission factors from EPA's NONROAD model
• Methodology accounts for different types of rig
configurations (mechanical and diesel-electric)
8/24/2017 U.S. Environmental Protection Agency 15
Mud Degassing
• Mud degassing refers to the process of “off-gassing”
of entrained gas in the drilling mud once it is outside
of the wellbore
• Drilling mud used to keep the drill bit cool, carry out
drill cuttings, and maintain wellbore pressure to
prevent formation fluids from entering wellbore
• Emissions based on total drilling days
• Emission factor derived from 1977 EPA report
“Atmospheric Emissions from Offshore Oil and Gas
Development and Production”

8/24/2017 U.S. Environmental Protection Agency 16
Hydraulic Fracturing Pumps
• Emissions based on number of fracture events
• Process characteristics needed to estimate
emissions
• Engine size (HP)
• Number of engines
• Operating hours (hr/event)
• Emission factors from EPA's NONROAD model

8/24/2017 U.S. Environmental Protection Agency 17
Well Completion Venting• Emissions generated as gas is
vented prior to well being brought
into production
• For fractured wells, emissions are
generated as gas entrained in the
flowback fluid is emitted through
open vents at the top of flowback
tanks
• Fractured wells regulated under
NSPS OOOO and OOOOa Example of Green Completion Equipment
(Source: Weatherford)

8/24/2017 U.S. Environmental Protection Agency 18
Well Completion Venting
• Emissions based on number of completion events
• Process characteristics needed to estimate emissions
• Volume of gas released per completion (MCF/event)
• Oil and gas
• Conventional and unconventional
• Gas composition
• Controls
8/24/2017 U.S. Environmental Protection Agency 19
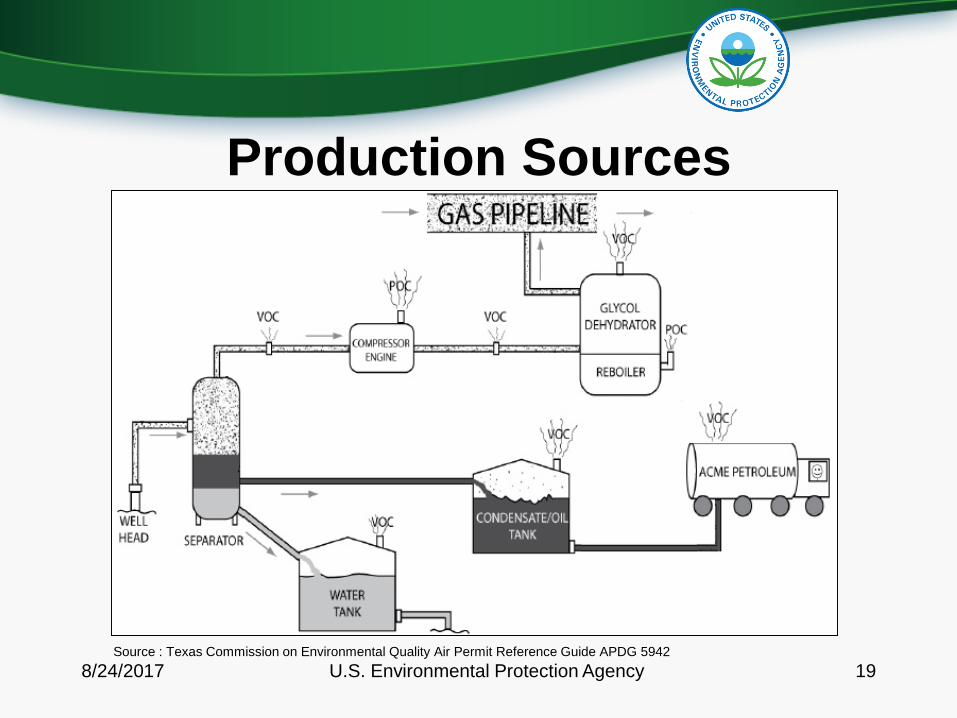
Production Sources
Source : Texas Commission on Environmental Quality Air Permit Reference Guide APDG 5942

8/24/2017 U.S. Environmental Protection Agency 20
Artificial Lift Engines
• “Pumpjack” engines
• Engines used to lift oil out of the well if there is
not enough bottom hole pressure for the oil to
flow to the surface
• Generally use casinghead gas
8/24/2017 U.S. Environmental Protection Agency 21
Artificial Lift Engines
• Emissions based on number of oil wells
• Process characteristics needed to estimate emissions
• Engine size (HP)
• Engine operating schedule (hr/yr)
• Fraction of oil wells with engines
• Emission factors from AP-42
• Electric engines are common, accounted for in
methodology
8/24/2017 U.S. Environmental Protection Agency 22
Associated Gas Venting
• Refers to the practice of venting gas produced at oil
wells where the well is not connected to a gas sales
pipeline
• May be flared (e.g. Bakken Shale)
• Process characteristics needed to estimate emissions
• Quantity of gas vented per barrel of oil production
(MCF/bbl)
• Fraction of gas flared
• Composition of the vented gas
8/24/2017 U.S. Environmental Protection Agency 23
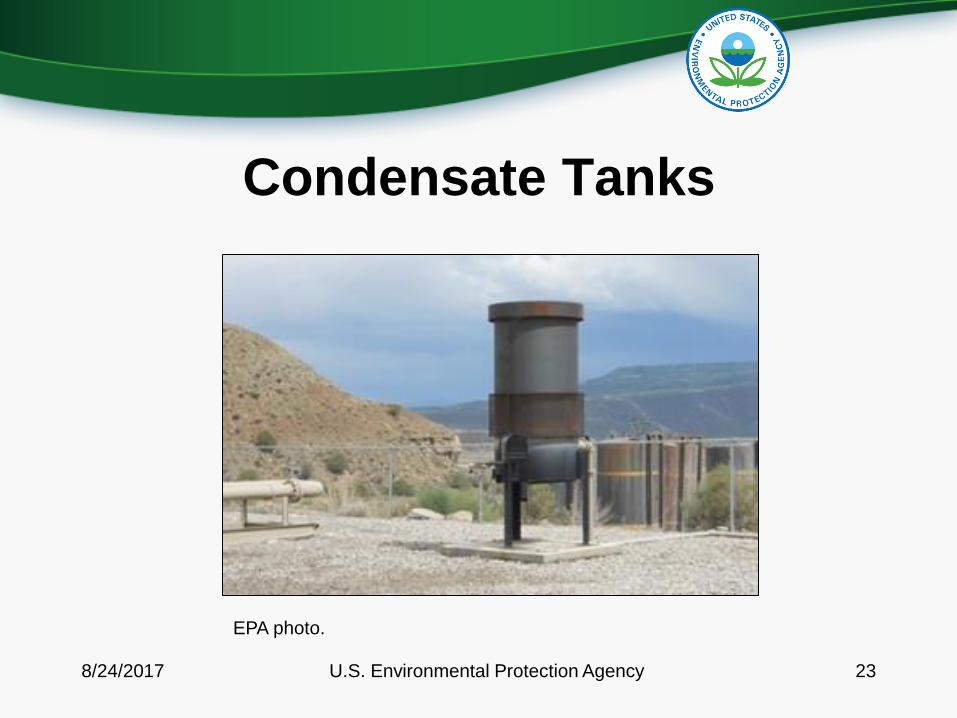
Condensate Tanks
EPA photo.

8/24/2017 U.S. Environmental Protection Agency 24
Condensate Tanks
• Emissions based on condensate production
• Emissions occur from flashing, working, and
breathing losses
• Flashing losses are generally the largest component
and occur when gases entrained in a liquid “flash
off” as the pressure drops
• Emissions per barrel of condensate needed to
estimate total county-level emissions (lb/bbl)
• Regulated under NSPS OOOO and OOOOa

8/24/2017 U.S. Environmental Protection Agency 25
Crude Oil Tanks
• Used to store crude oil at a well
pad or central tank battery prior to
transfer to a refinery
• Some oil fields pipe oil directly
downstream and do not have
tanks in the field
• Accounted for in Tool
• Largest VOC source as calculated
by the ToolPermian Basin Tank Battery
Source: Google Earth

8/24/2017 U.S. Environmental Protection Agency 26
Crude Oil Tanks
• Emissions based on oil production
• Emissions occur from flashing, working, and
breathing losses
• Emissions per barrel of crude oil needed to estimate
total county-level emissions (lb/bbl)
• Regulated under NSPS OOOO and OOOOa
8/24/2017 U.S. Environmental Protection Agency 27
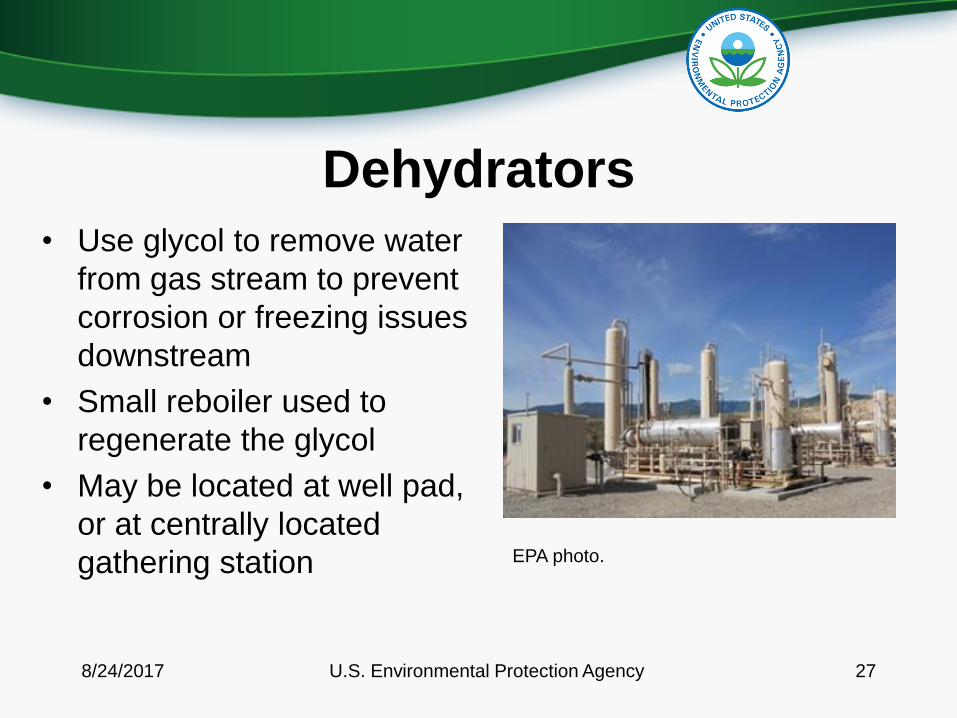
Dehydrators
• Use glycol to remove water
from gas stream to prevent
corrosion or freezing issues
downstream
• Small reboiler used to
regenerate the glycol
• May be located at well pad,
or at centrally located
gathering station EPA photo.

8/24/2017 U.S. Environmental Protection Agency 28
Dehydrators
• Emissions generated from the still vent and the
reboiler
• Emissions from the still vent based on gas production
• Emissions per throughput (lb/MMSCF)
• Emissions from the reboiler based on gas well count
• Number of dehydrators per well
• Reboiler size (MMBtu/hr) and operating schedule
(hr/yr)
• NESHAP HH and HHH may require controls

8/24/2017 U.S. Environmental Protection Agency 29
Fugitive Leaks
• Emissions of gas that
escape through well site
components such as
connectors, flanges, and
valves
• Source category only covers
components located at the
well pad
• Regulated under NSPS
OOOOa
Source : Texas Commission on Environmental
Quality Air Permit Reference Guide APDG 5942

8/24/2017 U.S. Environmental Protection Agency 30
Fugitive Leaks
• Emissions based on well count
• Process characteristics needed to estimate emissions
• Counts of fugitive components by type per well
• Operating schedule (hr/yr)
• Composition of leaked gas
• Emission factors from “Protocol for Equipment Leak
Emission Estimates” (EPA, 1995)

8/24/2017 U.S. Environmental Protection Agency 31
Gas-Actuated Pneumatic Pumps
• Small gas-driven plunger pumps used to provide
a constant supply of chemicals or lubricants
• Commonly used in sites where electric power is
unavailable
• Gas-actuated pumps vent by design
8/24/2017 U.S. Environmental Protection Agency 32
Gas-Actuated Pneumatic Pumps
• Emissions based on well counts
• Kimray pumps
• Chemical injection pumps (CIP)
• Certain pumps regulated under NSPS OOOOa
• Process characteristics needed to estimate emissions
• Count of pumps per well (oil, gas, CBM)
• Pump vent rate (SCF per throughput or day)
• Composition of vented gas

8/24/2017 U.S. Environmental Protection Agency 33
Heaters• Line heaters - used to
maintain temperatures as
pressure decreases to
prevent formation of
hydrates (Marcellus
Shale)
• Heater treaters – used to
heat oil/water emulsions
to aid in separation
(Bakken Shale, Permian
Basin)
Source : Texas Commission on Environmental
Quality Air Permit Reference Guide APDG 5942
8/24/2017 U.S. Environmental Protection Agency 34
Heaters
• Emissions based on the number of wells
• Heaters used as control devices regulated under
NSPS OOOO and OOOOa
• Process characteristics needed to estimate emissions
• Number of heaters per well
• Heater size (MMBtu/hr)
• Operating schedule (hr/yr)
• H2S content (to estimate SO2)

8/24/2017 U.S. Environmental Protection Agency 35
Lateral Compressor Engines
• Large “line” engines
• May serve ~10 to 100 wells
• Used at gathering or booster stations (mid-stream)
• Natural gas-fired
• Rich-burn or lean-burn
8/24/2017 U.S. Environmental Protection Agency 36
Lateral Compressor Engines
• Emissions based on the number of gas wells
• Compressors regulated under NSPS OOOO and
OOOOa
• Process characteristics needed to estimate emissions
• Number of gas wells served by a lateral engine
• Engine size (HP)
• Operating schedule (hr/yr)
• Control information
8/24/2017 U.S. Environmental Protection Agency 37
Liquids Unloading
• Used to remove accumulation of fluids in the wellbore
• Also known as “well blowdowns”
• May be controlled (flaring or plunger lifts)

8/24/2017 U.S. Environmental Protection Agency 38
Liquids Unloading
• Emissions based on the number of gas wells
• Process characteristics needed to estimate emissions
• Number of unloading events per well
• Volume of vented gas per liquids unloading event
(MCF/event)
• Composition of vented gas
• Control information

8/24/2017 U.S. Environmental Protection Agency 39
Hydrocarbon Liquids Loading
• Emissions generated during
transfer of liquids from
tanks to trucks
• As with storage tank
emissions, where liquids
are piped directly
downstream, no emissions
from this category
• Accounted for in Tool
Source : Texas Commission on Environmental
Quality Air Permit Reference Guide APDG 5942

8/24/2017 U.S. Environmental Protection Agency 40
Hydrocarbon Liquids Loading
• Emissions based on oil and condensate production
• AP-42 loading loss equation used to estimate
emissions
• Tank vapor composition needed to estimate VOC
and HAP emissions

8/24/2017 U.S. Environmental Protection Agency 41
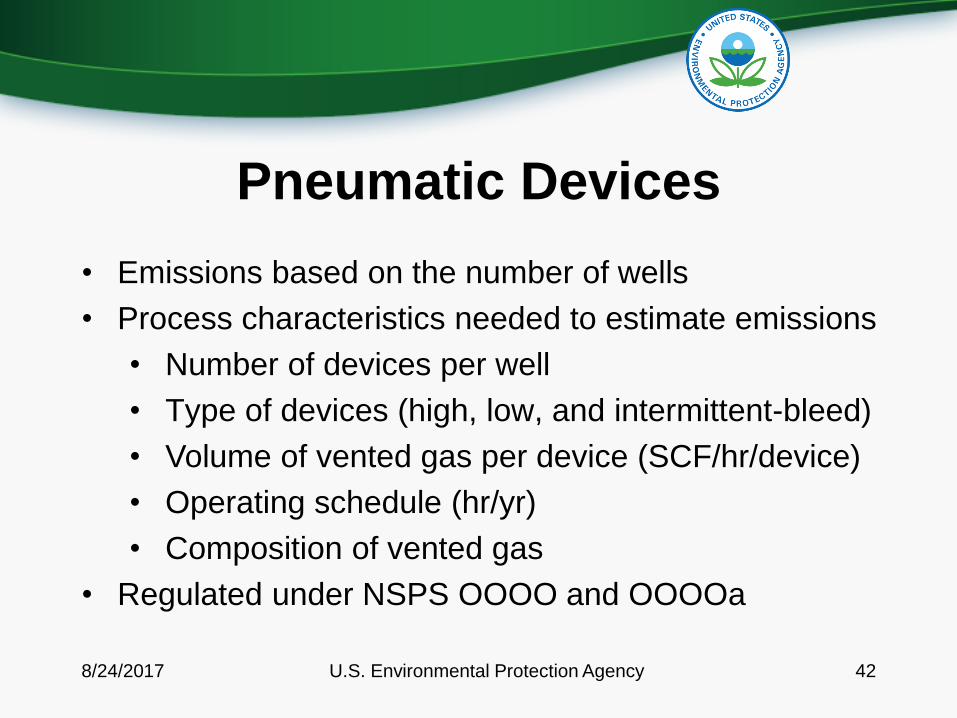
Pneumatic Devices
• Use high-pressure gas to produce mechanical
motion (levers, switches)
• Largest CH4 source under Subpart W and in the
GHG EI (production sector)
• 2nd largest VOC source as calculated by the
Tool
8/24/2017 U.S. Environmental Protection Agency 42
Pneumatic Devices
• Emissions based on the number of wells
• Process characteristics needed to estimate emissions
• Number of devices per well
• Type of devices (high, low, and intermittent-bleed)
• Volume of vented gas per device (SCF/hr/device)
• Operating schedule (hr/yr)
• Composition of vented gas
• Regulated under NSPS OOOO and OOOOa

8/24/2017 U.S. Environmental Protection Agency 43
Produced Water Tanks
• Store water separated at
the wellhead
• Emissions generated from
working and breathing
losses
• Water may be injected
underground to maintain
pressure (waterflooding) or
for disposalSource : Texas Commission on Environmental
Quality Air Permit Reference Guide APDG 5942

8/24/2017 U.S. Environmental Protection Agency 44
Produced Water Tanks
• Emissions based on produced water production
• Emissions occur from working and breathing losses
• Process characteristics needed to estimate
emissions
• Emissions per barrel of production (lb/bbl)
• Fraction of produced water directed to tanks
• Composition of the tank vapors

8/24/2017 U.S. Environmental Protection Agency 45
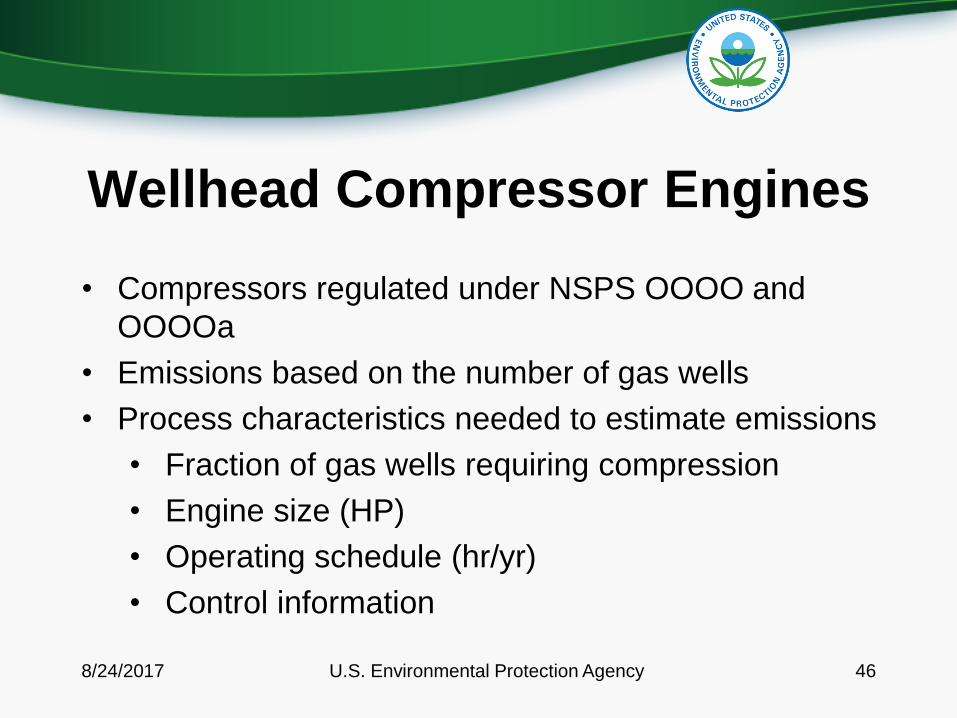
Wellhead Compressor Engines
• Provide energy to move
produced gas downstream
to gathering or boosting
station
• Brought onsite as well
pressure drops
• Utilize produced gas as fuel
• Largest NOx source as
calculated by the Tool Source : Texas Commission on Environmental
Quality Air Permit Reference Guide APDG 5942
8/24/2017 U.S. Environmental Protection Agency 46
Wellhead Compressor Engines
• Compressors regulated under NSPS OOOO and
OOOOa
• Emissions based on the number of gas wells
• Process characteristics needed to estimate emissions
• Fraction of gas wells requiring compression
• Engine size (HP)
• Operating schedule (hr/yr)
• Control information

8/24/2017 U.S. Environmental Protection Agency 47
Data Resources• National Oil & Gas Committee Information
Repository
• Existing Studies
• EPA Natural Gas STAR Program
– https://www.epa.gov/natural-gas-star-
program/natural-gas-star-program
• Industry Surveys
• State Permitting/Inventory Data

8/24/2017 U.S. Environmental Protection Agency 48
Existing Studies
• National Oil & Gas Committee Information Repository
– http://vibe.cira.colostate.edu/ogec/home.htm
• Texas Commission on Environmental Quality (TCEQ)
– https://www.tceq.texas.gov/airquality/airmod/project/pj_repor
t_ei.html
• Western Regional Air Partnership (WRAP)
– https://www.wrapair2.org/emissions.aspx

8/24/2017 U.S. Environmental Protection Agency 49
Industry Surveys
• Send directly to industry, focused or broad
• Recent Industry Surveys/Examples
– CenSARA
– TCEQ
– WRAP

8/24/2017 U.S. Environmental Protection Agency 50
State Permitting/Inventory Data
• Permit Applications
• Annual Emissions Inventory Submittals
• Dehydrator Simulation Software
– Gas Research Institute (GRI) GLYCalc Model
– ProMax®, Aspen HYSYS®, etc.
• Storage Tank Simulation Software
– American Petroleum Institute (API) E&P TANKS
– ProMax®, Aspen HYSYS®, etc.
8/24/2017 U.S. Environmental Protection Agency 51
State Permitting/Inventory Data
• EPA (Cindy Beeler) Presentation
– GRI-GLYCalc and E&P TANK Example Applications
– http://vibe.cira.colostate.edu/ogec/docs/meetings/2015-03-
12/NationalOGEmissionWorkGroup_031215_GLYCalc_EPT
ank4.pdf
• Data may be used to develop “nonpoint” factors
– GRI-GLYCalc - fugitive gas composition and dehydrator
emission factors
– E&P TANK – VOC and HAP emission factors

8/24/2017 U.S. Environmental Protection Agency 52
GRI-GLYCalc Gas Composition

8/24/2017 U.S. Environmental Protection Agency 53
GRI-GLYCalc Gas Composition

8/24/2017 U.S. Environmental Protection Agency 54
GRI-GLYCalc Dehydrator Emissions

8/24/2017 U.S. Environmental Protection Agency 55
E&P TANKS

8/24/2017 U.S. Environmental Protection Agency 56
BREAK

NATIONAL EMISSIONS INVENTORY (NEI)
The full NEI is on a 3-yr cycle (e.g. 2011, 2014, 2017)
Point sources (87,000 facilities)
Nonpoint and mobile sources (county-process)
Fires (daily/point)
Biogenic soil and vegetation (county)
States, locals, and tribes are required to submit CO, SOx, NOx, VOC, PM10, PM2.5, NH3,and Lead.
Basis is National Ambient Air Quality Standards (NAAQS) parts of the Clean Air Act
Use CAA-based emissions thresholds for “point”. States can go lower.
Hazardous Air Pollutants (HAPs) and GHGs can also be voluntarily submitted
EPA augments the data to make HAPs more complete
57

ROLE OF STATES VS. EPAStates are responsible for the emissions estimates
SLTs can choose to accept EPA estimates; however, states choose method to apply
EPA methods are assumptions about activity and emissions rates that can be improved with local understanding
In the absence of SLT data, EPA still has to create a complete inventory.
58
2008 NEI NP oil and gas 2011 NEI NP oil and gas

8/24/2017 U.S. ENVIRONMENTAL PROTECTION AGENCY 59
•
•
• E
•

ALIGNING THE INVENTORIES
NEI covers criteria pollutants and their precursors and HAPs
Office of Atmospheric Program’s EI covers GHGs
Two offices are working to align the inventories
Methodologies
Equipment counts
Activity data
Emission factors
8/24/2017 U.S. ENVIRONMENTAL PROTECTION AGENCY 60
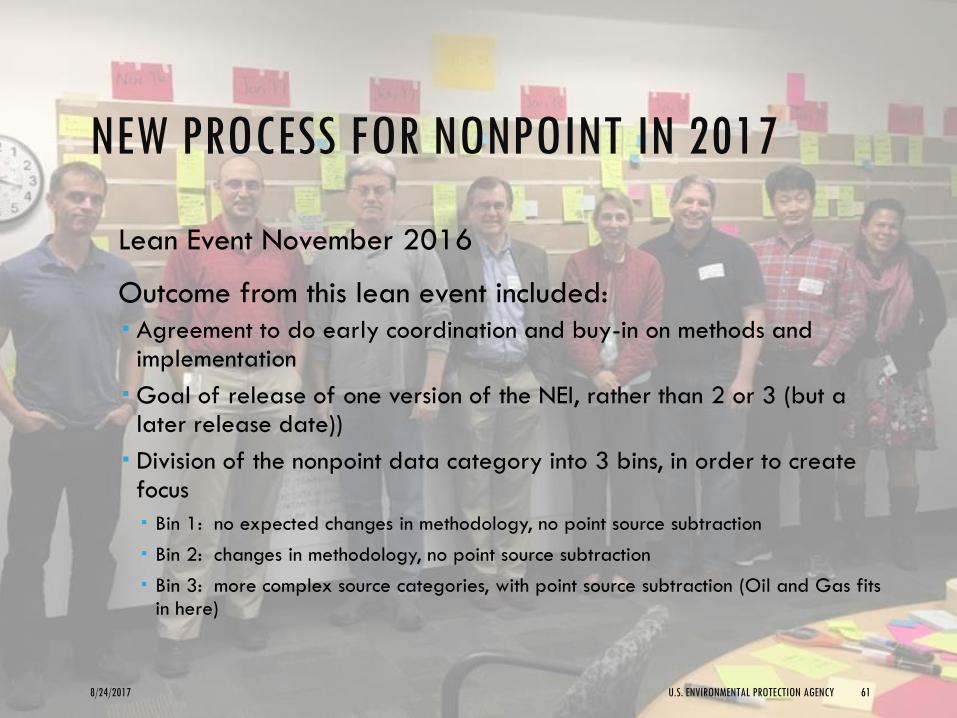
NEW PROCESS FOR NONPOINT IN 2017
Lean Event November 2016
Outcome from this lean event included:
Agreement to do early coordination and buy-in on methods and implementation
Goal of release of one version of the NEI, rather than 2 or 3 (but a later release date))
Division of the nonpoint data category into 3 bins, in order to create focus
Bin 1: no expected changes in methodology, no point source subtraction
Bin 2: changes in methodology, no point source subtraction
Bin 3: more complex source categories, with point source subtraction (Oil and Gas fits in here)
8/24/2017 U.S. ENVIRONMENTAL PROTECTION AGENCY 61
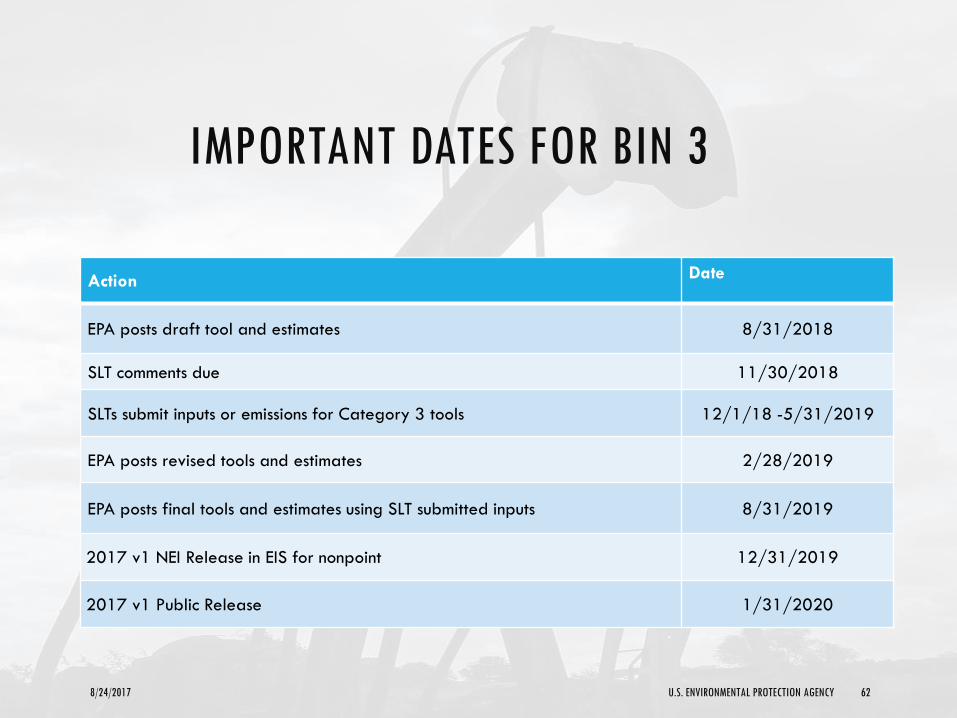
IMPORTANT DATES FOR BIN 3
8/24/2017 U.S. ENVIRONMENTAL PROTECTION AGENCY 62
Action Date
EPA posts draft tool and estimates 8/31/2018
SLT comments due 11/30/2018
SLTs submit inputs or emissions for Category 3 tools 12/1/18 -5/31/2019
EPA posts revised tools and estimates 2/28/2019
EPA posts final tools and estimates using SLT submitted inputs 8/31/2019
2017 v1 NEI Release in EIS for nonpoint 12/31/2019
2017 v1 Public Release 1/31/2020

201920182017
OIL AND GAS 2017 NEI TIMELINE
63
New Categories and
Methodologies, GHGRP Data for
some sources
QA, Feedback,
& Comment
2017 NEI
Pre-release for Training
EPA Updates to Tool
New HPDI Pull in
Conjunction with OAP
Release Draft Tool
August
Release Final Tool
Submit Oil and Gas
Emissions to NEI
State Updates to Tool
Feedback
EPA Review of new data (e.g. GHGRP) for updates to methods and emission factors for additional sources in conjunction with OAP
Submit Oil and Gas Inputs to
NEI
AugustAugust November AugustMay

THE OUTPUT IS ONLY AS GOOD AS THE INPUT!
Review the inputs for accuracy for your state.
Gather process characterization data
Contact oil and gas commission in your state
Review permit data to see if equipment counts are accurate
Do your own survey
Talk to your RPO or neighboring states
START NOW!
8/24/2017 U.S. ENVIRONMENTAL PROTECTION AGENCY 64

2017 NEI PLANS (BUDGET RELIANT)
No planned updates to the database structure for the 2017 Tool (re-engineered for the 2014 NEI).
• New categories and methodologies
• Add CBM Dewatering Pumps category
• Abandoned wells • EPA/OAR/OAP currently developing draft estimates for abandoned wells for methane
• For GHG EI, this may add up to millions of metric tons of methane
• EIAG is working to adapt this methodology for the NEI to estimate VOC and speciated HAPs
• Disaggregate selected emissions algorithms that combine multiple processes into a single SCC (e.g., dehydrators) to individual components (dehydrator, flare, and reboiler)
8/24/2017 U.S. ENVIRONMENTAL PROTECTION AGENCY 65
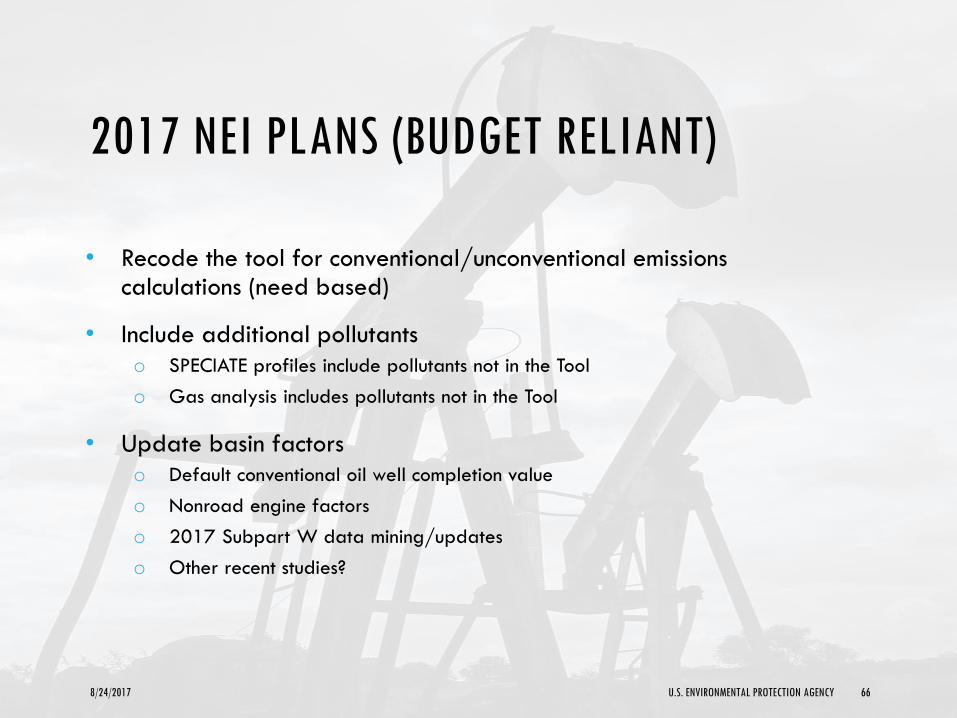
2017 NEI PLANS (BUDGET RELIANT)
• Recode the tool for conventional/unconventional emissions calculations (need based)
• Include additional pollutants
o SPECIATE profiles include pollutants not in the Tool
o Gas analysis includes pollutants not in the Tool
• Update basin factors
o Default conventional oil well completion value
o Nonroad engine factors
o 2017 Subpart W data mining/updates
o Other recent studies?
8/24/2017 U.S. ENVIRONMENTAL PROTECTION AGENCY 66

2017 NEI PLANS (BUDGET RELIANT)
8/24/2017 U.S. ENVIRONMENTAL PROTECTION AGENCY 67
• Add tribal reservation layer to activity data (consider also basin
factor data)
• Add new control technologies:
• Vapor recovery units (VRU)
• Electrified engines
• Pull HPDI data (Fall 2018)
• Consider updated methodology for oil/condensate distinction
(EIA-based?)
• Final 2017 Tool (August 2019)
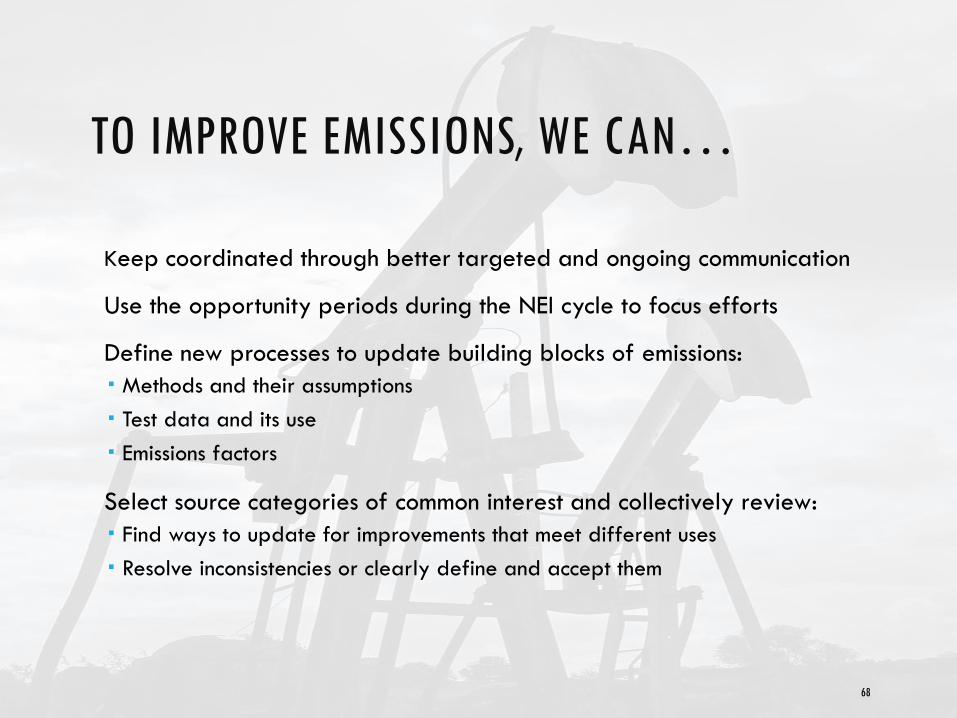
TO IMPROVE EMISSIONS, WE CAN…
Keep coordinated through better targeted and ongoing communication
Use the opportunity periods during the NEI cycle to focus efforts
Define new processes to update building blocks of emissions:
Methods and their assumptions
Test data and its use
Emissions factors
Select source categories of common interest and collectively review:
Find ways to update for improvements that meet different uses
Resolve inconsistencies or clearly define and accept them
68

8/24/2017 U.S. Environmental Protection Agency 69
BREAK

8/24/2017 U.S. Environmental Protection Agency 70
Acknowledgements
• National Oil and Gas Committee
• ERG Staff
o Bebhinn Do
o Stacie Enoch
o Karla Faught
o Steve Mendenhall
o Stephen Treimel
o Jody Tisano

8/24/2017 U.S. Environmental Protection Agency 71
Overview of the Presentation
• Introduction/Timeline of the Tool Development
• 2014 NEI Oil and Gas Tool Coverage
• Walking through the Tool
• Case Studies using the 2014 Tool
• Development Plans for the 2017 NEI Oil and Gas
Tool
8/24/2017 U.S. Environmental Protection Agency 72
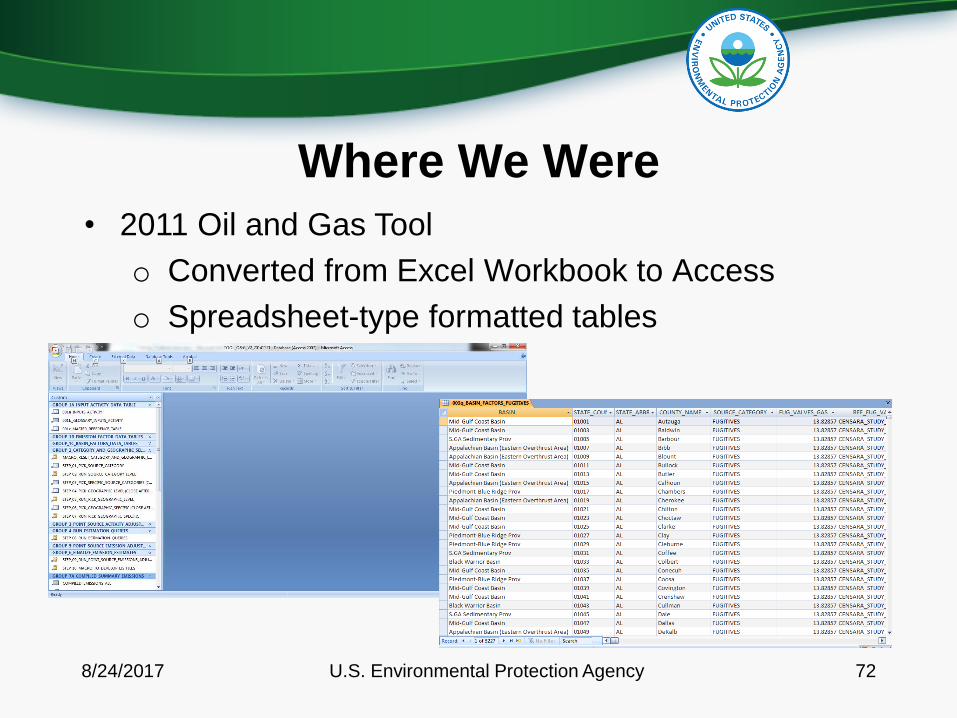
Where We Were
• 2011 Oil and Gas Tool
o Converted from Excel Workbook to Access
o Spreadsheet-type formatted tables

8/24/2017 U.S. Environmental Protection Agency 73
Where We Are
• 2014 Oil and Gas Tool
o Re-engineered to enhance user experience
o Dashboard, buttons, import/export procedures

8/24/2017 U.S. Environmental Protection Agency 74
2014 Tool Coverage – Source Categories
• Exploration Sources:
o Drilling
o Mud Degassing
o Hydraulic
Fracturing
o Well Completions
8/24/2017 U.S. Environmental Protection Agency 75
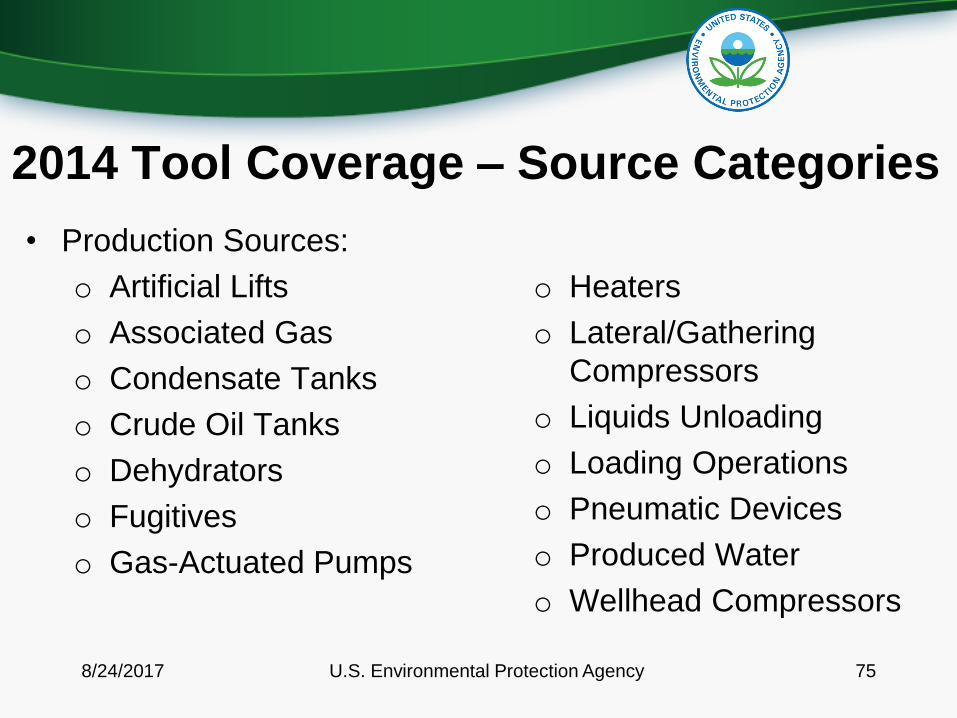
2014 Tool Coverage – Source Categories
• Production Sources:
o Artificial Lifts
o Associated Gas
o Condensate Tanks
o Crude Oil Tanks
o Dehydrators
o Fugitives
o Gas-Actuated Pumps
o Heaters
o Lateral/Gathering
Compressors
o Liquids Unloading
o Loading Operations
o Pneumatic Devices
o Produced Water
o Wellhead Compressors
8/24/2017 U.S. Environmental Protection Agency 76
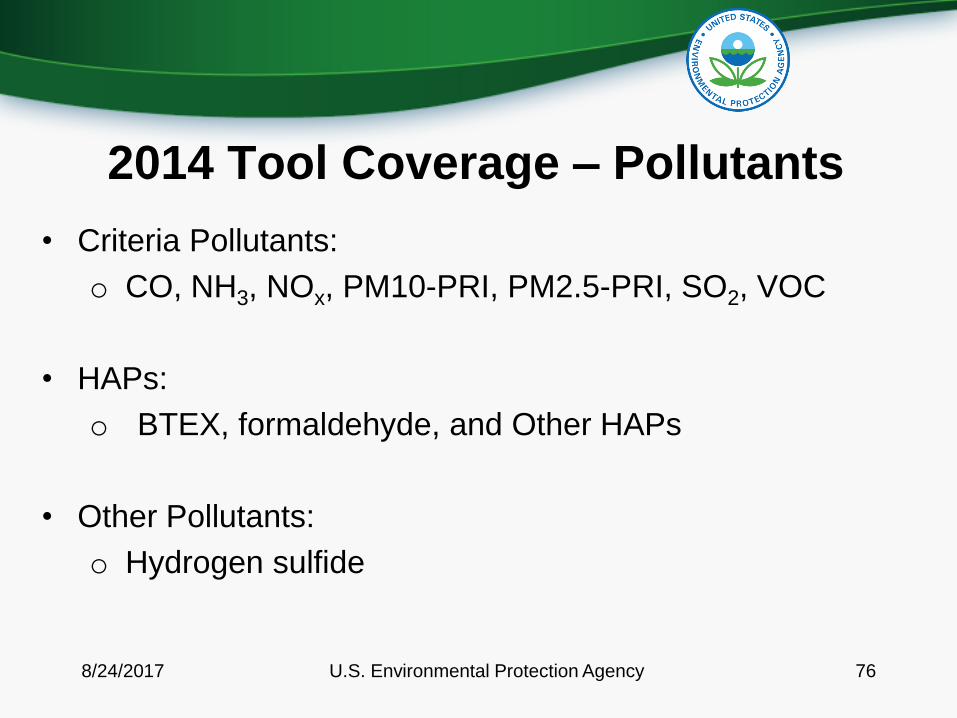
2014 Tool Coverage – Pollutants
• Criteria Pollutants:
o CO, NH3, NOx, PM10-PRI, PM2.5-PRI, SO2, VOC
• HAPs:
o BTEX, formaldehyde, and Other HAPs
• Other Pollutants:
o Hydrogen sulfide

8/24/2017 U.S. Environmental Protection Agency 77
2014 Tool Data Sources
• Methodologies: EPA, CenSARA, and Texas calculation tools
• Activity Data: HPDI, state-provided activity data, state OGC
databases, EIA, GHGRP, RigData
• Emission Factors: mostly EPA AP-42; API, Climate Registry,
GHGRP
• Basin Factors: EPA; CenSARA; state feedback; SPECIATE

8/24/2017 U.S. Environmental Protection Agency 78
2014 Tool Results
• Source category coverage: 54 SCCs from 18 source
categories
• Pollutant coverage: 50 pollutants
• Geographic coverage: 34 states, 1157 counties, 65 basins
• Emission records generated:
o From Tool = 939,493
o To EIS = 749,096
8/24/2017 U.S. Environmental Protection Agency 79
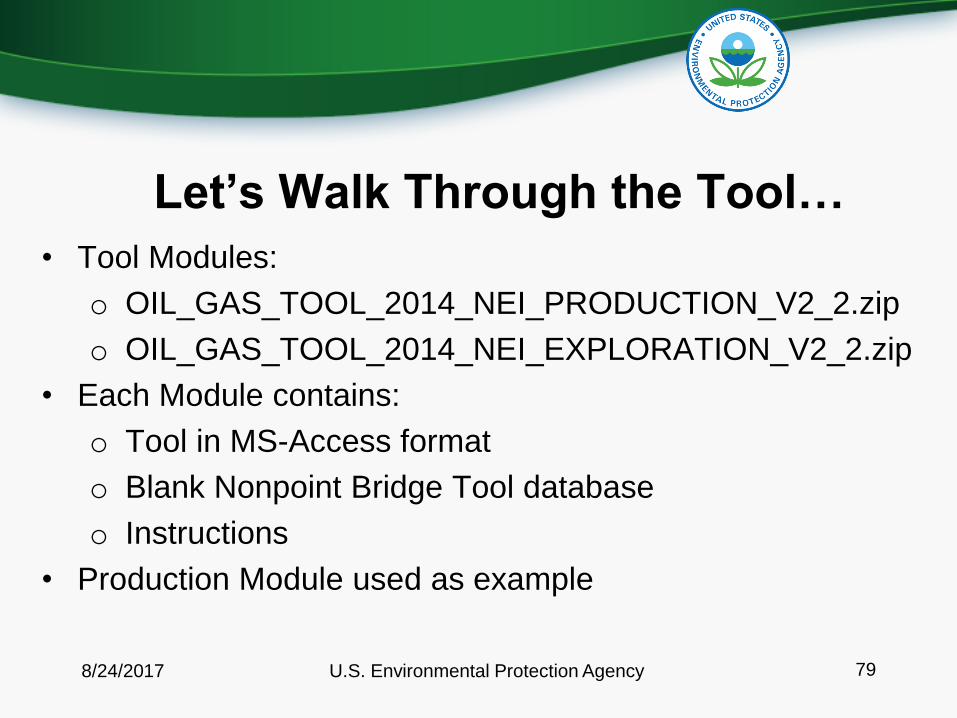
Let’s Walk Through the Tool…
• Tool Modules:
o OIL_GAS_TOOL_2014_NEI_PRODUCTION_V2_2.zip
o OIL_GAS_TOOL_2014_NEI_EXPLORATION_V2_2.zip
• Each Module contains:
o Tool in MS-Access format
o Blank Nonpoint Bridge Tool database
o Instructions
• Production Module used as example

8/24/2017 U.S. Environmental Protection Agency 80
Production Sources – Getting Started
• If using the Tool for the first time from unzipping, then you will
need to “Enable Content”

8/24/2017 U.S. Environmental Protection Agency 81
Production Sources – Linking to EIS
Staging Tables
• Click on the “LINK TO EIS STAGING TABLES” button, and a
pop-up box will appear. Follow the instructions to link in the
EIS Staging tables in the “nonpoint_bridge_tool.accdb”
database (see figure below). If successfully linked, 11 tables
will be linked.
8/24/2017 U.S. Environmental Protection Agency 82
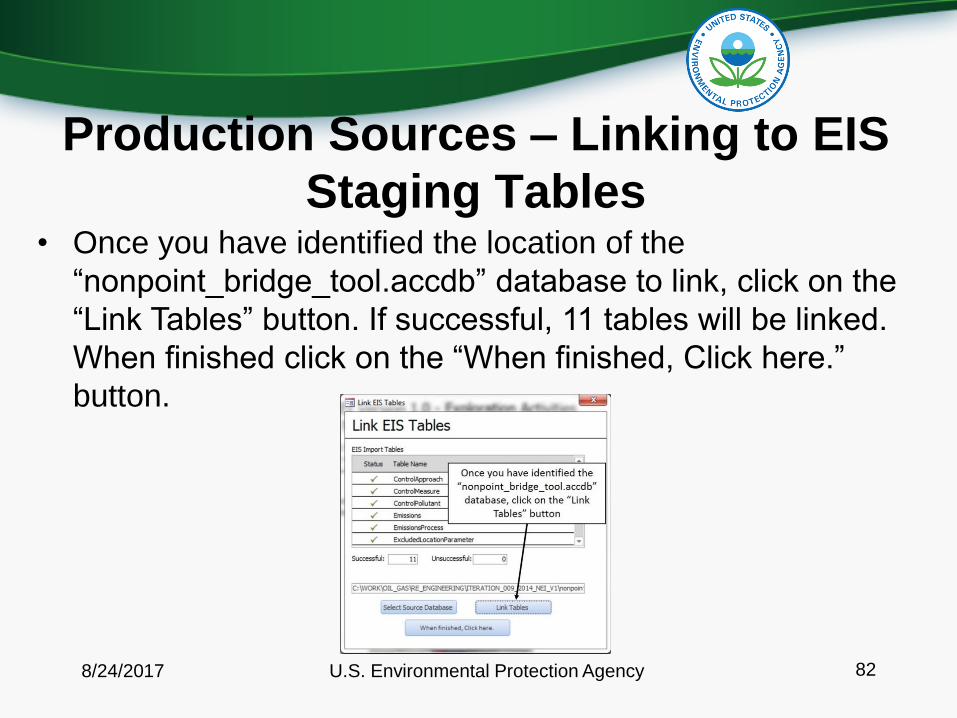
• Once you have identified the location of the
“nonpoint_bridge_tool.accdb” database to link, click on the
“Link Tables” button. If successful, 11 tables will be linked.
When finished click on the “When finished, Click here.”
button.
Production Sources – Linking to EIS
Staging Tables

8/24/2017 U.S. Environmental Protection Agency 83
• Select the geographic-level of the emissions inventory based
on interest. Most Users will select the “STATE” view. When
finished, click the “When finished, click here to complete this
step.” button. A message box will appear instructing the User
to proceed to Step 2.
Production Sources – Step 1
8/24/2017 U.S. Environmental Protection Agency 84
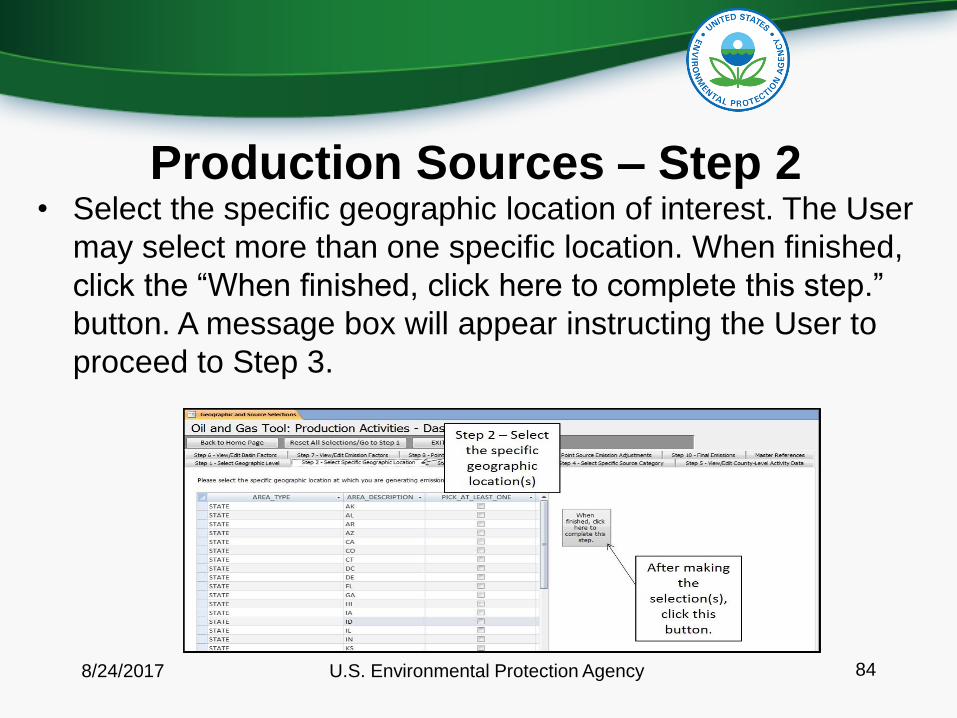
• Select the specific geographic location of interest. The User
may select more than one specific location. When finished,
click the “When finished, click here to complete this step.”
button. A message box will appear instructing the User to
proceed to Step 3.
Production Sources – Step 2

8/24/2017 U.S. Environmental Protection Agency 85
• The User may generate emission estimates for all oil and gas
production source categories or individually select source
categories. When finished, click the “When finished, click
here to complete this step.” button. A message box will
appear instructing the User to proceed to Step 4.
Production Sources – Step 3
8/24/2017 U.S. Environmental Protection Agency 86
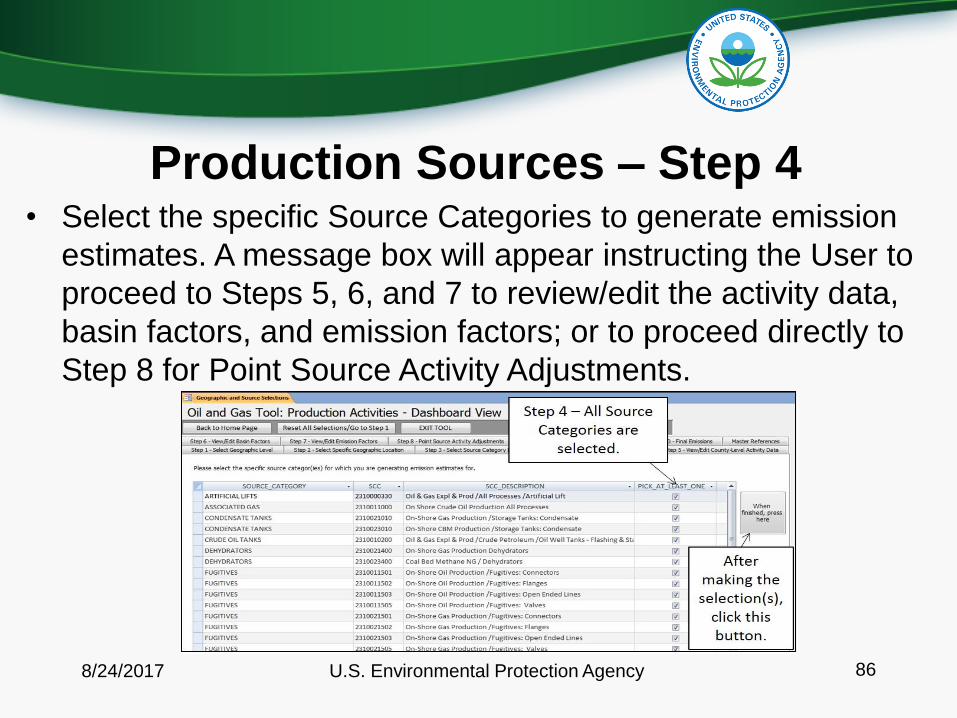
• Select the specific Source Categories to generate emission
estimates. A message box will appear instructing the User to
proceed to Steps 5, 6, and 7 to review/edit the activity data,
basin factors, and emission factors; or to proceed directly to
Step 8 for Point Source Activity Adjustments.
Production Sources – Step 4
8/24/2017 U.S. Environmental Protection Agency 87
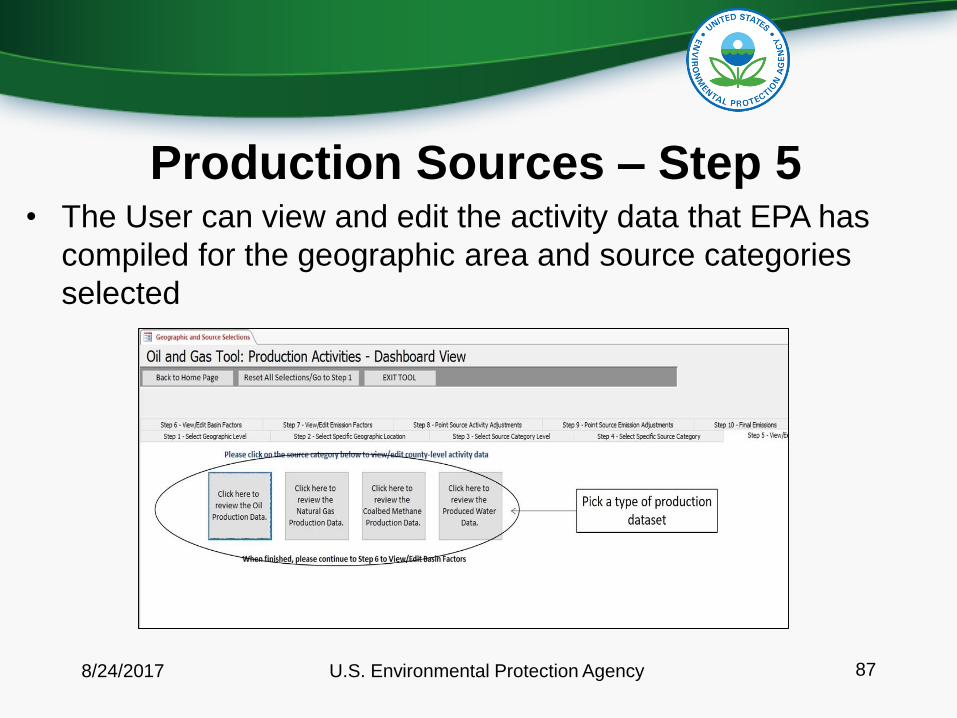
• The User can view and edit the activity data that EPA has
compiled for the geographic area and source categories
selected
Production Sources – Step 5
8/24/2017 U.S. Environmental Protection Agency 88
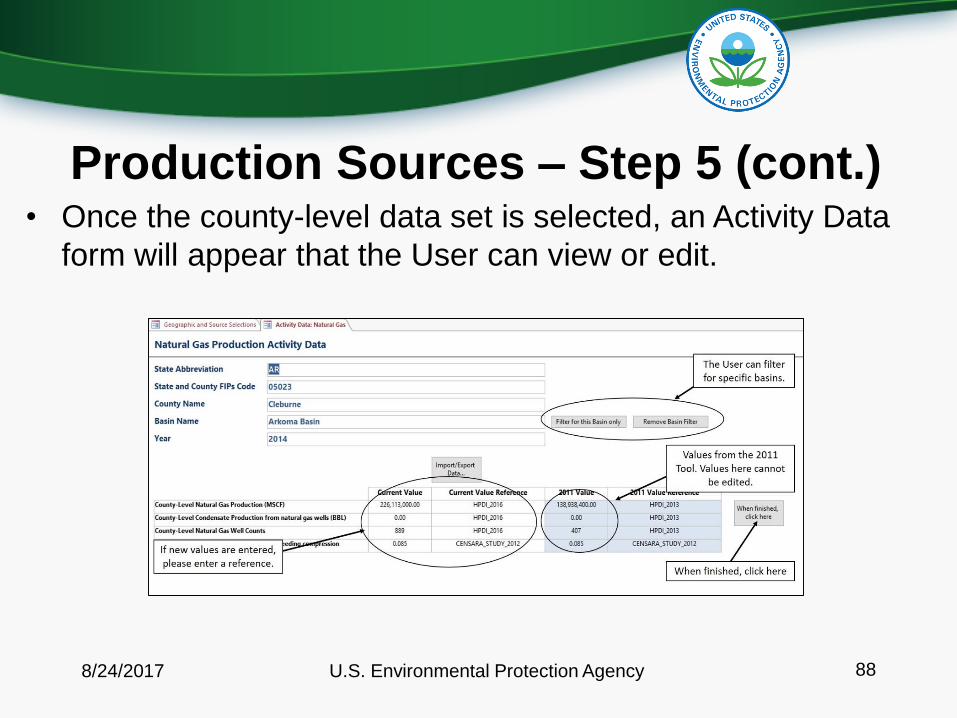
• Once the county-level data set is selected, an Activity Data
form will appear that the User can view or edit.
Production Sources – Step 5 (cont.)

8/24/2017 U.S. Environmental Protection Agency 89
• The User may also edit activity data in MS-Excel by using the
“Import/Export Data…” button.
Production Sources – Step 5 (cont.)

8/24/2017 U.S. Environmental Protection Agency 90
• If the user elects to edit activity data in MS-Excel, after
clicking the button, the data is then exported into MS-Excel
as shown below.
Production Sources – Step 5 (cont.)

8/24/2017 U.S. Environmental Protection Agency 91
• A MS-Excel workbook will open when finished exporting. It is
required that the User save this file to the hard drive for later
upload. In the Excel file, the User can only edit the yellow
shaded cells. When completed, simply save the file.
Production Sources – Step 5 (cont.)

8/24/2017 U.S. Environmental Protection Agency 92
• The User will need to go back to the Tool and click on the
“Import/Export Data…” button to initiate importing the edited
data file. After clicking, the Import/Export form will appear.
Production Sources – Step 5 (cont.)
8/24/2017 U.S. Environmental Protection Agency 93
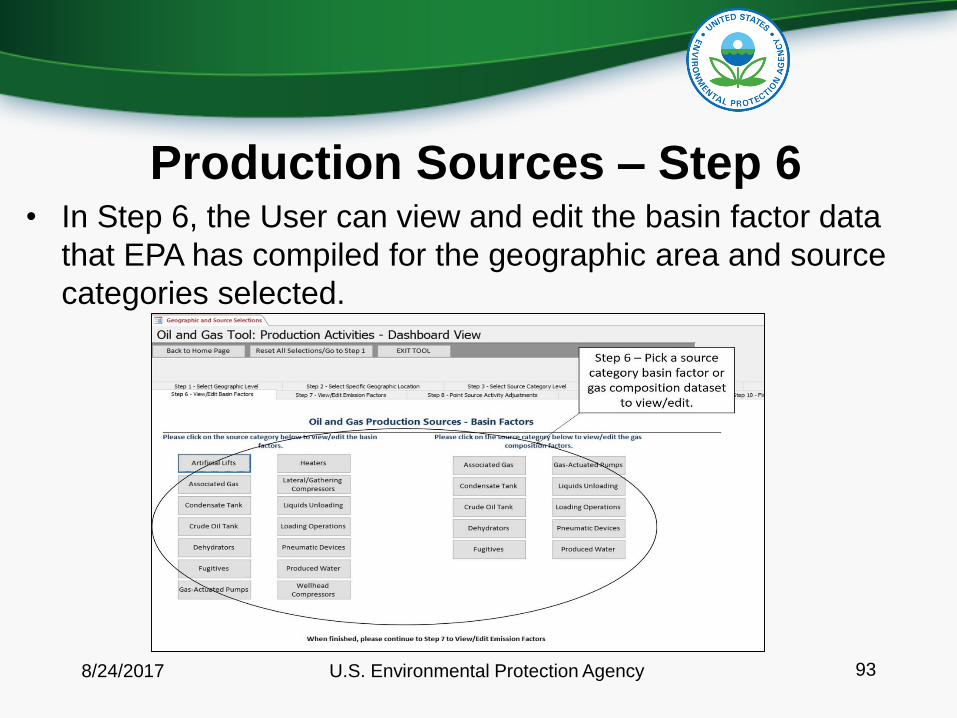
• In Step 6, the User can view and edit the basin factor data
that EPA has compiled for the geographic area and source
categories selected.
Production Sources – Step 6

8/24/2017 U.S. Environmental Protection Agency 94
• In Step 6, the User can view/edit the basin factor data. If the
User updates values for one county in a basin, then all other
counties in the basin and state can be updated by clicking on
the “Click to apply these values to all other counties in the
same basin for the state.” button.
Production Sources – Step 6 (cont.)

8/24/2017 U.S. Environmental Protection Agency 95
• In Step 7, the User can view or edit the emission factors that
are used to generate the emission estimates for the source
categories selected.
Production Sources – Step 7
8/24/2017 U.S. Environmental Protection Agency 96
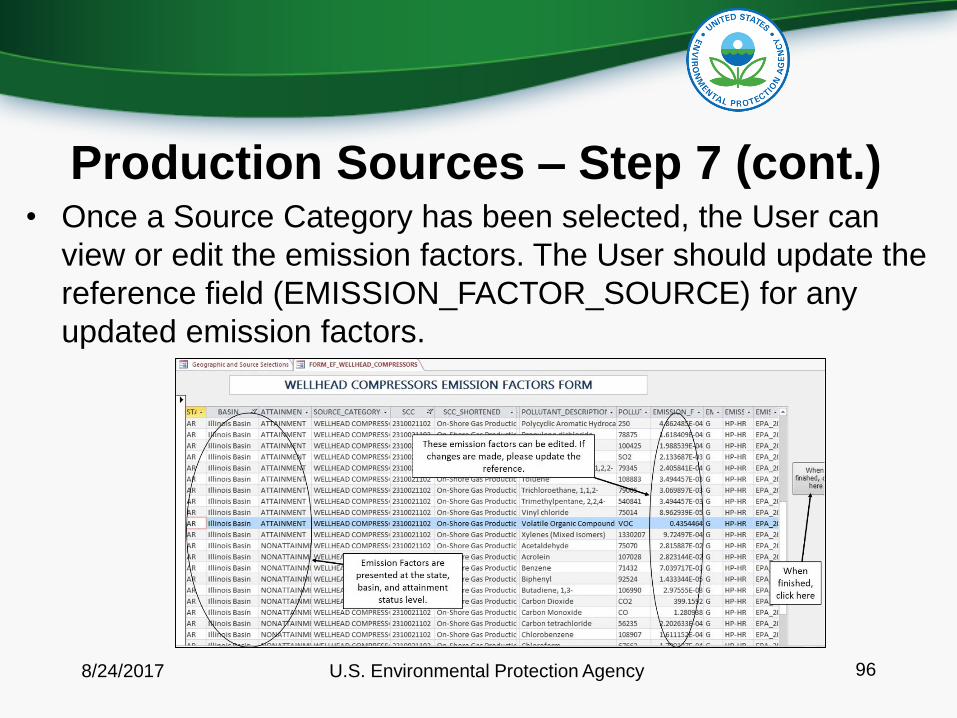
• Once a Source Category has been selected, the User can
view or edit the emission factors. The User should update the
reference field (EMISSION_FACTOR_SOURCE) for any
updated emission factors.
Production Sources – Step 7 (cont.)
8/24/2017 U.S. Environmental Protection Agency 97
• In Step 8, the User may account for emissions that are to be
reported to the point sources emissions inventory.
• Activity adjustments are preferred
o Well counts
o Liquids production
o Etc.
• Emissions adjustments are also an option
o NOx
o VOC
o Etc.
Production Sources – Step 8
8/24/2017 U.S. Environmental Protection Agency 98
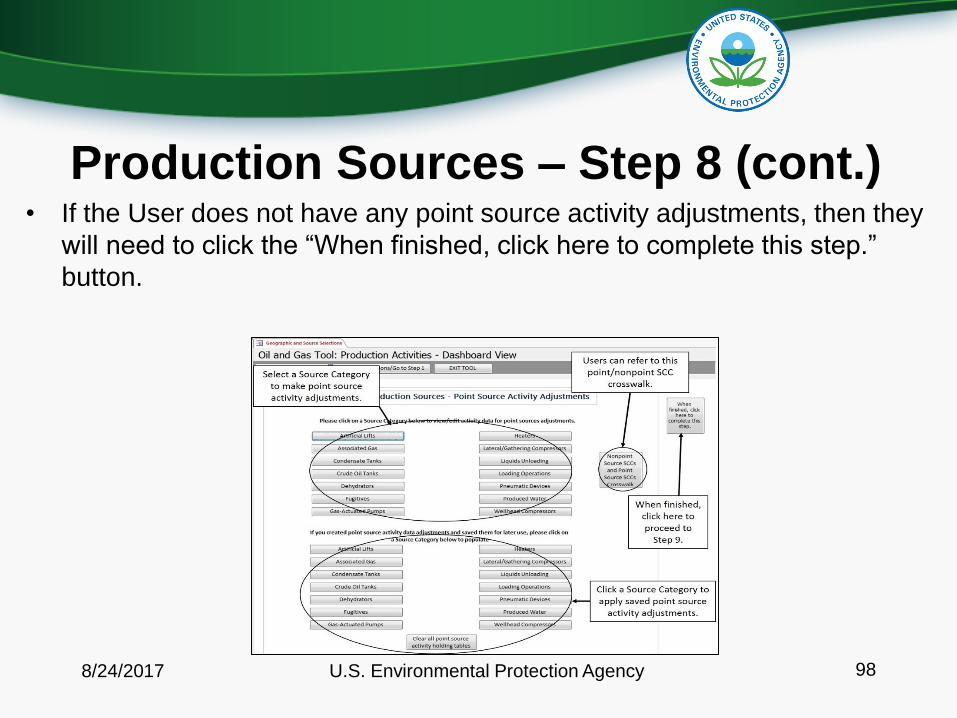
• If the User does not have any point source activity adjustments, then they
will need to click the “When finished, click here to complete this step.”
button.
Production Sources – Step 8 (cont.)

8/24/2017 U.S. Environmental Protection Agency 99
• Point source activity adjustments are preferred over point
source emission adjustments. Additionally, Users should pay
careful attention to ensure that the point source activity data
is entered in the same units as the nonpoint activity data
(e.g., MMBBL vs. MBBL).
Production Sources – Step 8 (cont.)

8/24/2017 U.S. Environmental Protection Agency 100
• In Step 9, the User can make point source emission
adjustments directly in the emission tables. Select a Source
Category to open. If a User has no point source emissions
adjustments, they may click on the “When finished, click here
to complete this step” button.
Production Sources – Step 9
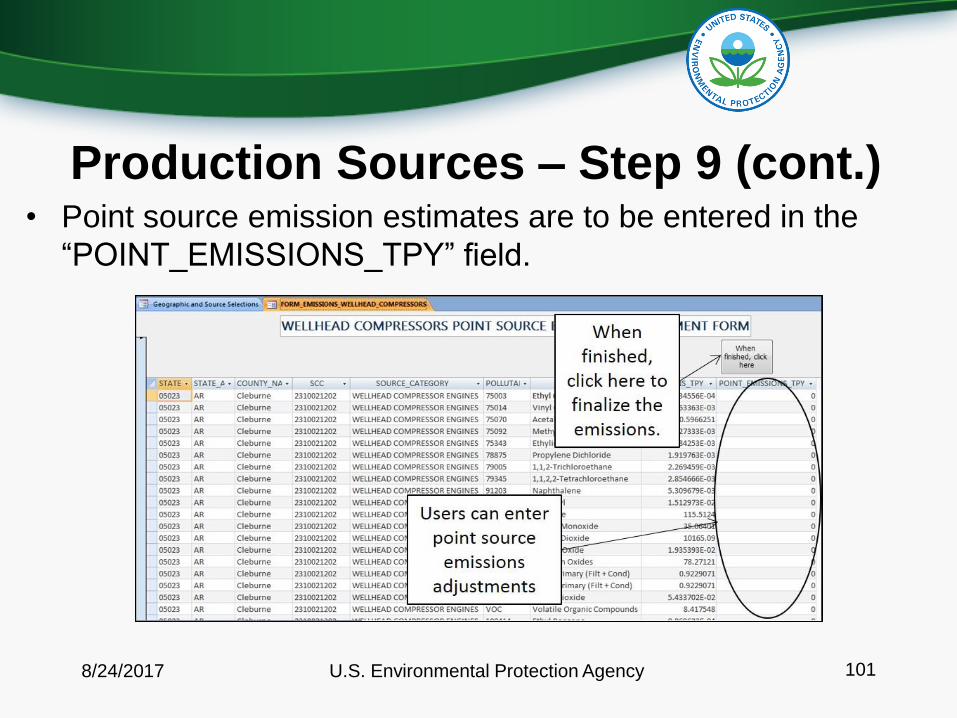
8/24/2017 U.S. Environmental Protection Agency 101
• Point source emission estimates are to be entered in the
“POINT_EMISSIONS_TPY” field.
Production Sources – Step 9 (cont.)

8/24/2017 U.S. Environmental Protection Agency 102
• In Step 10, the User can review the final emissions; update
county-level activity data, emission factors, and/or basin
factors they provided in Steps 5 through 7; or generate the
Emission Inventory System (EIS) data tables.
Production Sources – Step 10

8/24/2017 U.S. Environmental Protection Agency 103
• Point source activity and/or emissions adjustments can also
be saved within the Tool for future use.
Production Sources – Step 10 (cont.)
8/24/2017 U.S. Environmental Protection Agency 104
• In the EIS Staging Tables, the following tables are populated:
o ControlApproach
o ControlMeasure
o ControlPollutant
o Emissions
o EmissionsProcess
o Location
o ReportingPeriod
• The Exploration Module runs the same way as the
Production Module.
Additional Notes

8/24/2017 U.S. Environmental Protection Agency 105
• If the User wishes to reset the tool, and regenerate the
emissions, the following steps are recommended:
o Click on the “Reset All Selections/Go to Step 1” button at
the top of the Dashboard.
o Compact and Repair the database.
Additional Notes (cont.)

8/24/2017 U.S. Environmental Protection Agency 106
• References cited for the original data in the Tool are found in
the ”Master References” tab.
Additional Notes (cont.)
8/24/2017 U.S. Environmental Protection Agency 107
Case Studies
8/24/2017 U.S. Environmental Protection Agency 108
Case Studies.
(please have both the Production and Exploration modules open)

8/24/2017 U.S. Environmental Protection Agency 109
Case Study #1• The Permian Basin consists of 4 counties in New Mexico
and 62 counties in Texas. In 2014, the basin produced:
o 582,987,082 barrels of oil from 125,421 wells
o 552,747,870 MSCF of natural gas from 24,606 wells
o 121,407 MSCF coalbed methane from 12 wells
Use the Tool to calculate the nonpoint VOC emissions for
crude oil tanks for each state, and the % of total production
sources.

8/24/2017 U.S. Environmental Protection Agency 110
Case Study #2• Based on new permit applications, unconventional drilling
activity is expected to begin in Wake County, NC (FIPS =
37183). Calculate NOx emissions from exploration sources.
100 natural gas wells drilled horizontally; total estimated
feet drilled is 425,000 ft.
85 natural gas wells completed
NCDENR is also wanting to evaluate the impact of limiting
hydraulic fracturing engines to 3.5 g/hp-hr for NOx from the
current factor of 5.831 g/hp-hr for NOx. Calculate the NOx
impact.

8/24/2017 U.S. Environmental Protection Agency 111
Case Study #3• EPA is considering reducing the NOx emission factor for 4-
cycle lean-burn wellhead compressor engines at gas wells
(SCC = 2310021202) to 0.5 g/hp-hr in nonattainment areas
(current factor = 3.07359 g/hp-hr. Using the tool, assess:
Impact of total NOx emissions within nonattainment
counties.
Impact of total NOx emissions within nonattainment
counties for SCC 2310021202
8/24/2017 U.S. Environmental Protection Agency 112
Case Study #4• The state of Oklahoma provides point source emissions in the
NEI for several upstream oil and gas wells. Using the Tool,
calculate benzene emissions from Dehydrators in Alfalfa
County, OK (FIPS = 40003), after making point source activity
adjustments.
Alfalfa County, OK Gas Production = 5,017,381 MSCF from
170 gas wells (No CBM production in Alfalfa County, OK)
Alfalfa County, OK Associated Gas Production =
107,564,300 MSCF from 783 oil wells
Point sources activity = 1,706,326 MSCF from 12 gas wells;
92,718,640 MSCF from 613 oil wells

8/24/2017 U.S. Environmental Protection Agency 113
• What else would you like to see?
• Q&A
Discussion/Q&A